low cost manufacturing and performance evaluation …
TRANSCRIPT

LOW COST MANUFACTURING AND PERFORMANCE EVALUATION
OF SOY-BASED POLYURETHANE/E-GLASS COMPOSITES
THESIS
Presented to the Graduate Council of
Texas State University-San Marcos
in Partial Fulfillment of
the Requirements
for the Degree of
Master of SCIENCE
by
Srujan kumar Konga
San Marcos, Texas
December, 2008

LOW COST MANUFACTURING AND PERFORMANCE EVALUATION
OF SOY-BASED POLYURETHANE/E-GLASS COMPOSITES.
Committee Members Approved:
____________ __________
Jitendra S. Tate, Chair
_________________ _____
Andy H. Batey
________________ _____
Bahram Asiabanpour
Approved:
_____________________
J. Michael Willoughby
Dean of Graduate College

COPYRIGHT
by
Srujan kumar Konga
2008

To my parents,
inspired,
and inspiring.

v
ACKNOWLEDGEMENTS
Several people have been instrumental in shaping this thesis. One such dignitary
is my advisor Prof. Jitendra S. Tate, without whose support this thesis could not have
been completed. I would like to immensely thank him, for his support and
encouragement, which was always there when I needed it. He helped me to build on my
technical, writing and research skills. On the personal side, he did not hesitate to invite
his students to become an extended part of his family. It has been a rewarding experience
to work with him and his research group. I would like to express my deepest thanks to my
committee members, Prof. Andy H. Batey and Prof. Bahram Asiabanpour for guiding and
helping me in every aspect of my thesis.
I would like to express my gratitude to Prof. Jesus Jimenez, Prof. John Massingill,
Pulin Patel, Jesse Hancock, Shane Arabie, Ray Cook, Gus Cantu, Jason Wagner, Dima
and Temi for helping in my thesis.
I cannot end without thanking my family, on whose constant encouragement and
love I have relied throughout my time at Texas State University-San Marcos. I thank my
parents, for their absolute confidence in me. It is to them that I dedicate this work. Finally
I would like to thank God almighty, for this blessed opportunity.
This manuscript was submitted on November 20, 2008.

vi
TABLE OF CONTENTS
Page
ACKNOWLEDGEMENTS ................................................................................................v
LIST OF TABLES ............................................................................................................ ix
LIST OF FIGURES .......................................................................................................... xi
ABSTRACT .................................................................................................................... xiii
CHAPTER
1. INTRODUCTION ...........................................................................................................1
1.1 Overview of Composites....................................................................................1
1.2 Constituent Materials in PMC ...........................................................................2
1.2.1 Matrix ..................................................................................................2
1.2.2 Fibers...................................................................................................4
1.3 Polyurethane ......................................................................................................8
1.3.1 Advantage of PU Composites ..........................................................10
1.3.2 Limitations of PU Composites .........................................................10
1.4 Soy-based polyurethane ...................................................................................11
1.5 Vacuum Assisted Resin Transfer Molding (VARTM) ....................................12
1.6 Objectives of Research ...................................................................................12
2. MANUFACTURING ....................................................................................................15
2.1 Composite manufacturing methods .................................................................15
vii
2.1.1 Wet lay-up method ...........................................................................15
2.1.2 Prepreg method ................................................................................16
2.1.3 Autoclave processing .......................................................................16
2.1.4 Filament winding .............................................................................17
2.1.5 Pultrusion .........................................................................................18
2.1.6 Resin Transfer Molding (RTM) ........................................................19
2.1.7 Vacuum Assisted Resin Transfer Molding (VARTM) .....................20
2.2 Vacuum Assisted Resin Transfer Molding process (VARTM) .......................20
2.3 Material System: .............................................................................................21
2.4 Properties of Polyol .........................................................................................22
2.5 Viscosity study .................................................................................................25
2.6 VARTM of Viscous Resins ............................................................................28
2.7 Room Temperature VARTM ...........................................................................29
2.7.1 Mold Preparation and Vacuum Bagging...........................................29
2.7.2 Formulation and Degassing of Resin ...............................................33
2.7.3 Resin Impregnation and Curing ........................................................35
2.8 High Temperature Processing of VARTM (HVARTM) .................................37
2.9 Overall Fiber Volume Fraction ........................................................................39
2.9.1. Ignition Method ...............................................................................39
2.9.2 Areal Weight Method .......................................................................39
2.9.3 Density Method .................................................................................40
2.10 Discussion .....................................................................................................41
3. PERFORMANCE EVALUATION ..............................................................................43
3.1 Introduction .......................................................................................................43
3.2 Mechanical Testing ..........................................................................................43
3.2.1 Static Tensile Test .............................................................................44

viii
3.2.2 Compression Test ............................................................................45
3.2.3 Flexure Test .....................................................................................47
3.2.4 Inter laminar Shear Strength-ILSS Test (Short-Beam Test) .............48
3.2.5 V-Notch Beam Test (ASTM D 5379/D 5379M-98) ........................50
3.3 Mechanical Test Results .................................................................................52
3.3.1 Tensile Testing and Their Results.....................................................53
3.3.2 Compression Testing and Their Results ...........................................57
3.3.3 Flexure Testing and Their Results ....................................................61
3.3.4 Inter laminar Shear Strength (ILSS) Testing and Their Results .......65
3.3.5 V-Notch Beam Testing and Their Results ........................................67
3.4 Mechanical Properties Comparison: Mfg I cycle I ..........................................68
3.5 Statistical Analysis ...........................................................................................70
3.5.1 ANOVA ............................................................................................70
3.5.2 One-way ANOVA: Compressive Strength versus
Resin types (P, S, and VW) .......................................................................72
3.5.3 One-way ANOVA: Flexure Strength versus
Resin types (P, S, and VW) .......................................................................73
3.5.4 One-way ANOVA: ILSS versus Resin types (P, S, and VW) ..........74
4. CONCLUSIONS...........................................................................................................76
REFERENCES .................................................................................................................82
ix
LIST OF TABLES
Table Page
1.1 Properties of Typical Polymer Matrix Materials ..............................................4
1.2 Properties of Typical Fibers ..............................................................................5
2.1. Properties of Polyols .......................................................................................23
2.2 GPC Results of ‗Lab-prepared‘ Polyol ...........................................................23
2.3 GPC Results of Vikol-1‘ Polyol .....................................................................24
2.4 GPC Results of ‗Soypolyol DB-5‘ Polyol ......................................................25
2.5 Viscosity vs Temperature for ‗Lab-prepared Polyol‘ .....................................26
2.6 Viscosity vs Temperature for ‗Soypolyol DB-5‘ ............................................26
2.7 Formulation of Polyurethane Resin System ...................................................34
2.8 Formulation of Vinyl ester Resin System. ......................................................34
3.1 Summary of Test Specimen Geometry ...........................................................52
3.2 Tension Test Results .......................................................................................57
3.3 Compression Test Results ...............................................................................61
3.4 Flexure Test Results ........................................................................................65
3.5 ILSS Test results .............................................................................................67
3.6 V-Notch Rail Shear Test results .....................................................................68
3.7 Average Mechanical Properties .....................................................................68
3.8 Compressive, Flexural, and Interlaminar Shear Strengths
of P, S, and VW type composites ...................................................................71

x
3.9 Univariate Analysis of Variance for Compressive Strength ...........................72
3.10 Student Newman Keuls Test for Compressive Strength................................73
3.11 Univariate Analysis of Variance for Flexure Strength ..................................73
3.12 Student Newman Keuls Test for Flexure Strength ........................................74
3.13 Univariate Analysis of Variance for ILSS ....................................................75
3.14 Student Newman Keuls Test for ILSS ...........................................................75
xi
LIST OF FIGURES
Figure Page
1.1 Different Weave Patterns: Plain, Twill, Satin and Basket ................................7
1.2 Knitted Tows .....................................................................................................7
1.3 Biaxial Braid sleevings ....................................................................................8
1.4 (a) Stitched E-glass fabric .................................................................................8
(b) E-glass woven roving ..................................................................................8
2.1 Autoclave Processing ......................................................................................17
2.2 Filament Winding ...........................................................................................18
2.3 Pultrusion ........................................................................................................19
2.4 Resin Transfer Molding ..................................................................................19
2.5. Schematic for VARTM ..................................................................................21
2.6 Molecular weight of Lab-prepared‘ Polyol .....................................................23
2.7 Molecular weight of ‗Vikol-1‘ Polyol ............................................................24
2.8 Molecular weight of ‗Soypolyol DB-5‘ Polyol ..............................................24
2.9 Viscosity vs. Temperature study on (a) ‗Lab prepared‘ Polyol
and (b) ‗Soypolyol® DB-5‘ Polyol .................................................................27
2.10 Brookfield Viscometer ...................................................................................28
2.11 Room Temperature VARTM Setup: Vacuum bagging .................................30
2.12 Resin Flow in VARTM Process ....................................................................30
2.13 Vacuum Degassing Chamber .........................................................................35
2.14 Schematic Diagram of VARTM ....................................................................36
2.15 HVARTM Setup View 1 ...............................................................................37
2.16 HVARTM Setup View 2 ...............................................................................38
2.17 HVARTM Fully Impregnated Panel ..............................................................38
3.1 MTS servo hydraulic test system ....................................................................44

xii
3.2 Tensile Tests Specimen ...................................................................................45
3.3 Compression Tests Specimen (ASTM D 6641/D 6641 M) ............................46
3.4 Combined Loading Compression (CLC) Test Fixture ....................................47
3.5 Flexure Test Specimen Loading ......................................................................48
3.6 Flexure Test Specimen and Fixture .................................................................48
3.7 Short Beam Specimen Loading (ASTM D 2344/D 2344M) ..........................49
3.8 Short Beam Test Fixture Loaded with VW-type Specimen ............................50
3.9 V-Notch Beam Test specimen (ASTM D 5379/D 5379M-98) .......................51
3.10 V-Notch Beam Fixture Loaded with VW-type Specimen (ASTM D 5379/D 5379M-98) .......................................................................51
3.11 Typical Tensile Test Failure Modes (ASTM D3039) ....................................54
3.12 Typical Stress-Strain Graph of N-Type Composite .......................................55
3.13 Slope of Stress-Strain curve between 0.001 to 0.003 Strains
is Chord Modulus ...........................................................................................55
3.14 Failed Tension Specimens N, P, S, VW Types (Front view) .......................56
3.15 Failed Tension Specimens N, P, S, VW Types (Side view) .........................56
3.16 Compression Test Methods ...........................................................................59
3.17 Typical Failure Modes of Compression Specimens .....................................59
3.18 Typical load-displacement curve of S-type composite .................................60
3.19 Typical Failure Modes of Compression Specimens: Axial splitting .............60
3.20 Load-Displacement Graph of VW-Type .......................................................63
3.21 Slope of Initial linear portion of Load-Deflection Curve ..............................64
3.22 Failure of P, S, VW types .............................................................................64
3.23 Load-Displacement Graph of N-Type ...........................................................66
3.24 Different Strengths of P, S, and VW Type Composites ................................69
3.25 Tensile and Flexural Modulus of P, S, and VW Type Composites ...............69

xiii
ABSTRACT
LOW COST MANUFACTURING AND PERFORMANCE EVALUATION
OF SOY-BASED POLYURETHANE/E-GLASS COMPOSITES
by
Srujan kumar Konga, B.A.
Texas State University-San Marcos
December 2008
SUPERVISING PROFESSOR: JITENDRA S. TATE
‗Presently, there is a renewed interest in developing materials and products based
on bio-based and renewable resources‘ (Pollock, 2004). The principal drivers for this
interest include environmental regulatory and economic factors. Glass reinforced
composites are very popular in construction and in the boat building industry because of
their low cost material and low manufacturing cost. The popular thermoset resins in such
applications are unsaturated polyester and vinyl ester, which contain styrene. Recently,

xiv
the Environmental Protection Agency has applied stringent regulations on releasing of
styrene (considered a volatile organic compound-VOC) for open-molding composite
processes such as hand layup and spray layup. Therefore, there is great interest among
composite manufacturers to use styrene-free resins and low-cost closed molding
processes.
There is a significant interest in the use of soybean oil as a component in printing
inks, as plasticizer, and as stabilizer in the manufacture of plastic parts, because of its
environmentally friendly, biodegradable, and non-corrosive properties (Amendment,
2006). Two-part thermoset polyurethane (PU) contains polyol and isocynate. In the
proposed research, soy-based polyol will be used to formulate PU resin. Further, this PU
resin will be used to produce E-glass reinforced composites using a low-cost Vacuum
Assisted Resin Transfer Molding (VARTM) process. VARTM has been established as a
low-cost closed molding process having capability to produce large and complex parts.
The literature indicates that mechanical properties of PU composites are comparable to
vinyl ester composites and superior to unsaturated polyester composites (Sherman, 2004;
Tate, Massingill, Patel, Rikka, and Arabie, 2007). Another major advantage is that PU
does not contain styrene. Thus, E-glass reinforced PU composites would provide a viable
alternative to polyester and vinyl ester composites. The overall objective of this research
is to manufacture PU composites using a low-cost VARTM process, and to carry out a
detailed mechanical characterization. Mechanical characterization includes tension,
compression, shear, flexure and inter laminar shear strength tests.
Three different polyurethane/E-glass composites were manufactured using soy-
based polyol. Those are ‗lab prepared‘ (N type composites), ‗Vikol-1‘ (P type

xv
composites), and ‗Soypolyol DB-5‘(S-type composites). The ‗Lab prepared‘ polyol was
made in IEIS (Institute of Environmental and Industry Science) in the Center for
Coatings and Bio-Based Technology (CCBT) lab at Texas State University-San Marcos
under supervision of Dr. Massingill. Arkema, Inc. supplied ‗Vikol-1,‘ and ‗Soypolyol
DB-5‘ polyols, which are development grade materials. ‗Soypolyol DB-5‘ is a modified
polyol that has shown considerable improvement in fiber/matrix adhesion in coating
applications (Massingill, 1991; Mannari and Massingill, 2006). This research explores
whether there is any advantage in using modified ‗Soypolyol DB-5‘ in bulk form in
composites. ‗Derakane Momentum 510-A40‘ is a very popular vinyl ester resin made by
Ashland Chemicals, Inc. (originally developed by Dow Chemical Company). It is used
extensively in FRP (Fiber Reinforced Plastics) ductwork, stacks, stack liner applications,
and in the handling of mixtures of air and hot gases or potentially flammable liquids.
Vinyl ester/E-glass composites (VW type composites) were prepared to compare their
properties with soy-based polyurethane composites.
The VARTM process was successfully implemented to manufacture PU/E-glass
and vinyl ester/E-glass composites. When compared to other composites, VW type
composites have significantly higher compressive strength, flexural strength, and flexural
modulus.
Statistically, there is no difference in P-type and S-type composites in terms of
compressive strength and flexural strength. But also P-type composites have significantly
superior Inter laminar shear strength among all composites.
1
CHAPTER 1
INTRODUCTION
1.1 Overview of Composites
A composite material is made of two or more chemically different materials with
a distinct interface between them. The individual constituents maintain their own
properties. However, the combination of materials develops a material that has properties
and characteristics different than those of the original constituents. The properties of the
composite material depend on the properties and geometry of the constituent materials
and the distribution of the phases.
Composites are becoming popular in industry due to their high specific strength
and high specific modulus. They possess improved corrosion and wear resistance, as well
as low thermal conductivity, and increased fatigue life. The endurance limit of toughened
composites can be much higher than for steel and aluminum. Composites also have
certain disadvantages: they are expensive, and there is a lack of high productivity
manufacturing methods and clear-cut design rules. Composites have an enormous
number of applications in the aerospace, automotive, construction, sports and medical
industries. ( Kelkar, Tate and Bolick, 2003).
Constituent materials in the composite are fibers and matrix. Fibers are major load
carrying components. Matrix transfers stresses between the fibers, provides a barrier

2
against adverse environments, protects the surface from abrasion and provides lateral
support. The different fibers used are glass, carbon, aramid, boron and alumina (Kelkar,
Tate and Bolick, 2003). There are mainly four different types of composite materials
depending upon the matrix used. They are Polymer Matrix Composite (PMC), Metal
Matrix Composite (MMC), Ceramic Matrix Composite (CMC) and Carbon/Carbon
Composites. PMCs are suitable for relatively low temperature applications. Polymer
Matrix Composites (PMC), very often referred to as Fiber Reinforced Plastics (FRP),
consist of fiber reinforcement (E-glass, S2-glass, carbon) and polymer matrix (polyester,
vinyl ester, polyurethane, and epoxies). In this research, E-glass woven roving fabric is
used in conjunction with polyurethane resin to manufacture composites using a low-cost
Vacuum Assisted Resin Transfer Molding (VARTM) process.
1.2 Constituent Materials in PMC
Matrix and reinforcement are constituent materials in polymer matrix composites.
Polymer matrix can be thermoplastics or thermosets, although thermoset matrices
dominate the composite market. Reinforcement is in the form of fiber. Again, there are
varieties of fiber materials available. The following sections explain matrix and fibers.
1.2.1 Matrix
Polymer matrices are also called as resins. Resin plays a very important role in
polymer matrix composites. The loads are mainly carried by fibers but modulus, failure
strain, and resin/matrix adhesion play a dominant role in the performance of composites.
Resin also determines the type of fabrication process, the service temperature, the
flammability and the corrosion resistance of the composite. Secondly, it protects the

3
reinforcement from adverse environmental effects. Polymer resins are of two kinds:
thermosets and thermoplastics.
Thermoplastic resins become soft when heated, may be shaped or molded while
in a heated semi-fluid state, and become rigid when cooled. Thermoset resins, on the
other hand, are usually liquids or low melting point solids in their initial form. When used
to produce finished goods, these thermosetting resins are ―cured‖ by the use of a catalyst,
by heat, or a combination of the two. Once cured, solid thermoset resins cannot be
converted back into their original liquid form. Unlike thermoplastic resins, cured
thermosets will not melt and flow, but will soften when heated (and lose hardness), and
once formed, they cannot be reshaped. Heat Distortion Temperature (HDT) and the Glass
Transition Temperature (Tg) are used to measure the softening of a cured resin. Both test
methods (HDT and Tg) measure the approximate temperature where the cured resin will
soften significantly to yield (bend or sag) under load (American Composites
Manufacturers Association [ACMA], 2004).
Thermosetting plastics, however, have a number of advantages. Unlike
thermoplastics, they retain their strength and shape even when heated. This makes
thermosetting plastics well suited to the production of permanent components and large,
solid shapes. Additionally, these components have excellent strength attributes (although
they are brittle), and will not become weaker when the temperature increases
(ThomasNet, 2008). The most common thermosetting resins used in the composites
industry are unsaturated polyesters, epoxies, vinyl esters, polyurethanes, and phenolics.
Table 1.1 provides properties of popular thermoset resins. Polyurethane resin has two
components: polyol and isocynate. By varying the mix ratio of these components,

4
polyurethane can be made flexible, semi-rigid, and rigid. Full density, non-foam, two-
part, thermoset polyurethane resin is used in this research. In the present research, the
polyol component is made from soybean oil. Polyol and isocynate are mixed on a 1:1
equivalent basis. This ratio makes polyurethane non-foam and rigid.
Table 1.1 Properties of Typical Polymer Matrix Materials (Daniel and Ishai, 1994)
Matrix type Density,
g/cc
Tensile
strength, ksi
Tensile
modulus,
Msi
Coefficient
of thermal
expansion,
10-6
/ºF
Glass
transition
temperature,
Tg , ºF
Unsaturated
polyester
1.1-1.5 5.8-13 0.46-0.51 33-110 50-110
Vinyl ester 1.23 12.5 1.5 212-514 220
Epoxy 1.27 10 0.62 25 200
Vinyl ester: Derkane Momentum 510-A40, Ashland, Inc.
Epoxy: Hercules 3501-6, Hexcel, Inc.
1.2.2 Fibers
Fibers are materials that have one very long axis compared to the others. The
fibers may be aramid, carbon or graphite, glass, ceramic, quartz, natural materials (hemp,
flax, kenaf, etc.), and many other things. E-glass is a popular fiber made primarily of
silica oxide, along with oxides of aluminum, boron, calcium and other compounds.
Named for its good electrical resistance, E-glass is strong, yet low in cost and accounts
for over 90% of all glass fiber reinforcements, especially in aircraft radomes, antennae
and applications where radio-signal transparency is desired. E-glass is also used
extensively in computer circuit boards where stiffness and electrical resistance are
required (Composites One, 2005). E-glass composites are also extensively used in the
marine, sports, transportation, military, and construction industries. Table 1.2 lists
properties of major fibers in polymer matrix composites.
5
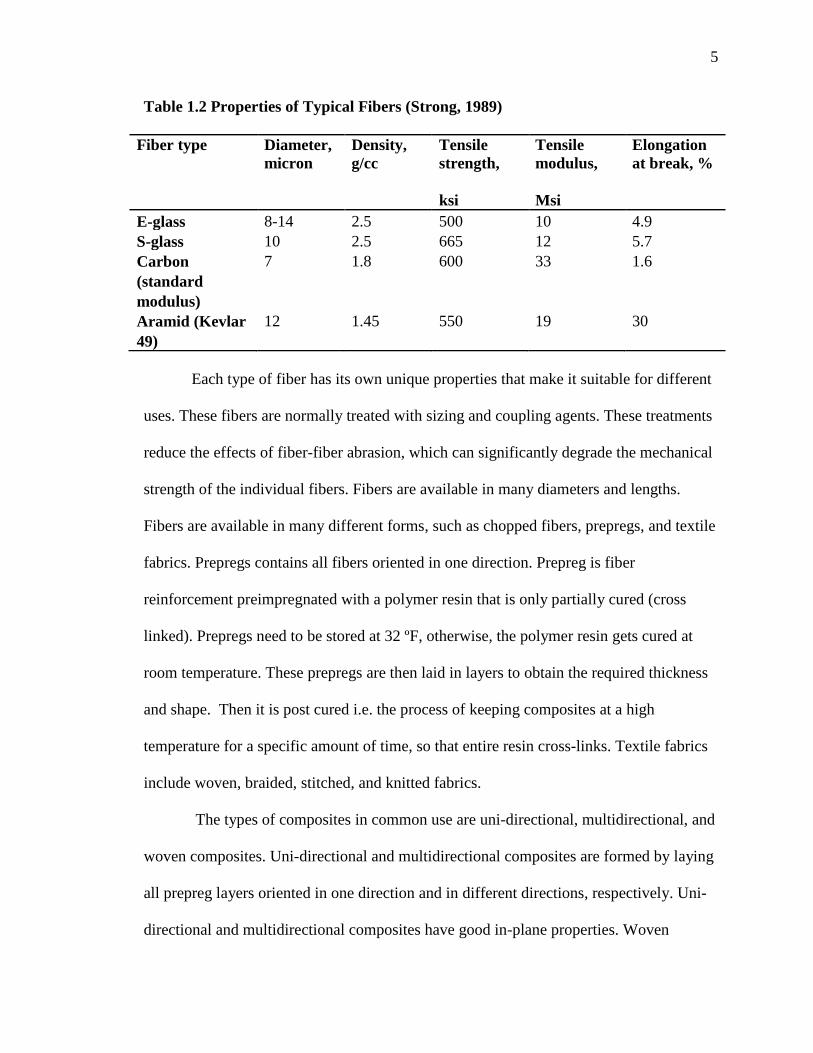
Table 1.2 Properties of Typical Fibers (Strong, 1989)
Fiber type Diameter,
micron
Density,
g/cc
Tensile
strength,
ksi
Tensile
modulus,
Msi
Elongation
at break, %
E-glass 8-14 2.5 500 10 4.9
S-glass 10 2.5 665 12 5.7
Carbon
(standard
modulus)
7 1.8 600 33 1.6
Aramid (Kevlar
49)
12 1.45 550 19 30
Each type of fiber has its own unique properties that make it suitable for different
uses. These fibers are normally treated with sizing and coupling agents. These treatments
reduce the effects of fiber-fiber abrasion, which can significantly degrade the mechanical
strength of the individual fibers. Fibers are available in many diameters and lengths.
Fibers are available in many different forms, such as chopped fibers, prepregs, and textile
fabrics. Prepregs contains all fibers oriented in one direction. Prepreg is fiber
reinforcement preimpregnated with a polymer resin that is only partially cured (cross
linked). Prepregs need to be stored at 32 ºF, otherwise, the polymer resin gets cured at
room temperature. These prepregs are then laid in layers to obtain the required thickness
and shape. Then it is post cured i.e. the process of keeping composites at a high
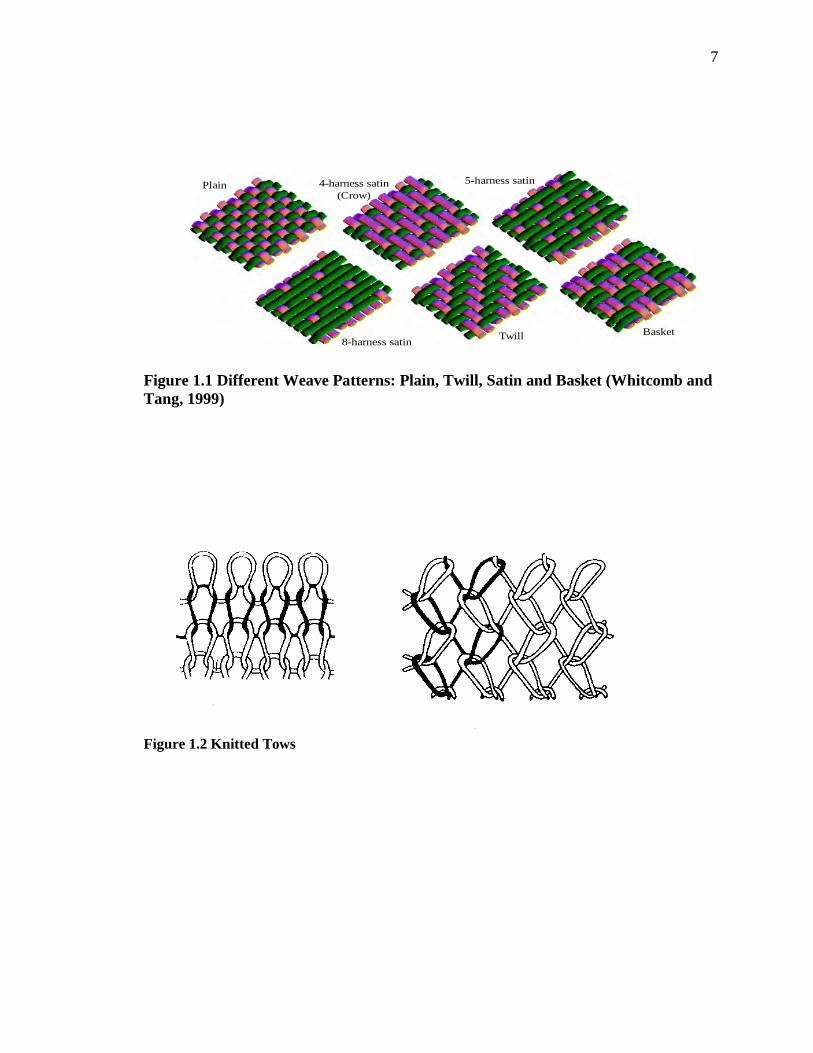
temperature for a specific amount of time, so that entire resin cross-links. Textile fabrics
include woven, braided, stitched, and knitted fabrics.
The types of composites in common use are uni-directional, multidirectional, and
woven composites. Uni-directional and multidirectional composites are formed by laying
all prepreg layers oriented in one direction and in different directions, respectively. Uni-
directional and multidirectional composites have good in-plane properties. Woven
6
composites are being seriously considered for primary structural applications, where out-
of-plane properties are also important, so that the structure can take up the secondary
loads due to load eccentricities, local buckling, etc. In general, woven composites offer
better dimensional stability over a large range of temperatures: better out-of-plane
properties, better impact resistance, subtle conformability and deep draw
moldability/shapability. Orthogonal woven fabrics are formed by interlacing two sets of
yarn at right angles to each other (Naik, 1994). The Warp yarn runs parallel to the length
of the fabric and the fill yarns run perpendicular to it. Two dimensional types of
orthogonal weaves are plain weave, twill weave and satin weave. They exhibit good
dimensional stability in warp and fill directions and offer highest cover or yarn packing
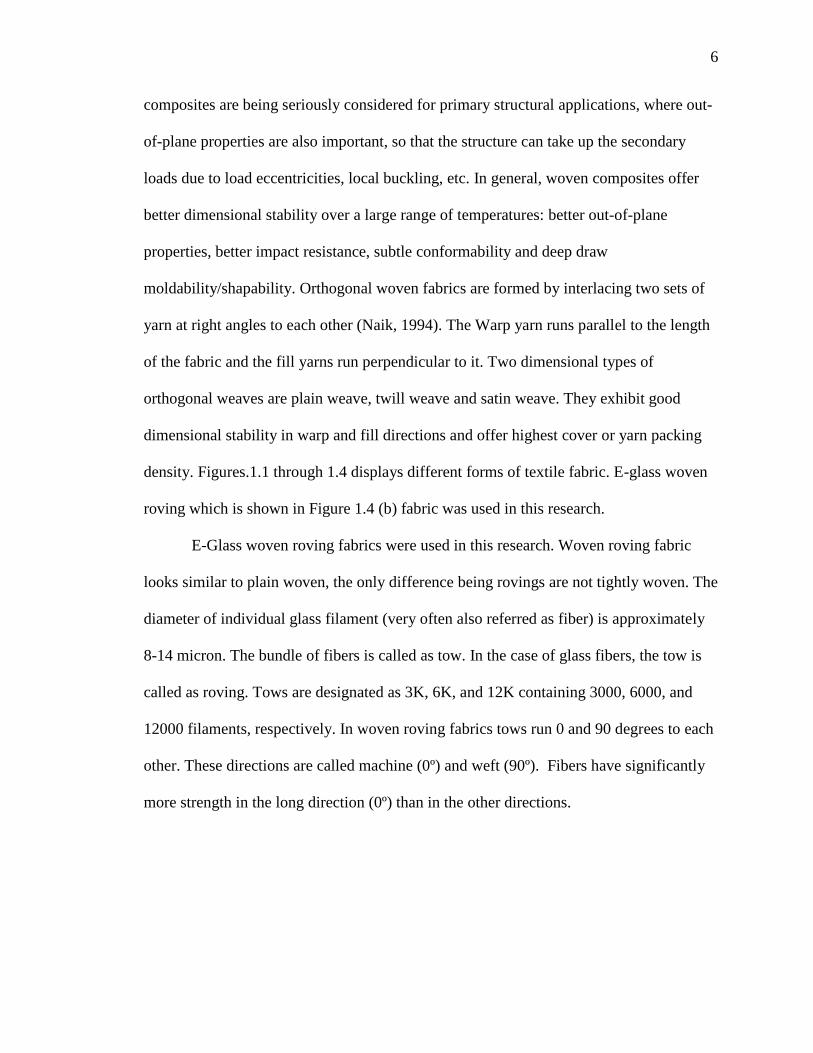
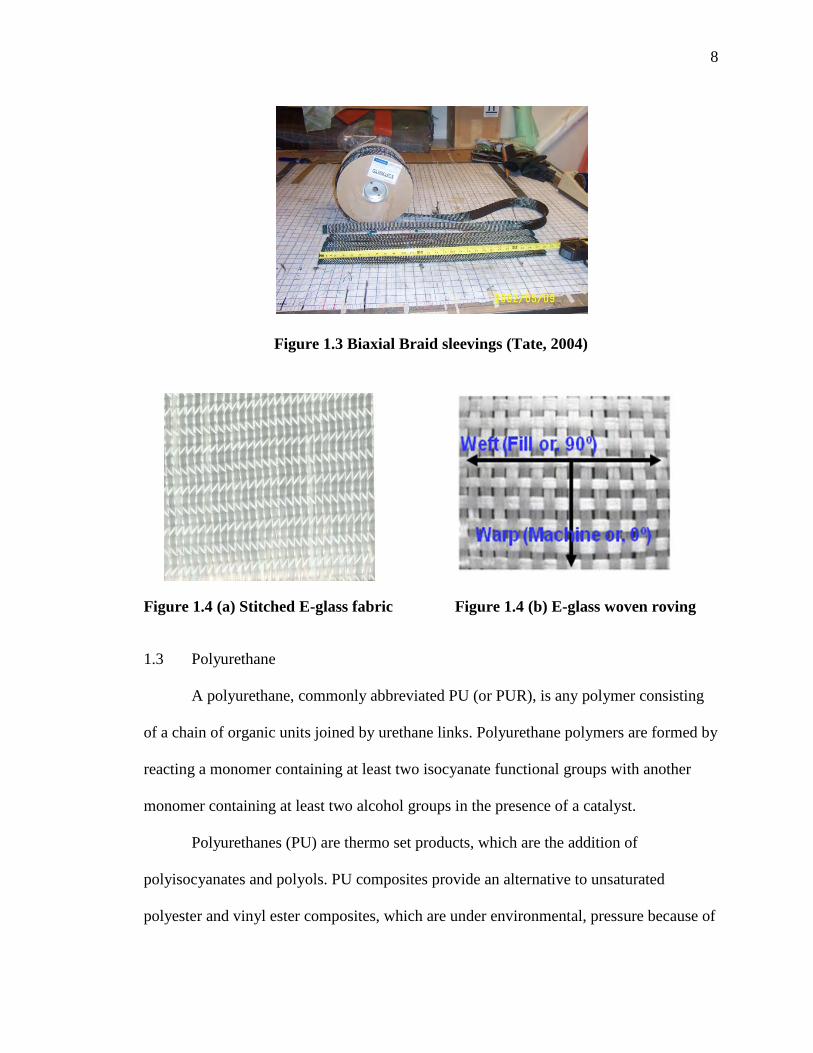
density. Figures.1.1 through 1.4 displays different forms of textile fabric. E-glass woven
roving which is shown in Figure 1.4 (b) fabric was used in this research.
E-Glass woven roving fabrics were used in this research. Woven roving fabric
looks similar to plain woven, the only difference being rovings are not tightly woven. The
diameter of individual glass filament (very often also referred as fiber) is approximately
8-14 micron. The bundle of fibers is called as tow. In the case of glass fibers, the tow is
called as roving. Tows are designated as 3K, 6K, and 12K containing 3000, 6000, and
12000 filaments, respectively. In woven roving fabrics tows run 0 and 90 degrees to each
other. These directions are called machine (0º) and weft (90º). Fibers have significantly
more strength in the long direction (0º) than in the other directions.
7
Figure 1.1 Different Weave Patterns: Plain, Twill, Satin and Basket (Whitcomb and
Tang, 1999)
Figure 1.2 Knitted Tows
Plain 4-harness satin
(Crow)
5-harness satin
8-harness satin Twill Basket
8
Figure 1.3 Biaxial Braid sleevings (Tate, 2004)
Figure 1.4 (a) Stitched E-glass fabric Figure 1.4 (b) E-glass woven roving
1.3 Polyurethane
A polyurethane, commonly abbreviated PU (or PUR), is any polymer consisting
of a chain of organic units joined by urethane links. Polyurethane polymers are formed by
reacting a monomer containing at least two isocyanate functional groups with another
monomer containing at least two alcohol groups in the presence of a catalyst.
Polyurethanes (PU) are thermo set products, which are the addition of
polyisocyanates and polyols. PU composites provide an alternative to unsaturated
polyester and vinyl ester composites, which are under environmental, pressure because of
9
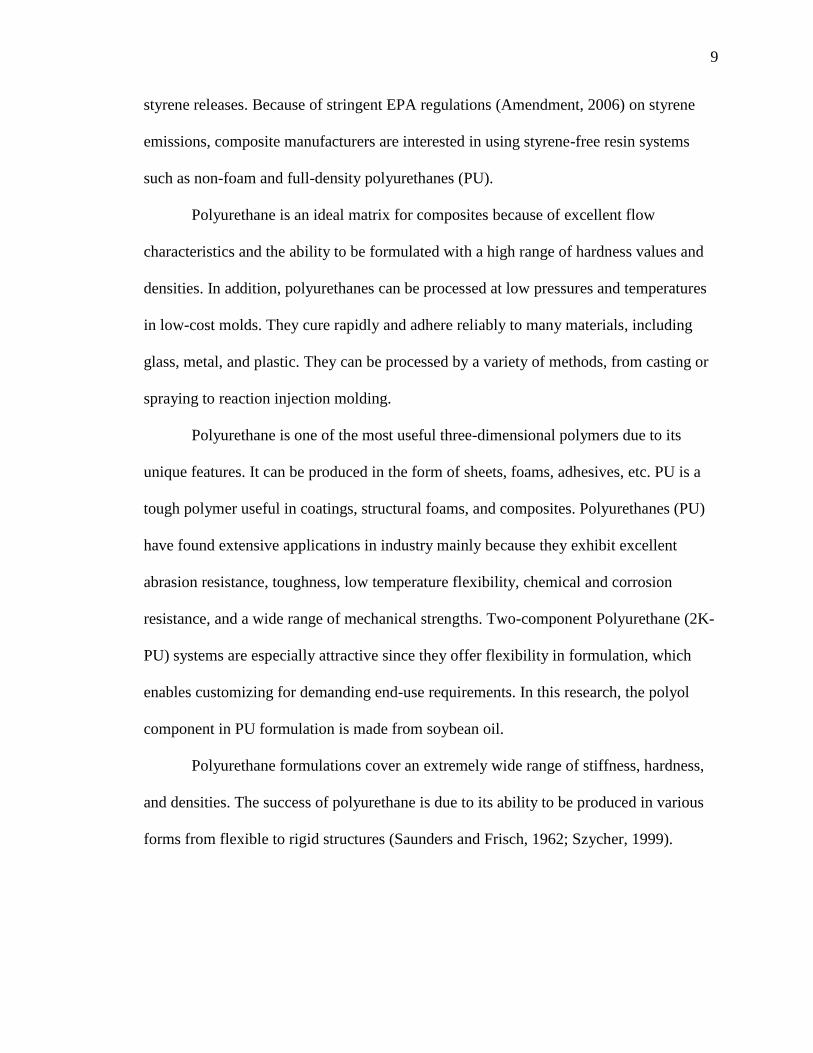
styrene releases. Because of stringent EPA regulations (Amendment, 2006) on styrene
emissions, composite manufacturers are interested in using styrene-free resin systems
such as non-foam and full-density polyurethanes (PU).
Polyurethane is an ideal matrix for composites because of excellent flow
characteristics and the ability to be formulated with a high range of hardness values and
densities. In addition, polyurethanes can be processed at low pressures and temperatures
in low-cost molds. They cure rapidly and adhere reliably to many materials, including
glass, metal, and plastic. They can be processed by a variety of methods, from casting or
spraying to reaction injection molding.
Polyurethane is one of the most useful three-dimensional polymers due to its
unique features. It can be produced in the form of sheets, foams, adhesives, etc. PU is a
tough polymer useful in coatings, structural foams, and composites. Polyurethanes (PU)
have found extensive applications in industry mainly because they exhibit excellent
abrasion resistance, toughness, low temperature flexibility, chemical and corrosion
resistance, and a wide range of mechanical strengths. Two-component Polyurethane (2K-
PU) systems are especially attractive since they offer flexibility in formulation, which
enables customizing for demanding end-use requirements. In this research, the polyol
component in PU formulation is made from soybean oil.
Polyurethane formulations cover an extremely wide range of stiffness, hardness,
and densities. The success of polyurethane is due to its ability to be produced in various
forms from flexible to rigid structures (Saunders and Frisch, 1962; Szycher, 1999).

10
Today, polyurethanes are finding a growing interest for applications as
composites due to the increasing demand for lightweight, durable and cost effective
compounds for sectors such as the automotive market (Dwan'Isa, Mohanty, Misra,
Drzal, and Kazemizadeh, 2004).
1.3.1 Advantage of PU Composites
Superior Mechanical Properties: Composites manufactured from PU resins have
superior tensile strength, impact resistance, and abrasion resistance compared with
composites based on unsaturated polyester and vinyl ester resins (Connolly et al., 2005
and 2006).
Fast curing time: PU composites are also said to be attractive for their processing
advantages. Curing times are much faster than for polyester spray-up—about 20 min
versus 2 to 4 hr in non-automotive applications (Sherman, 2006).
No Styrene. They contain no styrene and therefore do not generate large amounts
of VOCs (volatile organic compounds).
Secondary operations: The superior toughness of PU composites pays off in
secondary operations such as drilling, machining, and assembling. Machined and
punched edges exhibit little or no micro-cracking compared with traditional thermoset
composites (Sherman, 2006).
1.3.2 Limitations of PU Composites
MDI Emissions: PU contains diphenylmethane-diisocyanate (MDI), which is a
regulated material. However, Bayer sources report that MDI emissions from PU
composite processing should usually be negligible, due to the low vapor pressure of MDI.

11
This conclusion seems to be supported by the results of industry emissions tests
(Sherman, 2006).
Reaction Speed: The fast reactivity of PU makes it a good candidate for open-
mold processes, such as spray-up of tubs, provided the appropriate engineering controls
are in place for MDI. There is a downside to the fast reaction speed of polyurethanes.
Current technology of PU resins have maximum open times of about 30 minutes, and
their use to manufacture prepregs is limited (Connolly et al., 2005).
1.4 Soy-based polyurethane
Bio-based resources have played a major role throughout human history because
they are environmental friendly and can be available from the natural resources. Bio-
based composite materials are the innovative class of materials being developed today.
They consist of environmentally friendly resins and natural fibers. Bio-based composite
materials are a revolutionary idea with many potential benefits, because they are made
from renewable agricultural resources like soybeans and corn. By using bio-based
products, the user is avoiding reliance on petroleum resources.
A recent study indicates that soy-based polyols have 25% lower total environmental
impact compared to petroleum based polyols and that use of soy polyols will result in
reductions in net CO2 contributions to global warming, smog formation, ecological
toxicity, and fossil fuel depletion (Pollock, 2004). The polyol component in PU
formulation in this research is made from soybean oil. The polyisocynate component is
petroleum based.
Soy-based polyol has been used mainly in coating, adhesive, sealant, and foam
applications. Very few attempts have been made to use it in reinforced composites. Bio-
12
based polyurethane from soybean oil derived polyol and diisocyanate on reinforcement
with glass fibers enables a significant improvement in the mechanical properties of the
base resin significantly. Thermogravimetric analysis (TGA) shows the improved thermal
stability of the biobased polyurethane on reinforcement with glass fiber
(Dwan'Isa, Mohanty, Misra, and Drzal, 2004).
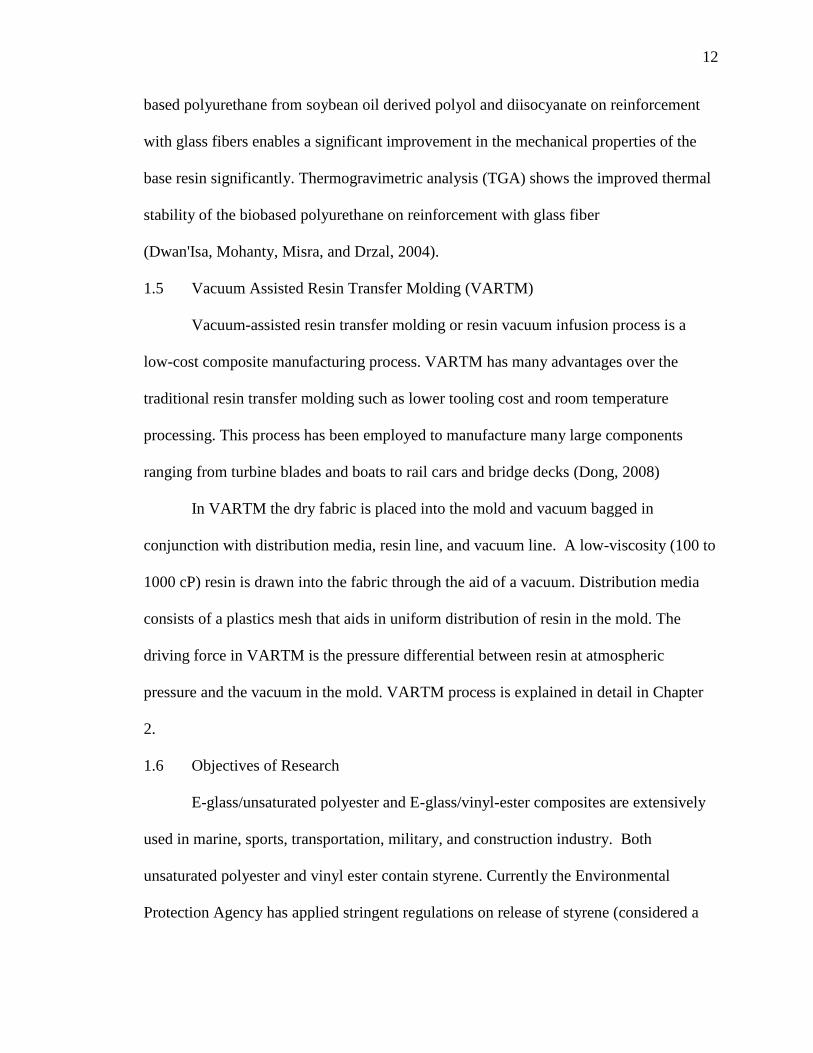
1.5 Vacuum Assisted Resin Transfer Molding (VARTM)
Vacuum-assisted resin transfer molding or resin vacuum infusion process is a
low-cost composite manufacturing process. VARTM has many advantages over the
traditional resin transfer molding such as lower tooling cost and room temperature
processing. This process has been employed to manufacture many large components
ranging from turbine blades and boats to rail cars and bridge decks (Dong, 2008)
In VARTM the dry fabric is placed into the mold and vacuum bagged in
conjunction with distribution media, resin line, and vacuum line. A low-viscosity (100 to
1000 cP) resin is drawn into the fabric through the aid of a vacuum. Distribution media
consists of a plastics mesh that aids in uniform distribution of resin in the mold. The
driving force in VARTM is the pressure differential between resin at atmospheric
pressure and the vacuum in the mold. VARTM process is explained in detail in Chapter
2.
1.6 Objectives of Research
E-glass/unsaturated polyester and E-glass/vinyl-ester composites are extensively
used in marine, sports, transportation, military, and construction industry. Both
unsaturated polyester and vinyl ester contain styrene. Currently the Environmental
Protection Agency has applied stringent regulations on release of styrene (considered a
13
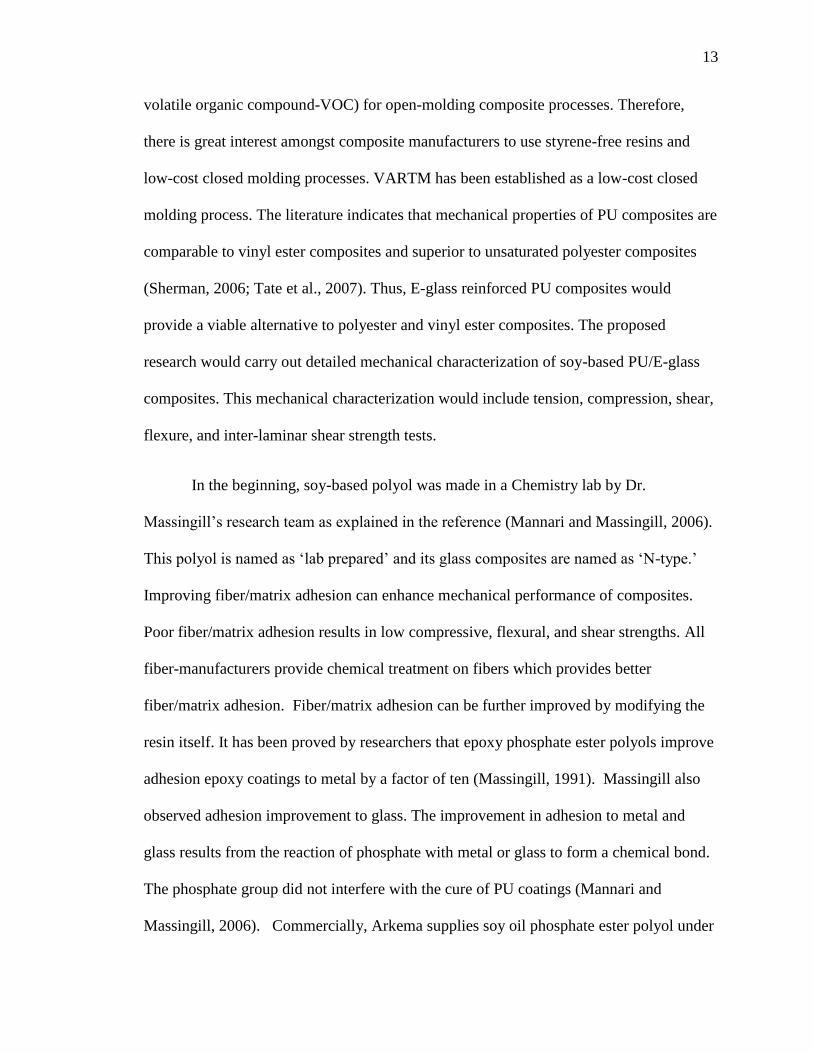
volatile organic compound-VOC) for open-molding composite processes. Therefore,
there is great interest amongst composite manufacturers to use styrene-free resins and
low-cost closed molding processes. VARTM has been established as a low-cost closed
molding process. The literature indicates that mechanical properties of PU composites are
comparable to vinyl ester composites and superior to unsaturated polyester composites
(Sherman, 2006; Tate et al., 2007). Thus, E-glass reinforced PU composites would
provide a viable alternative to polyester and vinyl ester composites. The proposed
research would carry out detailed mechanical characterization of soy-based PU/E-glass
composites. This mechanical characterization would include tension, compression, shear,
flexure, and inter-laminar shear strength tests.
In the beginning, soy-based polyol was made in a Chemistry lab by Dr.
Massingill‘s research team as explained in the reference (Mannari and Massingill, 2006).
This polyol is named as ‗lab prepared‘ and its glass composites are named as ‗N-type.‘
Improving fiber/matrix adhesion can enhance mechanical performance of composites.
Poor fiber/matrix adhesion results in low compressive, flexural, and shear strengths. All
fiber-manufacturers provide chemical treatment on fibers which provides better
fiber/matrix adhesion. Fiber/matrix adhesion can be further improved by modifying the
resin itself. It has been proved by researchers that epoxy phosphate ester polyols improve
adhesion epoxy coatings to metal by a factor of ten (Massingill, 1991). Massingill also
observed adhesion improvement to glass. The improvement in adhesion to metal and
glass results from the reaction of phosphate with metal or glass to form a chemical bond.
The phosphate group did not interfere with the cure of PU coatings (Mannari and
Massingill, 2006). Commercially, Arkema supplies soy oil phosphate ester polyol under
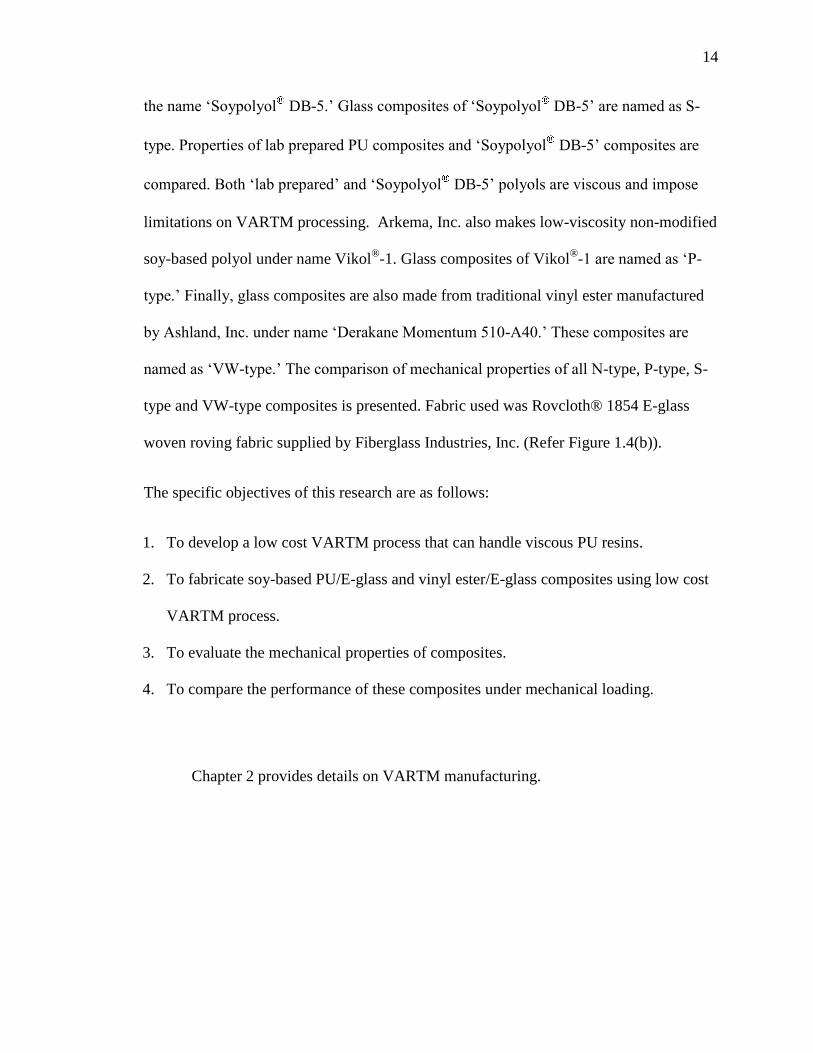
14
the name ‗Soypolyol DB-5.‘ Glass composites of ‗Soypolyol DB-5‘ are named as S-
type. Properties of lab prepared PU composites and ‗Soypolyol DB-5‘ composites are
compared. Both ‗lab prepared‘ and ‗Soypolyol DB-5‘ polyols are viscous and impose
limitations on VARTM processing. Arkema, Inc. also makes low-viscosity non-modified
soy-based polyol under name Vikol®-1. Glass composites of Vikol
®-1 are named as ‗P-
type.‘ Finally, glass composites are also made from traditional vinyl ester manufactured
by Ashland, Inc. under name ‗Derakane Momentum 510-A40.‘ These composites are
named as ‗VW-type.‘ The comparison of mechanical properties of all N-type, P-type, S-
type and VW-type composites is presented. Fabric used was Rovcloth® 1854 E-glass
woven roving fabric supplied by Fiberglass Industries, Inc. (Refer Figure 1.4(b)).
The specific objectives of this research are as follows:
1. To develop a low cost VARTM process that can handle viscous PU resins.
2. To fabricate soy-based PU/E-glass and vinyl ester/E-glass composites using low cost
VARTM process.
3. To evaluate the mechanical properties of composites.
4. To compare the performance of these composites under mechanical loading.
Chapter 2 provides details on VARTM manufacturing.
15
CHAPTER 2
MANUFACTURING
2.1 Composite manufacturing methods
There are various methods that are used to manufacture the composite laminates.
These methods include wet lay-up, prepreg method, autoclave processing, filament
winding, pultrusion, Resin Transfer Molding (RTM), and Vacuum Assisted Resin
Transfer Molding (VARTM). The brief description of these methods is given in the
following section. This section also presents merits and demerits of these methods. In
addition, this section explains VARTM process in detail.
2.1.1 Wet lay-up method
‗This is one of the oldest methods that involve laying the dry reinforcement (most
often a fabric or a mat) into the mold and applying the resin. The wet composite is rolled
by hand to evenly distribute the resin and thereby removes the air pockets. Another layer
of reinforcement is laid on top, after which more catalyzed resin is poured, brushed, or
sprayed over the reinforcement. This sequence is repeated until the desired thickness is
reached. The layered structure is then allowed to harden (cure). This method is
conceptually simple, does not require special handling of wet fabrics, and allows the resin
to be applied only in the mold, thus helping to maintain a neat surrounding area.
However, it is very difficult to maintain product uniformity. Voids are a common

16
problem. Mechanical properties are low compared to other composite manufacturing
methods‘ (Strong, 1989).
2.1.2 Prepreg method
‗This can be viewed as an extension of the wet lay-up method. The fabrics are
usually a uni-directional tape or a woven fabric, impregnated with initiated resin, partially
cured and then rolled up for shipment. However the prepreg method requires vacuum
bagging and is often autoclaved. The resin distribution in the prepreg method is usually
very even and is controlled during tape manufacture. However this method is slow and
labor-intensive compared to the automated methods and has a potential high rejection rate
because of faulty bagging procedures‘ (Strong, 1989).
2.1.3 Autoclave processing
‗The autoclave consists of a vessel (as shown in Figure 2.1) that can be
pressurized internally up to 5 bar (~ 75 psi), and then the contents are heated. The vessel
must be sufficiently large to accommodate large components. They are pressurized with
gas, usually nitrogen, that is circulated through the heaters to maintain a uniform
temperature throughout the vessel. The basic feedstock for the process is preimpregnated
warp sheets or prepreg. A raw laminate along with a bleeder pack is placed under a
nonstick gas permeable film, and then that is followed by a breather pack. This whole
unit is kept in a vacuum bag to maintain vacuum pressure on the laminate. The outer
membrane is pressed against the laminate by atmospheric pressure. The whole unit is
then placed in the autoclave where the bagged molding may be reconnected with the
evacuation system to maintain the vacuum. The autoclave is pressurized which augments
the consolidated pressure. The temperature of the autoclave is reduced when the resin is

17
adequately cured. The main aim of this process is to manufacture the laminate with
uniform thickness and to ensure minimum porosity. The major difficulty in the autoclave
process is the high capitalization cost and the stringent pressure code regulations‘
(Strong, 1989).
Front view Side view
Figure 2.1 Autoclave Processing
(Courtesy: NC A&T State University, Greensboro, NC 27411)
2.1.4 Filament winding
‗A continuous tape of fibers impregnated with resin is wrapped over a mandrel to
form a part (as shown in Figure 2.2). Successive layers are added at the same or different
winding angles until the required thickness is attained. The mandrel or the application
head can rotate to give the fiber coverage over the mandrel. Cylindrical parts can be
manufactured with the filament winding procedure. The pressure vessels, fuel and water
tanks for storage and transportation, and pipes can be manufactured by this method. Use
of pressure during the cure is another method of making non-cylindrical parts. The
process can be used to make parts with strength in several directions. This process can

18
easily manufacture parts with high-pressure ratings. The difficulty of this process is
programming the winding‘ (Strong, 1989).
Figure 2.2 Filament Winding
(http://www.seecom.org.uk/education.asp?sequence=57)
2.1.5 Pultrusion
‗Continuous reinforcement fibers are impregnated with resin and passed through a
die (as shown in Figure 2.3). Then the part is cured and available for use. As this is a
continuous process, the production rate is very high. The cross section of the part has to
be constant for using this process, but the thickness of the part produced can be varied by
having movable dies. The part usually gels in the die itself and then is fully cured when
the part travels through a curing oven. The main advantage of this process is the high
usage of fabrication material. However the problem can come when the resin or fibers
accumulate and build up at the die opening and the equipment can jam. Voids can also
result if the dies are run with too much opening for the fiber volume‘ (Strong, 1989).

19
Figure 2.3 Pultrusion
(http://www.ocvreinforcements.com/processes/pultrusion/pultrusion.aspx)
2.1.6 Resin Transfer Molding (RTM)
‗In this process, a mold is loaded with the reinforcement material and then closed.
The resin is injected into it. The mold with the preform is often put under a vacuum so
that the vacuum removes all the entrapped air in the preform and speeds up the RTM
process. Typically, the resin is injected at the center of the top surface of the mold and the
flow of resin occurs radially outwards untill it reaches the vent lines (as shown in Figure
2.4). In this process the flow of the resin occurs in the plane as well as in the transverse
direction of the preform. The fiber architecture, permeability of the perform, and fabric
crimps has an influence on the wetting of the fabric‘ (Strong, 1989).
Figure 2.4 Resin Transfer Molding
(http://www.osha.gov/dts/osta/otm/otm_iii/otm_iii_1.html)

20
2.1.7 Vacuum Assisted Resin Transfer Molding (VARTM)
VARTM is an adaptation of the RTM process and is very cost-effective in making
large structures such as boat hulls. In this process, tooling costs are cut in half because
one-sided tools such as open molds are used to make the part. In this infusion process,
fibers are placed in a one-sided mold and a cover, either rigid or flexible, is placed over
the top to form a vacuum-tight seal. A vacuum procedure is used to draw the resin into
the structure through various types of ports. This process has several advantages
compared to the wet lay-up process used in manufacturing boat hulls. Because VARTM
is a closed mold process, styrene emissions are close to zero. Moreover, a high fiber
volume fraction (70%) is achieved by this process, and therefore, high structural
performance is obtained in the part (Mazumdar, 2002).
This process was used in manufacturing composite panels in this research.
VARTM process is explained in detail in next section.
2.2 Vacuum Assisted Resin Transfer Molding process (VARTM)
Usually, Resin Transfer Molding (RTM), hand-layup and Vacuum Assisted Resin
Transfer Molding process (VARTM) are widely used as low cost manufacturing
processes. VARTM offers many advantages over the traditional resin transfer molding
such as lower tooling cost, room temperature processing. As we discussed earlier in
Section 2.1.1, the hand layup process is labor intensive and because of its open mold
nature it produces the styrene emissions.
Vacuum Assisted Resin Transfer Molding (VARTM) is an attractive and
affordable method of fabricating composite products. It can produce high-quality large-
scale components. The major requirement of a resin system for VARTM is that viscosity

21
should be in the range of 100 to 1000 cP for the resin to flow throughout the fabric
(Steven, 2001). The viscosity plays the major role in the VARTM process.
During VARTM, dry fabric is placed into a tool and vacuum bagged in
conjunction with the resin distribution line, the vacuum distribution line, and the
distribution media. A low viscosity resin is drawn into the fabric through the aid of a
vacuum. Resin distribution media ensures resin infiltration in the through-the-thickness
direction. The key to successful resin infiltration of the fabric is the design and placement
of the resin distribution media which allows complete wet-out of the fabric and
eliminates voids and dry spots. Properly designed and properly placed resin distribution
media eliminate race tracking and resin leakage around the fabric (Seeman, 1990 and
1994). The schematic for the fabrication is shown in Figure 2.5.
Figure 2.5. Schematic for VARTM (Tate, 2004)
The parameters of the VARTM process are currently designed by a trial-and-error
method. Therefore, a series of experiments are required to design a suitable distribution
media and to determine the proper location of the resin line and the vacuum line.
2.3 Material System:
Four different resin systems were used in this research:
22
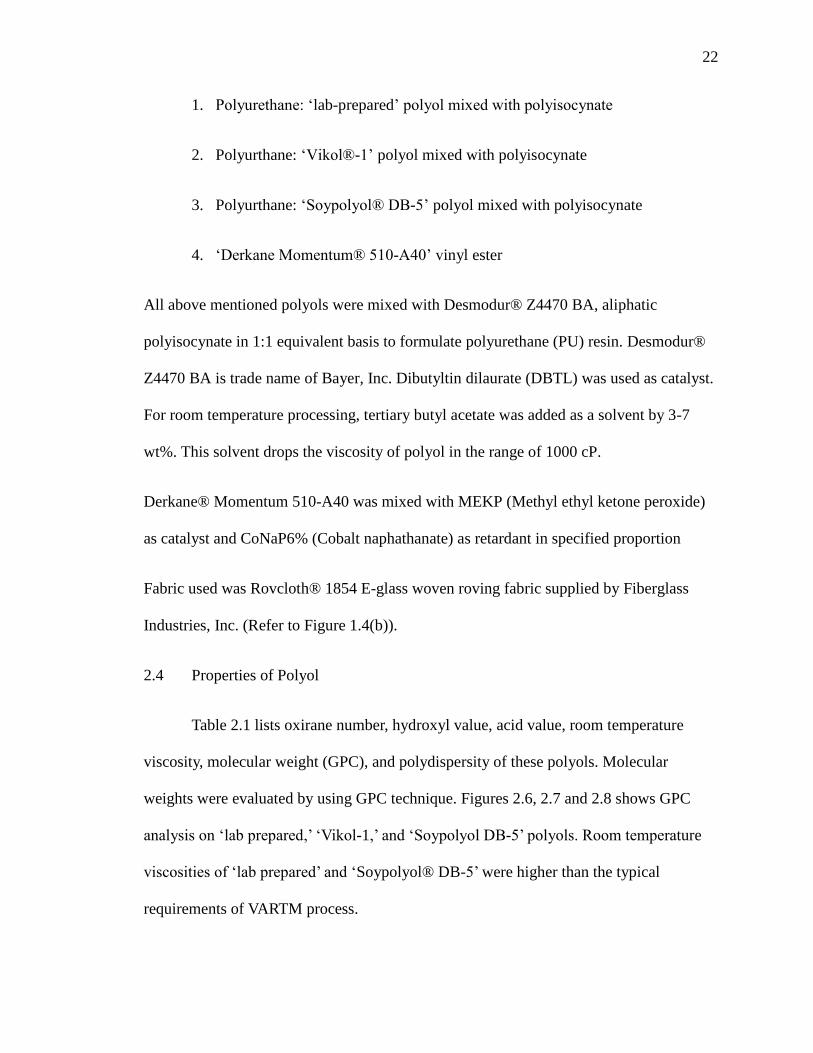
1. Polyurethane: ‗lab-prepared‘ polyol mixed with polyisocynate
2. Polyurthane: ‗Vikol®-1‘ polyol mixed with polyisocynate
3. Polyurthane: ‗Soypolyol® DB-5‘ polyol mixed with polyisocynate
4. ‗Derkane Momentum® 510-A40‘ vinyl ester
All above mentioned polyols were mixed with Desmodur® Z4470 BA, aliphatic
polyisocynate in 1:1 equivalent basis to formulate polyurethane (PU) resin. Desmodur®
Z4470 BA is trade name of Bayer, Inc. Dibutyltin dilaurate (DBTL) was used as catalyst.
For room temperature processing, tertiary butyl acetate was added as a solvent by 3-7
wt%. This solvent drops the viscosity of polyol in the range of 1000 cP.
Derkane® Momentum 510-A40 was mixed with MEKP (Methyl ethyl ketone peroxide)
as catalyst and CoNaP6% (Cobalt naphathanate) as retardant in specified proportion
Fabric used was Rovcloth® 1854 E-glass woven roving fabric supplied by Fiberglass
Industries, Inc. (Refer to Figure 1.4(b)).
2.4 Properties of Polyol
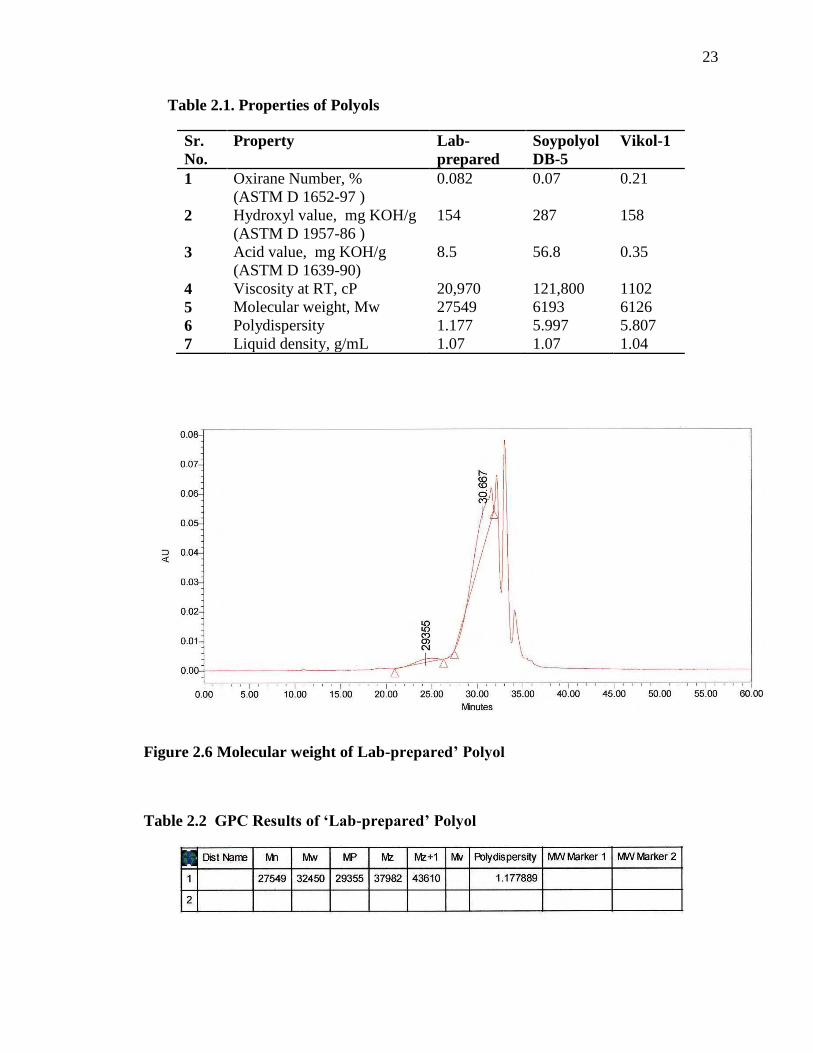
Table 2.1 lists oxirane number, hydroxyl value, acid value, room temperature
viscosity, molecular weight (GPC), and polydispersity of these polyols. Molecular
weights were evaluated by using GPC technique. Figures 2.6, 2.7 and 2.8 shows GPC
analysis on ‗lab prepared,‘ ‗Vikol-1,‘ and ‗Soypolyol DB-5‘ polyols. Room temperature
viscosities of ‗lab prepared‘ and ‗Soypolyol® DB-5‘ were higher than the typical
requirements of VARTM process.
23
Table 2.1. Properties of Polyols
Sr.
No.
Property Lab-
prepared
Soypolyol
DB-5
Vikol-1
1 Oxirane Number, %
(ASTM D 1652-97 )
0.082 0.07 0.21
2 Hydroxyl value, mg KOH/g
(ASTM D 1957-86 )
154 287 158
3 Acid value, mg KOH/g
(ASTM D 1639-90)
8.5 56.8 0.35
4 Viscosity at RT, cP 20,970 121,800 1102
5 Molecular weight, Mw 27549 6193 6126
6 Polydispersity 1.177 5.997 5.807
7 Liquid density, g/mL 1.07 1.07 1.04
Figure 2.6 Molecular weight of Lab-prepared’ Polyol
Table 2.2 GPC Results of ‘Lab-prepared’ Polyol
24
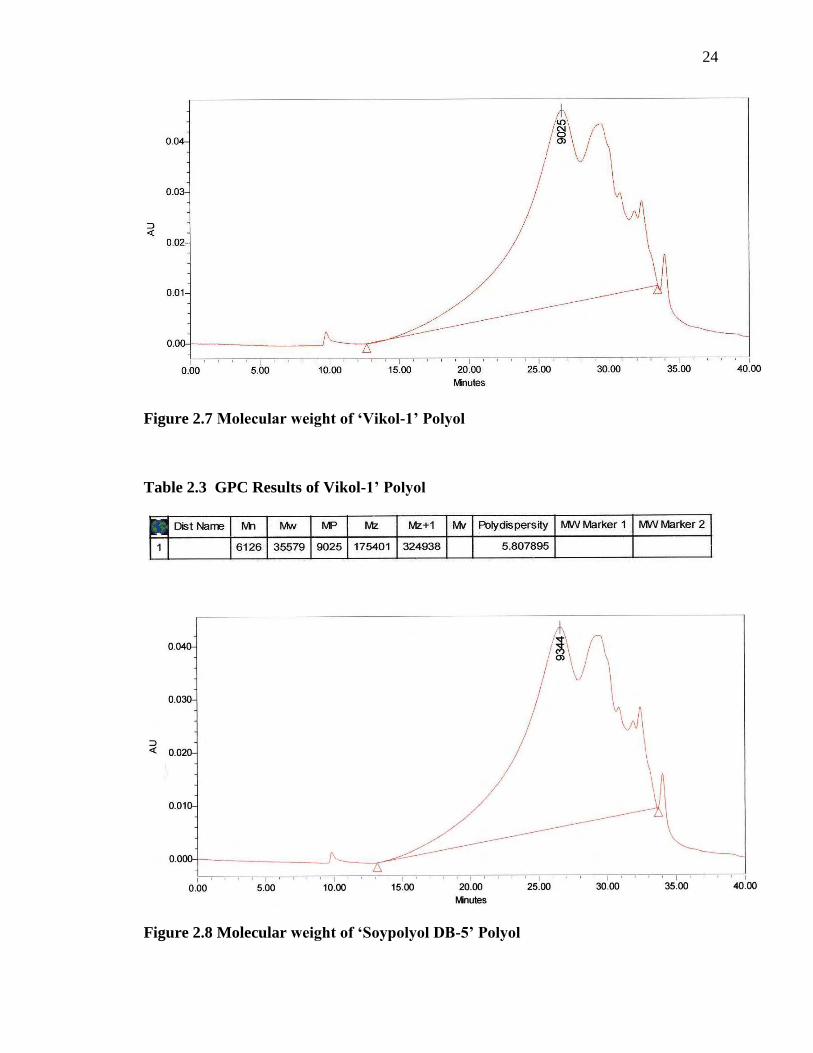
Figure 2.7 Molecular weight of ‘Vikol-1’ Polyol
Table 2.3 GPC Results of Vikol-1’ Polyol
Figure 2.8 Molecular weight of ‘Soypolyol DB-5’ Polyol
25
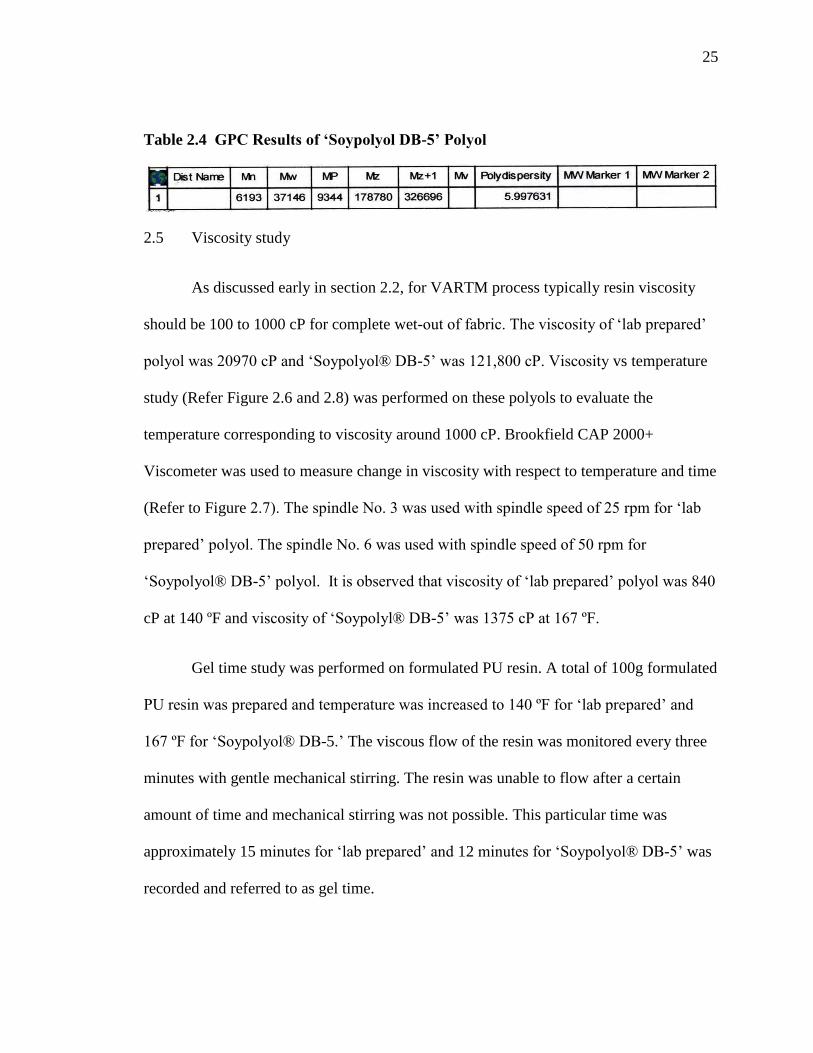
Table 2.4 GPC Results of ‘Soypolyol DB-5’ Polyol
2.5 Viscosity study
As discussed early in section 2.2, for VARTM process typically resin viscosity
should be 100 to 1000 cP for complete wet-out of fabric. The viscosity of ‗lab prepared‘
polyol was 20970 cP and ‗Soypolyol® DB-5‘ was 121,800 cP. Viscosity vs temperature
study (Refer Figure 2.6 and 2.8) was performed on these polyols to evaluate the
temperature corresponding to viscosity around 1000 cP. Brookfield CAP 2000+
Viscometer was used to measure change in viscosity with respect to temperature and time
(Refer to Figure 2.7). The spindle No. 3 was used with spindle speed of 25 rpm for ‗lab
prepared‘ polyol. The spindle No. 6 was used with spindle speed of 50 rpm for
‗Soypolyol® DB-5‘ polyol. It is observed that viscosity of ‗lab prepared‘ polyol was 840
cP at 140 ºF and viscosity of ‗Soypolyl® DB-5‘ was 1375 cP at 167 ºF.
Gel time study was performed on formulated PU resin. A total of 100g formulated
PU resin was prepared and temperature was increased to 140 ºF for ‗lab prepared‘ and
167 ºF for ‗Soypolyol® DB-5.‘ The viscous flow of the resin was monitored every three
minutes with gentle mechanical stirring. The resin was unable to flow after a certain
amount of time and mechanical stirring was not possible. This particular time was
approximately 15 minutes for ‗lab prepared‘ and 12 minutes for ‗Soypolyol® DB-5‘ was
recorded and referred to as gel time.

26
Table 2.5 Viscosity vs Temperature for ‘Lab-prepared Polyol’
Temperature, ºF Viscosity, cP
77 20970
86 8190
95 5250
104 3540
113 2370
122 1650
140 840
Table 2.6 Viscosity vs Temperature for ‘Soypolyol DB-5’
Temperature °F Viscosity (cP)
77 121800
82.4 84000
87.8 59550
93.2 42750
98.6 30900
104 22800
109.4 17100
114.8 12900
120.2 9900
125.6 7650
131 5850
136.4 4650
141.8 3600
147.2 2850
152.6 2250
158 1800
167 1350
27
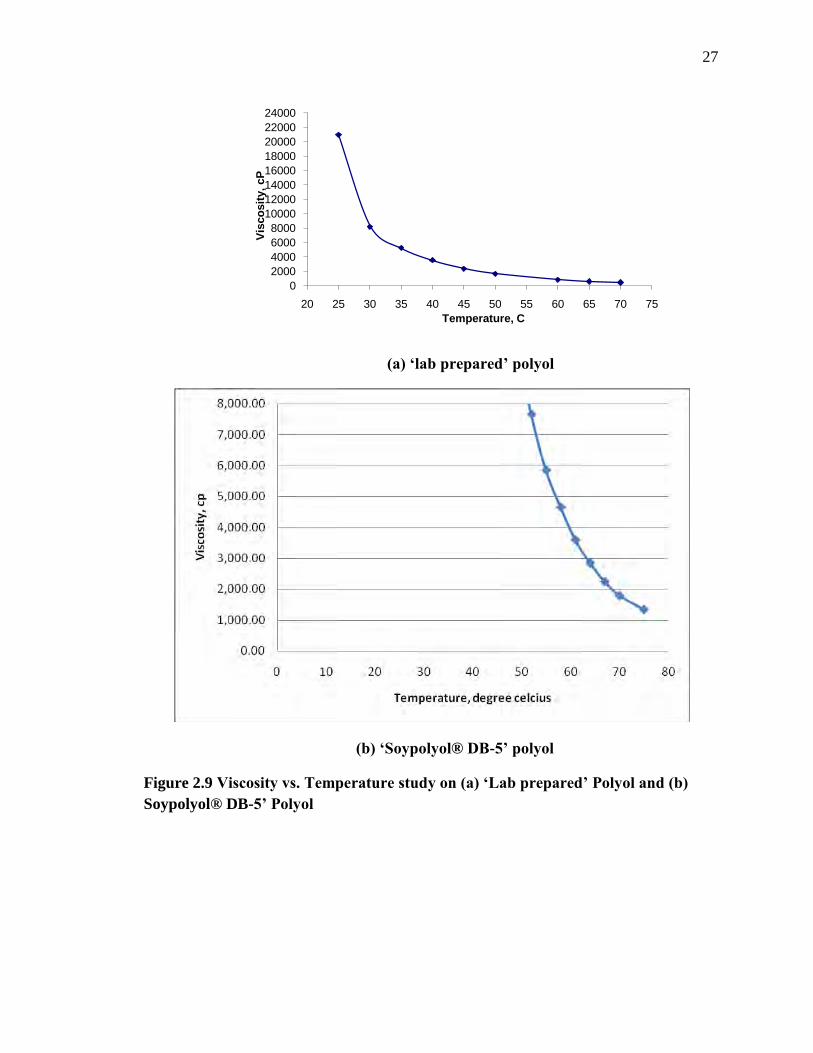
(a) ‘lab prepared’ polyol
(b) ‘Soypolyol® DB-5’ polyol
Figure 2.9 Viscosity vs. Temperature study on (a) ‘Lab prepared’ Polyol and (b)
Soypolyol® DB-5’ Polyol
0
2000
4000
6000
8000
10000
12000
14000
16000
18000
20000
22000
24000
20 25 30 35 40 45 50 55 60 65 70 75
Vis
co
sit
y,
cP
Temperature, C
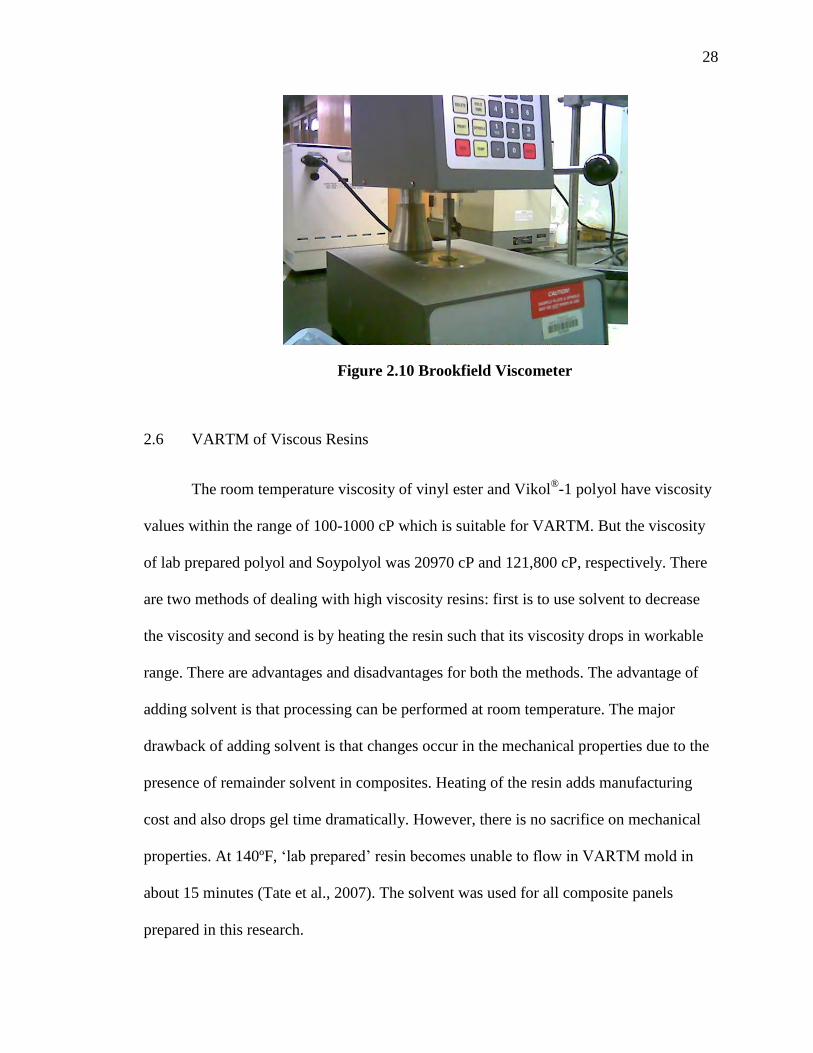
28
Figure 2.10 Brookfield Viscometer
2.6 VARTM of Viscous Resins
The room temperature viscosity of vinyl ester and Vikol®-1 polyol have viscosity
values within the range of 100-1000 cP which is suitable for VARTM. But the viscosity
of lab prepared polyol and Soypolyol was 20970 cP and 121,800 cP, respectively. There
are two methods of dealing with high viscosity resins: first is to use solvent to decrease
the viscosity and second is by heating the resin such that its viscosity drops in workable
range. There are advantages and disadvantages for both the methods. The advantage of
adding solvent is that processing can be performed at room temperature. The major
drawback of adding solvent is that changes occur in the mechanical properties due to the
presence of remainder solvent in composites. Heating of the resin adds manufacturing
cost and also drops gel time dramatically. However, there is no sacrifice on mechanical
properties. At 140ºF, ‗lab prepared‘ resin becomes unable to flow in VARTM mold in
about 15 minutes (Tate et al., 2007). The solvent was used for all composite panels
prepared in this research.
29
Heating of the resin was investigated only for ‗Soypolyol® DB-5‘ for comparison
purposes. It was observed that ‗lab-prepared‘ polyol needs to be heated to 140 ºF to get
viscosity of 840 cP and ‗Soypolyol DB-5‘ needs to be heated to 167 ºF to get viscosity of
1350 cP.
2.7 Room Temperature VARTM (Tate, 2004)
Typically, the VARTM process at room temperature involves the following steps
1. Mold Preparation and Vacuum Bagging
2. Formulation and Degassing of Resin
3. Resin Impregnation and Curing
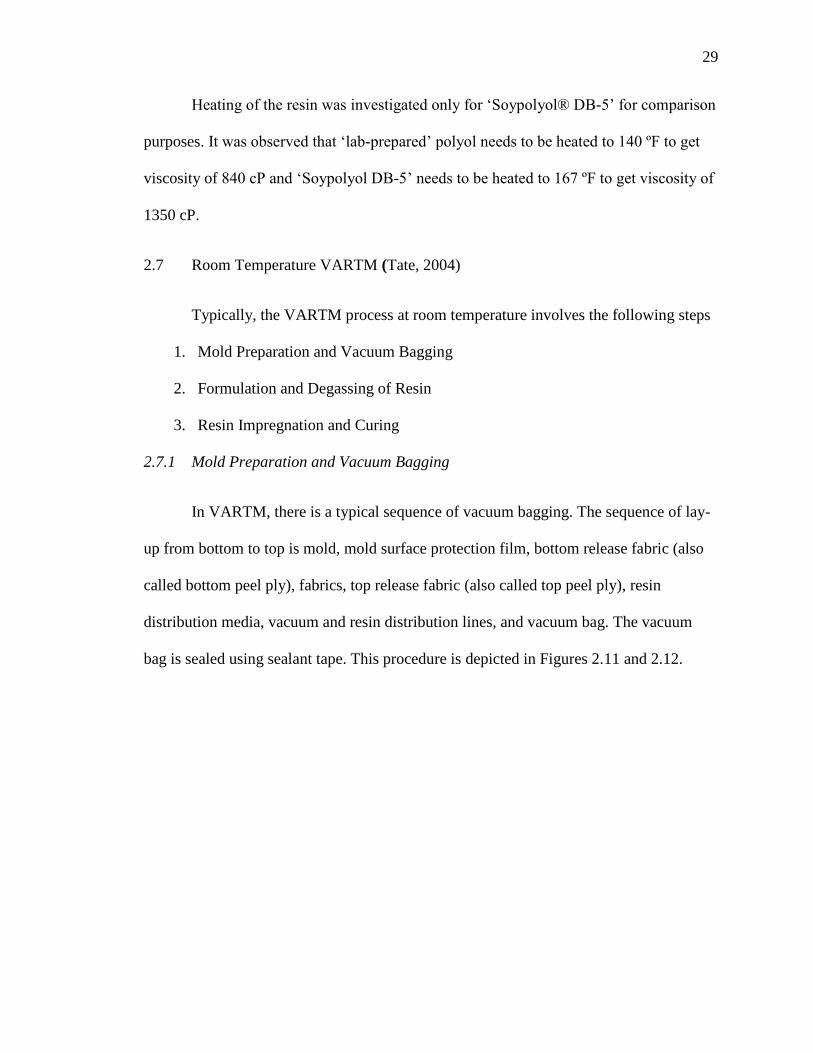
2.7.1 Mold Preparation and Vacuum Bagging
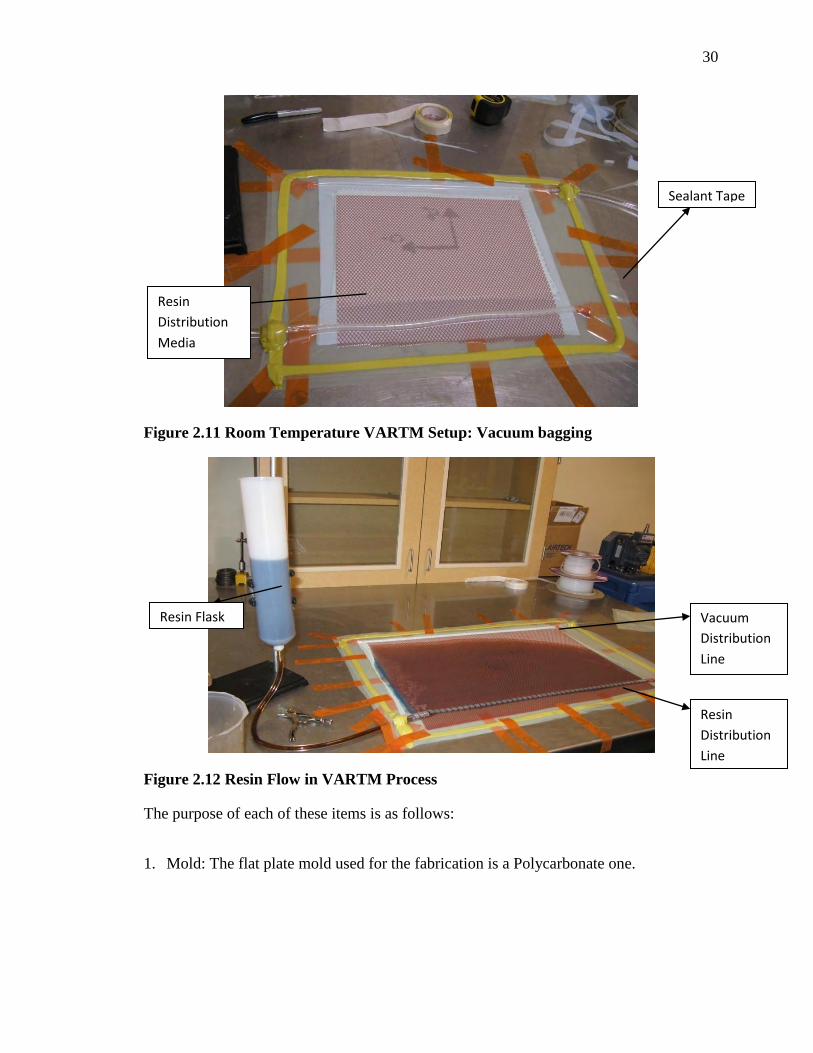
In VARTM, there is a typical sequence of vacuum bagging. The sequence of lay-
up from bottom to top is mold, mold surface protection film, bottom release fabric (also
called bottom peel ply), fabrics, top release fabric (also called top peel ply), resin
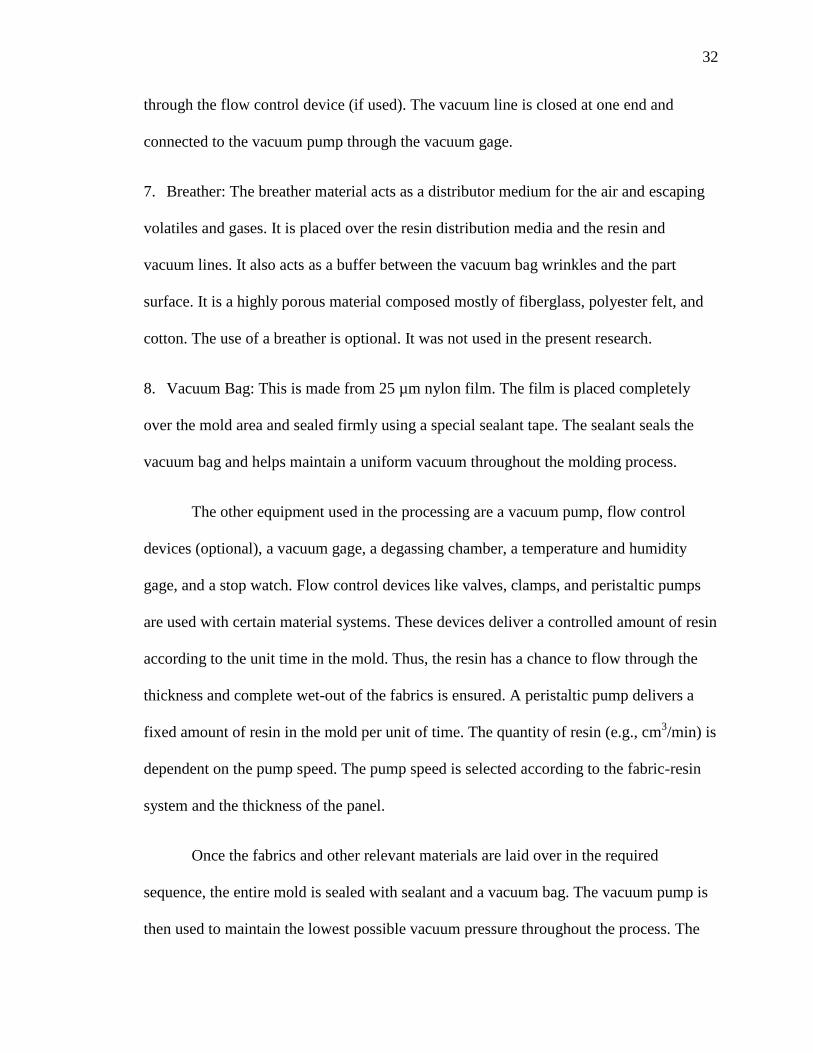
distribution media, vacuum and resin distribution lines, and vacuum bag. The vacuum
bag is sealed using sealant tape. This procedure is depicted in Figures 2.11 and 2.12.
30
Figure 2.11 Room Temperature VARTM Setup: Vacuum bagging
Figure 2.12 Resin Flow in VARTM Process
The purpose of each of these items is as follows:
1. Mold: The flat plate mold used for the fabrication is a Polycarbonate one.
Sealant Tape
Resin
Distribution
Media
Resin Flask Vacuum
Distribution
Line
Resin
Distribution
Line

31
2. Bottom Peel Ply: This is a porous nylon fabric, which leaves an impression on the
part suitable for secondary adhesive bonding (like tabbing) without further surface
preparation. Its use is optional.
3. Fabric Lay-up: The fabric used is the E-glass woven roving fabrics (Rovcloth 1854)
manufactured by Fiberglass Industries, Inc. The composites panels of 12‖ x 8‖with 8
layers of E-glass woven roving were produced in this research.
4. Top Peel Ply: This is the same material as the bottom release fabric. It is laid on top of
the braided fabrics to facilitate the flow of resin through it. It also leaves an impression
on the part suitable for secondary bonding without further surface preparation.
5. Distribution Media: The distribution media is polyethylene mesh laid on top of the top
release fabric. This helps maintain an even distribution of resin and facilitates the flow of
resin through the thickness of the panel.
The use of distribution media is a patented technology termed as SCRIMP
(Seemann Composite Resin Infusion Manufacturing Process) that was invented by W. H.
Seemann. Seemann also patented different patterns of distribution media and the
placement technique for these patterns (Seemann, 1990 and 1994). Distribution media
control the flow of resin through the thickness. Resin flows quickly through the media
and then remains in the mesh pockets. It then travels through the thickness.
6. Resin and Vacuum Distribution Lines: Spirally cut HDPE (High Density
Polyethylene) tubes are used for this purpose. These lines are laid above the distribution
media at two sides of the fabric lay-up and can run along its length or along its width.
One end of the resin line is closed, and the other end is connected to the resin supply
32
through the flow control device (if used). The vacuum line is closed at one end and
connected to the vacuum pump through the vacuum gage.
7. Breather: The breather material acts as a distributor medium for the air and escaping
volatiles and gases. It is placed over the resin distribution media and the resin and
vacuum lines. It also acts as a buffer between the vacuum bag wrinkles and the part
surface. It is a highly porous material composed mostly of fiberglass, polyester felt, and
cotton. The use of a breather is optional. It was not used in the present research.
8. Vacuum Bag: This is made from 25 µm nylon film. The film is placed completely
over the mold area and sealed firmly using a special sealant tape. The sealant seals the
vacuum bag and helps maintain a uniform vacuum throughout the molding process.
The other equipment used in the processing are a vacuum pump, flow control
devices (optional), a vacuum gage, a degassing chamber, a temperature and humidity
gage, and a stop watch. Flow control devices like valves, clamps, and peristaltic pumps
are used with certain material systems. These devices deliver a controlled amount of resin
according to the unit time in the mold. Thus, the resin has a chance to flow through the
thickness and complete wet-out of the fabrics is ensured. A peristaltic pump delivers a
fixed amount of resin in the mold per unit of time. The quantity of resin (e.g., cm3/min) is
dependent on the pump speed. The pump speed is selected according to the fabric-resin
system and the thickness of the panel.
Once the fabrics and other relevant materials are laid over in the required
sequence, the entire mold is sealed with sealant and a vacuum bag. The vacuum pump is
then used to maintain the lowest possible vacuum pressure throughout the process. The

33
care should be taken that vapor pressure of ingredients should not exceed in the mold.
Polyisocynate contains n-butyl acetate as solvent for which vapor pressure is 29.14‖ of
Hg. Solvent used was t-butyl acetate for which vapor pressure is 28.35‖ Hg. Vinyl ester
contains styrene which has vapor pressure of 29.53‖ Hg. Bag leaks are the most common
problems that occur in VARTM. One of the reasons for leaks is a damaged vacuum bag.
A vacuum bag is typically made of nylon film. The moisture level in the surrounding
environment affects the nylon film. Dry and brittle film can cause cracking when handled
frequently. Another common reason for bag leak is foreign material entrapped between
the vacuum bag and the sealant tape. Once the leaks have been removed and the vacuum
bag is completely sealed, the vacuum pump remains running for at least 1 to 2 hours to
achieve a good vacuum in the bag. The typical vacuum achieved is in the order of 28‖ of
Hg for polyurethane and 29‖ of Hg for vinyl ester. The vacuum pump is then shut off,
and the vacuum line is clamped. If the bag remains tight and holds almost the same
vacuum after 1 to 2 hours, the mold is ready for resin impregnation.
The vacuum plays a vital role in the VARTM process. The pressure differential
between the atmosphere and the vacuum provides the driving force for infusing the resin
into the mold. The vacuum also removes all of the air from the mold before and during
the introduction of resin.
2.7.2 Formulation and Degassing of Resin
The following table provides formulation details for polyurethane resins. The
amount of aliphatic polyisocynate (Desmodur® Z4470BA) depends on hydroxyl value of
polyol.
34
Table 2.7 Formulation of Polyurethane Resin System
Lab prepared Soypolyol Vikol-1
Polyol, g 41.94 27.9 41.32
Aliphatic
polyisocynate, g
58.06 71.97 58.67
DBTL, g 0.201 0.134 0.210
Solvent, g 3 7 N/A
The following table provides formulation for Derkane® Momentum 510-A40, vinyl ester
resin.
Table 2.8 Formulation of Vinyl ester Resin System.
Ingredient Quantity
Resin, g 100
MEKP, g 1
CoNap6%, g 0.2
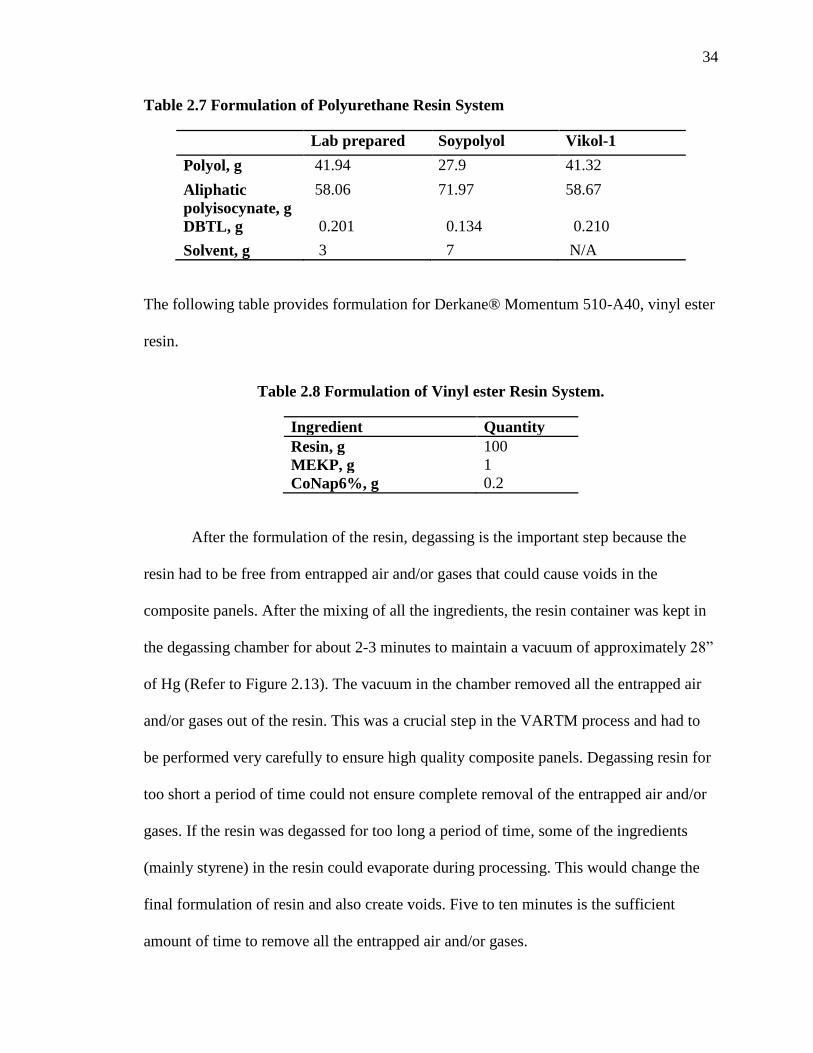
After the formulation of the resin, degassing is the important step because the
resin had to be free from entrapped air and/or gases that could cause voids in the
composite panels. After the mixing of all the ingredients, the resin container was kept in
the degassing chamber for about 2-3 minutes to maintain a vacuum of approximately 28‖
of Hg (Refer to Figure 2.13). The vacuum in the chamber removed all the entrapped air
and/or gases out of the resin. This was a crucial step in the VARTM process and had to
be performed very carefully to ensure high quality composite panels. Degassing resin for
too short a period of time could not ensure complete removal of the entrapped air and/or
gases. If the resin was degassed for too long a period of time, some of the ingredients
(mainly styrene) in the resin could evaporate during processing. This would change the
final formulation of resin and also create voids. Five to ten minutes is the sufficient
amount of time to remove all the entrapped air and/or gases.

35
Figure 2.13 Vacuum Degassing Chamber
2.7.3 Resin Impregnation and Curing
The resin impregnation process was the same for all types of resins used in this
research. The resin was poured in the container that connects to the resin line in Figure
2.12. The resin was allowed to flow in the mold until the whole panel was soaked. There
was no need to use a flow control device with this design. The driving force created by
the vacuum alone was sufficient for complete wet-out of the fabric. Properly designed
and properly placed resin distribution media eliminate race tracking and resin leakage
around the fabric (Seeman, 1990 and 1994). Figure 2.12 displays the resin impregnation
set-up. Panels remained in the mold for 24 hr at room temperature for curing, which is
termed as the ‗Green Cure.‘ Panels were removed from mold and were post cured. This
post cure cycle was different for PU and vinyl ester.

36
Figure 2.14 Schematic Diagram of VARTM
Post-cure is the final and most important step in composites processing. Although
the degree of cure increases with time at room temperature, post-curing at elevated
temperatures accelerates the process and achieves an ultimate heat distortion temperature
and optimal mechanical properties. Generally, manufacturer of the resin recommends the
post-cure cycle according to the type of curing agent in the resin system. Lab prepared
polyol, Vikol®-1, and Soypolyol®-DB5 polyols were developmental grade materials;
therefore, definite post cure cycle was not available. Secondly, post curing on PU
depends on type of polyisocynate used. Desmodur® Z4470BA is popular aliphatic
polyisocynate in coating applications. In coating applications, researchers have
recommended 7-days at room temperature as post cure cycle (Guo et al., 2006). Cure
temperature of thermoset polymers is close to glass transition temperature (Tg). DMA
studies showed that Tg of N and S-type polyurethanes is around 284ºF (Tate, 2007). The
post cure cycle used for N, P, and S-type composites was 7-days at room temperature
Res
in
Flow
Control
Vacuum
Pump
Vacuum
Gage
Resin Line
Vacuum Line
Distribution Media
Fabric
0.5 in
37
followed by 250ºF for 3 hours. Later heating at 250ºF for 3 hours was just to ensure
complete curing. This cure cycle is time consuming and expensive. When this technology
is deployed to industry, composite manufacturers would not prefer such a long post cure
cycle. Author felt need for researching on accelerated cure cycle and still achieving
optimal properties. Derkane® Momentum 510-A40, viyl ester composites were cured at
175ºF for 6 hours as per recommendations of manufacturer.
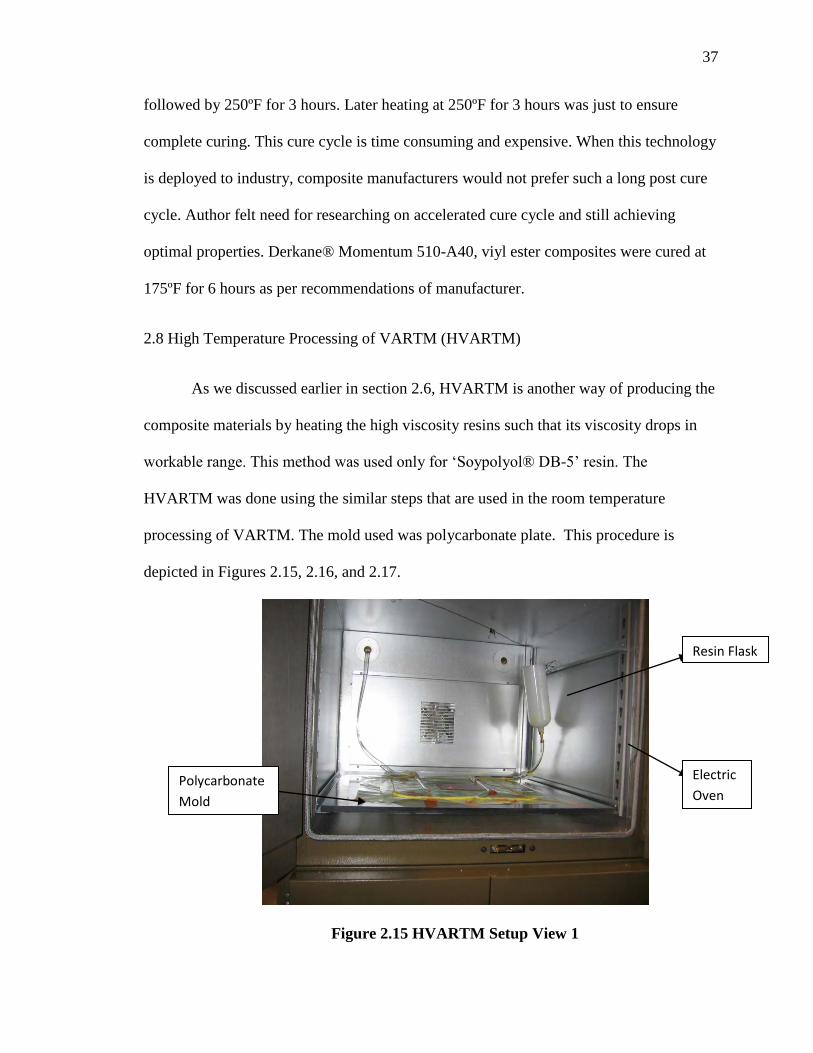
2.8 High Temperature Processing of VARTM (HVARTM)
As we discussed earlier in section 2.6, HVARTM is another way of producing the
composite materials by heating the high viscosity resins such that its viscosity drops in
workable range. This method was used only for ‗Soypolyol® DB-5‘ resin. The
HVARTM was done using the similar steps that are used in the room temperature
processing of VARTM. The mold used was polycarbonate plate. This procedure is
depicted in Figures 2.15, 2.16, and 2.17.
Figure 2.15 HVARTM Setup View 1
Resin Flask
Electric
Oven Polycarbonate
Mold

38
Figure 2.16 HVARTM Setup View 2
Figure 2.17 HVARTM Fully Impregnated Panel
Once the fabrics and other relevant materials were laid over in the required
sequence, the entire mold was sealed with high temperature sealant and a vacuum bag.
Then this entire setup was kept in the oven at 167 ºF for 1-2 hours. Another major change
was, no solvent was added in PU formulation. Thermal heat would drop viscosity of
polyol in workable range of VARTM. Composite panels were kept in the mold for 24
Vacuum
Distribution
Line
Resin
Distribution
Line
Sealant Tape

39
hours in the mold. The panels were removed from the mold and post curing was
performed. The post cure cycle was same as that of room temperature processing: 7-days
at room temperature, and 250 ºF for 3 hours.
2.9 Overall Fiber Volume Fraction
It is very important to evaluate the overall fiber volume fraction (Overall
fV ) in the
composite panels after manufacturing. Since the fibers are the main load carrying
elements in the composites, their percentage has a direct effect on mechanical properties
of the composites. Various methods are available to determine the overall fiber volume
fraction in composite panels:
1. Ignition Method (ASTM 2584-68)
2. Areal Weight Method (ASTM D792-86)
3. Density Method
2.9.1. Ignition Method
The resin is burned off in a high temperature oven. The ash is rinsed from the
remaining fiber (using acetone or alcohol) and the fiber is dried and weighed. The
volume of the fiber is calculated by dividing the mass of the fiber by the density of the
fiber material. This method cannot be used with carbon fiber because carbon oxidizes at
elevated temperatures.
2.9.2 Areal Weight Method
The fiber volume fraction is determined from the areal weight of the reinforcing
fabric and the volume of the composite using the following relationship.

40
f
f
Composite
FiberOverallf
t
Wn
tA
/)AWn(
)V(
)V(V where
(V) Fiber = Volume of the fiber material in the specimen
(V) Composite = Volume of the composite specimen
n = Number of layers or plies in the composite specimen
W = Areal weight of the fabric
A = Cross-sectional area of the composite specimen
t = Thickness of the composite specimen
f = Mass density of fiber material
2.9.3 Density Method
The fiber volume fraction is determined from the densities of the composite
assuming that voids are negligible (Daniel and Ishai, 1994). The density of PU
composite, post cured resin, and glass fibers are found by using the techniques explained
by ASTM D792-86. The expression for fiber volume fraction based on the density of the
composite is:
mf
mcOverallfV Where
cmf ,, = Densities of fiber, matrix and composite.
This method is easy to implement and therefore was used to calculate the overall
fiber volume fraction of the PU composites manufactured in the present research.

41
Typically, fiber volume fraction of each test specimen was evaluated. The density of E-
glass fiber is 2.5 g/cm3. In general, the composite panels manufactured by the VARTM
process provide a fiber volume fraction of 0.5. For Tension specimens, the overall fiber
volume fractions for N-type, P-type, S-type, and VW-type was 0.53, 0.58, 0.49, and 0.45,
respectively. For flexural, compression, shear, and short-beam tests specimens overall
fiber volume fractions for N-type, P-type, S-type, and VW-type were 0.53, 0.55, 0.41,
and 0.45, respectively.
2.10 Discussion
The driving force in VARTM is pressure differential between resin entering at
atmospheric pressure and vacuum in the mold. The VARTM process requires viscosity of
resin in the range of 100-1000 cP. Low-cost VARTM was successfully implemented to
manufacture PU/E-glass and vinyl ester/E-glass composites. The following are some of
the observations made:
a. Good quality panels can be obtained at room temperature with the addition of
solvent in case of N type and S type composites. The viscosity of resin used in
P and VW type was in the range of 100-1000 cP. Quality panels were
produced without solvent in case of P and VW type composites.
b. The complete wet-out of the fabric is achieved by placing the resin
distribution media and the vacuum line in a specific way as shown in Figure
2.14.
c. A flow control device like the peristaltic pump is not required for
polyurethane and vinyl ester resin systems.

42
d. The experimental study indicated that the overall fiber volume fraction of
composites manufactured by VARTM yielded a 50% fiber volume.
Chapter 3 explains the performance of various types of composites under
mechanical loading.

43
CHAPTER 3
PERFORMANCE EVALUATION
3.1 Introduction
Chapter 2 discussed the low-cost VARTM manufacturing process for soy-based
composites in detail. The anisotrophy and inhomogeniety of composites materials make
the characterization of their engineering properties a complex issue. The mechanical
properties of composites are determined by specially designed test methods as per ASTM
standards. Secondly, the damage mechanism of composites is highly complex and may be
in one or more forms such as fiber/debonding, matrix cracking, delaminations, and fiber
breakage. Some of these damage mechanisms may interact simultaneously. Therefore,
interpretation of test results is a crucial issue. This chapter discusses the performance
evaluation of the soy-based polyurethane/E-glass and vinyl ester/E-glass composites
under mechanical loadings. All the mechanical tests were performed according to the
ASTM standards discussed below.
3.2 Mechanical Testing
As per the American Standard for Testing Material (ASTM) there are specific
standards related to composites. All mechanical tests pertaining to this research were
performed on MTS servo hydraulic test system (shown in Figure 3.1). The loading
capacity of the load frame was 110 kN. This machine was capable of conducting tensile,
compression, flexural, v-notch rail shear, fracture toughness, and fatigue tests. It was
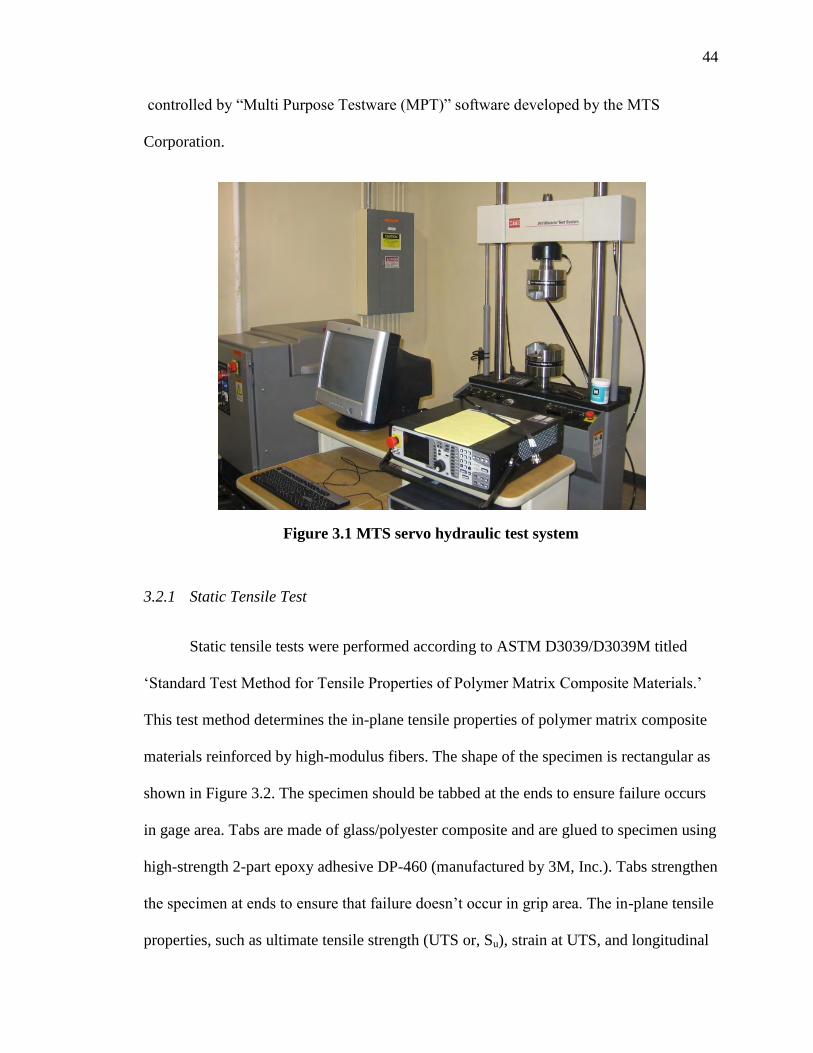
44
controlled by ―Multi Purpose Testware (MPT)‖ software developed by the MTS
Corporation.
Figure 3.1 MTS servo hydraulic test system
3.2.1 Static Tensile Test
Static tensile tests were performed according to ASTM D3039/D3039M titled
‗Standard Test Method for Tensile Properties of Polymer Matrix Composite Materials.‘
This test method determines the in-plane tensile properties of polymer matrix composite
materials reinforced by high-modulus fibers. The shape of the specimen is rectangular as
shown in Figure 3.2. The specimen should be tabbed at the ends to ensure failure occurs
in gage area. Tabs are made of glass/polyester composite and are glued to specimen using
high-strength 2-part epoxy adhesive DP-460 (manufactured by 3M, Inc.). Tabs strengthen
the specimen at ends to ensure that failure doesn‘t occur in grip area. The in-plane tensile
properties, such as ultimate tensile strength (UTS or, Su), strain at UTS, and longitudinal
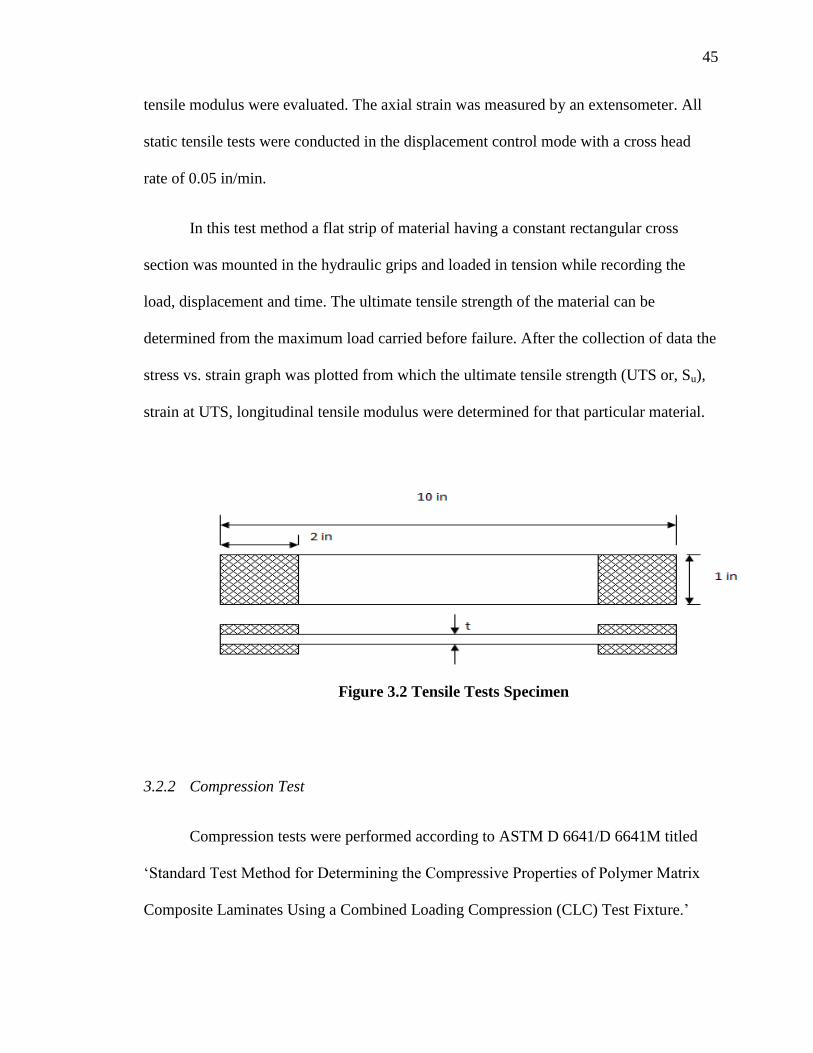
45
tensile modulus were evaluated. The axial strain was measured by an extensometer. All
static tensile tests were conducted in the displacement control mode with a cross head
rate of 0.05 in/min.
In this test method a flat strip of material having a constant rectangular cross
section was mounted in the hydraulic grips and loaded in tension while recording the
load, displacement and time. The ultimate tensile strength of the material can be
determined from the maximum load carried before failure. After the collection of data the
stress vs. strain graph was plotted from which the ultimate tensile strength (UTS or, Su),
strain at UTS, longitudinal tensile modulus were determined for that particular material.
Figure 3.2 Tensile Tests Specimen
3.2.2 Compression Test
Compression tests were performed according to ASTM D 6641/D 6641M titled
‗Standard Test Method for Determining the Compressive Properties of Polymer Matrix
Composite Laminates Using a Combined Loading Compression (CLC) Test Fixture.‘
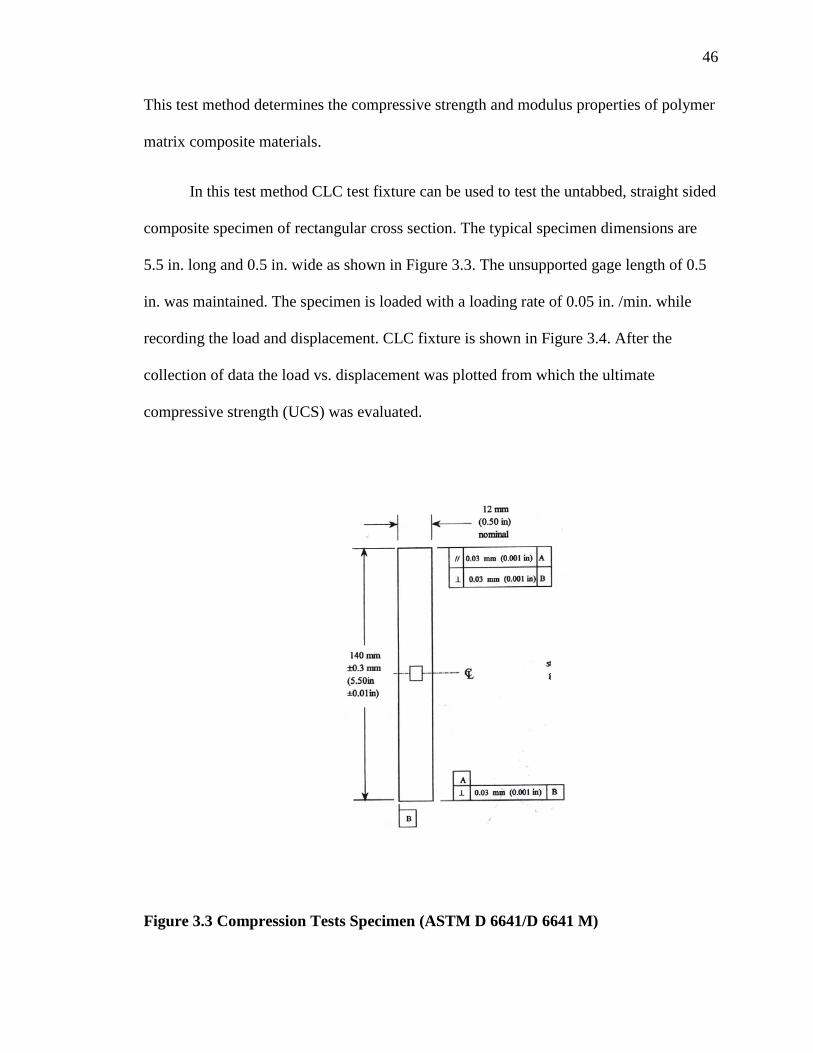
46
This test method determines the compressive strength and modulus properties of polymer
matrix composite materials.
In this test method CLC test fixture can be used to test the untabbed, straight sided
composite specimen of rectangular cross section. The typical specimen dimensions are
5.5 in. long and 0.5 in. wide as shown in Figure 3.3. The unsupported gage length of 0.5
in. was maintained. The specimen is loaded with a loading rate of 0.05 in. /min. while
recording the load and displacement. CLC fixture is shown in Figure 3.4. After the
collection of data the load vs. displacement was plotted from which the ultimate
compressive strength (UCS) was evaluated.
Figure 3.3 Compression Tests Specimen (ASTM D 6641/D 6641 M)
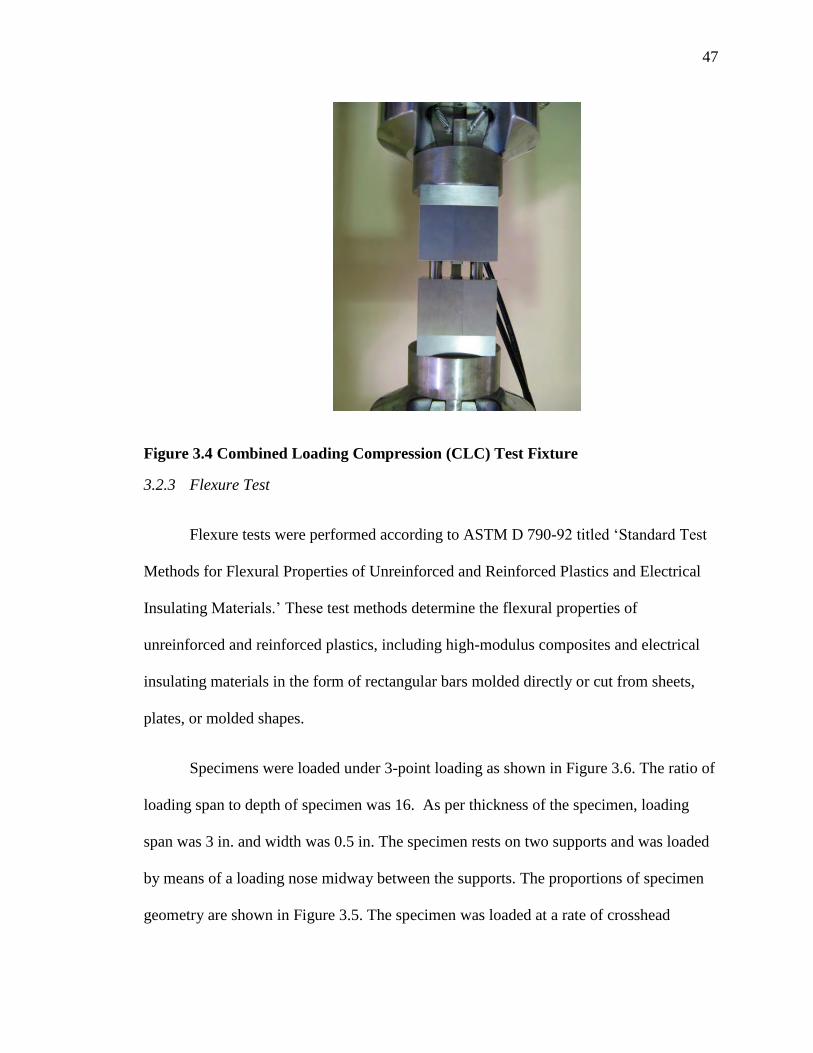
47
Figure 3.4 Combined Loading Compression (CLC) Test Fixture
3.2.3 Flexure Test
Flexure tests were performed according to ASTM D 790-92 titled ‗Standard Test
Methods for Flexural Properties of Unreinforced and Reinforced Plastics and Electrical
Insulating Materials.‘ These test methods determine the flexural properties of
unreinforced and reinforced plastics, including high-modulus composites and electrical
insulating materials in the form of rectangular bars molded directly or cut from sheets,
plates, or molded shapes.
Specimens were loaded under 3-point loading as shown in Figure 3.6. The ratio of
loading span to depth of specimen was 16. As per thickness of the specimen, loading
span was 3 in. and width was 0.5 in. The specimen rests on two supports and was loaded
by means of a loading nose midway between the supports. The proportions of specimen
geometry are shown in Figure 3.5. The specimen was loaded at a rate of crosshead

48
movement of 0.05 in/min., while recording load and the displacement. From the load and
displacement data we can find the flexural strength and flexural modulus of the
composite materials.
Where h=thickness, Specimen Length =L, Span Length (L1) =16h, width=b
Figure 3.5 Flexure Test Specimen Loading
Figure 3.6 Flexure Test Specimen and Fixture
3.2.4 Inter laminar Shear Strength-ILSS Test (Short-Beam Test)
Short Beam tests were performed according to ASTM D 2344/D 2344M titled
‗Standard Test Method for Short-Beam strength of Polymer Matrix Composite Materials

49
and their Laminates.‘ This test method determines the short-beam strength of high-
modulus fiber-reinforced composite materials. The specimen is a short beam machined
from a flat laminate up to 0.25 in. thickness. The beam is loaded in three-point bending.
The size of the specimen depends on the thickness of the specimen. The
proportions of specimen geometry are shown in Figure 3.7. The specimen is loaded at a
rate of crosshead movement of 0.05 in./min. while recording load and the displacement.
From the load and displacement data we can find the short-beam shear strength which is
also referred to as inter-laminar shear strength (ILSS). The specimen geometry is shown
in Figure 3.7 and related fixture is displayed in Figure 3.8.
Where h=thickness, Specimen Length (L)= 6h, Span Length (L1) =4h, width (b)
=2h
Figure 3.7 Short Beam Specimen Loading (ASTM D 2344/D 2344M)

50
Figure 3.8 Short Beam Test Fixture Loaded with VW-type Specimen
3.2.5 V-Notch Beam Test (ASTM D 5379/D 5379M-98)
V-Notch Beam tests were performed according to ASTM D 5379/D 5379M-98
titled ‗Standard Test Method for Shear Properties of Composite Materials by V-Notched
Beam Method.‘This method determines the shear properties of high-modulus fiber-
reinforced composite materials.
The specimen in the form of a flat rectangle with symmetrical centrally located V-
notches is clamped as shown in the Figure 3.10. The two halves of the fixture are
compressed by a testing machine while monitoring load. The relative displacement
between the two fixture halves loads the notched specimen. The notches influence the
shear strain along the loading direction, making the distribution more uniform than would
be seen without the notches. A standard head displacement rate of 0.05 in./min. was used.
Load should be applied to the specimen until it fails. The load and displacement data was
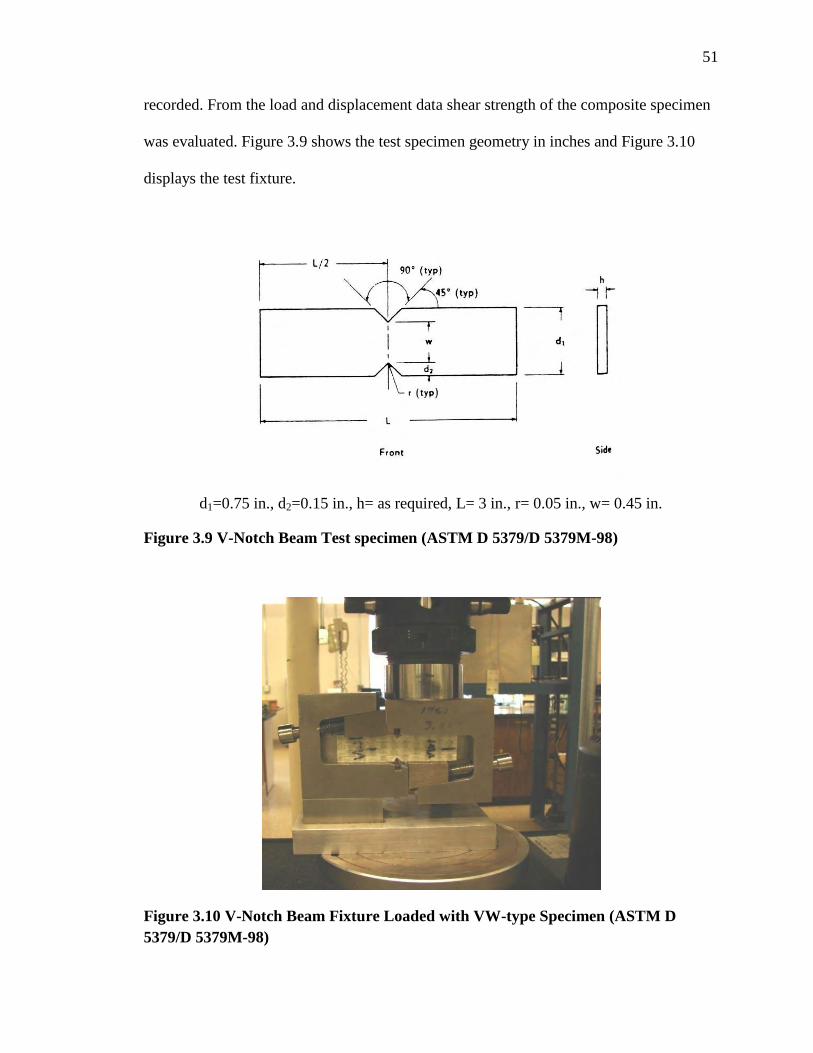
51
recorded. From the load and displacement data shear strength of the composite specimen
was evaluated. Figure 3.9 shows the test specimen geometry in inches and Figure 3.10
displays the test fixture.
d1=0.75 in., d2=0.15 in., h= as required, L= 3 in., r= 0.05 in., w= 0.45 in.
Figure 3.9 V-Notch Beam Test specimen (ASTM D 5379/D 5379M-98)
Figure 3.10 V-Notch Beam Fixture Loaded with VW-type Specimen (ASTM D
5379/D 5379M-98)
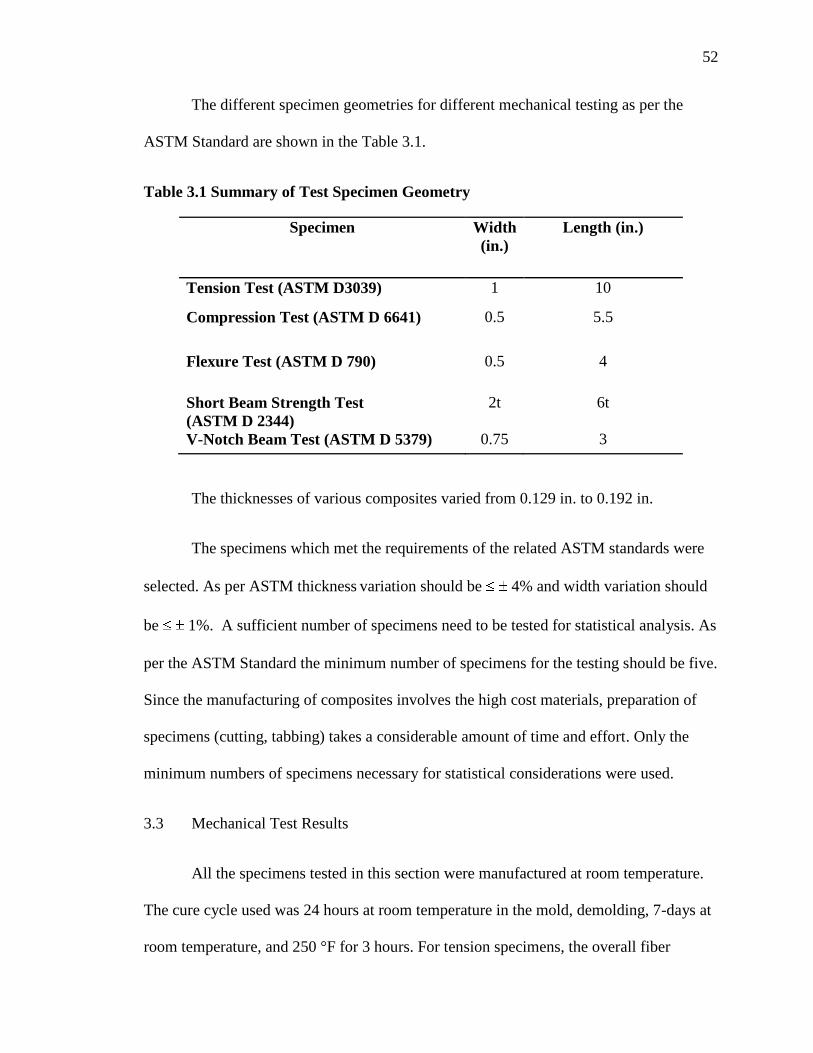
52
The different specimen geometries for different mechanical testing as per the
ASTM Standard are shown in the Table 3.1.
Table 3.1 Summary of Test Specimen Geometry
Specimen Width
(in.)
Length (in.)
Tension Test (ASTM D3039) 1 10
Compression Test (ASTM D 6641) 0.5 5.5
Flexure Test (ASTM D 790) 0.5 4
Short Beam Strength Test
(ASTM D 2344)
2t 6t
V-Notch Beam Test (ASTM D 5379) 0.75 3
The thicknesses of various composites varied from 0.129 in. to 0.192 in.
The specimens which met the requirements of the related ASTM standards were
selected. As per ASTM thickness variation should be 4% and width variation should
be 1%. A sufficient number of specimens need to be tested for statistical analysis. As
per the ASTM Standard the minimum number of specimens for the testing should be five.
Since the manufacturing of composites involves the high cost materials, preparation of
specimens (cutting, tabbing) takes a considerable amount of time and effort. Only the
minimum numbers of specimens necessary for statistical considerations were used.
3.3 Mechanical Test Results
All the specimens tested in this section were manufactured at room temperature.
The cure cycle used was 24 hours at room temperature in the mold, demolding, 7-days at
room temperature, and 250 °F for 3 hours. For tension specimens, the overall fiber

53
volume fractions for N-type, P-type, S-type, and VW-type was 0.53, 0.58, 0.49, and 0.45,
respectively. All tension test specimens were cut from the same panel. For flexural,
compression, shear, and short-beam tests specimens were cut from the same panels. The
overall fiber volume fractions for N-type, P-type, S-type, and VW-type were 0.53, 0.55,
0.41, and 0.45, respectively.
3.3.1 Tensile Testing and Their Results
These tensile tests were performed according to ASTM D3039/D3039M titled
‗Standard Test Method for Tensile Properties of Polymer Matrix Composite Materials.‘
The tension test coupons were cut according to the tension specimen geometry mentioned
in Table 3.1. After cutting of the test specimens, the density of each specimen was
measured to compute overall fiber volume fraction. When tabbing is done, the test
specimen thickness and width were measured. The specimens that meet ASTM
requirement were selected. Then the specimen is placed in the testing machine such that
the fixture grips hold the specimen parallel and tight. The extensometer was kept in the
mid-section of the test specimen to determine the corresponding strain values.
The tensile stress is the highest engineering stress that develops in the material
before rupture. The tensile stress, also known as the ultimate tensile strength (UTS), can
be determined manually by dividing the maximum load by the un-deformed area of the
specimen. The equation below shows the UTS, which is the maximum stress
o
maxmax
A
Pσ
where Pmax. = maximum load, Ao = un-deformed cross-sectional area.

54
The chord modulus of elasticity in tension is computed within strain range of
0.001 in./in. to 0.003 in./in absolute strains.
The failure modes of tensile specimens were noted as per the ASTM standard
(Refer to Figure 3.11). Figure 3.12 gives typical stress-strain graph for the N-type
composite. As per ASTM standard, the slope of the initial linear portion of the stress-
strain graph is termed as chord modulus and is reported. Figure 3.13 shows the stress-
strain data and corresponding value of chord modulus. Figure 3.14 and 3.15 shows failed
specimens of P, S, and VW-type. VW-type specimens showed excessive delamination.
Tension test results are tabulated in the Table 3.2.
Figure 3.11 Typical Tensile Test Failure Modes (ASTM D3039)
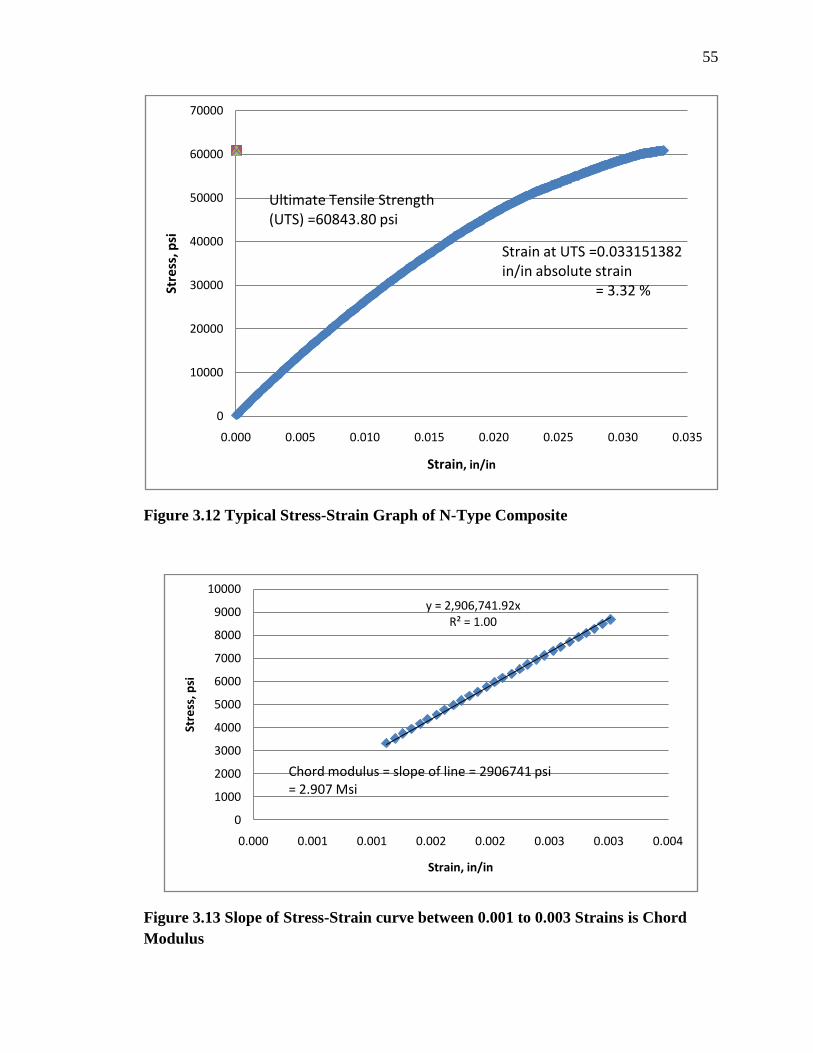
55
Figure 3.12 Typical Stress-Strain Graph of N-Type Composite
Figure 3.13 Slope of Stress-Strain curve between 0.001 to 0.003 Strains is Chord
Modulus
0
10000
20000
30000
40000
50000
60000
70000
0.000 0.005 0.010 0.015 0.020 0.025 0.030 0.035
Stre
ss, p
si
Strain, in/in
Strain at UTS =0.033151382 in/in absolute strain
= 3.32 %
Ultimate Tensile Strength (UTS) =60843.80 psi
y = 2,906,741.92xR² = 1.00
0
1000
2000
3000
4000
5000
6000
7000
8000
9000
10000
0.000 0.001 0.001 0.002 0.002 0.003 0.003 0.004
Stre
ss, p
si
Strain, in/in
Chord modulus = slope of line = 2906741 psi= 2.907 Msi
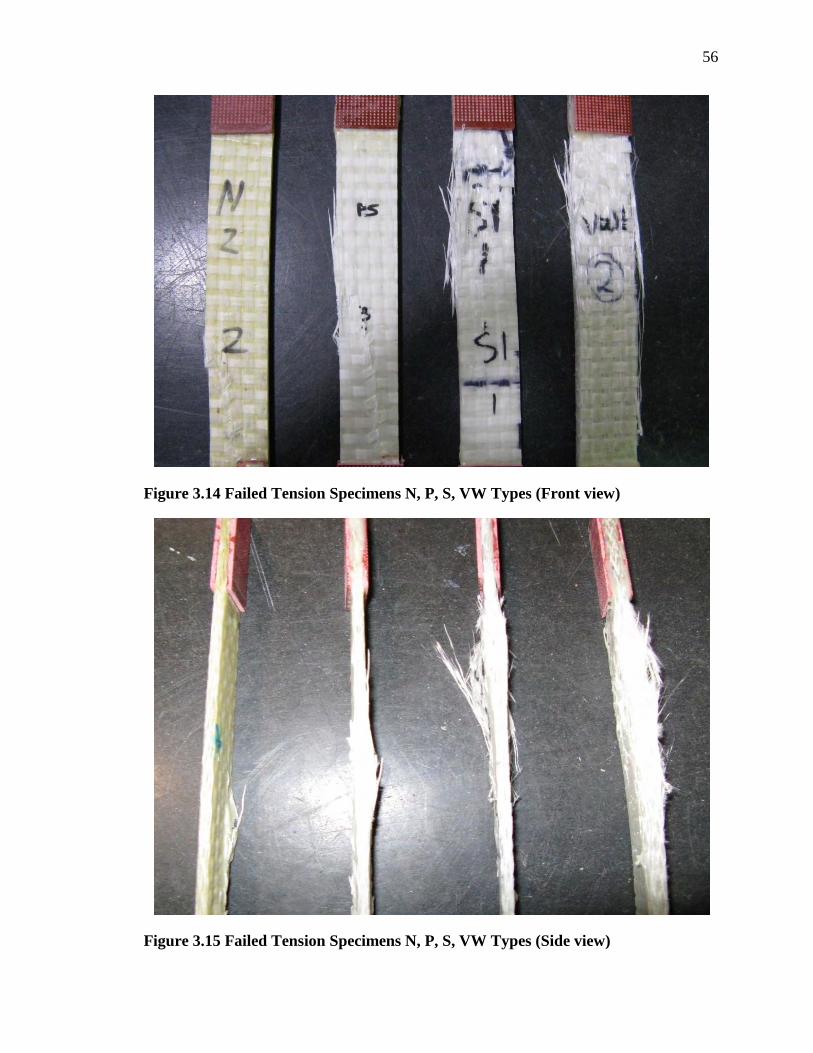
56
Figure 3.14 Failed Tension Specimens N, P, S, VW Types (Front view)
Figure 3.15 Failed Tension Specimens N, P, S, VW Types (Side view)
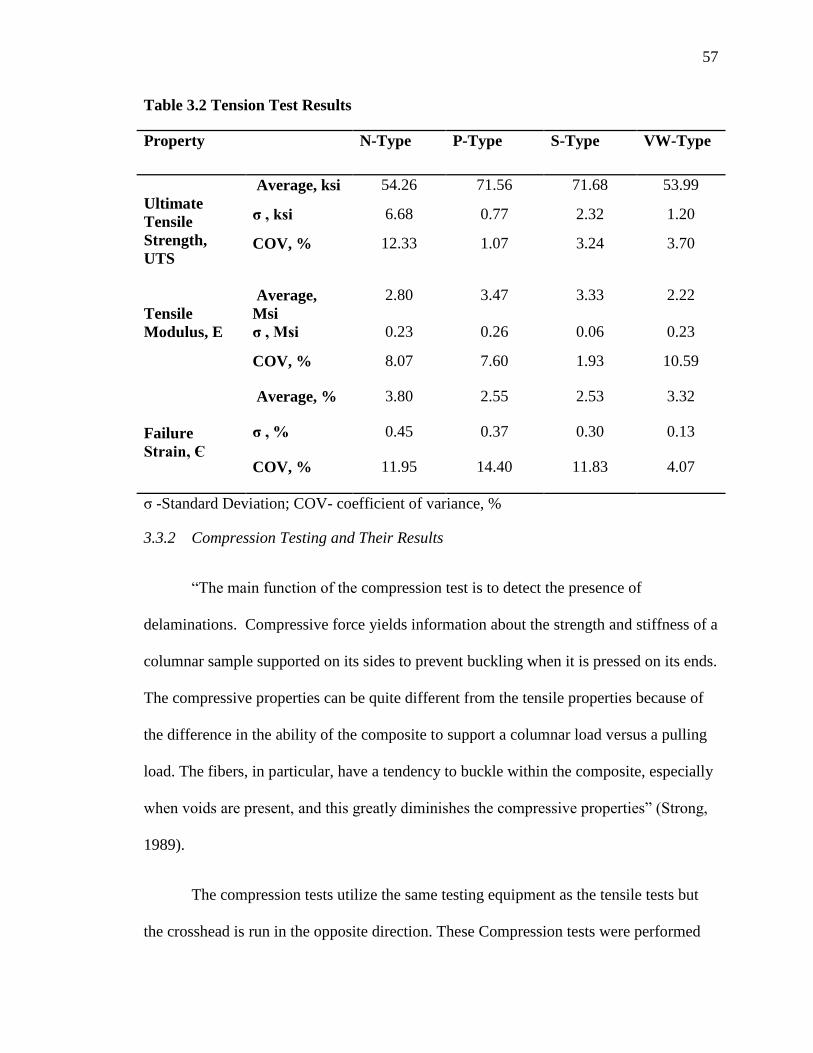
57
Table 3.2 Tension Test Results
Property
N-Type P-Type S-Type VW-Type
Ultimate
Tensile
Strength,
UTS
Average, ksi 54.26 71.56 71.68 53.99
σ , ksi 6.68 0.77 2.32 1.20
COV, % 12.33 1.07 3.24 3.70
Tensile
Modulus, E
Average,
Msi
2.80 3.47 3.33 2.22
σ , Msi 0.23 0.26 0.06 0.23
COV, % 8.07 7.60 1.93 10.59
Failure
Strain, Є
Average, % 3.80 2.55 2.53 3.32
σ , % 0.45 0.37 0.30 0.13
COV, % 11.95 14.40 11.83 4.07
σ -Standard Deviation; COV- coefficient of variance, %
3.3.2 Compression Testing and Their Results
―The main function of the compression test is to detect the presence of
delaminations. Compressive force yields information about the strength and stiffness of a
columnar sample supported on its sides to prevent buckling when it is pressed on its ends.
The compressive properties can be quite different from the tensile properties because of
the difference in the ability of the composite to support a columnar load versus a pulling
load. The fibers, in particular, have a tendency to buckle within the composite, especially
when voids are present, and this greatly diminishes the compressive properties‖ (Strong,
1989).
The compression tests utilize the same testing equipment as the tensile tests but
the crosshead is run in the opposite direction. These Compression tests were performed
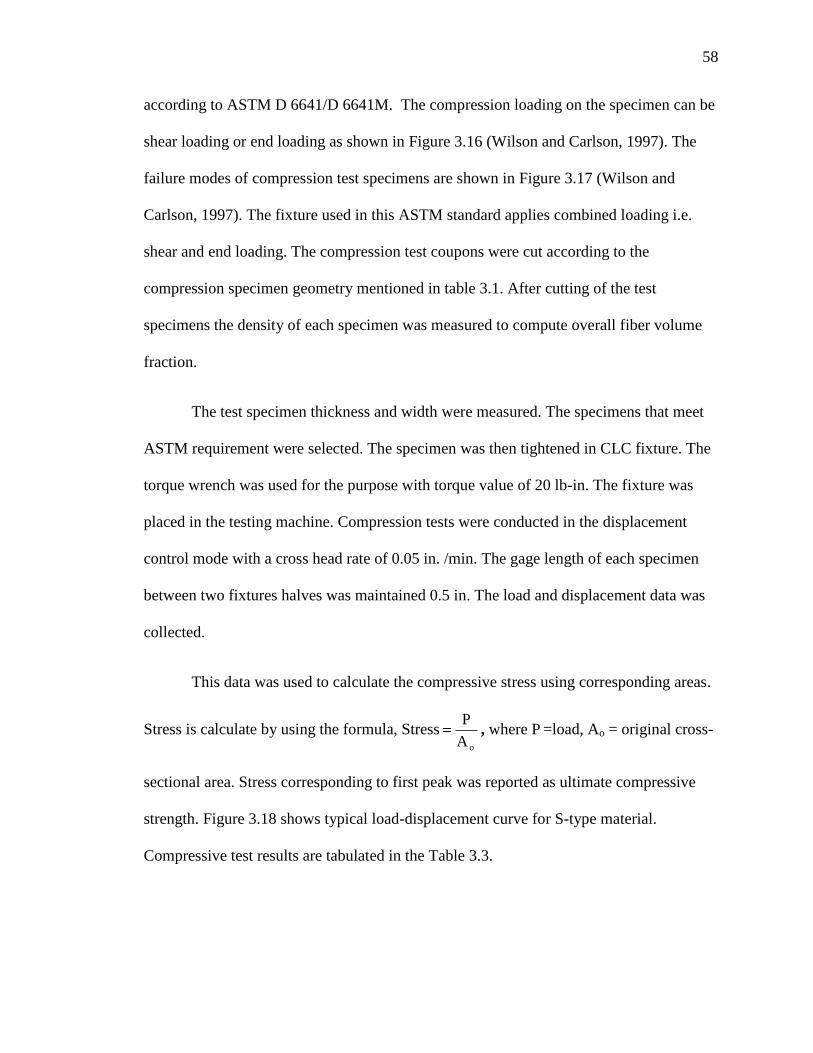
58
according to ASTM D 6641/D 6641M. The compression loading on the specimen can be
shear loading or end loading as shown in Figure 3.16 (Wilson and Carlson, 1997). The
failure modes of compression test specimens are shown in Figure 3.17 (Wilson and
Carlson, 1997). The fixture used in this ASTM standard applies combined loading i.e.
shear and end loading. The compression test coupons were cut according to the
compression specimen geometry mentioned in table 3.1. After cutting of the test
specimens the density of each specimen was measured to compute overall fiber volume
fraction.
The test specimen thickness and width were measured. The specimens that meet
ASTM requirement were selected. The specimen was then tightened in CLC fixture. The
torque wrench was used for the purpose with torque value of 20 lb-in. The fixture was
placed in the testing machine. Compression tests were conducted in the displacement
control mode with a cross head rate of 0.05 in. /min. The gage length of each specimen
between two fixtures halves was maintained 0.5 in. The load and displacement data was
collected.
This data was used to calculate the compressive stress using corresponding areas.
Stress is calculate by using the formula, StressoA
P, where P =load, Ao = original cross-
sectional area. Stress corresponding to first peak was reported as ultimate compressive
strength. Figure 3.18 shows typical load-displacement curve for S-type material.
Compressive test results are tabulated in the Table 3.3.
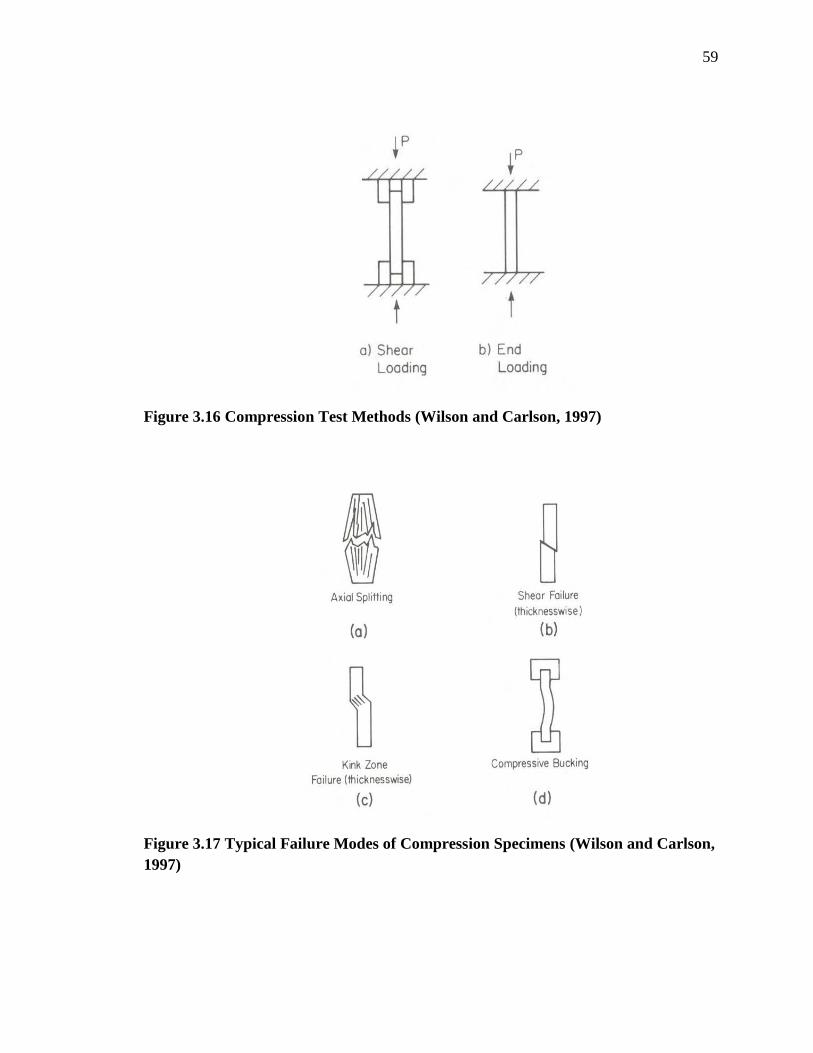
59
Figure 3.16 Compression Test Methods (Wilson and Carlson, 1997)
Figure 3.17 Typical Failure Modes of Compression Specimens (Wilson and Carlson,
1997)
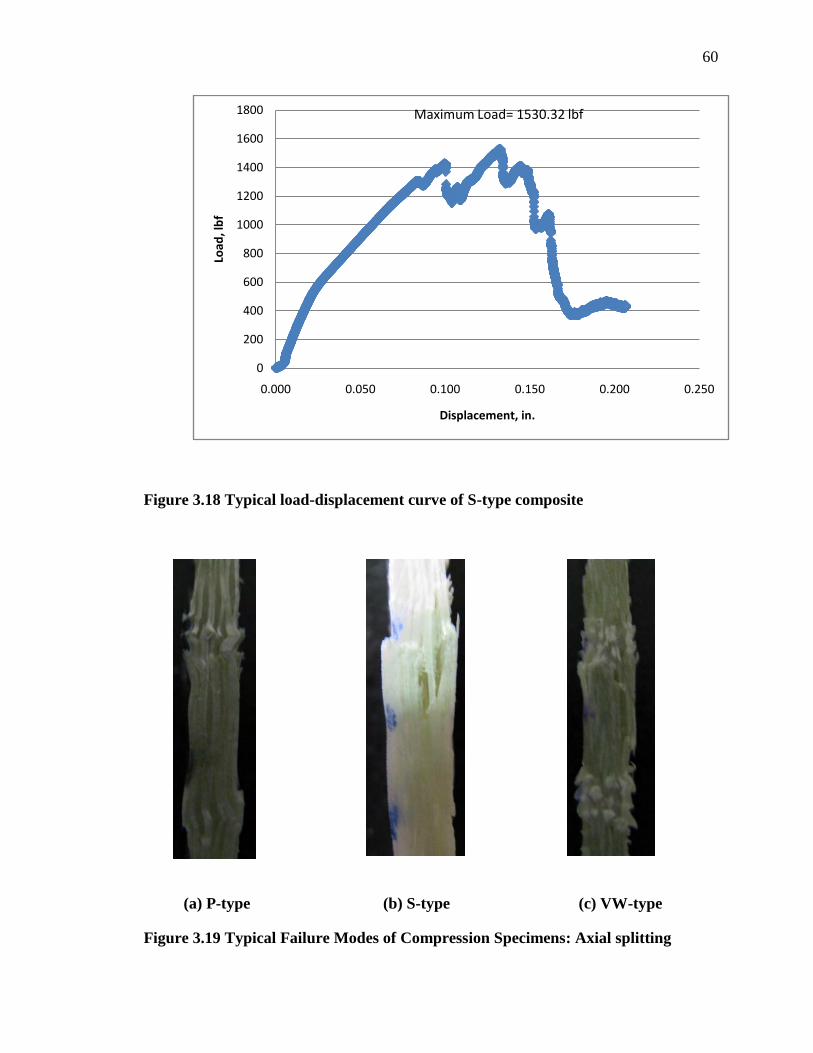
60
Figure 3.18 Typical load-displacement curve of S-type composite
(a) P-type (b) S-type (c) VW-type
Figure 3.19 Typical Failure Modes of Compression Specimens: Axial splitting
0
200
400
600
800
1000
1200
1400
1600
1800
0.000 0.050 0.100 0.150 0.200 0.250
Load
, lb
f
Displacement, in.
Maximum Load= 1530.32 lbf

61
Table 3.3 Compression Test Results
Property
P-Type S-Type VW-Type
Ultimate
Compressive
Strength, UCS
Average, ksi 13.47 16.19 41.58
σ , ksi 1.46 1.99 3.12
COV, % 10.84 12.30 7.49
σ -Standard Deviation; COV- coefficient of variance, %
It is important to inspect tested specimen and noting type and location of failure.
For valid tests, final failure of specimen should occur within the gage section. Figure 3.19
displays failure of P, S, and VW types composites. The failure mode in compression may
be axial splitting, through-thickness shear, kink zone, and compression buckling as
shown in Figure 3.17 (Wilson and Carlson, 1997). Compression buckling is invalidating
failure. It is evident from Figure 3.19 that all compression specimens have failed in axial
splitting.
Load-displacement curve shows multiple peaks in load data. First peak is used for
computation of compressive strength. The first peak indicates major damage in the
specimen.
3.3.3 Flexure Testing and Their Results
The main use of the Flexure test is as a quality control test and for determining
resistance of composite laminates to environmental factors. During the test, the top of the
sample under the loading force is in compression and the bottom opposite the loading

62
force is in tension (Strong, 1989). Depending on span-to-thickness ratio and strengths in
tension/compression/shear, the beam may fail in tension at bottom or compression at top
or in shear. Failures in shear requires very short span (span-to-thickness ratio 4:1) and
failure in tension and compression occurs for longer spans (span-to-thickness ratio 16:1
and above). Flexural tests in this research are conducted with span-to-thickness ratio
16:1.
In flexure test load is applied out-of-plane that imposes both compression and
tensile stresses. These flexure tests were performed according to ASTM D 790-92. The
flexure test coupons were cut according to the specimen geometry mentioned in table 3.1.
After cutting of the test specimens the density of each specimen was measured to
compute overall fiber volume fraction. The test specimen thickness and width were
measured. The specimens that meet ASTM requirement were selected. The specimen is
placed in the testing machine such that the loading nose and two support cylinders were
parallel and straight as shown in the Figure 3.6.
The specimen is loaded at a rate of crosshead movement of 0.05 in/min. The load
and displacement data was recorded. The load and displacement data was used to
calculate the flexural strength, maximum strain and flexural modulus.
Flexural strength is calculated by using the formula, σfs where,
Fmax.= Maximum load, L= Loading span of the specimen, b= width of the specimen, d=
thickness of the specimen.

63
Maximum strain is calculated by using the formula, Є= , Where
D = maximum deflection, d= Thickness, L= Loading span length
Flexural modulus is calculated by using formula, Efs = , where m
slope of initial linear portion on load-deflection curve, L= Length of the specimen, b=
width of the specimen, d= thickness of the specimen.
The Load-Displacement graph is shown in the Figure 3.20 for VW-type of material. The
slope (m) of initial linear portion is shown in Figure 3.21. Failure of P, S, and VW type
composites is shown in Figure 3.22. Flexural test results are tabulated in the Table 3.4.
Figure 3.20 Load-Displacement Graph of VW-Type
0
10000
20000
30000
40000
50000
60000
70000
80000
90000
0 1000 2000 3000 4000 5000 6000 7000 8000 9000
Load
, lb
f
Displacement, inch
Max. Load = Fmax=79032.43 lbf

64
Figure 3.21 Slope of Initial linear portion of Load-Deflection Curve
(a) (b) (c)
Figure 3.22 Failure of P, S, VW types
(a) P type – Failure in compression at top (b) S- Failure in compression at top (c)
VW- Failure in tension at bottom
y = 410.06xR² = 1.00
0
1000
2000
3000
4000
5000
6000
7000
8000
9000
10000
0.00000 5.00000 10.00000 15.00000 20.00000 25.00000
Load
, lb
f
Displacement, inch
Slope of linear portion = m = 410.06

65
Table 3.4 Flexure Test Results
Property
N-type P-Type S-Type VW-Type
Flexural
Strength, Fs
Average, ksi 44.63 25.13 33.96 64.992
σ , ksi 4.99 3.83 5.34 8.53
COV, % 11.19 15.26 15.72 13.12
Flexural
Modulus, E
Average, Msi 2.59 2.36 2.39 2.83
σ ,Msi 0.08 0.36 0.11 0.25
COV, % 3.09 15.47 4.67 8.84
Maximum
Strain, Є
Average, % -- 1.27 2.38 2.63
σ , % -- 0.07 0.82 0.47
COV, % -- 5.66 34.6 17.967
σ -Standard Deviation; COV- coefficient of variance, %
3.3.4 Inter laminar Shear Strength (ILSS) Testing and Their Results
The short-beam shear test (also called as inter laminar shear strength-ILSS) is
used to determine the fiber/matrix adhesion of the composite materials. The most
important of the tests for these materials view shear as a peel phenomenon (shearing
along an adhesive plane). Short-Beam shear test is used as a quality control test of the
lamination process and related matrix-dominated properties of the composite. The
specimen span-to-thickness ratio is constrained to 4:1, forcing the shear stress to attain
failure levels before tension and compression stresses reach their ultimate values.
(Strong, 1989)
This ILSS (Short Beam) testing is similar to the flexure testing except that the
sample-to-thickness ratio is much less-approximately 4:1, for ILSS. These Short Beam
tests were performed according to ASTM D 2344/D 2344M. The Short-Beam test
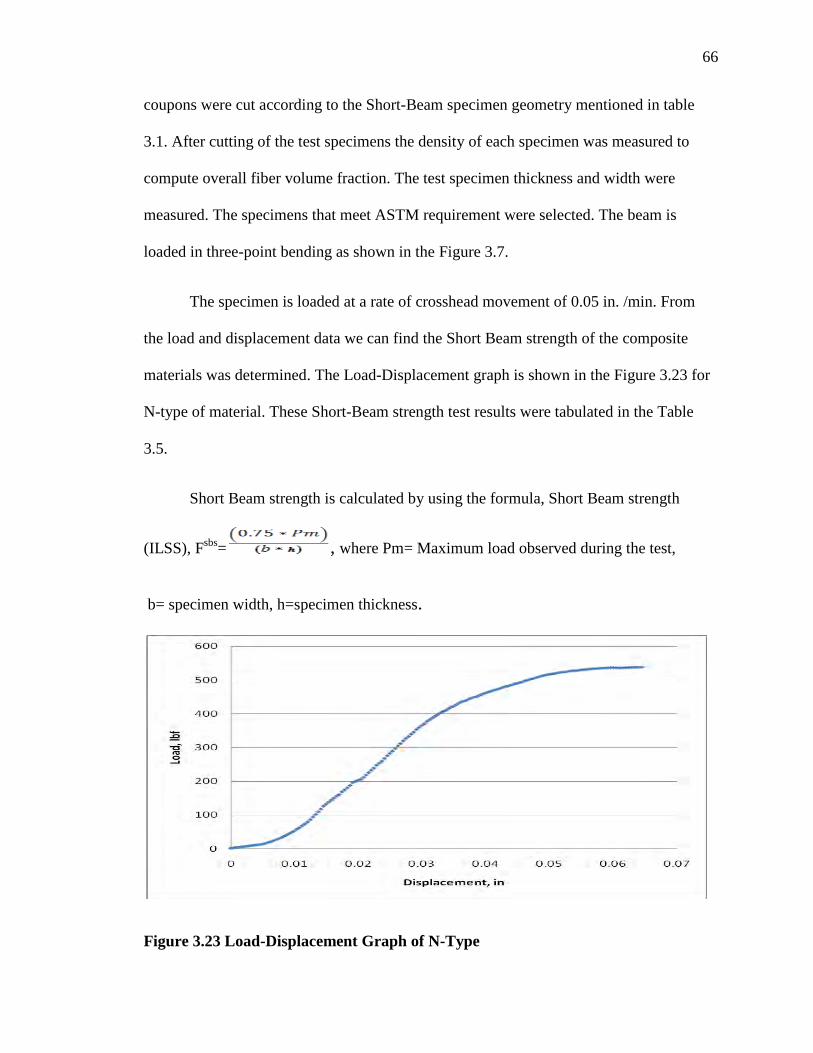
66
coupons were cut according to the Short-Beam specimen geometry mentioned in table
3.1. After cutting of the test specimens the density of each specimen was measured to
compute overall fiber volume fraction. The test specimen thickness and width were
measured. The specimens that meet ASTM requirement were selected. The beam is
loaded in three-point bending as shown in the Figure 3.7.
The specimen is loaded at a rate of crosshead movement of 0.05 in. /min. From
the load and displacement data we can find the Short Beam strength of the composite
materials was determined. The Load-Displacement graph is shown in the Figure 3.23 for
N-type of material. These Short-Beam strength test results were tabulated in the Table
3.5.
Short Beam strength is calculated by using the formula, Short Beam strength
(ILSS), Fsbs
= , where Pm= Maximum load observed during the test,
b= specimen width, h=specimen thickness.
Figure 3.23 Load-Displacement Graph of N-Type
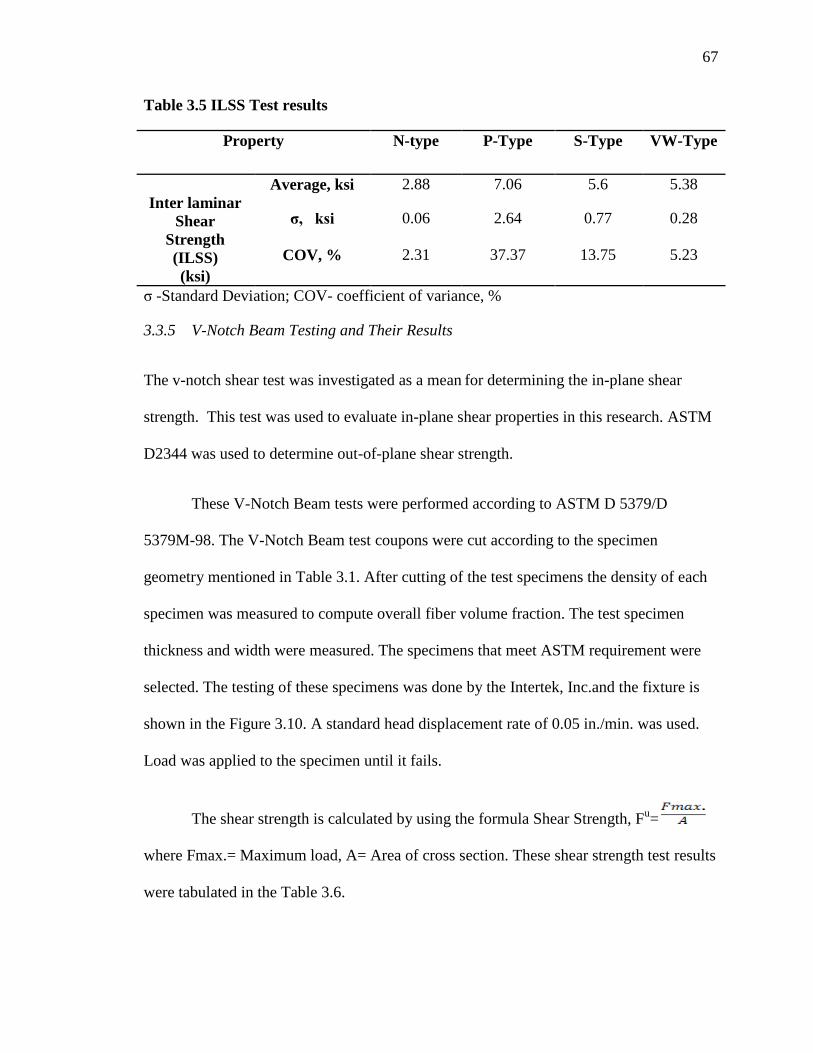
67
Table 3.5 ILSS Test results
Property
N-type P-Type S-Type VW-Type
Inter laminar
Shear
Strength
(ILSS)
(ksi)
Average, ksi 2.88 7.06 5.6 5.38
σ, ksi 0.06 2.64 0.77 0.28
COV, % 2.31 37.37 13.75 5.23
σ -Standard Deviation; COV- coefficient of variance, %
3.3.5 V-Notch Beam Testing and Their Results
The v-notch shear test was investigated as a mean for determining the in-plane shear
strength. This test was used to evaluate in-plane shear properties in this research. ASTM
D2344 was used to determine out-of-plane shear strength.
These V-Notch Beam tests were performed according to ASTM D 5379/D
5379M-98. The V-Notch Beam test coupons were cut according to the specimen
geometry mentioned in Table 3.1. After cutting of the test specimens the density of each
specimen was measured to compute overall fiber volume fraction. The test specimen
thickness and width were measured. The specimens that meet ASTM requirement were
selected. The testing of these specimens was done by the Intertek, Inc.and the fixture is
shown in the Figure 3.10. A standard head displacement rate of 0.05 in./min. was used.
Load was applied to the specimen until it fails.
The shear strength is calculated by using the formula Shear Strength, Fu=
where Fmax.= Maximum load, A= Area of cross section. These shear strength test results
were tabulated in the Table 3.6.
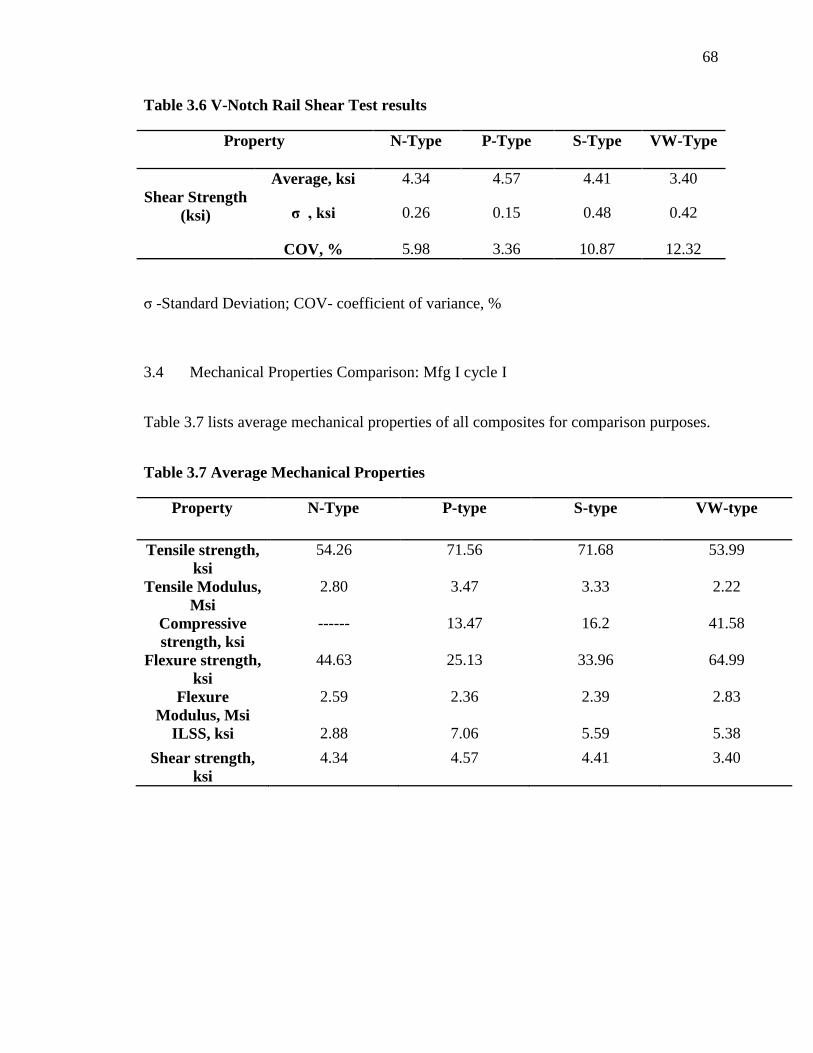
68
Table 3.6 V-Notch Rail Shear Test results
Property
N-Type P-Type S-Type VW-Type
Shear Strength
(ksi)
Average, ksi 4.34 4.57 4.41 3.40
σ , ksi 0.26 0.15 0.48 0.42
COV, % 5.98 3.36 10.87 12.32
σ -Standard Deviation; COV- coefficient of variance, %
3.4 Mechanical Properties Comparison: Mfg I cycle I
Table 3.7 lists average mechanical properties of all composites for comparison purposes.
Table 3.7 Average Mechanical Properties
Property N-Type
P-type
S-type
VW-type
Tensile strength,
ksi
54.26 71.56 71.68 53.99
Tensile Modulus,
Msi
2.80 3.47 3.33 2.22
Compressive
strength, ksi
------ 13.47 16.2 41.58
Flexure strength,
ksi
44.63 25.13 33.96 64.99
Flexure
Modulus, Msi
2.59 2.36 2.39 2.83
ILSS, ksi 2.88 7.06 5.59 5.38
Shear strength,
ksi
4.34 4.57 4.41 3.40
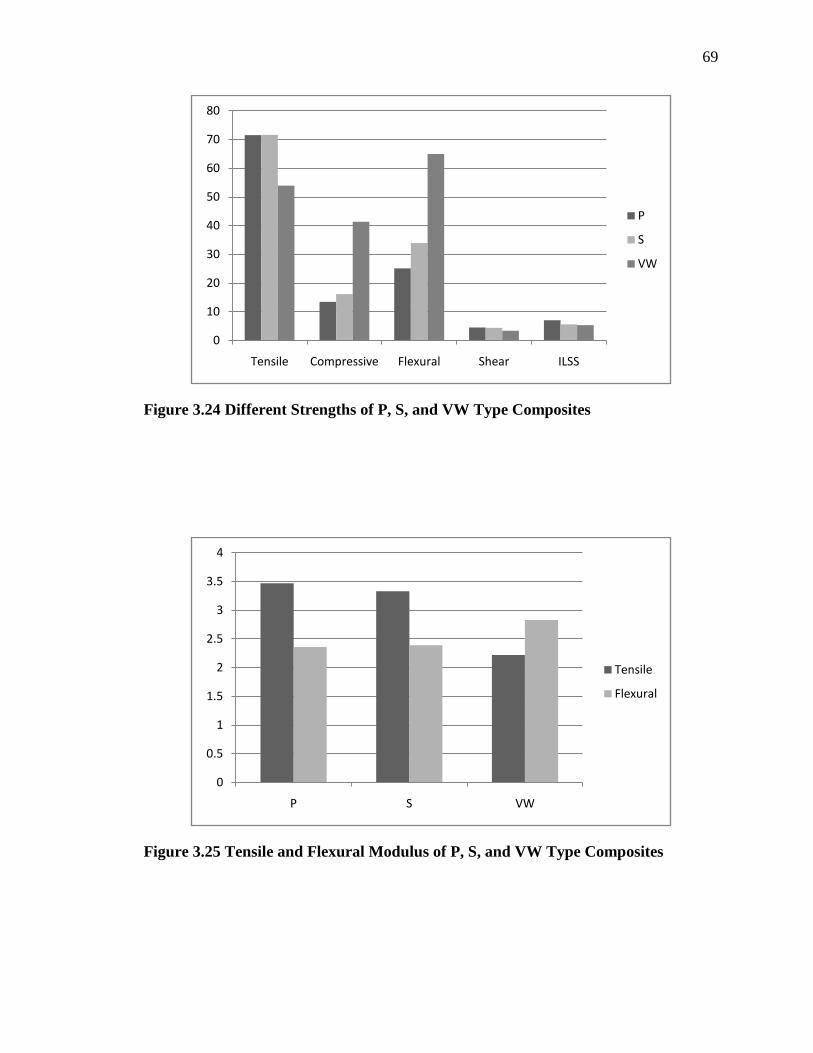
69
Figure 3.24 Different Strengths of P, S, and VW Type Composites
Figure 3.25 Tensile and Flexural Modulus of P, S, and VW Type Composites
0
10
20
30
40
50
60
70
80
Tensile Compressive Flexural Shear ILSS
P
S
VW
0
0.5
1
1.5
2
2.5
3
3.5
4
P S VW
Tensile
Flexural
70
3.5 Statistical Analysis
The test results reported in section 3.4 were analyzed in order to determine which
resin had the better mechanical properties. This statistical analysis was done using
Analysis of Variance (ANOVA).
3.5.1 ANOVA
Composite materials consist of reinforcement in the form of fibers and matrix
material in the form of a binder. Fibers are the major load carrying elements and
dominate the mechanical properties. Although the loads are mainly carried by fibers,
modulus, failure strain, and resin/matrix adhesion play a dominant role in the
performance of composites. There were 4 different resins used to make composites in this
research. Three different polyurethanes were formulated using 3 different soy-based
polyols namely, ‗lab prepared‘, ‗Vikol-1‘ and ‗Soypolyol DB-5‘. These composites are
designated as N, P, and S, respectively. Vinyl ester/E-glass composites are designated as
VW. Soypolyol DB-5 or S-type composites used resin which was intentionally modified
to improve fiber/matrix adhesion. The fiber/matrix adhesion is reflected in interlaminar
shear strength (ILSS). Flexural and compressive properties are also affected by
performance of the matrix material. ANOVA was performed on the compressive,
flexural, and interlaminar shear strengths (ILSS) of the P, S, and VW type composites.
Table 3.8 shows the Compressive, Flexural, and Interlaminar Shear Strengths obtained
from all specimens.

71
Table 3.8 Compressive, Flexural, and Interlaminar Shear Strengths of P, S, and VW
type composites
Type Specimen Compressive
strength, ksi
Flexural
strength, ksi
ILSS, ksi
Vikol-1(P-Type)
P-1 15.15 27.22 7.02
P-2 12.51 28.73 8.92
P-3 14.13 24.71 9.7
P-4 14.1 26.2 7.8
P-5 11.48 18.79
N 5 5 4
Mean 13.4740 25.1300 8.3600
Std. Deviation 1.46087 3.83552 1.18580
Soypolyol DB-5
(S-Type)
S-1 18.49 38.66 5.5
S-2 16.68 39.09 4.7
S-3 13.17 30.83 5.2
S-4 17.1 34.69 5.8
S-5 15.55 26.53
N 5 5 4
Mean 16.1980 33.9600 5.3000
Std. Deviation 1.99298 5.33717 0.46904
Vinyl ester
(VW-Type)
VW-1 41.8 63.1 5.5
VW-2 37.86 58.06 5.6
VW-3 42.59 79.55 5.1
VW-4 39.6 64.45 5.65
VW-5 46.06 59.8
N 5 5 4
Mean 41.5820 64.9920 5.4625
Std. Deviation 3.11840 8.52670 0.24958
Where N= Number of specimen
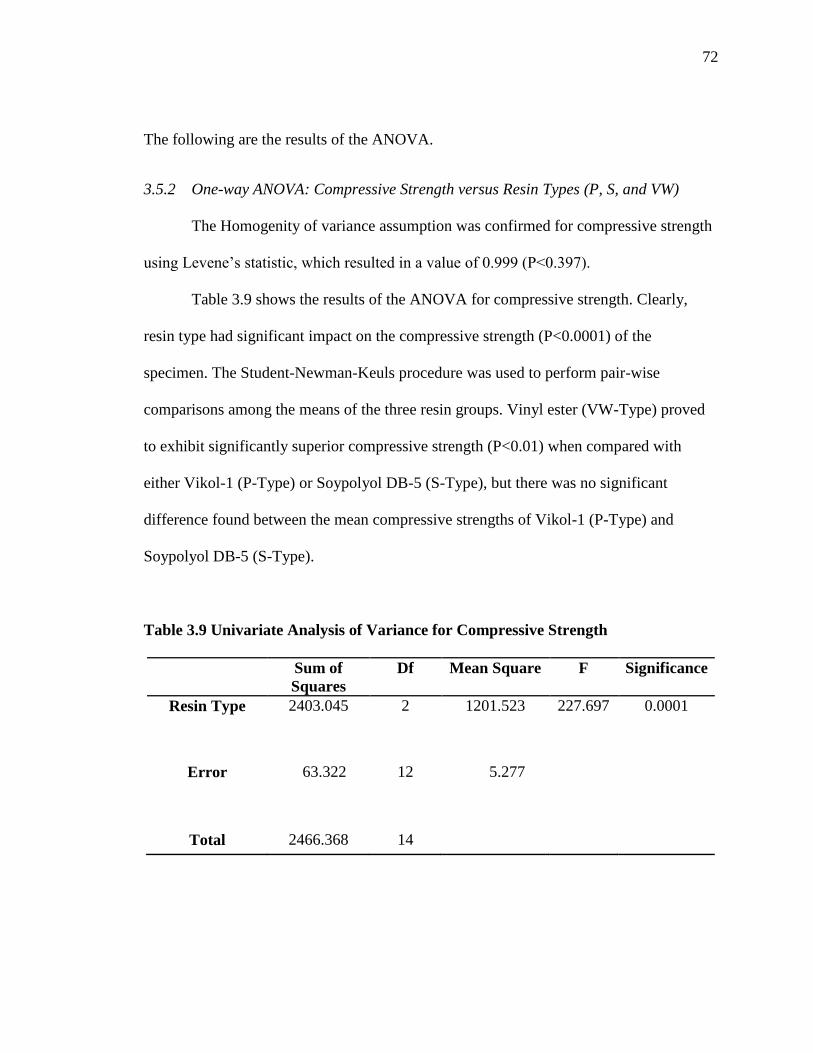
72
The following are the results of the ANOVA.
3.5.2 One-way ANOVA: Compressive Strength versus Resin Types (P, S, and VW)
The Homogenity of variance assumption was confirmed for compressive strength
using Levene‘s statistic, which resulted in a value of 0.999 (P<0.397).
Table 3.9 shows the results of the ANOVA for compressive strength. Clearly,
resin type had significant impact on the compressive strength (P<0.0001) of the
specimen. The Student-Newman-Keuls procedure was used to perform pair-wise
comparisons among the means of the three resin groups. Vinyl ester (VW-Type) proved
to exhibit significantly superior compressive strength (P<0.01) when compared with
either Vikol-1 (P-Type) or Soypolyol DB-5 (S-Type), but there was no significant
difference found between the mean compressive strengths of Vikol-1 (P-Type) and
Soypolyol DB-5 (S-Type).
Table 3.9 Univariate Analysis of Variance for Compressive Strength
Sum of
Squares
Df Mean Square F Significance
Resin Type 2403.045 2 1201.523 227.697 0.0001
Error 63.322 12 5.277
Total 2466.368 14
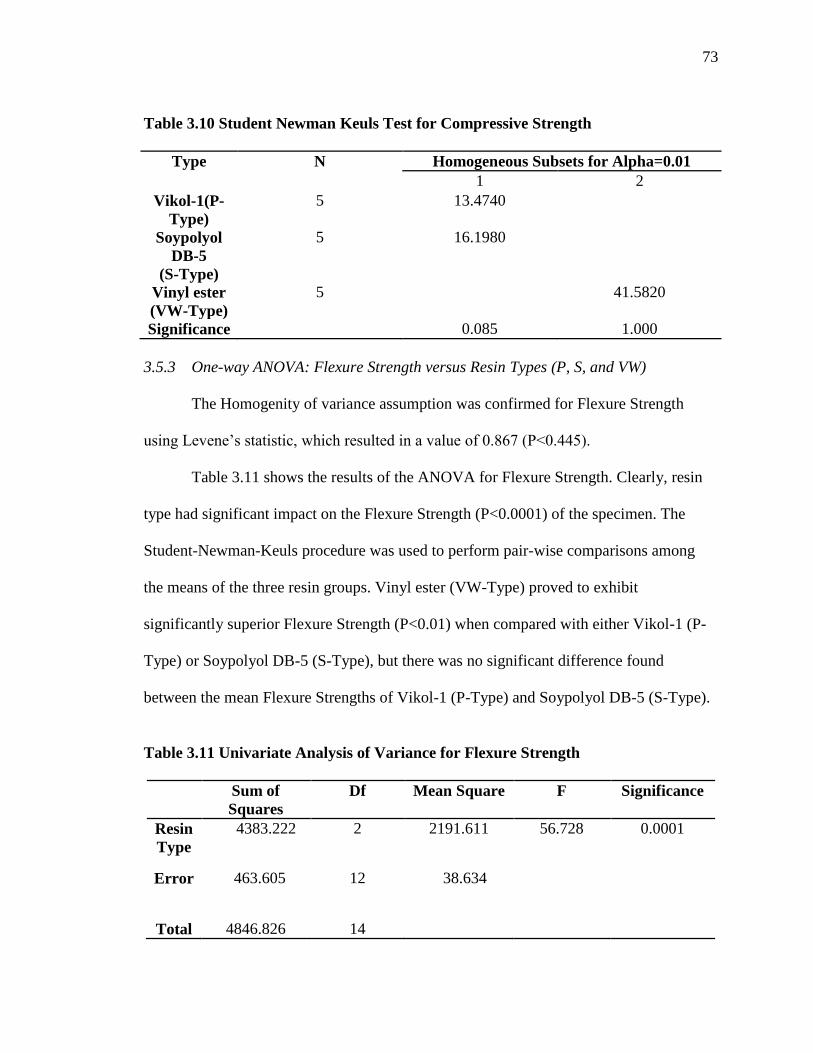
73
Table 3.10 Student Newman Keuls Test for Compressive Strength
Type N Homogeneous Subsets for Alpha=0.01
1 2
Vikol-1(P-
Type)
5 13.4740
Soypolyol
DB-5
(S-Type)
5 16.1980
Vinyl ester
(VW-Type)
5 41.5820
Significance 0.085 1.000
3.5.3 One-way ANOVA: Flexure Strength versus Resin Types (P, S, and VW)
The Homogenity of variance assumption was confirmed for Flexure Strength
using Levene‘s statistic, which resulted in a value of 0.867 (P<0.445).
Table 3.11 shows the results of the ANOVA for Flexure Strength. Clearly, resin
type had significant impact on the Flexure Strength (P<0.0001) of the specimen. The
Student-Newman-Keuls procedure was used to perform pair-wise comparisons among
the means of the three resin groups. Vinyl ester (VW-Type) proved to exhibit
significantly superior Flexure Strength (P<0.01) when compared with either Vikol-1 (P-
Type) or Soypolyol DB-5 (S-Type), but there was no significant difference found
between the mean Flexure Strengths of Vikol-1 (P-Type) and Soypolyol DB-5 (S-Type).
Table 3.11 Univariate Analysis of Variance for Flexure Strength
Sum of
Squares
Df Mean Square F Significance
Resin
Type
4383.222 2 2191.611 56.728 0.0001
Error 463.605 12 38.634
Total 4846.826 14

74
Table 3.12 Student Newman Keuls Test for Flexure Strength
Type N Homogeneous Subsets for Alpha=0.01
1 2
Vikol-1(P-
Type)
5 25.1300
Soypolyol
DB-5
(S-Type)
5 33.9600
Vinyl ester
(VW-Type)
5 64.9920
Significance 0.044 1.000
3.5.4 One-way ANOVA: ILSS versus Resin Types (P, S, and VW)
In the case of the ILSS data, Levene‘s Statistic revealed that a violation of the
Homogenity of Variance assumption had occurred which resulted in a value of 7.048
(P<0.014), however, because the cell sizes were equal (i.e., number of specimens in each
type are equal), this result does not pose a serious threat to the analytical conclusions.
Table 3.13 shows the results of the ANOVA for ILSS. Clearly, resin type had
significant impact on the ILSS (P<0.0001) of the specimen. The Student-Newman-Keuls
procedure was used to perform pair-wise comparisons among the means of the three resin
groups. Vikol-1 (P-Type) proved to exhibit significantly superior ILSS (P<0.01) when
compared with either Soypolyol DB-5 (S-Type) or Vinyl ester (VW-Type), but there was
no significant difference found between the mean ILSS of Soypolyol DB-5 (S-Type) and
Vinyl ester (VW-Type).
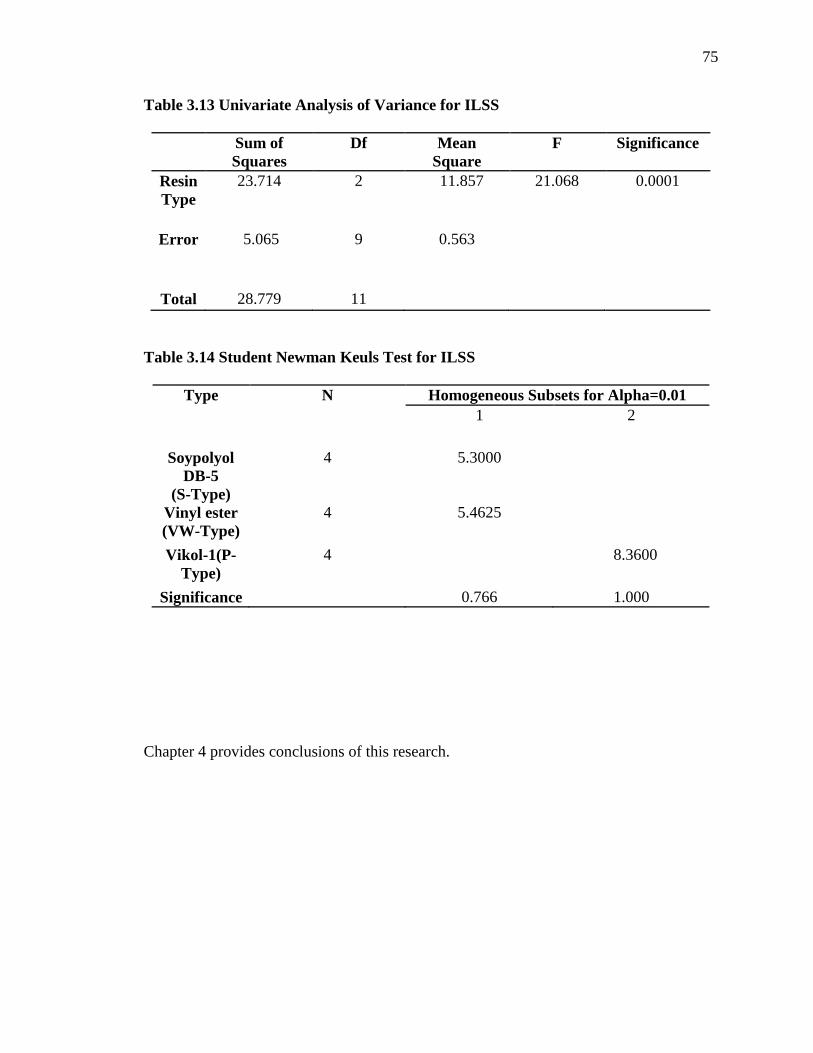
75
Table 3.13 Univariate Analysis of Variance for ILSS
Sum of
Squares
Df Mean
Square
F Significance
Resin
Type
23.714 2 11.857 21.068 0.0001
Error 5.065 9 0.563
Total 28.779 11
Table 3.14 Student Newman Keuls Test for ILSS
Type N Homogeneous Subsets for Alpha=0.01
1 2
Soypolyol
DB-5
(S-Type)
4 5.3000
Vinyl ester
(VW-Type)
4 5.4625
Vikol-1(P-
Type)
4 8.3600
Significance 0.766 1.000
Chapter 4 provides conclusions of this research.
76
CHAPTER 4
CONCLUSIONS
Recently, the Environmental Protection Agency has applied stringent regulations
on releasing of styrene (considered a volatile organic compound-VOC) for open-molding
composite processes such as hand layup and spray layup. Therefore, there is great interest
among composite manufacturers to use styrene-free polyurethane resin and low-cost
closed molding processes such as vacuum assisted resin transfer molding (VARTM). In
this research, polyurethane/E-glass composites were manufactured using a VARTM
process and extensive mechanical testing was performed. Polyurethane has two major
components ‗polyol‘ and ‗polyisocynate‘. The ‗polyol‘ component in this research was
made from soybean oil. A recent study indicates that soy-based polyols have 25% lower
total environmental impact compared to petroleum based polyols and that use of soy
polyols will result in reductions in net CO2 contributions to global warming, smog
formation, ecological toxicity, and fossil fuel depletion (Pollock, 2004).
The performance of polyurethane/E-glass and vinyl ester/E-glass composites were
compared under mechanical loading such as tensile, compressive, shear, flexure, and
interlaminar shear strength. Three different polyurethanes were formulated using 3
different soy-based polyols namely, ‗lab prepared‘, ‗Vikol-1‘ and ‗Soypolyol DB-5‘.
These composites are designated as N, P, and S, respectively. Vinyl ester/E-glass
77
composites are designated as VW. The following are specific conclusions based on
average mechanical properties:
a. Tensile strength is a fiber-dominant property. The variation in tensile strength was
mainly due to variation in fiber volume fraction.
b. Tensile modulus is affected by the matrix material. Vikol-1, or P-type composites
were superior amongst all composites and showed 4% improvement compared to
Soypolyol DB-5 S-type composites.
c. In-plane shear strength of Vikol-1 P type composites is superior amongst all
composites. P type composites showed 3.6% improvement compared to
Soypolyol DB-5 S type composites.
d. Flexural modulus of Vinyl ester/E-glass, or VW type composites was superior
compared to both Vikol-1 P type, and Soypolyol DB-5 S type composites.
One of the objectives of this research was to identify superior polyurethane in
terms of mechanical performance. Compressive strength and interlaminar shear strength
(ILSS) are matrix-dominant properties. Flexural strength is also highly affected by matrix
properties. Analysis of variance (ANOVA) was performed on compressive strength,
interlaminar shear strength (ILSS), and flexural strength. The following are the
conclusions derived from the ANOVA:
a. Vinyl ester (VW-Type) proved to exhibit significantly superior compressive
strength (P<0.01) when compared with either Vikol-1 (P-Type) or Soypolyol DB-5
78
(S-Type), but there was no significant difference found between the mean
compressive strengths of Vikol-1 (P-Type) and Soypolyol DB-5 (S-Type).
b. Vikol-1(P-Type) proved to exhibit significantly superior ILSS (P<0.01) when
compared with either Soypolyol DB-5 (S-Type) or Vinyl ester (VW-Type), but
there was no significant difference found between the mean ILSS of Soypolyol
DB-5 (S-Type) and Vinyl ester (VW-Type).
c. Vinyl ester (VW-Type) proved to exhibit significantly superior Flexure Strength
(P<0.01) when compared with either Vikol-1 (P-Type) or Soypolyol DB-5 (S-
Type), but there was no significant difference found between the mean Flexure
Strengths of Vikol-1 (P-Type) and Soypolyol DB-5 (S-Type).
Overall, Vinyl ester VW-type composites are superior in compressive strength,
flexural strength, and flexural modulus amongst all composites. Vikol-1 P-type
composites are superior in interlaminar shear strength (ILSS) amongst all composites.
Vikol-1 P-type, and Soypolyol DB-5 S-type composites have comparable compressive
strength and flexural strength. One major advantage of Vikol-1 (P-type) is its low
viscosity (1050 cP) at room temperature. It is beneficial in room temperature VARTM
processing. This research concludes that, Vikol-1 (P-type) should be the material of
choice for further development.
Improving fiber/matrix adhesion can enhance mechanical performance of
composites. All fiber-manufacturers provide chemical treatment on fibers which provides
better fiber/matrix adhesion. These chemicals are called as coupling agents. These
79
chemicals should be compatible with resin. The fabric used in this research Rovcloth
1854 has been treated by coupling agent that is compatible with polyester, vinyl ester,
epoxy, phenolic, and polyurethane. Fiber/matrix adhesion can be further improved by
modifying the resin itself. It has been proved by researchers that soy oil phosphate ester
polyol (SOPEP) improves adhesion to metals and glass in coating applications
(Massingill, 1991; Mannari and Massingill, 2006). Commercially, Arkema supplied soy
oil phosphate ester polyol under the name ‗Soypolyol DB-5‘ for this research. The
property improvement at molecular-level (as is the case in coatings), may not reflect at
bulk level (as is the case in composites). This research explored whether there is any
improvement in fiber/matrix adhesion by using modified ‗Soypolyol DB-5‘ in bulk form
in composites. ILSS of S-type composites (that used ‗Soypolyol DB-5‘) was much
lower than P-type composites (that used non-modified ‗Vikol-1‘). The possible reasons
are: difference in molecular-level and bulk level properties, and non-compatibility of
‗Soypolyol DB-5‘ with coupling agent used on fibers. Secondly, modified ‗Soypolyol
DB-5‘ polyol and non-modified ‗Vikol-1‘ polyol have different chemical properties such
as hydroxyl number, oxirane value, and molecular weight. It is not apple to apple
comparison. For true comparison, both these polyols should have equivalent chemical
properties such as hydroxyl number, oxirane value, and molecular weight. Then both
these polyols need to be used to manufacture composites using untreated glass fabric.
There is need of further investigation.
But, commercial development of polyols is governed by market needs such as low-
viscosity resin for low-cost VARTM processing and compatibility with glass fabric that

80
is already available on the market. This research studied advantages and disadvantages of
these commercial polyols in terms of processing and mechanical performance.
The present research has also laid the foundation for the following studies:
a. Literature review indicates that, the addition of nano-silica or natural nanotubes in
polyurethane resin enhances mechanical properties of composites. When nano-
particles are added in resin, viscosity of resin increases dramatically. Low
viscosity resins are preferred for nano-modification. This research proves that
low-viscosity resin used in Vikol-1 P-type composites should be the choice for
nano-modification. Secondly, P-type composites have comparable mechanical
properties as compared with that of Soypolyol DB-5 S-type.
b. There is always suspicion that solvent remainder affects the mechanical properties
of composites. The performance of composites manufactured with solvent and by
heating of the resin should be compared for matrix-dominant properties such as
compressive strength and interlaminar shear strength (ILSS).
c. This research used developmental grade materials that were successful in coating
applications. The cure cycle used was very time-consuming (i.e. 24 hours in the
mold). Curing was then followed by demolding, keeping at room temperature for
7-days, and heating at 250ºF for 3 hours. There is a need to identify an accelerated
cure cycle.
d. There are many possible reasons why Soypoly DB-5 didn‘t improve ILSS which
is indicator of fiber/matrix adhesion. There is need to develop non-modified

81
polyol that has equivalent chemical properties as that of Soypolyol DB-5. Then
both the polyols should be used to manufacture composites using untreated glass
fabric. This apple to apple comparison would clarify whether there is any
improvement in fiber/matrix adhesion by using Soypolyol DB-5.

82
REFERENCE
American Composites Manufacturers Association, Composites Basics. Retrieved
November 14, 2008 from
http://www.mdacomposites.org/mda/psgbridge_CB_Materials2_Resins.ht
ml.
Composites One. About Composites. Retrieved November 12, 2008 from
http://www.compositesone.com/basics.htm.
Connolly, M., King, J., Shidaker, T., and Duncan, A., (2006). Processing and
Characterization of Pultruded Polyurethane Composites. Technical paper,
Retrieved December, 2006,
http://www.huntsman.com/pu/Media/EPTApaper_March2006.pdf.
Connolly, M., King, J., Shidaker, T., and Duncan, A., (2005). Pultruding
Polyurethane Composite Profiles: Practical Guidelines for Injection Box
Design, Component Metering Equipment and Processing. Compoites 2005
Convention and Trade Show, ACMA, Columbus, Ohio USA.
Daniel, I. M. and Ishai, O., (1994). ―Engineering Mechanics of Composite
Materials‖, Oxford University Press.
Dong, C. (2008). A modified rule of mixture for the vacuum-assisted resin
transfer molding process simulation. Composites Science and Technology
68 (2008) 2125–2133.
Final Rule Amendment. National Emission Standards for Hazardous Air
Pollutants: Reinforced Plastic Composites Production, Retrieved
December, 2006, http://www.epa.gov/ttn/atw/rpc/rpcpg.html,08/25/05.
Kelkar A. D., Tate, J. S. and Chaphalkar P. (2006). Performance Evaluation of
VARTM Manufactured Textile Composites for Aerospace & Defense
Applications. Mat. Sc. and Eng.: B, Vol. 132, Issues 1-2, pp 126-128.
Kelkar A. D., Tate J. S., and Ron Bolick. Introduction to Low Cost Manufacturing
of Composite Laminates. Retrieved November 8, 2008, from
http://www.ncat.edu/~jt003178/WebSite-Publications/ASEE-2003.pdf.

83
Latere dwan‘isa, J. P., Mohanty, A. K., Misra, M., Drzal, L. T., and Kazemizadeh,
M. Novel soy oil based polyurethane composites: Fabrication and dynamic
mechanical properties evaluation Journal of Materials Science 39 (2004)
1887 – 1890.
Latere dwan‘isa, J. P., Mohanty, A. K., Misra, M. and Drzal, L. T. Biobased
polyurethane and its composite with glass fiber, Journal of Materials
Science 39 (2004) 2081 – 2087.
Mannari, Vijay M. and Massingill, John L., 2006, ―Two-Component High-Solid
Polyurethane Coating Systems Based on Soy Polyols‖, JCT Research, J.
Coat. Tech. Research, 3(2), 151-157 (2006).
Massingill, J. L., 1991, "Adhesion and Flexibility Contributions to the Performance
of Epoxy Phosphate Ester Coatings," J. Coating Tech.63 (797), 47-54
(1991).
Mazumdar S. K. (2002). Composites Manufacturing: Materials, Product, and
Process Engineering P 175. Florida: CRC Press.
Naik N. K. (1994). ―Woven Fabric Composite‖, Technomic Publishing Co., Inc.
Pollock, James W. (2004). Soy vs. petro polyols: A life cycle comparison.
Abstracts of Papers, 227th ACS National Meeting. Anaheim, CA, United
States, March 28-April 1, 2004.
Saunders, J. H. and Frisch, K. C., in ―Polyurethanes: Chemistry and Technology‖
(Interscience Publishers, New York, 1962) Parts I and II.
Seemann, W. H. 1994. U. S. Patent 5, 316,462.
Seemann, W. H. 1990. U. S. Patent 4, 902,215.
Sherman, Lilli Manolis. (2006). Polyurethane Composites: New Alternative to
Polyester & Vinyl Ester. Plastics Technology Online, Feature Article,
Retrieved December, 2006,
http://www.ptonline.com/articles/200603fa2.html.
Steven, S. (2001). ―Vacuum Assisted Resin Transfer Molding of Sandwich
Structures: Material Processing, Evaluation, Fracture Testing and
Analysis‖, Ph.D. thesis North Carolina Agricultural & Technical State
University.
Strong A. B. (1989). ―Fundamentals of Composite Manufacturing: Materials,
Methods, and Applications‖, Society of Manufacturing Engineers.

84
Szycher, M., in ―M. Szycher‘s Handbook of Polyurethanes‖ (CRC Press, Boca
Raton, 1999).
Tate, J. S., Massingill, J., Patel, P., Arabie, S., and Konga, S. ―Enhancement in
mechanical properties by improving fiber/matrix adhesion in bio-based
polyurethane/E-glass composites‖, SAMPE 08, Long Beach, CA, USA,
May 18-22, 2008.
Tate, J. S., Massingill, J., Patel, P., Rikka, P., and Arabie, S. ―Mechanical
Characterization of Bio-Based Polyurethane/E-Glass Composites‖,
SAMPE International Fall Technical Conference, Cincinnati, OH, USA,
October 29 – November 1, 2007, (C149).
Tate, J. S. (2004). ―Performance evaluation and processing of braided
composites‖, Ph.D. thesis, North Carolina Agricultural & Technical State
University.
ThomasNet. More about Thermoset Plastics. Retrieved November 16, 2008 from
http://www.thomasnet.com/about/thermoset-plastics-61020277.html.
Whitcomb, J. D. and Tang, X. (1999), ―Routine three -dimensional analysis of
woven composites," Proc. of 12th International Conference of Composite
Materials, Paris, France.
Wilson, Dale W., and Carlsson, Leif A. (1997). ―Mechanical Property
Measurements‖, Composites Engineering Handbook, Ed., Mallik, P. K.
Chapter 21, pp 1099.
VITA
Srujan kumar Konga was born in Andhra Pradesh, India on August 11, 1983, the
son of Bhaskar rao Konga and Uma devi Konga. After graduating from high school in
2000 at LLHS Warangal, AP, India, he studied at Kakatiya Institute of Technology and
Science, and obtained a degree of Bachelor of Science in Mechanical Engineering in May
2005. In January 2007, he joined the M.S.T program in Industrial Technology at Texas
State University-San Marcos.
Permanent Address: 327 W Woods Street
Apt # 707
San Marcos, Texas 78666
This thesis was typed by Srujan kumar Konga.