low consistency refining of mixtures … low consistency refining of mixtures of softwood &...
TRANSCRIPT

i
LOW CONSISTENCY REFINING OF MIXTURES OF SOFTWOOD & HARDWOOD
BLEACHED KRAFT PULP: EFFECTS OF REFINING POWER
by
Dimas Dwi Prasetyo Nugroho
A thesis submitted in partial fulfillment of the requirements for the degree of Master of Engineering in
Pulp & Paper Technology
Examination Committee: Dr. Mousa M. Nazhad (Chairperson) Prof. James A. Olson (External Expert) Prof. Richard J. Kerekes (External Expert) Dr. P. Abdul Salam Dr. Oleg V. Shipin
Nationality: Indonesian Previous Degree: Bachelor of Chemical Engineering Muhammadiyah University of Surakarta Surakarta - Indonesia
Scholarship Donor: PT Riau Andalan Pulp & Paper, Indonesia
Asian Institute of Technology
School of Environment, Resources and Development Thailand
August 2012

ii
ACKNOWLEDGEMENTS This thesis would not have been possible without the guidance and the help of several individuals who in one way or another contributed and extended their valuable assistance in the preparation and completion of this study. First and foremost, the author would like to express great gratitude to PT. Riau Andalan Pulp & Paper for providing financial support for his master study in AIT. Also, to all of management people from PT. Riau Andalan Pulp & Paper who provided unending support in this master program. The author wishes to express his deep thanks and highest appreciation to his advisor, Dr. Mousa M. Nazhad, thanks to him for providing critical insight into the experimental problems and for allowing the freedom to investigate solutions in his own manner. The author also would like to extend his sincere appreciations and thoughtful gratitude to his committee members, Dr. P. Abdul Salam and Dr. Oleg V. Shipin for their valuable comments, advice and suggestions to enhance this thesis work. Sincere thanks are extended to the University of British Columbia; Pulp and Paper Center; Prof. James Olson for providing all of the things necessary for this experiment to be done successfully. The author would like to gratefully acknowledge Prof. James A. Olson, Prof. Richard J. Kerekes, Dr. Jens O. Heymer for their essential assistance with the research objectives and their patience in explaining relevant concepts in this experiment. Big thanks to PPC LC refining group members and also thanks to George Soong and Nici Darychuk as the perfectly technicians of the UBC Pulp and Paper Centre for their helpfulness. It was a pleasure working with that group. The author gives thanks to all faculties, staffs, secretaries, all of his seniors and classmates at PPT/SERD friends and other friends at AIT for their friendship, assistance and moral support during his studies. At this moment, the author also would like to extend my sincere gratitude to Prof. Jiri Basta for his valuable advice, moral support and guidance at every stage during a mini thesis project that were useful for giving a better idea to solve a problem. It was really nice working together with him. Last but not the least, the author wishes to express his highest gratitude to his beloved parents, sisters and brothers, the one above all of us, and also for the secret advisor. Thanks to the universal God and his prophet, for answering the prayers for giving the power in every hardest moment in his life.

iii
ABSTRACT
The effect of refining energy on the measured properties of pulp and paper was investigated based on different ratios of softwood and hardwood chemical pulps in co-refined blends. A mix of 70-80% lodgepole pine, 20-30% white spruce and 5% sub alpine fir was used as softwood and the eucalyptus as hardwood. The mixtures studied were 0/100, 25/75, 50/50, 75/25 and 100/0 hardwood/softwood at 3.5 % consistency. In the experiment studied here mixtures of hardwood and softwood bleached pulps were refined in a single disk refiner. The plate used had a BEL of 2.74 km/rev and the refiner speed was 1200 RPM. Gap size between plates was measured using a sensor connected to a LabVIEW interface. The different refining energy values were created by changing the gap size between plates at constant flow rate. The refining flow rate was 200 l/m. Refining hardwood and softwood together enhanced the paper properties such as tensile, burst strength, paper density and drainability, but reduced the tear strength, sheet thickness and light scattering coefficient. In order to significantly reduce the refining power, the ratio of hardwood must be 50% at least. We expect that the energy was put into the softwood pulp and resulted in a higher specific refining energy in the softwood fraction. No-load power did not vary with the % hardwood content. Fibre length weighted was reduced after refining due to fibre cutting and fines generation.
Keywords: Refining, specific energy, mixture, softwood, hardwood, low consistency, disk refiner, eucalyptus.
iv
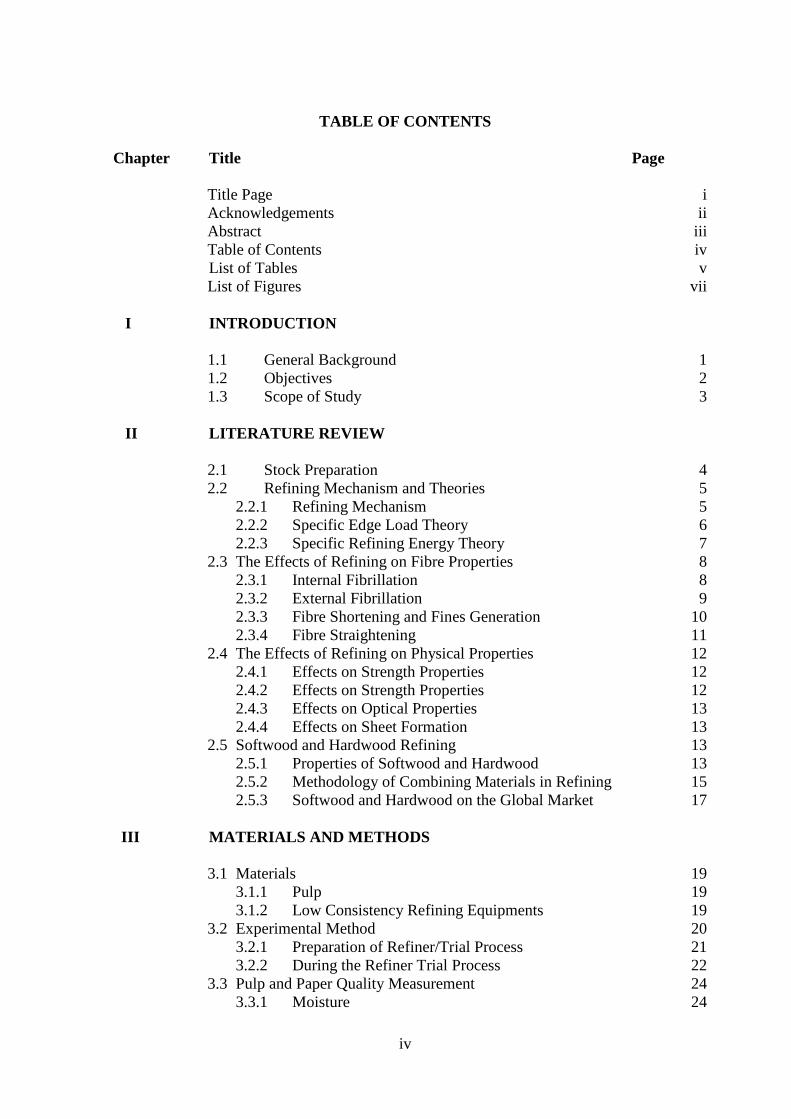
TABLE OF CONTENTS
Chapter Title Page Title Page i Acknowledgements ii Abstract iii Table of Contents iv
List of Tables v List of Figures vii I INTRODUCTION 1.1 General Background 1 1.2 Objectives 2 1.3 Scope of Study 3 II LITERATURE REVIEW 2.1 Stock Preparation 4 2.2 Refining Mechanism and Theories 5 2.2.1 Refining Mechanism 5 2.2.2 Specific Edge Load Theory 6 2.2.3 Specific Refining Energy Theory 7 2.3 The Effects of Refining on Fibre Properties 8 2.3.1 Internal Fibrillation 8 2.3.2 External Fibrillation 9 2.3.3 Fibre Shortening and Fines Generation 10 2.3.4 Fibre Straightening 11 2.4 The Effects of Refining on Physical Properties 12 2.4.1 Effects on Strength Properties 12 2.4.2 Effects on Strength Properties 12 2.4.3 Effects on Optical Properties 13 2.4.4 Effects on Sheet Formation 13 2.5 Softwood and Hardwood Refining 13 2.5.1 Properties of Softwood and Hardwood 13 2.5.2 Methodology of Combining Materials in Refining 15 2.5.3 Softwood and Hardwood on the Global Market 17 III MATERIALS AND METHODS 3.1 Materials 19 3.1.1 Pulp 19 3.1.2 Low Consistency Refining Equipments 19 3.2 Experimental Method 20 3.2.1 Preparation of Refiner/Trial Process 21 3.2.2 During the Refiner Trial Process 22 3.3 Pulp and Paper Quality Measurement 24 3.3.1 Moisture 24
v
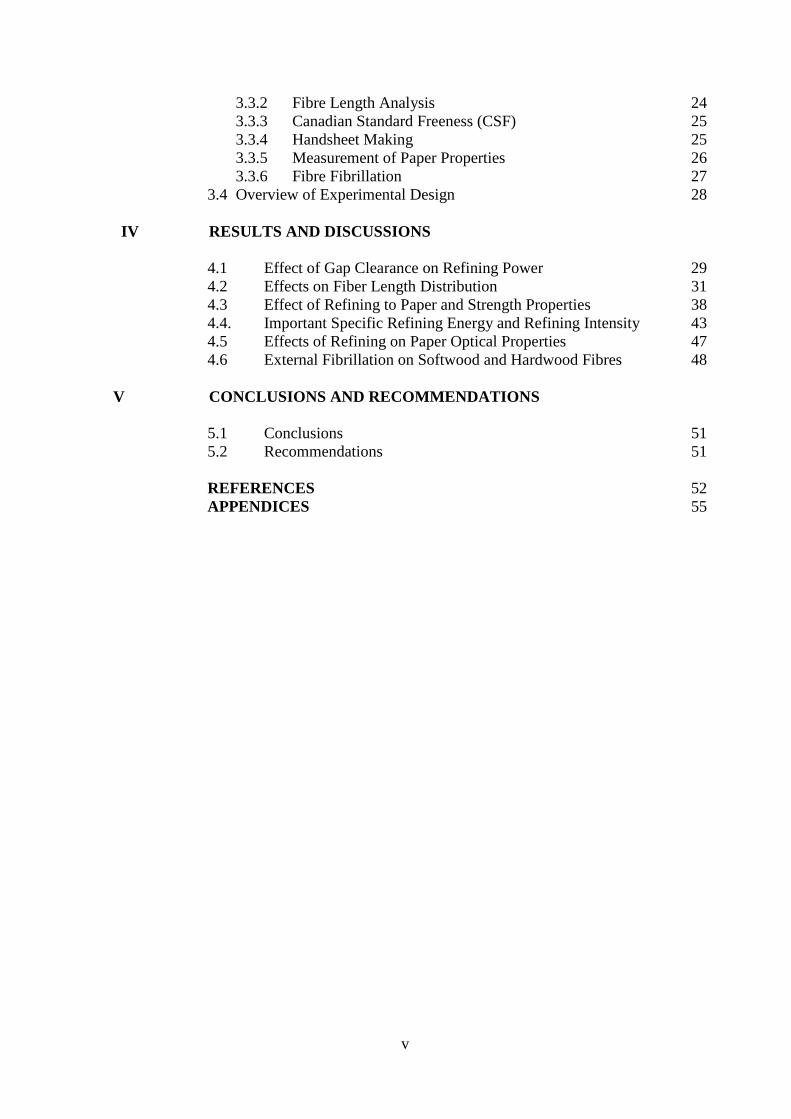
3.3.2 Fibre Length Analysis 24 3.3.3 Canadian Standard Freeness (CSF) 25 3.3.4 Handsheet Making 25 3.3.5 Measurement of Paper Properties 26 3.3.6 Fibre Fibrillation 27 3.4 Overview of Experimental Design 28 IV RESULTS AND DISCUSSIONS 4.1 Effect of Gap Clearance on Refining Power 29 4.2 Effects on Fiber Length Distribution 31 4.3 Effect of Refining to Paper and Strength Properties 38 4.4. Important Specific Refining Energy and Refining Intensity 43 4.5 Effects of Refining on Paper Optical Properties 47 4.6 External Fibrillation on Softwood and Hardwood Fibres 48 V CONCLUSIONS AND RECOMMENDATIONS 5.1 Conclusions 51 5.2 Recommendations 51 REFERENCES 52 APPENDICES 55
vi
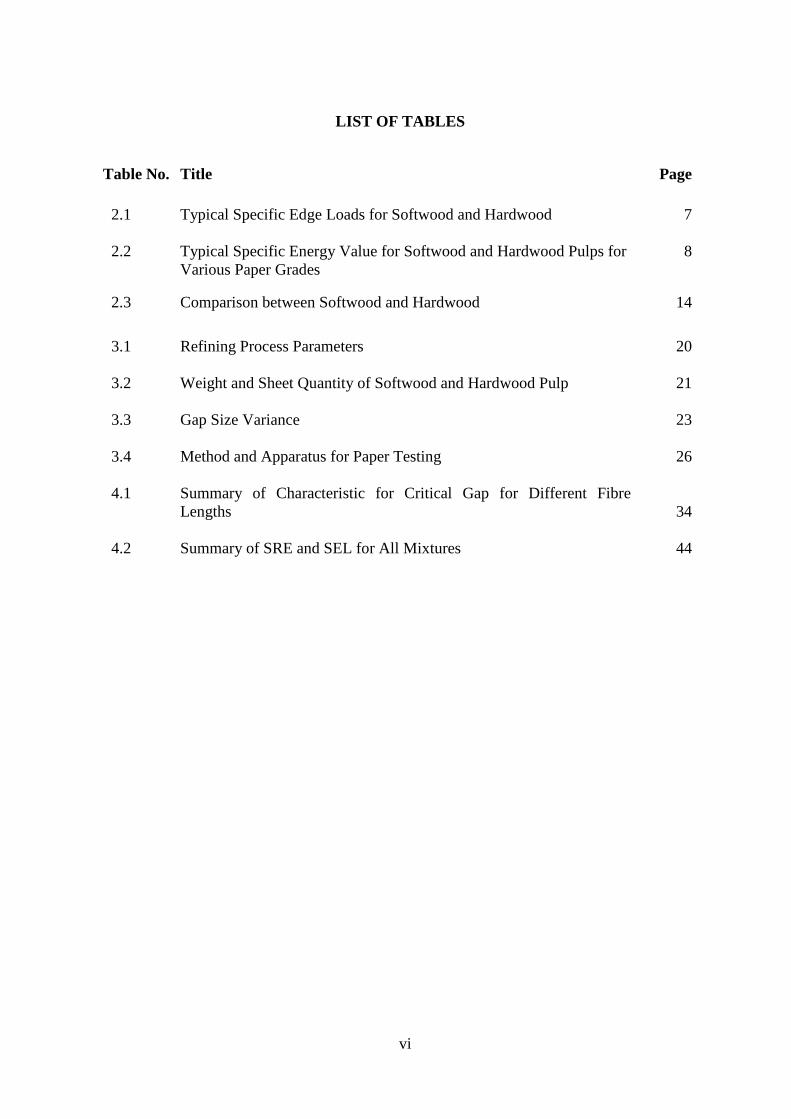
LIST OF TABLES
Table No. Title
Page
2.1 Typical Specific Edge Loads for Softwood and Hardwood 7
2.2 Typical Specific Energy Value for Softwood and Hardwood Pulps for Various Paper Grades
8
2.3 Comparison between Softwood and Hardwood 14
3.1 Refining Process Parameters
20
3.2 Weight and Sheet Quantity of Softwood and Hardwood Pulp
21
3.3 Gap Size Variance
23
3.4 Method and Apparatus for Paper Testing
26
4.1 Summary of Characteristic for Critical Gap for Different Fibre Lengths
34
4.2 Summary of SRE and SEL for All Mixtures
44
vii
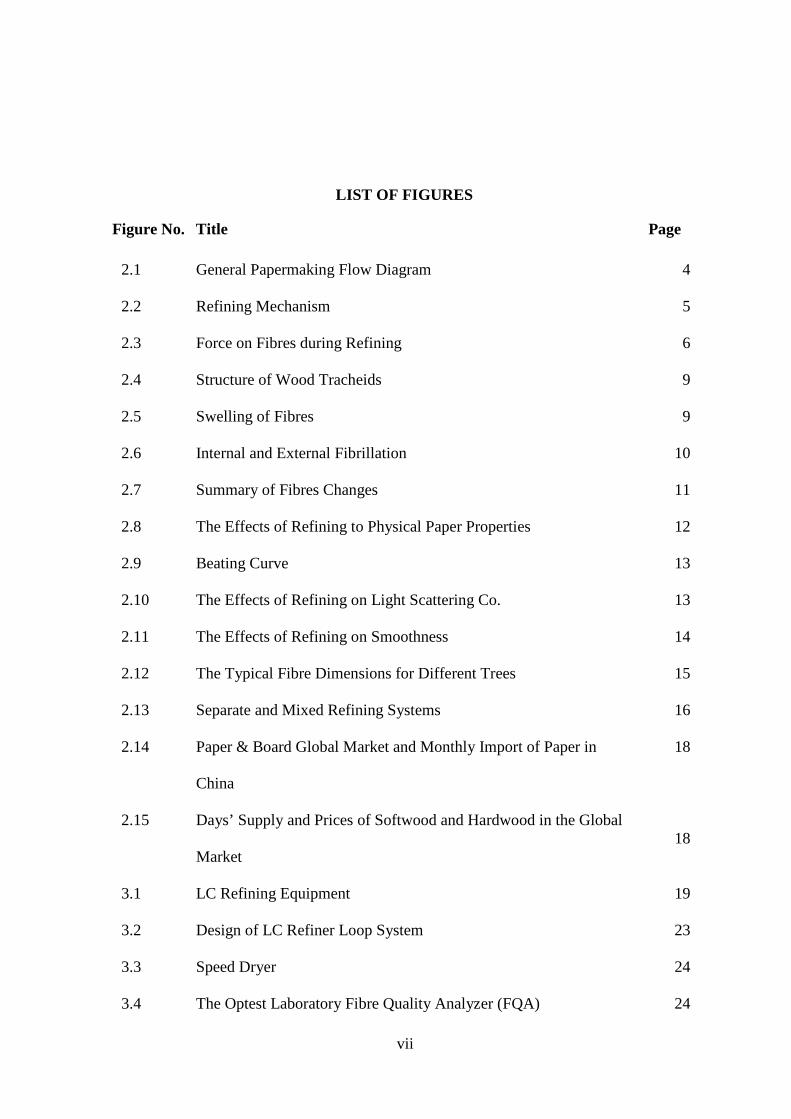
LIST OF FIGURES
Figure No. Title
Page
2.1 General Papermaking Flow Diagram
4
2.2 Refining Mechanism
5
2.3 Force on Fibres during Refining 6 2.4 Structure of Wood Tracheids
9
2.5 Swelling of Fibres 9
2.6 Internal and External Fibrillation
10
2.7 Summary of Fibres Changes
11
2.8 The Effects of Refining to Physical Paper Properties
12
2.9 Beating Curve
13
2.10 The Effects of Refining on Light Scattering Co.
13
2.11 The Effects of Refining on Smoothness
14
2.12 The Typical Fibre Dimensions for Different Trees
15
2.13 Separate and Mixed Refining Systems
16
2.14 Paper & Board Global Market and Monthly Import of Paper in
China
18
2.15 Days’ Supply and Prices of Softwood and Hardwood in the Global
Market
18
3.1 LC Refining Equipment
19
3.2 Design of LC Refiner Loop System
23
3.3 Speed Dryer
24
3.4 The Optest Laboratory Fibre Quality Analyzer (FQA) 24
viii
3.5 Canadian Standard Freeness
25
3.6 Handsheet Making Process: Steps for Making the Handsheet
25
3.7 Apparatus for Measuring Paper Properties
26
3.8 Cutting the Handsheets
27
3.9 Nikon Photomicrography in PPC Laboratory
27
4.1 Relationships between Gap and Refining Power 29
4.2 Relationship between Inverse of Gap and Refining Power
30
4.3 Length-weighted Distribution of Unrefined Pulps (Gap size ≥ 2.5 mm)
32
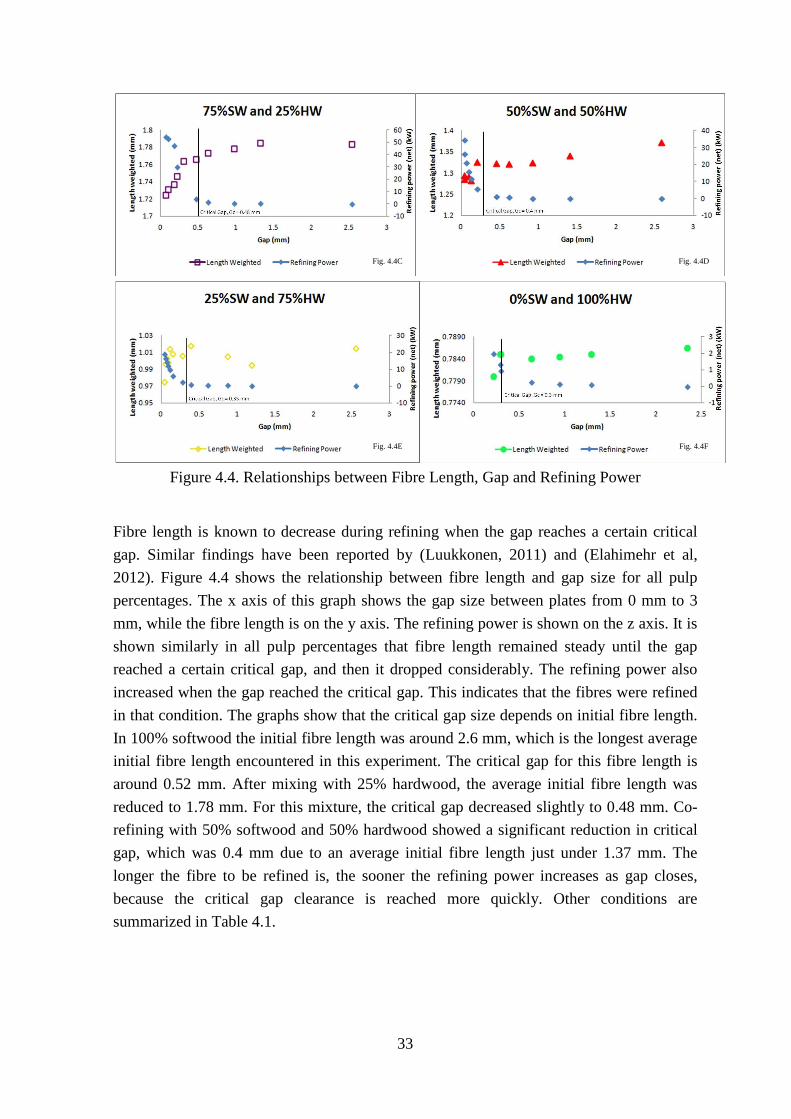
4.4 Relationships between Fibre Length, Gap and Refining Power
33
4.5 Fibre Length-weighted Average of Unrefined & Refined Samples
34
4.6 Relationships between Length-weighted Fibre Length and Specific Refining Energy
35
4.7 Fibre Length-weighted Distributions in a Unit Mass of Pulp for 100% Softwood Sample
36
4.8 Fibre Length-weighted Distributions in a Unit Mass of Pulp (75%SW & 25%HW)
36
4.9 Fibre Length-weighted Distributions in a Unit Mass of Pulp (50%SW & 50%HW)
36
4.10 Fibre Length-weighted Distributions in a Unit Mass of Pulp (25%SW & 75%HW)
37
4.11 Fibre Length-weighted Distributions in a Unit Mass of Pulp (0%SW & 100%HW)
37
4.12 Magnification of Smaller Area of Fig 4.7 (100%SW & 0%HW)
38
4.13 Relationships between Gap and Freeness 39
4.14 Relationships between Inv. Gap and Tear 39

ix
4.15 Relationships between Inv. Gap and Tensile Index
40
4.16 Relationships between Tensile Index and Tear
40
4.17 Relationships between Freeness and Tensile Index
41
4.18 Relationships between Inv. Gap and Burst Index 41
4.19 Relationship of Burst Strength with Tensile Index and Tear Strength
42
4.20 Relationships between Strength Properties and Sheet Density 42
4.21 Relationships between Strength Properties and Sheet Density
42
4.22 Specific Refining Energy & Specific Edge Load at Constant Refining Parameters
43
4.23 Relationships between Specific Refining Energy and Refining Intensity
44
4.24 Relationships between Specific Refining Energy and Freeness
45
4.25 Relationships between Specific Refining Energy and Tensile Strength
45
4.26 Relationships between Delta Tensile / Delta SRE and SEL 46 4.27 Tensile Index Curve at Constant SRE
46
4.28 Tensile Index Increase at a Given Specific Refining Energy
47
4.29 Relationships between Tensile Index and Light Scattering Co.
48
4.30 Relationships between Paper Density and Light Scattering Co. 48
4.31 Softwood (Long Fibres) Unrefined
49
4.32 Softwood (Long Fibres) (Refined @132 kWh/t)
49
4.33 Hardwood (Short Fibres) with Vessels (Unrefined) 49 4.34 Hardwood (Short Fibres) (Refined @4.1 kWh/t) 50 4.35 50% Softwood and 50% Hardwood (Unrefined) 50 4.36 50% Softwood and 50% Hardwood ([email protected] kWh/t)
50

x
CHAPTER IINTRODUCTION
1.1. General Background Refining plays a vital role in pulp stock preparation, and is the first step in the paper making process. Refining is the mechanical treatment of fibres between metallic bars in the refiner in the presence of water (Helsinki, 2000). The objective of refining is to improve the bonding ability of fibres, as well as the strength and smoothness of paper made of the treated fibres. In other words, refining improves paper quality as well as paper and printing machine runnability. Generally, there are many effects of refining on fibres, which include: fibre cutting and shortening, fines production and complete removal of parts from fibre walls, debris creation in suspension, external fibrillation, internal changes in the wall structure, fibre straightening, nodes, kinks, slip planes, micro compressions creation or removal in the cell wall, colloidal material softened into the external liquor, hemicelluloses redistribution from the interior of the fibre to the exterior, and surface abrasion at the molecular level to produce a more gelatinous surface (Page, 1989). The manifestation of different refining effects depends on the refiner and refining conditions, pulp and consistency. Pulp consistency can be considered in two categories: high consistency (HC) refining (20-40%) and low consistency (LC) refining (3-5%). A major difficulty in characterizing refining intensities at high and low consistency is the huge difference in rheological behavior. During HC refining, the pulp suspension is heterogeneous and compressible. Because of this, the number of fibres in the refiner is not known. LC refining, however, has a more homogenous pulp suspension. Consequently, bar crossings provide a reasonable measure of loading cycle on the pulp mass (Kerekes, 2011). Refining dramatically improves paper properties, however, there are cost concerns due to the rising cost of electrical energy. High consistency refiners allow much higher rotation speed which results on much larger gap clearance. In other words, it determines the refining degree and change, decreases fibre cutting, and establishing contact between the bars is more difficult (Lumiainen, 2000). In many cases, HC refining is becoming replaced by the LC refining process. The LC stage also aims to soften the fibre material by heat to avoid severe fibre shortening, as the structure of the rigid lignin is softened by high temperatures (Eriksen & Hammar, 2005). LC refining flattens fibres, decreases volume, increases refining degree, tensile strength, tensile energy absorption, and air resistance (Lumiainen, 2000). During the refining process, the refining resistance of the fibres decreases. Therefore, the refining intensity must be lessened over time during an extended refining process. Several studies have been completed on the effects of blending pulps in the furnish. It has been found that strength properties are better in paper made from co-refined blends as opposed to separately refined blends (Ghost, Rae, & Moorhouse, 2003); (Lumiainen, 1997); (Manfredi & Claudio da Silva, 1986), however, some researchers have observed the opposite (Stevens, 1992), (Nuttall, Mott, Mayhead, & DuGuid, 1999); (Baker, 1995). Generally, the studies are attributed to the importance of fibre properties in the refining process, even though the fibres used are different. For chemical pulps, the optimum refining intensity relies on the refining resistance, the physical dimensions, and the flocculation ability of fibres. In the case of softwood (SW) fibres, too low of an intensity cannot cause a refining effect on the fibres, while too high of an intensity will enhance the
1

2
dewatering resistance. When SW pulp is found to generate the refining intensity, however, the flow is reduced while the refining energy is stable. In terms of energy use in low consistency refining, softwood and hardwood pulps experience different bar width segments, refining energy, and refining intensity. Softwood pulps require much larger power use and refining intensity. On the contrary, hardwood pulps show less power use and lower refining intensity (Lumiainen, 2000). Softwood pulp fibres are considered the strongest and most resistant to refining compared with those of hardwood. A consequence of this is that softwood pulps require more energy in the refining process. The larger the energy input, the greater the strength development will be. On the other hand, lower energy inputs produce lower strength at a certain refining degree. In the case of softwood, low refining intensity is capable of developing fibres, however, the energy required is higher. In the case of hardwood, too high of an intensity will ruin the fibre flocculation on bar edges and take off the fibres back to grooves without getting any refining treatment. Simply said, the lower the refining intensity, the better. Nevertheless, it should be noted that lower refining intensity reduces the net power of the refiner. Consequently, it affects the strength properties such as tensile and burst. Bigger refiners or a higher number of refiners could be used to achieve a certain capacity and net energy input. In refining, the higher the energy input in one pass is, the lower the final strength will be at a certain specific refining energy (SRE). Energy input should therefore be distributed over several refining stages to achieve optimum strength and lower energy costs. It has been postulated that a mixed treatment would be advantageous, at least with respect to energy consumption, when the presence of hardwood fibres can significantly add to the flocculation affinity of the softwood component in the furnish. Long fibres from softwood pulps are strongest and have the highest refining resistance, requiring high refining energy and coarse fillings. Short fibres (hardwood) are the weakest with lowest refining resistance, requiring low refining energy and fine fillings. It is important to papermakers to develop the necessary tensile strength, and at the same time maintain fibre length and tearing strength as high as possible. Lower energy input in a single pass requires less net refining energy for a given tensile strength than a higher energy input.
Usually, adding hardwood proportion in softwood refining is a smart choice for reducing energy consumption in the refiner. However, it is obvious that by adding hardwood in softwood refining the strength properties become lower if compared with original softwood refining. As has been noted, it depends on the desired extent of changes after refining. This is also particularly difficult when dealing with the addition of hardwood pulp, and how it interacts with softwood fibres during co-refining.
1.2. Objectives The overall objective for this research was to study the effects of low consistency refining on different ratios of softwood and hardwood in co-refined blends of chemical pulps. Different proportions of HW and SW pulps have been shown to have an effect on energy required and measurable properties. Other refiner parameters were kept constant in order to study the effect of different ratios of SW/HW in LC refining. Furthermore, the condition before refining was compared with condition after refining.
3
Moreover, the specific objectives of this research were as follows: 1. To study the energy effect on different ratios of SW and HW chemical pulps in co-
refined blends on specific refining energy and refining intensity. 2. To study the measured properties of pulps and paper refined with different ratios of
SW and HW in co-refined blends. 3. To study the behavior of HW in SW refining. 1.3. Scope of Study The scope of this experiment focused on different proportions of softwood and hardwood bleached chemical pulp in low consistency refining, co-refined blends. The mixtures studied were 100/0, 75/25, 50/50, 25/75, 0/100 of SW/HW. The softwood and hardwood pulps were collected from the Canfor pulp mill and CMPC Pulp's Santa Fe mill, respectively. In order to achieve the objective above, this experiment was limited to pilot scale refining by using the LC refining facility at the Pulp and Paper Centre at the University of British Columbia. For the 2.74 km/rev plate geometry, 1200 rpm refiner speed, 200 l/m flow rate and 3.5% consistency, the effects of different softwood and hardwood percentages were examined.
4
CHAPTER II LITERATURE REVIEW
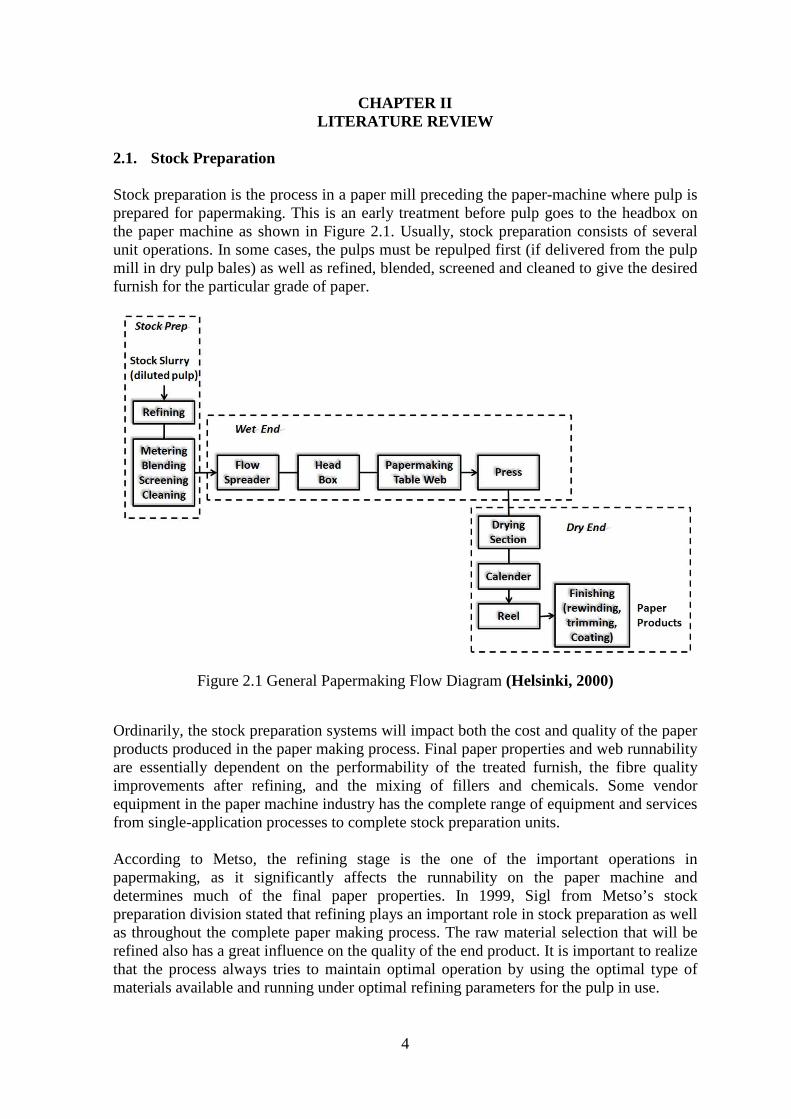
2.1. Stock Preparation Stock preparation is the process in a paper mill preceding the paper-machine where pulp is prepared for papermaking. This is an early treatment before pulp goes to the headbox on the paper machine as shown in Figure 2.1. Usually, stock preparation consists of several unit operations. In some cases, the pulps must be repulped first (if delivered from the pulp mill in dry pulp bales) as well as refined, blended, screened and cleaned to give the desired furnish for the particular grade of paper.
Figure 2.1 General Papermaking Flow Diagram (Helsinki, 2000)
Ordinarily, the stock preparation systems will impact both the cost and quality of the paper products produced in the paper making process. Final paper properties and web runnability are essentially dependent on the performability of the treated furnish, the fibre quality improvements after refining, and the mixing of fillers and chemicals. Some vendor equipment in the paper machine industry has the complete range of equipment and services from single-application processes to complete stock preparation units. According to Metso, the refining stage is the one of the important operations in papermaking, as it significantly affects the runnability on the paper machine and determines much of the final paper properties. In 1999, Sigl from Metso’s stock preparation division stated that refining plays an important role in stock preparation as well as throughout the complete paper making process. The raw material selection that will be refined also has a great influence on the quality of the end product. It is important to realize that the process always tries to maintain optimal operation by using the optimal type of materials available and running under optimal refining parameters for the pulp in use.
5
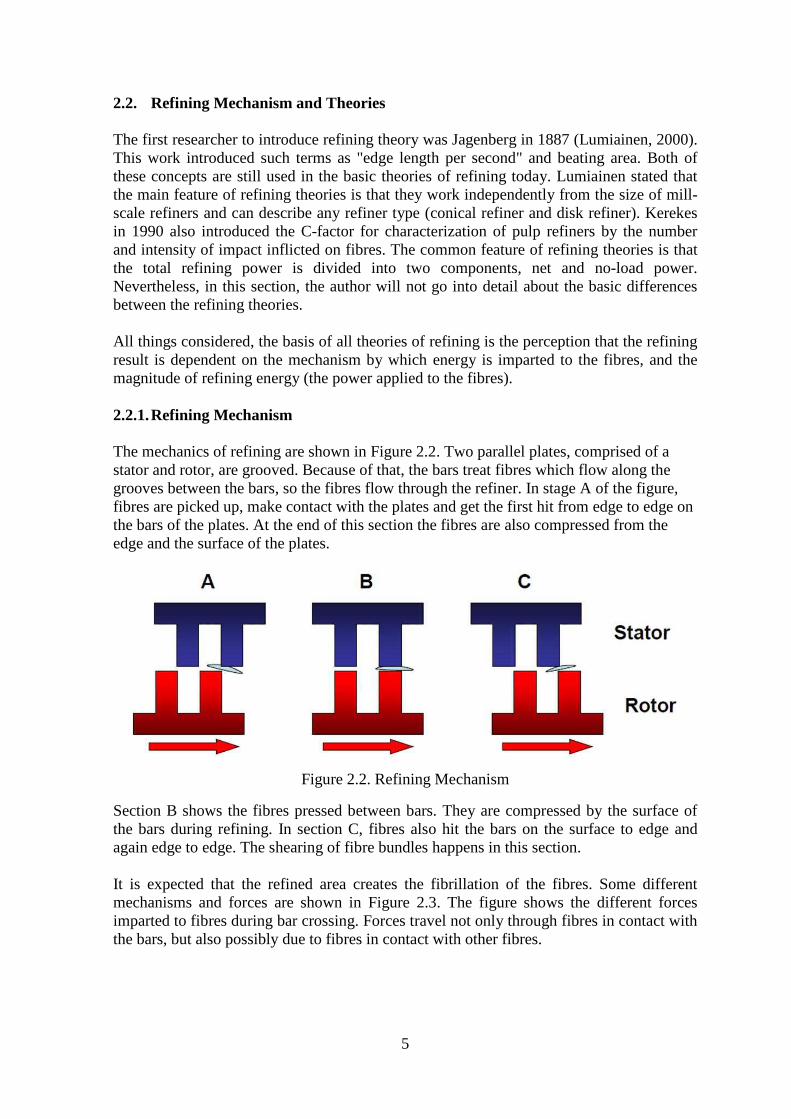
2.2. Refining Mechanism and Theories The first researcher to introduce refining theory was Jagenberg in 1887 (Lumiainen, 2000). This work introduced such terms as "edge length per second" and beating area. Both of these concepts are still used in the basic theories of refining today. Lumiainen stated that the main feature of refining theories is that they work independently from the size of mill-scale refiners and can describe any refiner type (conical refiner and disk refiner). Kerekes in 1990 also introduced the C-factor for characterization of pulp refiners by the number and intensity of impact inflicted on fibres. The common feature of refining theories is that the total refining power is divided into two components, net and no-load power. Nevertheless, in this section, the author will not go into detail about the basic differences between the refining theories. All things considered, the basis of all theories of refining is the perception that the refining result is dependent on the mechanism by which energy is imparted to the fibres, and the magnitude of refining energy (the power applied to the fibres). 2.2.1. Refining Mechanism The mechanics of refining are shown in Figure 2.2. Two parallel plates, comprised of a stator and rotor, are grooved. Because of that, the bars treat fibres which flow along the grooves between the bars, so the fibres flow through the refiner. In stage A of the figure, fibres are picked up, make contact with the plates and get the first hit from edge to edge on the bars of the plates. At the end of this section the fibres are also compressed from the edge and the surface of the plates.
Figure 2.2. Refining Mechanism
Section B shows the fibres pressed between bars. They are compressed by the surface of the bars during refining. In section C, fibres also hit the bars on the surface to edge and again edge to edge. The shearing of fibre bundles happens in this section. It is expected that the refined area creates the fibrillation of the fibres. Some different mechanisms and forces are shown in Figure 2.3. The figure shows the different forces imparted to fibres during bar crossing. Forces travel not only through fibres in contact with the bars, but also possibly due to fibres in contact with other fibres.

6
Figure 2.3. Force on Fibres During Refining
2.2.2. Specific Edge Load Theory One of the commonly used refining theories is the specific edge load theory. The specific edge load reflects power distribution among bar crossings. In 1958 Wultsch and Flucher showed the amount of efficient refiner load and edge length in every second as refining intensity. Brecht and Siewert then believed that the specific edge load indicated the refining intensity in 1966. Intensity comprises two factors which are used to describe how often the fibres are treated and how intense they are hit (Lumiainen, 2000). The specific edge load or SEL (Ws/m or J/m) is described as:
��� = ���
�� Eq. 2.1
��� = ��� − ������ Eq. 2.2 Where Pnet is the net power (kW), Ptot is the total power, meaning the gross power in an actual situation, and Pnoload is the initial power. Initial power indicates the power consumed when the gap size backed off (increased) until there is no noticeable change in pulp properties. The no load power should be determined using a pulp suspension, not water alone (Kerekes, 2012). CEL or Cutting Edge Length is calculated as Bar Edge Length/ BEL (km/Rev) multiplied by rotational speed/ n (RPM). ��� = ��� � � Eq. 2.3 ��� = �� � �� � � Eq. 2.4

7
Where Zr and Zs are the bar number of rotor and stator and l (km) is the average of the length (Lundin, 2008). BEL/CEL is given to paper makers by suppliers of refiner plates as km/Rev. This theory considers that the energy applied to the fibres varies depending on the length of the bar edges (Lumiainen, 2000). All of the factors used to calculate the SEL are available and simple calculations are used. On the whole, this theory is frequently used. Eventually, people who are experts in the papermaking process are usually able to estimate the specific edge load value at any consistency given to the refiner. Generally, specific edge load in this calculation used to calculate the intensity of the refiner machine, but it is not the fibres’ intensity. The different target SEL values for each pulp type are shown in the table below. Table 2.1 Typical Specific Edge Loads for Softwood and Hardwood (Canfor, 2010)
Material SEL
(J/m)
Softwood 1.5 – 3.0
Recommended 2.0
Hardwood 0.2 – 1.0
Recommended 0.2
2.2.3. Specific Refining Energy Theory In a given moment, the energy is also determined by net power, but specific refining energy (SRE) differs from SEL because SRE is used for calculating how much energy is given from the refiner to the fibres. Specific refining energy (kWh/t) is calculated as
��� = ���
ṁ Eq. 2.5
It was mentioned above that Pnet is the net power applied to the fibres (kW), and ṁ is the mass of the fibres through the refiner (t/h). In this case ṁ is the result of multiplying the flow rate (liter/h) by pulp consistency (mass/unit volume) (Lumiainen 2000, Koskenhely 2007).
ṁ = � !" Eq. 2.6

8
Generally speaking, the specific refining energy is the net energy expended per unit mass of fibres. Some reference values for standard specific refining energy values are also shown in the table below: Table 2.2 Typical Specific Energy Values for Softwood and Hardwood Pulps for Various Paper Grades (Canfor, 2010a)
Paper product Material SRE
(kWh/t)
Fine Paper Softwood 120 – 160
Hardwood 80 – 120
Food Board Softwood 60 – 80
Hardwood 40 – 60
News
SB Kraft 40 – 100
Post-refined Mechanical pulp
50 – 100
Sack Unbleached Kraft 230 – 280
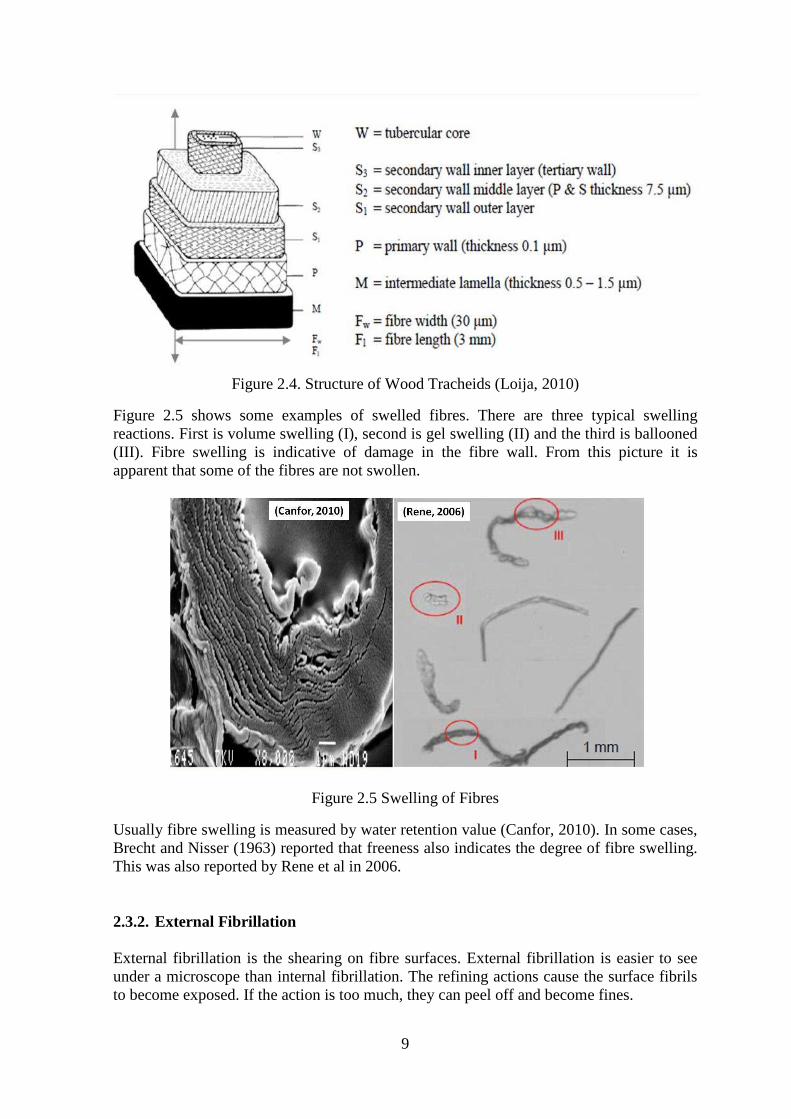
2.3. The Effects of Refining on Fibre Properties The mechanical action that is done by the bars on the plates of the refiner causes considerable modification of the fibre properties. In the VTT Industrial System (2009), Loijas (2010) stated that the main changes in fibre properties are degradation of the primary wall and the S1 layer, internal fibrillation, external fibrillation, fibre straightening, fibre shortening and fines generation. 2.3.1. Internal Fibrillation The first change that occurs during refining of fibres is internal fibrillation. This is a degradation of the fibre wall. Degradation in this case means removal of the primary wall and secondary wall outer layer (S1) due to increasing the hydrogen bonding on the fibre. As a result, the fibres swell.
9
Figure 2.4. Structure of Wood Tracheids (Loija, 2010)
Figure 2.5 shows some examples of swelled fibres. There are three typical swelling reactions. First is volume swelling (I), second is gel swelling (II) and the third is ballooned (III). Fibre swelling is indicative of damage in the fibre wall. From this picture it is apparent that some of the fibres are not swollen.
Figure 2.5 Swelling of Fibres
Usually fibre swelling is measured by water retention value (Canfor, 2010). In some cases, Brecht and Nisser (1963) reported that freeness also indicates the degree of fibre swelling. This was also reported by Rene et al in 2006. 2.3.2. External Fibrillation External fibrillation is the shearing on fibre surfaces. External fibrillation is easier to see under a microscope than internal fibrillation. The refining actions cause the surface fibrils to become exposed. If the action is too much, they can peel off and become fines.

10
Both internal and external fibrillation will increase the bonding area in a paper sheet. Internal fibrillations increase fibre flexibility, while the area of surface fibrils is increased by external fibrillation.
Figure 2.6. Internal and External Fibrillation
Taegeun Kang (2005) was able to keep internal fibrillation constant and observe the effect of external fibrillation on strength properties. He reported that the fibrils still attached to the fibres further improved the consolidation of the paper strength. The light scattering index decreased with an increase in external fibrillation. At the same time the fines increased. Kang expected that paper strength properties were strongly influenced by internal fibrillation, and that these could also be increased further by promoting mostly external fibrillation. Increased levels of fibrillation also decrease the sheet density and the opacity, and result in slower drainage on the papermachine (Canfor, 2010). 2.3.3. Fibre Shortening and Fines Generation Fibre shortening means fibre cutting during refining. Kerekes and Olson (2003) have the perspective that fibre length is reduced during refining. Fibre cutting is generally undesirable in refining, as longer fibre length generally results in higher tensile strength. Kerekes (1990) described that the energy of refining can be applied to fibres in different ways. A large number of impacts of small intensity, leads to fibres fibrillation, but a small number of impacts of high intensity leads to fibre cutting. Another method to predict the number of impacts which will impact fibre shortening was developed by Heymer (2009). It was explained above that fines generation also happens in refining due to excess force during external fibrillation. Bachelor (1999) found a very interesting conclusion in his research. He suggested that there is a relationship between fines generation and fibre shortening. Practically, reduction of the fibre length was calculated based on the length weighted average before and after
11
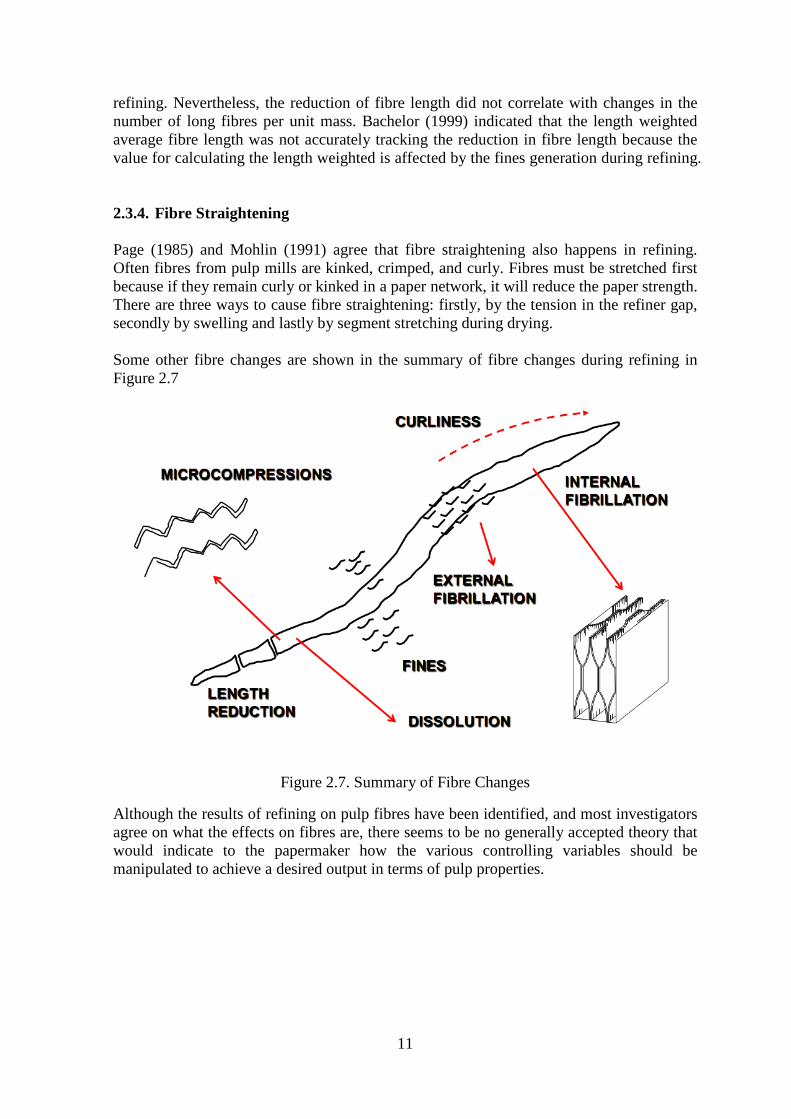
refining. Nevertheless, the reduction of fibre length did not correlate with changes in the number of long fibres per unit mass. Bachelor (1999) indicated that the length weighted average fibre length was not accurately tracking the reduction in fibre length because the value for calculating the length weighted is affected by the fines generation during refining. 2.3.4. Fibre Straightening Page (1985) and Mohlin (1991) agree that fibre straightening also happens in refining. Often fibres from pulp mills are kinked, crimped, and curly. Fibres must be stretched first because if they remain curly or kinked in a paper network, it will reduce the paper strength. There are three ways to cause fibre straightening: firstly, by the tension in the refiner gap, secondly by swelling and lastly by segment stretching during drying. Some other fibre changes are shown in the summary of fibre changes during refining in Figure 2.7
Figure 2.7. Summary of Fibre Changes
Although the results of refining on pulp fibres have been identified, and most investigators agree on what the effects on fibres are, there seems to be no generally accepted theory that would indicate to the papermaker how the various controlling variables should be manipulated to achieve a desired output in terms of pulp properties.

12
2.4. The Effects of Refining on Paper Properties Refining causes changes in fibre properties, and this in turn changes paper properties (VTT Industrial System 2009). The effects of refining on the paper properties of the final sheet can be classified into four categories: physical properties, strength properties, optical properties, and sheet formation. 2.4.1. Effects on Physical Properties One of the effects of refining on paper physical properties is increasing the density. Increased density means the basis weight increases and the thickness decreases. The value of bulk is inversely proportional to the value of density. Thus, refining reduces the bulk of the paper sheet.
Figure 2.8. The effects of refining on physical paper properties (Metso, 2008)
Fibre length will decrease after refining. The spaces between the fibres and the pores also decrease, and as a result the air permeability increases. 2.4.2. Effects on Strength Properties The main factor that affects strength properties is bonding area. With refining the bonding area increases. Tensile and burst strength will increase after refining. When refining is applied to the fibre, the tear strength decreases after a slight increase at the beginning.
Figure 2.9 Beating Curve (Kerekes, 2012)
13
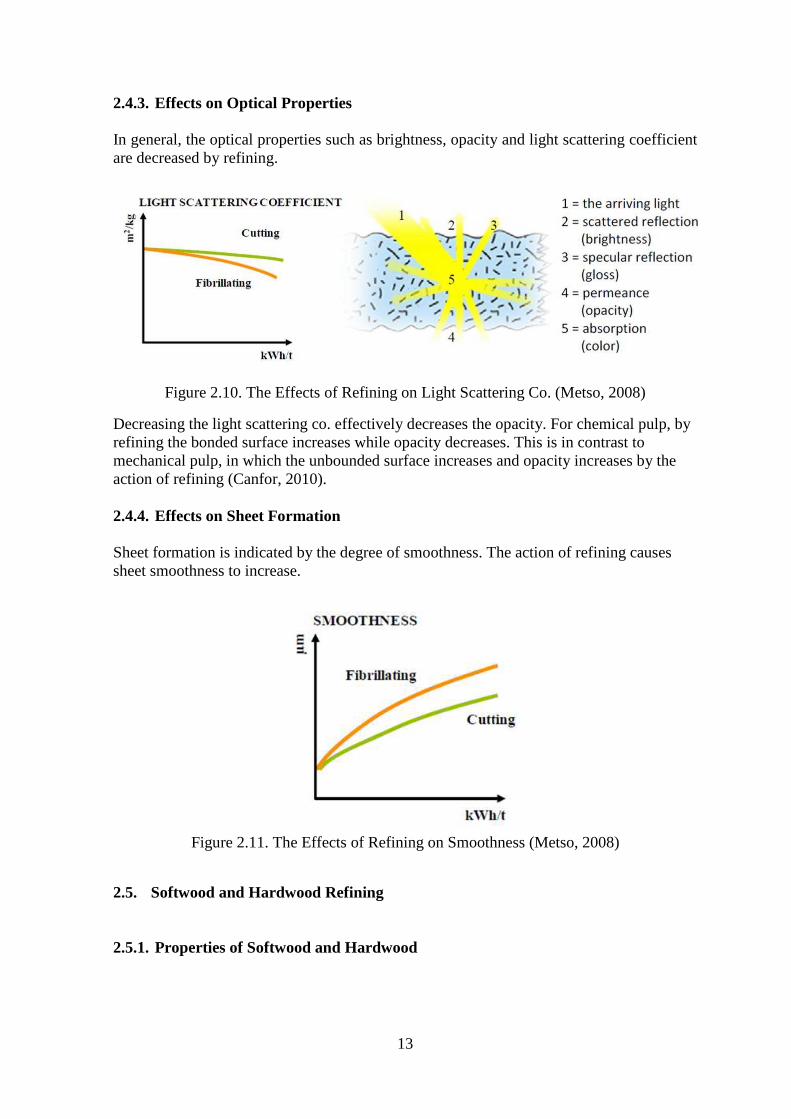
2.4.3. Effects on Optical Properties In general, the optical properties such as brightness, opacity and light scattering coefficient are decreased by refining.
Figure 2.10. The Effects of Refining on Light Scattering Co. (Metso, 2008)
Decreasing the light scattering co. effectively decreases the opacity. For chemical pulp, by refining the bonded surface increases while opacity decreases. This is in contrast to mechanical pulp, in which the unbounded surface increases and opacity increases by the action of refining (Canfor, 2010). 2.4.4. Effects on Sheet Formation Sheet formation is indicated by the degree of smoothness. The action of refining causes sheet smoothness to increase.
Figure 2.11. The Effects of Refining on Smoothness (Metso, 2008)
2.5. Softwood and Hardwood Refining 2.5.1. Properties of Softwood and Hardwood
14
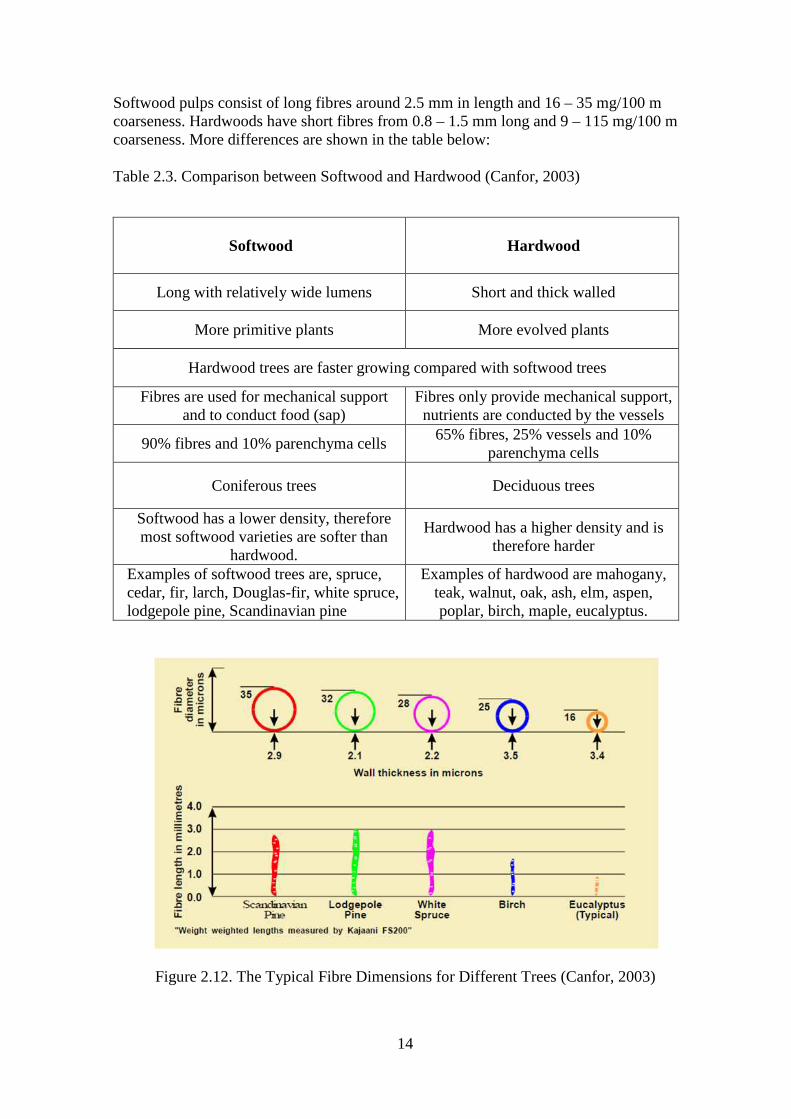
Softwood pulps consist of long fibres around 2.5 mm in length and 16 – 35 mg/100 m coarseness. Hardwoods have short fibres from 0.8 – 1.5 mm long and 9 – 115 mg/100 m coarseness. More differences are shown in the table below: Table 2.3. Comparison between Softwood and Hardwood (Canfor, 2003)
Softwood Hardwood
Long with relatively wide lumens Short and thick walled
More primitive plants More evolved plants
Hardwood trees are faster growing compared with softwood trees
Fibres are used for mechanical support and to conduct food (sap)
Fibres only provide mechanical support, nutrients are conducted by the vessels
90% fibres and 10% parenchyma cells 65% fibres, 25% vessels and 10%
parenchyma cells
Coniferous trees Deciduous trees
Softwood has a lower density, therefore most softwood varieties are softer than
hardwood.
Hardwood has a higher density and is therefore harder
Examples of softwood trees are, spruce, cedar, fir, larch, Douglas-fir, white spruce, lodgepole pine, Scandinavian pine
Examples of hardwood are mahogany, teak, walnut, oak, ash, elm, aspen, poplar, birch, maple, eucalyptus.
Figure 2.12. The Typical Fibre Dimensions for Different Trees (Canfor, 2003)

15
Long-fibred softwood pulps easily get stapled to the bar edges and build strong flocs that do not easily break during refining. Decreased gap clearance hastens refining degree change and increases fibre cutting. On the contrary, it is more difficult to get short-fibred hardwood pulps stapled on the bar edges, and they build weak flocs that easily break during refining. Therefore, the refiner fillings for softwood and hardwood need to be different to reflect these attributes. Decreased gap clearance means slower refining, and bars easily establish contact for refining the hardwood. Long fibres (softwood) are strongest and have the highest refining resistance, and require high refining energy and coarse fillings. Short fibres (hardwood) are the weakest with lowest refining resistance, requiring low refining energy and fine fillings. This means low refining intensity usually gives a better refining result with hardwood fibres (Helsinki, 2000). Simply put, the strength quality of softwood fibres is higher than hardwood. On the other hand, refining softwood will consume higher energy than hardwood. 2.5.2. Methodology of Combining Materials in Refining As explained previously, softwood and hardwood pulps have different roles in paper properties. The role of softwood fibres is to ensure the strength of the paper. The reinforcement fibres are flexible, strong and long. Thin-walled fibres are flexible and can get close together ensuring better bonding ability. Thick-walled fibres yield high tear strength. The role of hardwood fibres is different, as they ensure better printability of the paper. Short fibres and narrow fibre length distribution give good sheet formation. Sufficient tensile strength and tear strength are also required for good runnability. The higher the number of fibres per gram, the better the optical properties of the sheet are. The method of mixing the two types of pulp is also important. There are two different ways to refine the different kinds of pulp which are often used in the paper industry. The separate refining system and the mixed refining system are commonly used in the pulp and paper industry (Latinen, 2010). Both separate and mixed systems are widely used. The newer technology is the separate refining method. Usually the new paper machines use separate refining, while older paper machines still use mixed refining. Mixed refining is also referred to as co-refining. In both cases, it is good to have a trimming refiner after the mixing chest, homogenizing of the fibre mixture by cutting fibres that are too long for better sheet formation, and reconditioning fibres from the broke line. Both separate and mixed refining systems have their advantages. Some paper mills also use a combination of both methods.

16
Figure 2.13. Separate and Mixed Refining Systems (Paulapuro, 2000)
The separate refining system means each pulp type is refined separately on individual lines before blending in the mixing chest. For mixed / co-refining system, both pulps are refined together on one line. There are several studies that have found the strength properties to be better after separate refining than after co-refining (Stevens, 1992), (Nuttall et al, 1999), (Baker, 1995), however some studies observed the opposite (Ghost et al, 2003). The studies were mostly done using different pulps. All researchers agreed that changes in fibre properties due to refining response are very important. Optical properties were nearly always reported to be better after separate refining. The advantage of separate refining is that it enables papermakers to refine at optimum intensity and energy for each pulp type. In mixed refining, energy and intensity are not distributed to different components according to mass fraction. For softwood/hardwood mixtures, softwood takes the larger proportion of energy. If the proportion of hardwood is

17
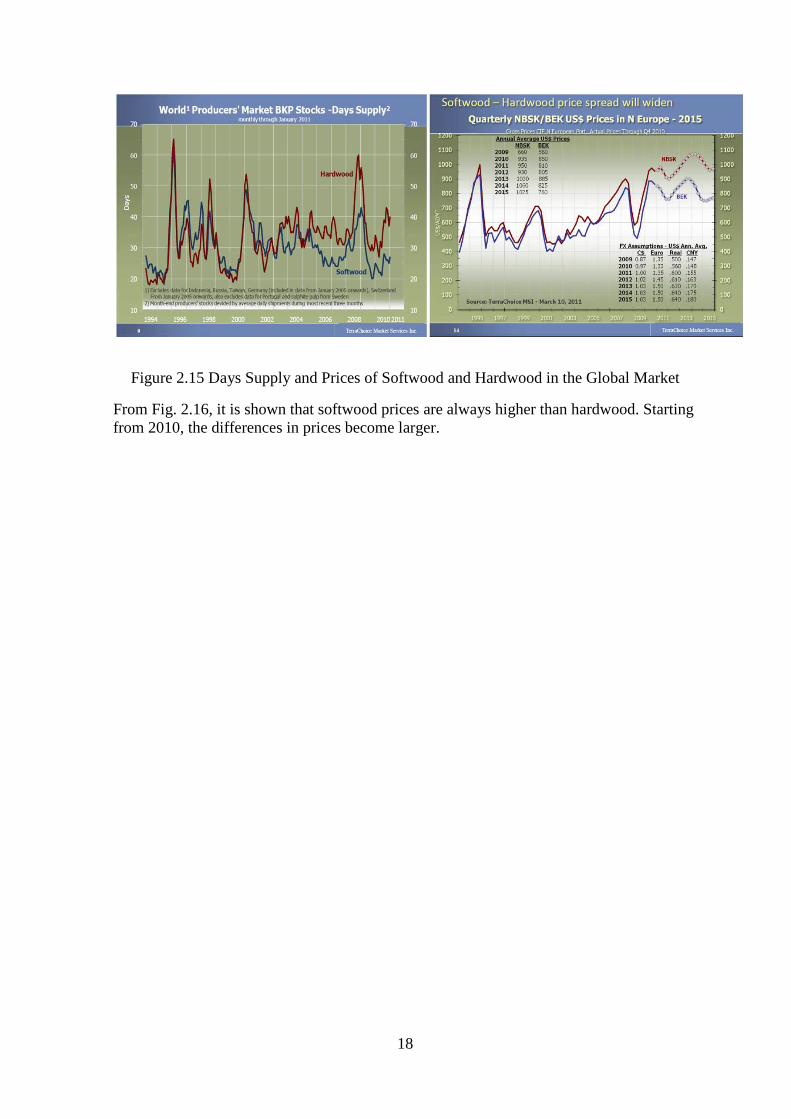
less than 20 or 25 %, Canfor (2010) suggests using softwood conditions. It means in that range of less hardwood proportion, the refining will consume the same energy as refining of 100% softwood. While using the same energy consumption, the strength of 100% softwood is higher. Mohlin (2006) performed an experiment using mixtures of eucalyptus and Scandinavian softwood refined in a conical refiner at a flow rate of 600 l/m. The hardwood proportions studied were 0%, 50%, 75%, 90% and 100% Eucalyptus. One of the conclusions reached from this work was that the no-load power was reduced in relation to the proportion of eucalyptus, 52 kW to 34kw for 0% and 100% additional hardwood, respectively. 2.5.3. Softwood and Hardwood on The Global Market Figures 2.14 and 2.15 show the global trends in market pulp, specifically for Bleached Eucalyptus Kraft (BEK) which is representative of Hardwood, and Northern Bleached Softwood Kraft (NBSK). China is still driving the global market of paper & board product. Figure 2.15 shows the number of tons of paper products between 1998 and 2011, in China. The production of hardwood is higher than softwood. The same result is shown in Figure 2.16 too. The days supply of hardwood is higher that softwood. The growth rate of feedstock probably has an effect in paper production, as hardwood trees are usually faster-growing than softwood.
Figure 2.14 Paper & board Global market and Monthly Import of Paper in China
18
Figure 2.15 Days Supply and Prices of Softwood and Hardwood in the Global Market
From Fig. 2.16, it is shown that softwood prices are always higher than hardwood. Starting from 2010, the differences in prices become larger.

19
CHAPTER III MATERIALS AND METHODS
3.1. Materials 3.1.1. Pulp Chemical bleached pulp softwood and hardwood were used as raw materials. The softwood bleached pulp was collected from the Canfor pulp mill in Canada. It was a mix of 70-80% lodgepole pine, 20-30% white spruce and 5% sub alpine fir. The fibre length for this kind of pulp was approximately 2.4-2.6 mm. The hardwood bleached pulp was supplied by CMPC Pulp's Santa Fe mill in Chile. It was a eucalyptus bleached kraft pulp.
3.1.2. Low Consistency Refining Equipment This low consistency refining experiment was done in the University of British Columbia’s Pulp & Paper Centre. There are many pieces of equipment in this low consistency refining facility (refiner plant). They include 2 mixing tanks which have 4000 liters of capacity, pipes, valves, pressure and temperature sensors, a speed pump, a motor with 1800 RPM and 150HP capacity and of course a refining machine with FineBar refiner plate patterns. Fluid with low consistency pulp flows through the system (refining loop) by passing through pipes, while process parameters are controlled by the computer.
Figure 3.1. LC Refining Equipment (Pulp and Paper Centre, UBC)
Refiner
20
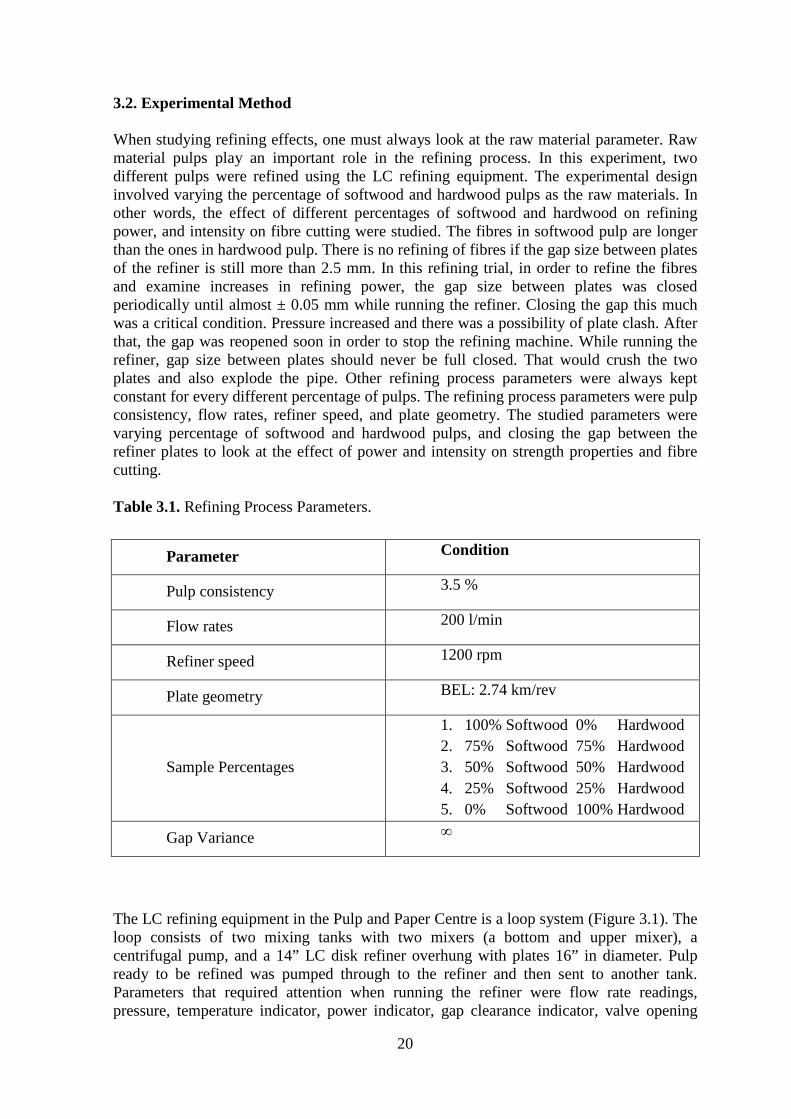
3.2. Experimental Method When studying refining effects, one must always look at the raw material parameter. Raw material pulps play an important role in the refining process. In this experiment, two different pulps were refined using the LC refining equipment. The experimental design involved varying the percentage of softwood and hardwood pulps as the raw materials. In other words, the effect of different percentages of softwood and hardwood on refining power, and intensity on fibre cutting were studied. The fibres in softwood pulp are longer than the ones in hardwood pulp. There is no refining of fibres if the gap size between plates of the refiner is still more than 2.5 mm. In this refining trial, in order to refine the fibres and examine increases in refining power, the gap size between plates was closed periodically until almost ± 0.05 mm while running the refiner. Closing the gap this much was a critical condition. Pressure increased and there was a possibility of plate clash. After that, the gap was reopened soon in order to stop the refining machine. While running the refiner, gap size between plates should never be full closed. That would crush the two plates and also explode the pipe. Other refining process parameters were always kept constant for every different percentage of pulps. The refining process parameters were pulp consistency, flow rates, refiner speed, and plate geometry. The studied parameters were varying percentage of softwood and hardwood pulps, and closing the gap between the refiner plates to look at the effect of power and intensity on strength properties and fibre cutting. Table 3.1. Refining Process Parameters.
Parameter Condition
Pulp consistency 3.5 %
Flow rates 200 l/min
Refiner speed 1200 rpm
Plate geometry BEL: 2.74 km/rev
Sample Percentages
1. 100% Softwood 0% Hardwood 2. 75% Softwood 75% Hardwood 3. 50% Softwood 50% Hardwood 4. 25% Softwood 25% Hardwood 5. 0% Softwood 100% Hardwood
Gap Variance ∞
The LC refining equipment in the Pulp and Paper Centre is a loop system (Figure 3.1). The loop consists of two mixing tanks with two mixers (a bottom and upper mixer), a centrifugal pump, and a 14” LC disk refiner overhung with plates 16” in diameter. Pulp ready to be refined was pumped through to the refiner and then sent to another tank. Parameters that required attention when running the refiner were flow rate readings, pressure, temperature indicator, power indicator, gap clearance indicator, valve opening

21
reading, pump frequency reading, and the refiner speed. All of them are controlled using a computer interface. The computer data can be monitored and retrieved by using the LabVIEW™ program. The refining loop can perform one trial each day. For instance, 100% softwood and 0% hardwood were run the first day, 75% softwood and 25% hardwood the second day, and so on until all samples were completed. In order to get 3.5% consistency in 4,000 litres total volume, the total dry weight of pulp was be 140 kg. Dry weight of softwood was 0.501 grams/sheet and hardwood was 0.725 gram/sheet. Below is the table of pulp composition needed to get 3.5% consistency in 4,000 litres of total volume. Table 3.2. Weight and Sheet Quantity of Softwood and Hardwood Pulp
Sample Percentages Softwood Hardwood
100% Softwood 0% Hardwood
140 kg/ 279 sheet)
- -
75% Softwood 25% Hardwood
105 kg/ 210 sheet
35 kg/ 48 sheet
50% Softwood 50% Hardwood
70 kg/ 140 sheet
70 kg/ 97 sheet
25% Softwood 75% Hardwood
35 kg/ 70 sheet
105 kg/ 145 sheet
0% Softwood 100% Hardwood
- -
140 kg/ 193 sheet
The detailed procedure to run the LC refiner can be seen below. It was based on the refiner trial working manual (Darychuk, 2012) 3.2.1. Preparation of Refiner/Trial Process
a. All the electrical power supplies to the refiner loop equipment were already switched on at least 2 hours before trial to let them warm up. The electrical power supplies include the high voltage power box, VFD electrical cabinet power, DAQ board power, pump controller, DAQ computer, and Gap controller power. For the pump, the jog button had been switched to ref. mode and VFD had been switched to remote (switch speed ref. source to REM and use CCW option for rotation direction).
b. Tank A was used for soaking and mixing of pulp. The butterfly valve at the bottom of the tank also was closed, then the tank was filled with 1000 L of water before adding any pulp.
c. The amount of added pulp had been counted based on hardwood and softwood proportion in order to get 3.5 % consistency in 4000 liters of water. Pulp was mixed in the tank for 4 hours. The lower mixer had been set to 47 RPM, and upper mixer had been at 20 Hz, on Reverse mode)

22
d. After the pulp suspension had been mixed for long enough, consistency was measured to make sure the consistency was right. Consistency was adjusted if needed by adding some water or pulp.
e. When pulp was being mixed, plates were installed based on proper procedures. Top cover and the gap motor connection shaft were removed. It was ensured that plate 1 went on rotor and plate 2 went on stator. The plate used was BEL number 2.74 km/rev. Each bolt type had its own torque requirement for making the bolt tight. 65 N.m torque was used here. The refiner door was closed carefully. The pipe join was certainly in the right position and tight enough.
f. LabVIEW (Aikawa Refiner icon on computer desktop) was opened and calibrated. To calibrate the gap, the drainage valve to the refiner was be opened in advance. Refiner shaft cover and gap motor connection shaft was removed. Gap was closed manually until plates were touching. LabVIEW user interface VI on DAQ computer desktop was opened and zero offset adjustments were done for power, pressure in, pressure out and also gap. The run button on the LabVIEW UI was engaged to make sure the zero offset adjustments had succeeded. Then the gap was opened manually to about 9.0 mm (read on the LabVIEW UI) and the LabVIEW UI was stopped. The gap motor connection shaft and refiner shaft cover were re-installed.
g. All loop valve positions were re-checked and verified so that pulp could be circulated as desired. The refiner drainage valve was closed. Seal water was turned on. Then, the system was ready to run.
3.2.2. During the Refiner Trial Process
a. Run button in LabVIEW and drive start button on the VFD electrical cabinet were pressed.
b. The pump was set to ref mode by using the jog function and the run button was pressed.
c. In LabVIEW, the refiner was started at low RPM (600 RPM) and the pump was turned on to the desired Hz. The pump starts slowly before increasing to the desired frequency.
d. Valves underneath the appropriate pulp tank were opened. e. Refiner speed was incremented to 1200 RPM as the set point in this experiment. f. Valve position and pump frequency were changed slowly and stabilized at 200 l/m
gradually. This slow adjustment was needed so that pressure in and out were not significantly different. At this time, the gap size between plates was still around 9 mm. Gap between plates was then closed to 2.5 mm. The flow rate was maintained at 200 l/m.
g. After parameters reached the set point (refiner speed: 1200 rpm & flow rate: 200 l/m), the consistency sample was be taken.
h. At this time, the gap size between plates was 2.5 mm. This is called by no load condition. At this time, the no load power was determined. The no load power value was entered into the appropriate field on the LabVIEW UI.
i. One extra person was asked to sit near the VFD to record the RPM and refining power off the VFD display at each sample point. This was used to compare the

23
reading shown in VFD display and LabVIEW on the computer. There should be no significant difference between VFD display and computer LabVIEW.
j. For the first sample sequence (G0): File name was typed in the beginning to the LabVIEW (example: 100%SW G0). Clicked “Log Data” to start logging, prompted RPM/POWER reader to record RPM/POWER displayed on VFD. Counted around 5 seconds and clicked again on “Log Data” to stop logging data, and prompted sample taker to collect pulp sample from sampling point.
k. For the second sample sequence (G1). The gap size was taken to 1.3 mm. Another name was typed for this sequence (example 100%SW G1) (different name should be used; otherwise the previous data will be copied over with new data). File name was typed as “100SW G1”, clicked “Log Data” to start logging, prompted RPM/POWER reader to record RPM/POWER displayed on VFD. Counted around 5 seconds and clicked again “Log Data” to stop logging data, and sample taker was also asked to take the pulp sample from sampling point.
l. Further gap size and samples were obtained in the same way until the minimum gap size was reached. The different values of target gap size were as below.
Table 3.3. Gap Size Variance
Gap Number
G0/G2.5 G1 G2 G3 G4 G5
....
Gn
Gap Size (mm)
2.5 1 0.5 0.3 0.2 0.1 0.05
Figure 3.2. Design of LC Refiner Loop System
24
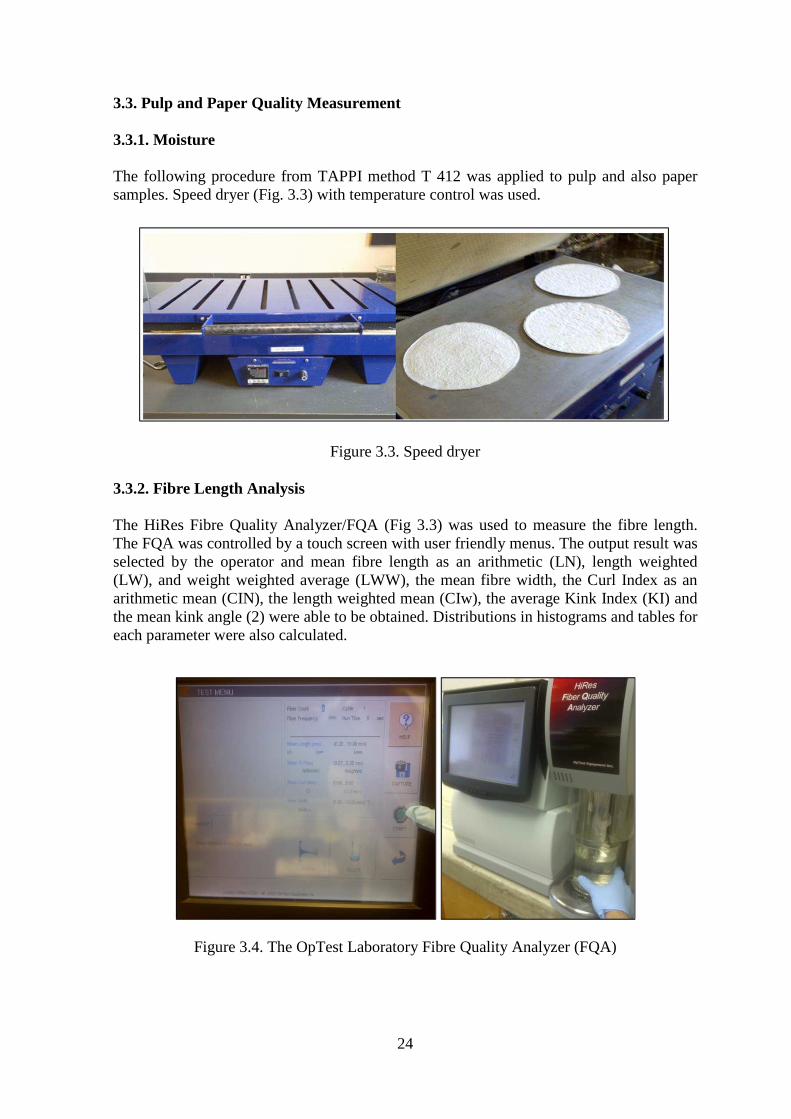
3.3. Pulp and Paper Quality Measurement 3.3.1. Moisture The following procedure from TAPPI method T 412 was applied to pulp and also paper samples. Speed dryer (Fig. 3.3) with temperature control was used.
Figure 3.3. Speed dryer 3.3.2. Fibre Length Analysis The HiRes Fibre Quality Analyzer/FQA (Fig 3.3) was used to measure the fibre length. The FQA was controlled by a touch screen with user friendly menus. The output result was selected by the operator and mean fibre length as an arithmetic (LN), length weighted (LW), and weight weighted average (LWW), the mean fibre width, the Curl Index as an arithmetic mean (CIN), the length weighted mean (CIw), the average Kink Index (KI) and the mean kink angle (2) were able to be obtained. Distributions in histograms and tables for each parameter were also calculated.
Figure 3.4. The OpTest Laboratory Fibre Quality Analyzer (FQA)
25
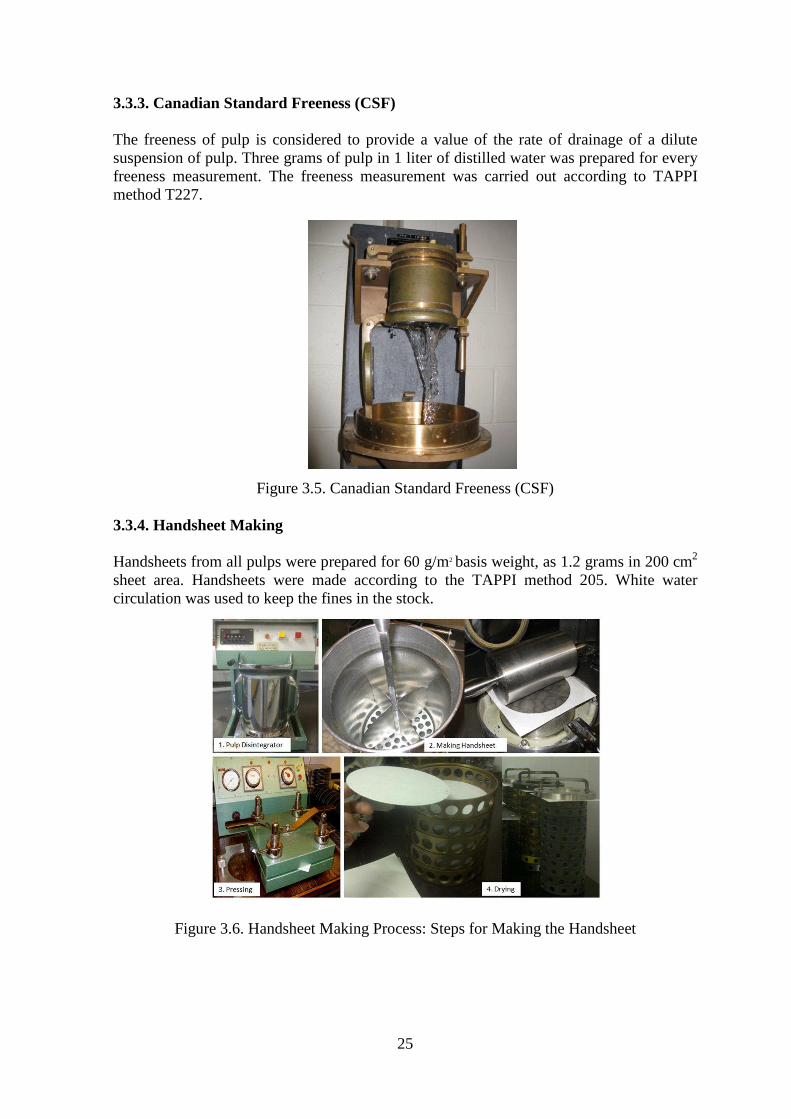
3.3.3. Canadian Standard Freeness (CSF) The freeness of pulp is considered to provide a value of the rate of drainage of a dilute suspension of pulp. Three grams of pulp in 1 liter of distilled water was prepared for every freeness measurement. The freeness measurement was carried out according to TAPPI method T227.
Figure 3.5. Canadian Standard Freeness (CSF) 3.3.4. Handsheet Making Handsheets from all pulps were prepared for 60 g/m2 basis weight, as 1.2 grams in 200 cm2 sheet area. Handsheets were made according to the TAPPI method 205. White water circulation was used to keep the fines in the stock.
Figure 3.6. Handsheet Making Process: Steps for Making the Handsheet
26
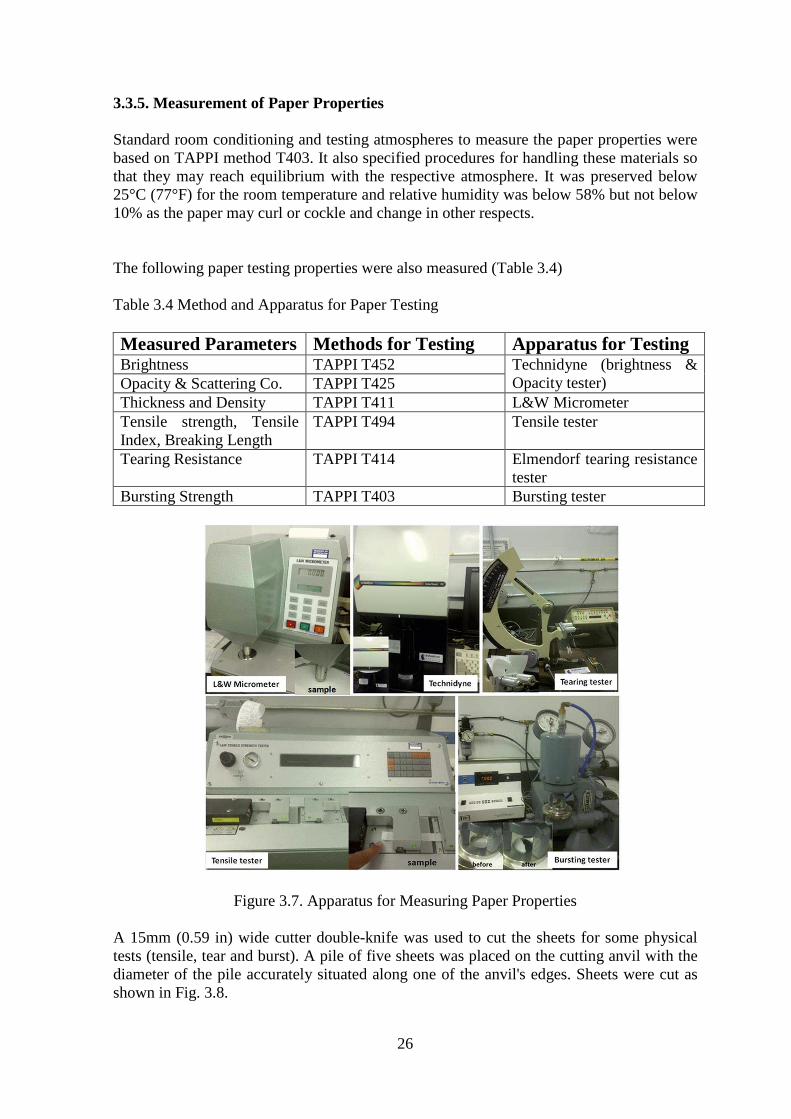
3.3.5. Measurement of Paper Properties Standard room conditioning and testing atmospheres to measure the paper properties were based on TAPPI method T403. It also specified procedures for handling these materials so that they may reach equilibrium with the respective atmosphere. It was preserved below 25°C (77°F) for the room temperature and relative humidity was below 58% but not below 10% as the paper may curl or cockle and change in other respects. The following paper testing properties were also measured (Table 3.4) Table 3.4 Method and Apparatus for Paper Testing Measured Parameters Methods for Testing Apparatus for Testing Brightness TAPPI T452 Technidyne (brightness &
Opacity tester) Opacity & Scattering Co. TAPPI T425 Thickness and Density TAPPI T411 L&W Micrometer Tensile strength, Tensile Index, Breaking Length
TAPPI T494 Tensile tester
Tearing Resistance TAPPI T414 Elmendorf tearing resistance tester
Bursting Strength TAPPI T403 Bursting tester
Figure 3.7. Apparatus for Measuring Paper Properties A 15mm (0.59 in) wide cutter double-knife was used to cut the sheets for some physical tests (tensile, tear and burst). A pile of five sheets was placed on the cutting anvil with the diameter of the pile accurately situated along one of the anvil's edges. Sheets were cut as shown in Fig. 3.8.

27
Figure 3.8. Cutting the Handsheets 3.3.6. Fibre Fibrillation A microscope was used to visually examine the different fibres before and after refining. The procedure for using this equipment was based on the manual for the Nikon microscope PPCT 1020.
Figure 3.9. Nikon Photomicrography in PPC Laboratory
28
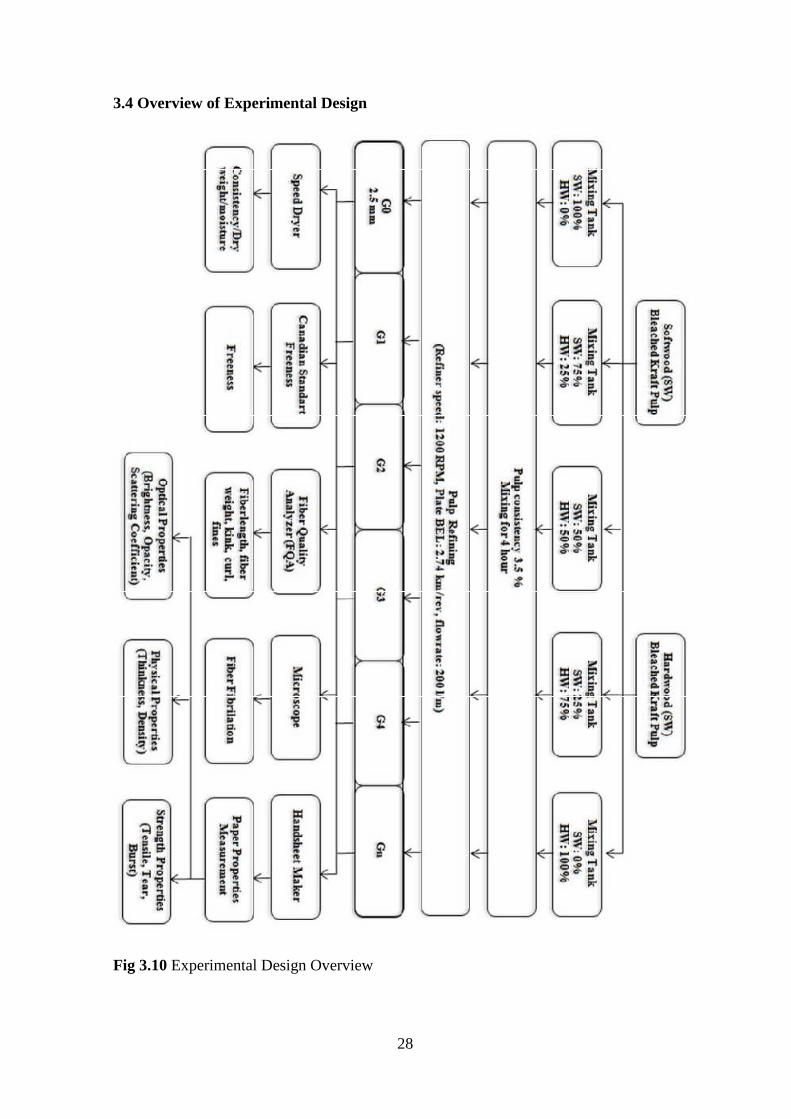
3.4 Overview of Experimental Design Fig 3.10 Experimental Design Overview
29
CHAPTER IV RESULTS AND DISCUSSION
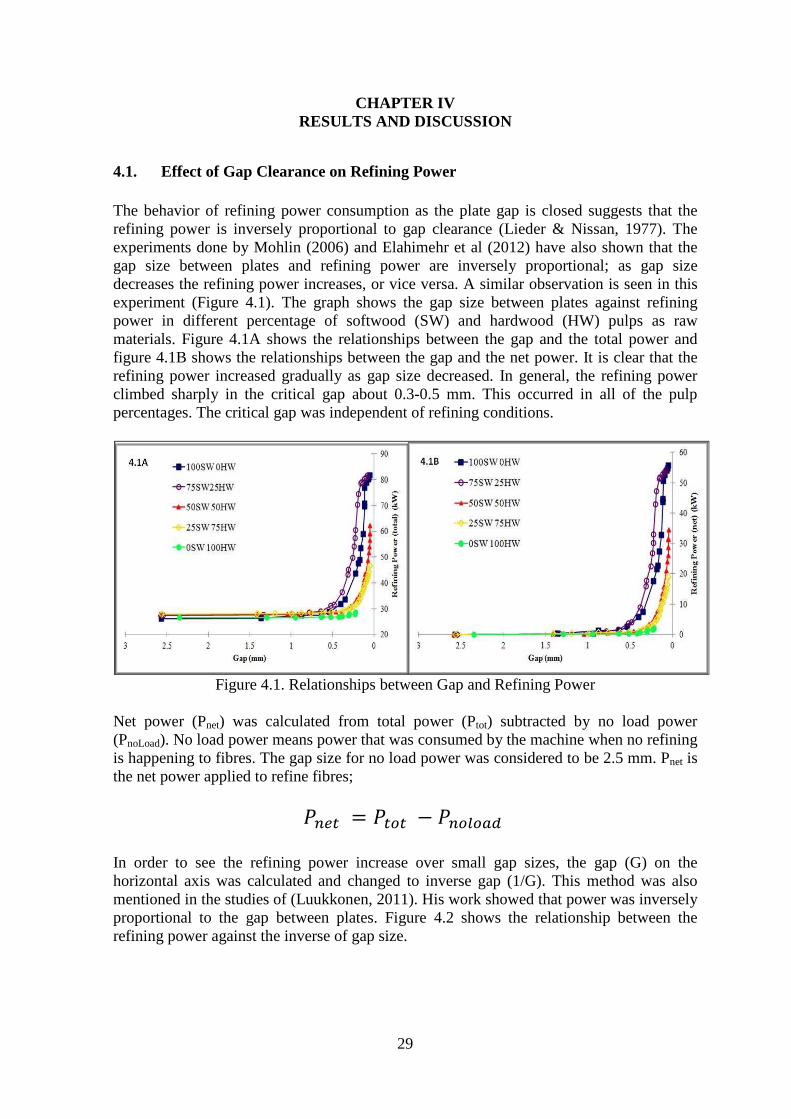
4.1. Effect of Gap Clearance on Refining Power The behavior of refining power consumption as the plate gap is closed suggests that the refining power is inversely proportional to gap clearance (Lieder & Nissan, 1977). The experiments done by Mohlin (2006) and Elahimehr et al (2012) have also shown that the gap size between plates and refining power are inversely proportional; as gap size decreases the refining power increases, or vice versa. A similar observation is seen in this experiment (Figure 4.1). The graph shows the gap size between plates against refining power in different percentage of softwood (SW) and hardwood (HW) pulps as raw materials. Figure 4.1A shows the relationships between the gap and the total power and figure 4.1B shows the relationships between the gap and the net power. It is clear that the refining power increased gradually as gap size decreased. In general, the refining power climbed sharply in the critical gap about 0.3-0.5 mm. This occurred in all of the pulp percentages. The critical gap was independent of refining conditions.
Figure 4.1. Relationships between Gap and Refining Power
Net power (Pnet) was calculated from total power (Ptot) subtracted by no load power (PnoLoad). No load power means power that was consumed by the machine when no refining is happening to fibres. The gap size for no load power was considered to be 2.5 mm. Pnet is the net power applied to refine fibres;
��� = ��� − ������ In order to see the refining power increase over small gap sizes, the gap (G) on the horizontal axis was calculated and changed to inverse gap (1/G). This method was also mentioned in the studies of (Luukkonen, 2011). His work showed that power was inversely proportional to the gap between plates. Figure 4.2 shows the relationship between the refining power against the inverse of gap size.

30
The refining power is approximately linear to the inverse of gap clearance, which is:
# ∝%
&
Figure 4.2. Relationship between Inverse of Gap and Refining Power
In general, there was a rapid increase in refining power after passing this critical gap point. In practice, gap size is independent of refining condition. Mechanically closing the gap between plates is the way the gap size is made smaller. The refining power is an important parameter and it leads to concern. In some cases, it is possible that the gap size experienced a shift but still gave the same number of refining power. In mixed refining, energy and intensity did not distribute on the different pulp components according to mass fraction. For softwood/hardwood mixtures, softwood took a larger proportion of refining power. The information given in Figures 4.1 and 4.2 implies that refining power for 100% softwood pulps and 75% softwood pulps mixed with 25% hardwood consumed significantly more refining power than mixtures with a 50% or greater fraction of hardwood pulp. For example, in this experiment the highest total refining power required for 100% softwood pulps and 75% softwood pulps mixed with 25% hardwood is nearly 80 kW, compared to 50 kW and 40 kW for softwood pulps mixed with 50% and 75% hardwood. Only 29 kW of total power was consumed for 100% hardwood pulp. In this experiment, the power consumption result for the mixtures with less than 25% hardwood was unexpected. In some cases, at the same gap size, pulps with 75% softwood consumed more energy than 100% softwood. However, it was quite similar at gaps smaller than 0.1 mm. This could have been due to gap adjustment error during that trial. The total power consumption for very small gap sizes for 100% softwood and 75% softwood was almost the same because the proportion of additional hardwood was small. Other researchers have found that mixing pulps with a small amount of hardwood in co-refining shows very similar behavior to 100% softwood pulps. With co-refining, softwood fibres can be expected to be more refined while hardwood fibres are less refined (Kibblewhite, 1993). More fibres refined means increasing refining power. It was noted in a Canfor pulp refining seminar (2010b) that if the percentage of hardwood mixing is less than 25%, it will give the same refining conditions as pure softwood. Mohlin (2007)
31
performed a co-refining experiment, but only added large proportions of hardwood. The smallest hardwood percentage in her experiment was 50%. In this experiment, there was very little refining action during the 100% hardwood pulp trial. A higher refining power consumed indicated that more fibres were refined. There was only a small increase in total refining power, from just under 27 kW to nearly 29 kW at small gaps. The smallest gap size that could be reached was only 0.2 mm. With this condition, very little refining happened to the hardwood fibres. When the gap became very small, the plates became close to each other and the hardwood pulp, being only comprised of very short fibres, did not load the refiner bars adequately, so the refiner become quite noisy. This meant that the plates were nearly touching each other with very small fibres passing in between. At that time the researchers decided to stop the refiner to avoid damage to the plates. This occurrence indicates that the plate used in this experiment, with a BEL of 2.74 km/rev, is not recommended to refine hardwood fibres. The bar width of this plate is 1.6 mm, which is much larger than the average fibre length of the hardwood used, which was 0.79 mm. Certainly, a plate with a smaller bar width size than the plate used in this experiment is required for refining hardwood pulp.
4.2. Effects on Fibre Length Distribution
The values of length-weighted average fibre length were obtained by grouping the number of fibres in each length class, as reported by the FQA. The ISO 16065 setting was used for measurement. Some properties had test range limits that were wider than the default limit values. The ISO 16065 default setting recorded fibre length from 0.2 – 10 mm, fines from 0.07 – 0.2 mm and fibre width from 7 – 60 µm. The length weighted fibre distributions for the different pulp samples (Figure 4.3) give additional information beyond the simple figure of average fibre length.

32
Figure 4.3. Length-weighted Distribution of Unrefined Pulps (Gap size ≥ 2.5 mm)
The information given in the graph implies that samples which have high softwood (SW)
percentages are more heterogeneous in fibre length, although their average length is higher.
The high proportion of short fibres is from the 100% hardwood (HW) sample. Hardwood
fibres are much shorter, but significantly more uniform in fibre length.
The mechanism of fibre shortening happens during refining. It is very crucial to understand
the effect of refining on fibre length because it is a limitation of low consistency refining
(Olson et al, 2003). Some fibres are cut when they are between bar plates during refining.
This commonly happened during refining.
Fig. 4.4A Fig. 4.4B
33
Figure 4.4. Relationships between Fibre Length, Gap and Refining Power
Fibre length is known to decrease during refining when the gap reaches a certain critical
gap. Similar findings have been reported by (Luukkonen, 2011) and (Elahimehr et al,
2012). Figure 4.4 shows the relationship between fibre length and gap size for all pulp
percentages. The x axis of this graph shows the gap size between plates from 0 mm to 3
mm, while the fibre length is on the y axis. The refining power is shown on the z axis. It is
shown similarly in all pulp percentages that fibre length remained steady until the gap
reached a certain critical gap, and then it dropped considerably. The refining power also
increased when the gap reached the critical gap. This indicates that the fibres were refined
in that condition. The graphs show that the critical gap size depends on initial fibre length.
In 100% softwood the initial fibre length was around 2.6 mm, which is the longest average
initial fibre length encountered in this experiment. The critical gap for this fibre length is
around 0.52 mm. After mixing with 25% hardwood, the average initial fibre length was
reduced to 1.78 mm. For this mixture, the critical gap decreased slightly to 0.48 mm. Co-
refining with 50% softwood and 50% hardwood showed a significant reduction in critical
gap, which was 0.4 mm due to an average initial fibre length just under 1.37 mm. The
longer the fibre to be refined is, the sooner the refining power increases as gap closes,
because the critical gap clearance is reached more quickly. Other conditions are
summarized in Table 4.1.
Fig. 4.4C Fig. 4.4D
Fig. 4.4E Fig. 4.4F

34
Table 4.1. Summary of Characteristics for Critical Gap for Different Fibre Lengths
Softwood/Hardwood Percentage
No Load Power (kW)
Initial Length-weighted
(mm)
Critical Gap Clearance
(mm) 100/0 26.2 2.61 0.54 75/25 27.4 1.78 0.52 50/50 27.8 1.37 0.40 25/75 27.8 1.01 0.35 0/100 26.5 0.79 0.28
No load power is the initial power consumed by machine before refining. No fibres are refined at the beginning of a trial when no load power is determined (Gap size: 2.5 mm). The no load power will increase if refiner speed is increased. This is because the refiner uses the motor to drive the rotor plate of refiner. The higher refiner speed needs more power to operate the motor (Pattara, 2012). In this experiment, the no-load power values are almost the same for all mixtures, approximately 27 kW. This indicates that there is no significant impact of different pulp mixtures on no load power. A different conclusion was showed by Mohlin (2007) who found that by increasing weight-proportion of hardwood pulp, the no-load power was decreased. According to her result, the no-load power was reduced for 0% hardwood and 100% hardwood, accounting for 52 kW and 34 kW, respectively. It’s predicted because of the refiner equipment used and some refining parameters are different. All fibre lengths were reported as the length weighted average (LW) of detected fibres. This value is most often used to compare differences between samples. Fines tend to have only a minor effect on this result. Figure 4.5 shows the evolution of the fibre length before and after refining. Before refining, the gap size was 2.5 mm or more. In other words, only no load power was consumed by the machine. After refining means fibres are being refined in conditions after gap is closing until around 0.05 mm. For the maximum level of refining, most of the samples in this experiment can reach a gap of around 0.05 mm (except in the 100% hardwood trial*).
Figure 4.5. Fibre Length-weighted Average of Unrefined & Refined Samples

35
From the information given, it can be concluded that there was a small decrease in fibre
length after refining due to cutting of fibres during refining. For example, for 100%
softwood, fibre length before refining was 2.612 mm, and after refining was 2.536 mm,
which is about a 3% reduction in fibre length. Fibre shortening happens when stator and
rotor plates are separated by a very small gap clearance during refining, and pressure is
given to fibres in between. As a result, fibre cutting occurs causing a small decrease in
fibre length.
Figure 4.6. Relationships between Length-weighted Fibre Length and Specific Refining
Energy
Fibre length distribution was also investigated for unrefined and refined pulp samples. This investigation is required since the long fibre fraction is very important in terms of paper strength. Figures 4.4B & 4.5 show the evolution of the length weighted fibre length during refining. Figure 4.6 shows the fibre length plotted against the net specific refining energy for all different pulp mixtures. As shown in Figure 4.6, the observation forms a very smooth curve. In this case, specific energy is well suited to characterize the reduction in length weighted fibre length during refining. The highest SRE is encountered in the sample with 100% softwood. The higher the SRE, the more refining action is taking place. However, it seems that a higher SRE reduces the average measured fibre length. Shortening of fibres is generally undesirable. Figure 4.7 – 4.11 shows the distribution of fibre length per unit mass of pulp for every different mixture.

Figure 4.7. Fibre Length-Softwood Sample
Figure 4.8. Fibre Length-25%HW)
Figure 4.9. Fibre Length-weighted Distributions in a Unit Mass of Pulp (50%SW & 50%HW)
36
-weighted Distributions in a Unit Mass of Pulp for 100%
-weighted Distributions in a Unit Mass of P
weighted Distributions in a Unit Mass of Pulp (50%SW &
4.7A
4.8A
4.9A
weighted Distributions in a Unit Mass of Pulp for 100%
weighted Distributions in a Unit Mass of Pulp (75%SW &
weighted Distributions in a Unit Mass of Pulp (50%SW &
4.7B
4.8B
4.9B
37
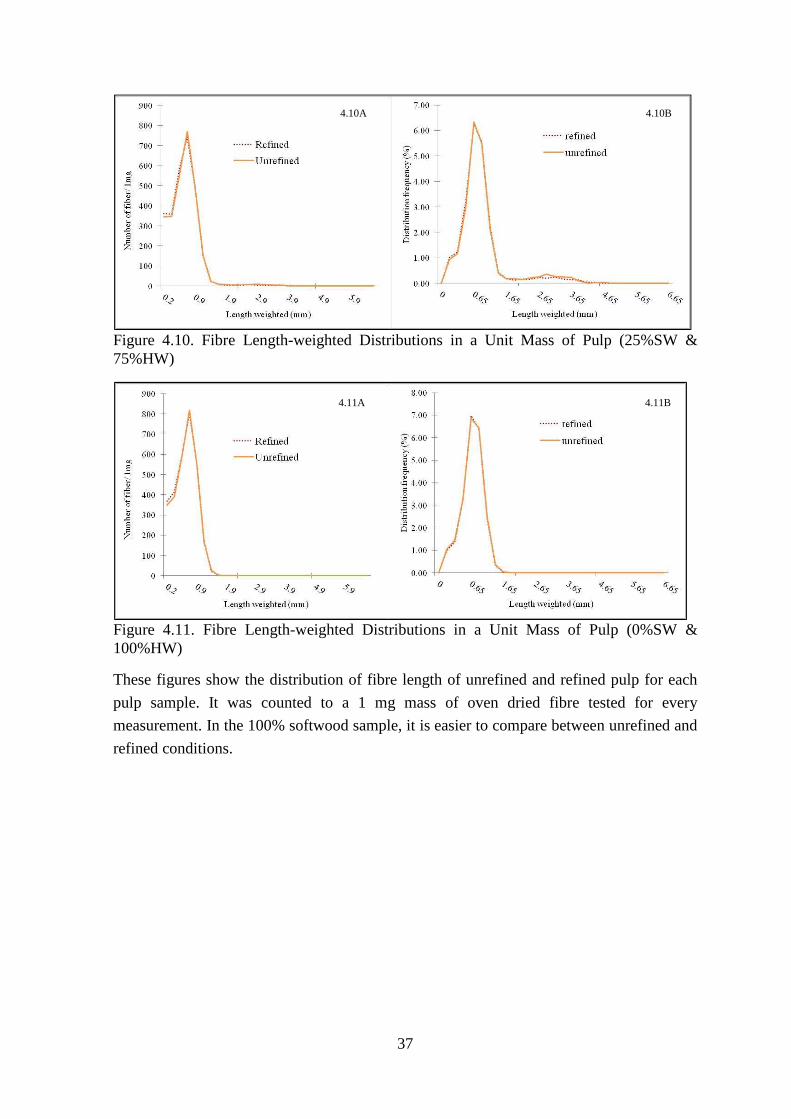
Figure 4.10. Fibre Length-weighted Distributions in a Unit Mass of Pulp (25%SW & 75%HW)
Figure 4.11. Fibre Length-weighted Distributions in a Unit Mass of Pulp (0%SW & 100%HW)
These figures show the distribution of fibre length of unrefined and refined pulp for each
pulp sample. It was counted to a 1 mg mass of oven dried fibre tested for every
measurement. In the 100% softwood sample, it is easier to compare between unrefined and
refined conditions.
4.10B 4.10A
4.11B 4.11A

38
Figure 4.12. Magnification of Smaller Area of Fig 4.7 (100%SW & 0%HW)
Expanded views of the distribution in Fig. 4.7 showing only the long fibre data (length >
2mm) are presented in Fig. 4.12. From Fig. 4.12 it was calculated based on the number of
fibres x length weighted, that the average fibre loss in the range of 2.15 mm – 4.15 mm
was almost 14.31%. In contrast, the number of fines in the range of 0.2 – 0.4 mm increased
by 39.53% (Figure 4.7). The average fibre length decreased because fibres of small size
were increased after refining. In some cases, the number of long fibres per unit mass of
pulp was practically the same as in the unrefined pulp in spite of a significant decrease in
average fibre length. This indicates that a 3% decrease in length weighted in Figs. 4.4 and
4.5 was mostly due to short particles detached from the fibre wall and also fines created
during fibre fibrillation. We expect that the decrease in length weighted was not due to any
significant fibre shortening. This was also found for other fractions, but we could not see
clearly any differences before and after refining for any with a higher percentage of
hardwood (<50%). Because of the higher hardwood percentage, the specific refining
energy was decreased. There was therefore a lower refining impact for fibres in the highest
hardwood proportion when using the refiner plates that were used in this experiment.
4.3. Effect of refining to paper properties and strength properties Although freeness is a straightforward property to measure, and is often used as an
indicator of refining, it is not a direct objective in the refining process. In Figure 4.13, the
effect of closing the gap on freeness is shown. By reducing the gap between plates, the
freeness is decreased. Particularly after passing through the critical gap, the freeness
dropped dramatically. All of the pulp samples showed the same phenomenon of refining
decreasing freeness.
39
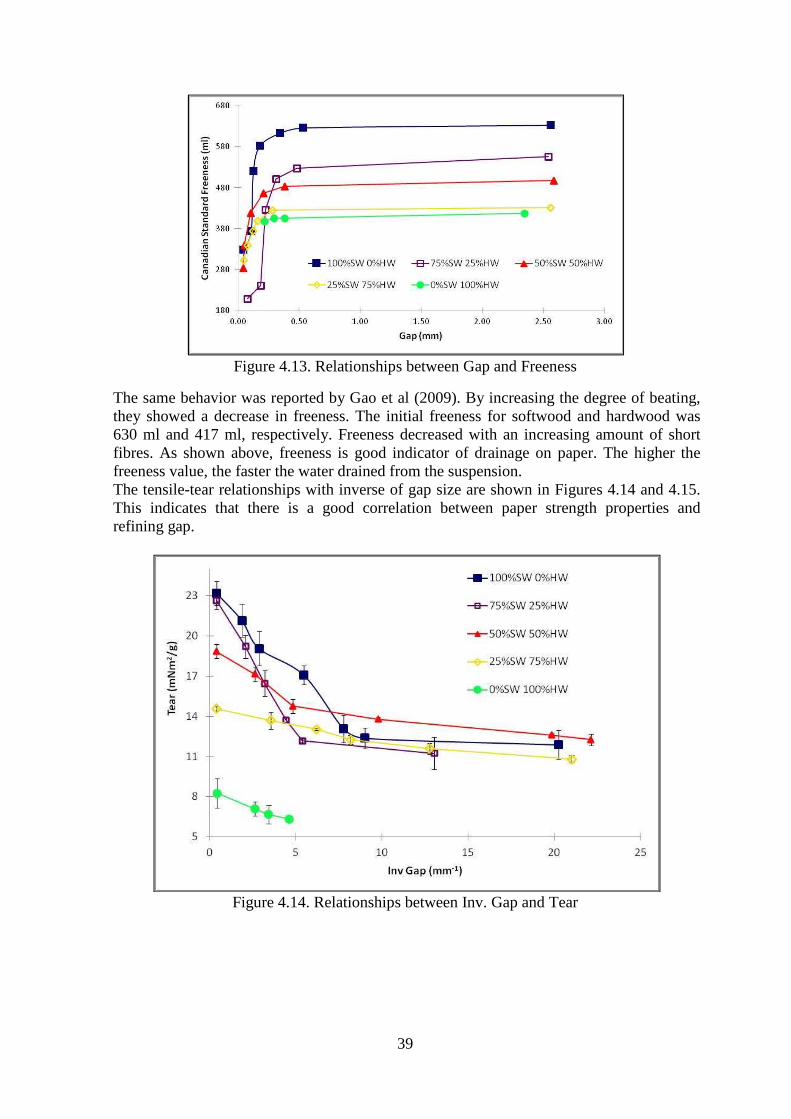
Figure 4.13. Relationships between Gap and Freeness
The same behavior was reported by Gao et al (2009). By increasing the degree of beating, they showed a decrease in freeness. The initial freeness for softwood and hardwood was 630 ml and 417 ml, respectively. Freeness decreased with an increasing amount of short fibres. As shown above, freeness is good indicator of drainage on paper. The higher the freeness value, the faster the water drained from the suspension. The tensile-tear relationships with inverse of gap size are shown in Figures 4.14 and 4.15. This indicates that there is a good correlation between paper strength properties and refining gap.
Figure 4.14. Relationships between Inv. Gap and Tear
40
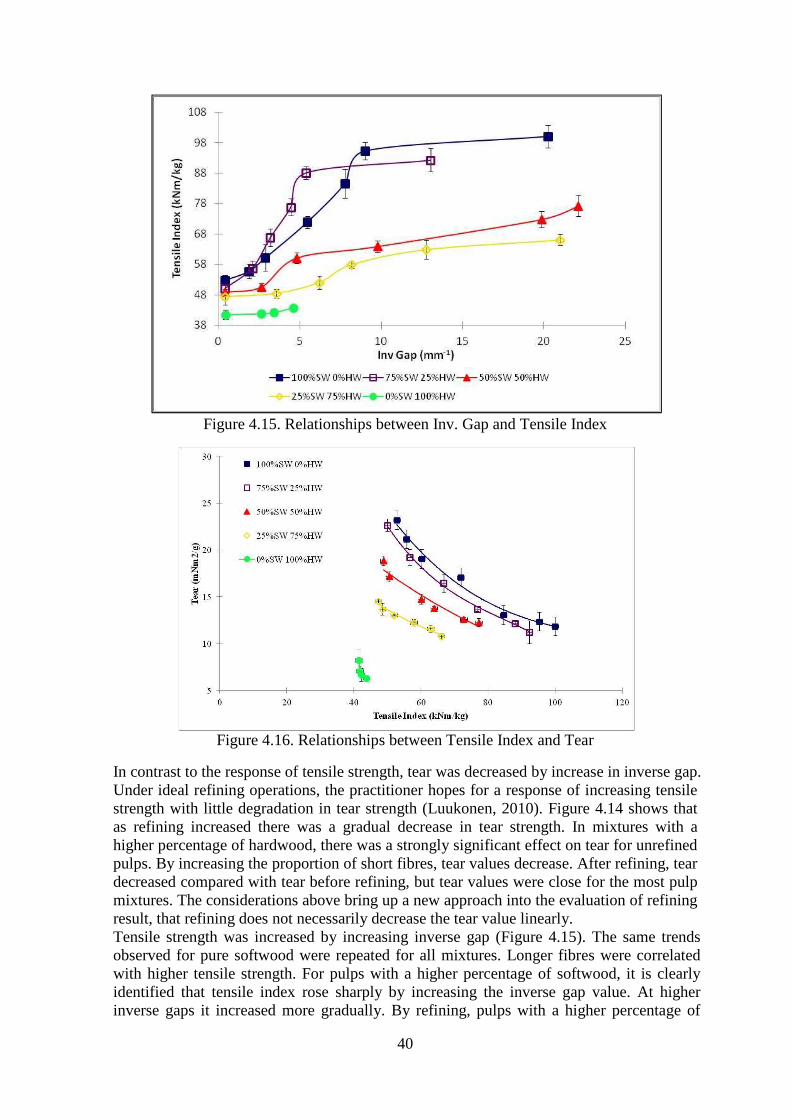
Figure 4.15. Relationships between Inv. Gap and Tensile Index
Figure 4.16. Relationships between Tensile Index and Tear
In contrast to the response of tensile strength, tear was decreased by increase in inverse gap. Under ideal refining operations, the practitioner hopes for a response of increasing tensile strength with little degradation in tear strength (Luukonen, 2010). Figure 4.14 shows that as refining increased there was a gradual decrease in tear strength. In mixtures with a higher percentage of hardwood, there was a strongly significant effect on tear for unrefined pulps. By increasing the proportion of short fibres, tear values decrease. After refining, tear decreased compared with tear before refining, but tear values were close for the most pulp mixtures. The considerations above bring up a new approach into the evaluation of refining result, that refining does not necessarily decrease the tear value linearly. Tensile strength was increased by increasing inverse gap (Figure 4.15). The same trends observed for pure softwood were repeated for all mixtures. Longer fibres were correlated with higher tensile strength. For pulps with a higher percentage of softwood, it is clearly identified that tensile index rose sharply by increasing the inverse gap value. At higher inverse gaps it increased more gradually. By refining, pulps with a higher percentage of
41
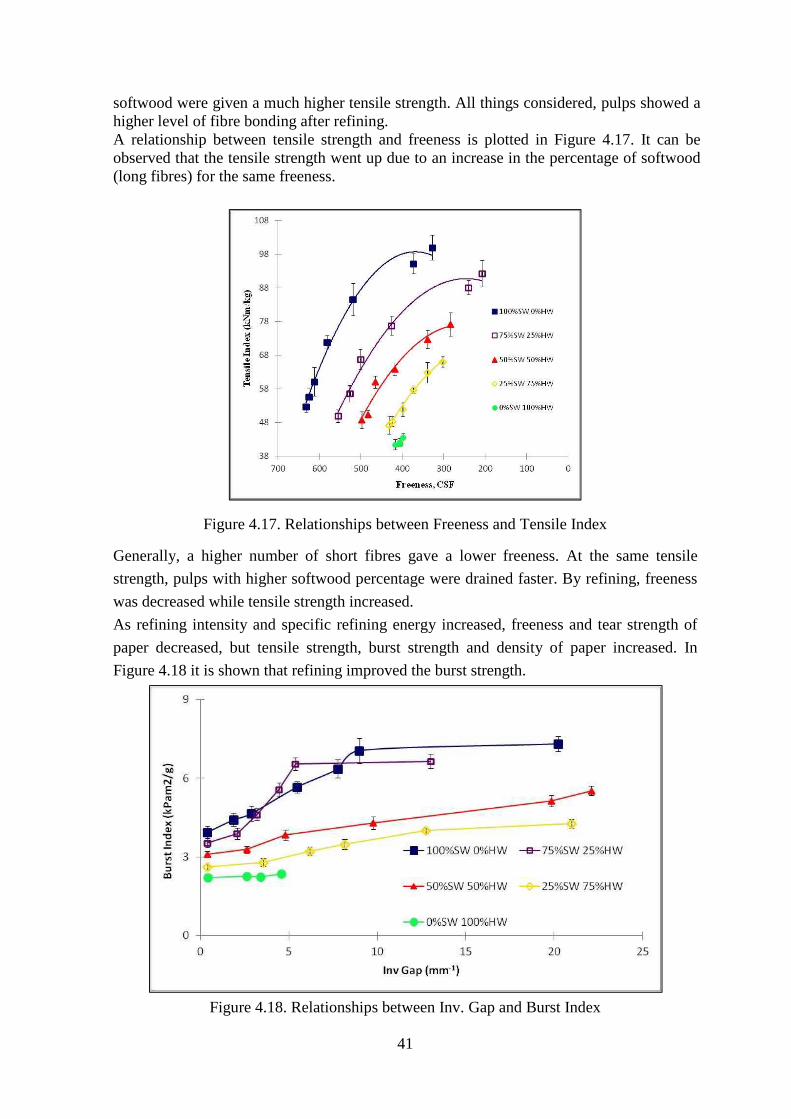
softwood were given a much higher tensile strength. All things considered, pulps showed a higher level of fibre bonding after refining. A relationship between tensile strength and freeness is plotted in Figure 4.17. It can be observed that the tensile strength went up due to an increase in the percentage of softwood (long fibres) for the same freeness.
Figure 4.17. Relationships between Freeness and Tensile Index
Generally, a higher number of short fibres gave a lower freeness. At the same tensile
strength, pulps with higher softwood percentage were drained faster. By refining, freeness
was decreased while tensile strength increased.
As refining intensity and specific refining energy increased, freeness and tear strength of
paper decreased, but tensile strength, burst strength and density of paper increased. In
Figure 4.18 it is shown that refining improved the burst strength.
Figure 4.18. Relationships between Inv. Gap and Burst Index

42
Considine et al (2010) stated that tear strength decreases with refining of fibres, even
though the burst strength and tensile strength of the paper increases. Similarly, Figure 4.19
shows that tensile index increased with burst strength, while tear strength decreased with
increasing burst strength.
Figure 4.19 Relationship of Burst Strength with Tensile Index and Tear Strength.
Figure 4.20. Relationships between Strength Properties and Sheet Density
Figure 4.21. Relationships between Strength Properties and Sheet Density
From Figure 4.20 and 4.21 it can be seen that there was an increase in fibre bonding due to
the increase in tensile strength. With an increase in tensile strength, there was an increase
in sheet density and a decrease in sheet thickness.

43
4.4. Important Specific Refining Energy and Refining Intensity It was mentioned above that the higher the net power consumption of the refiner, the more
refining action occurs. Similar energy profiles are shown in Figure 4.22. This may have
happened because the flow rate and pulp consistency were kept constant. In every different
percentage of pulp mixtures, the specific refining energy rose gradually as inv. gap
increased.
Figure 4.22. Specific Refining Energy & Specific Edge Load at Constant Refining Parameters.
Most refining action happens in the higher inv. gap (smaller gap sizes). As indicated in figure 4.22, the proportions of hardwood and softwood pulp in mixtures had a pronounced effect on SRE and SEL. Before refining, SRE and SEL began as the same number. During refining, they were raised gradually in different ways. Pulps that had a higher percentage of softwood gave greater increases in SRE and SEL because of the higher amount of long fibres, which consumed more refining energy. At constant refiner speed, flow rate and pulp consistency the specific refining energy and refining intensity is influenced by net power only, so it makes a linear correlation between specific refining energy and refining intensity. In this case, the specific refining energy is proportional with refining intensity.
44
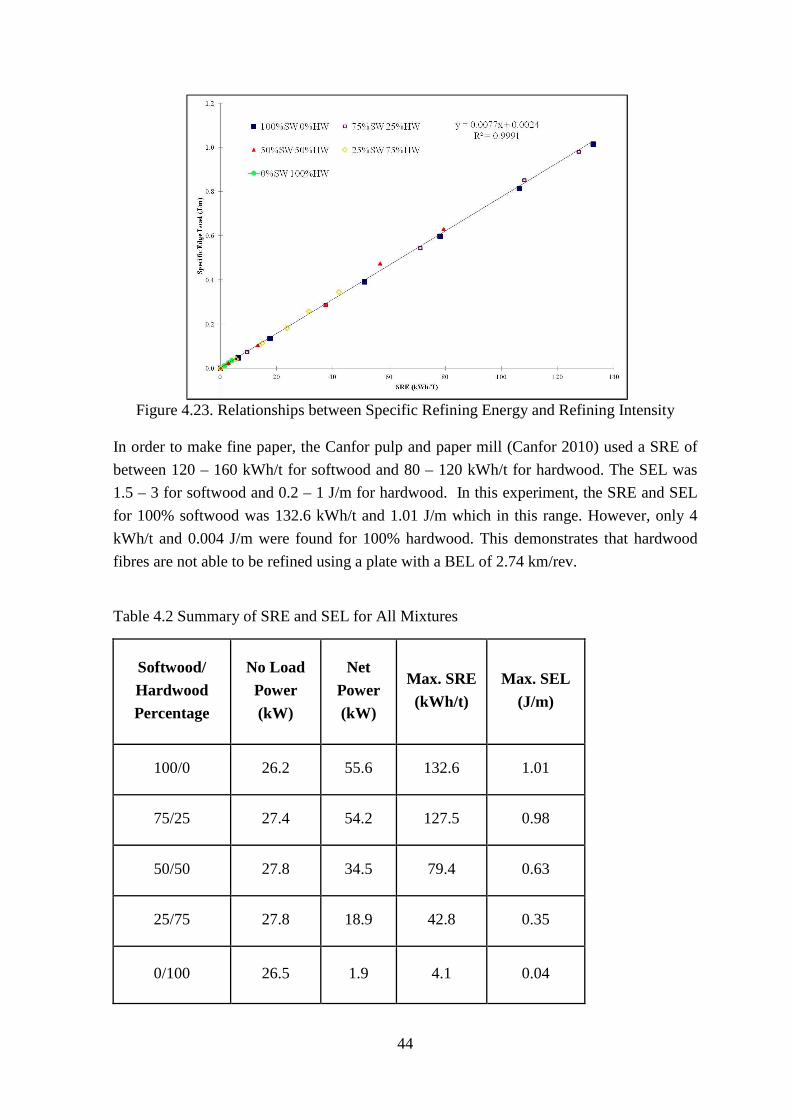
Figure 4.23. Relationships between Specific Refining Energy and Refining Intensity
In order to make fine paper, the Canfor pulp and paper mill (Canfor 2010) used a SRE of
between 120 – 160 kWh/t for softwood and 80 – 120 kWh/t for hardwood. The SEL was
1.5 – 3 for softwood and 0.2 – 1 J/m for hardwood. In this experiment, the SRE and SEL
for 100% softwood was 132.6 kWh/t and 1.01 J/m which in this range. However, only 4
kWh/t and 0.004 J/m were found for 100% hardwood. This demonstrates that hardwood
fibres are not able to be refined using a plate with a BEL of 2.74 km/rev.
Table 4.2 Summary of SRE and SEL for All Mixtures
Softwood/ Hardwood
Percentage
No Load
Power (kW)
Net Power (kW)
Max. SRE
(kWh/t) Max. SEL
(J/m)
100/0 26.2 55.6 132.6 1.01
75/25 27.4 54.2 127.5 0.98
50/50 27.8 34.5 79.4 0.63
25/75 27.8 18.9 42.8 0.35
0/100 26.5 1.9 4.1 0.04
45
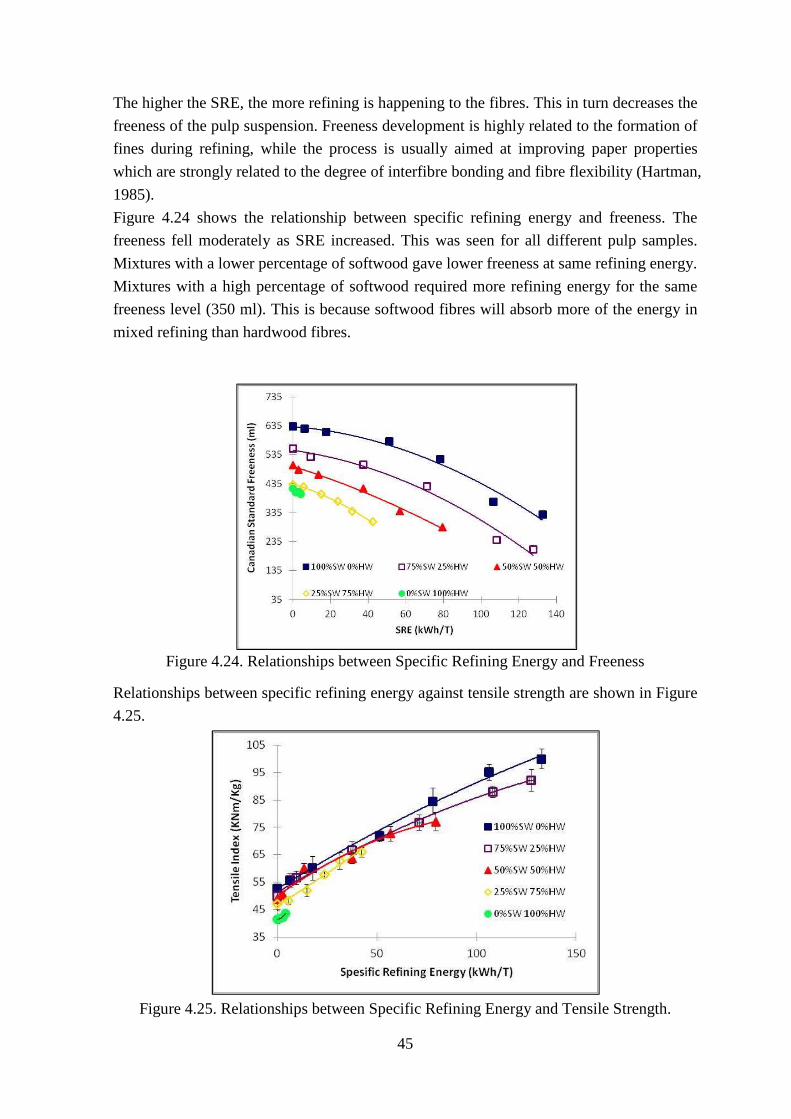
The higher the SRE, the more refining is happening to the fibres. This in turn decreases the
freeness of the pulp suspension. Freeness development is highly related to the formation of
fines during refining, while the process is usually aimed at improving paper properties
which are strongly related to the degree of interfibre bonding and fibre flexibility (Hartman,
1985).
Figure 4.24 shows the relationship between specific refining energy and freeness. The
freeness fell moderately as SRE increased. This was seen for all different pulp samples.
Mixtures with a lower percentage of softwood gave lower freeness at same refining energy.
Mixtures with a high percentage of softwood required more refining energy for the same
freeness level (350 ml). This is because softwood fibres will absorb more of the energy in
mixed refining than hardwood fibres.
Figure 4.24. Relationships between Specific Refining Energy and Freeness
Relationships between specific refining energy against tensile strength are shown in Figure
4.25.
Figure 4.25. Relationships between Specific Refining Energy and Tensile Strength.
46
Figure 4.25 shows the relationship between specific refining energy and tensile index.
According to the figure, there was a linear correspondence for all mixtures. Tensile
strength was increased as the refiner gap was decreased. This indicates that specific
refining energy is a good predictor of tensile strength.
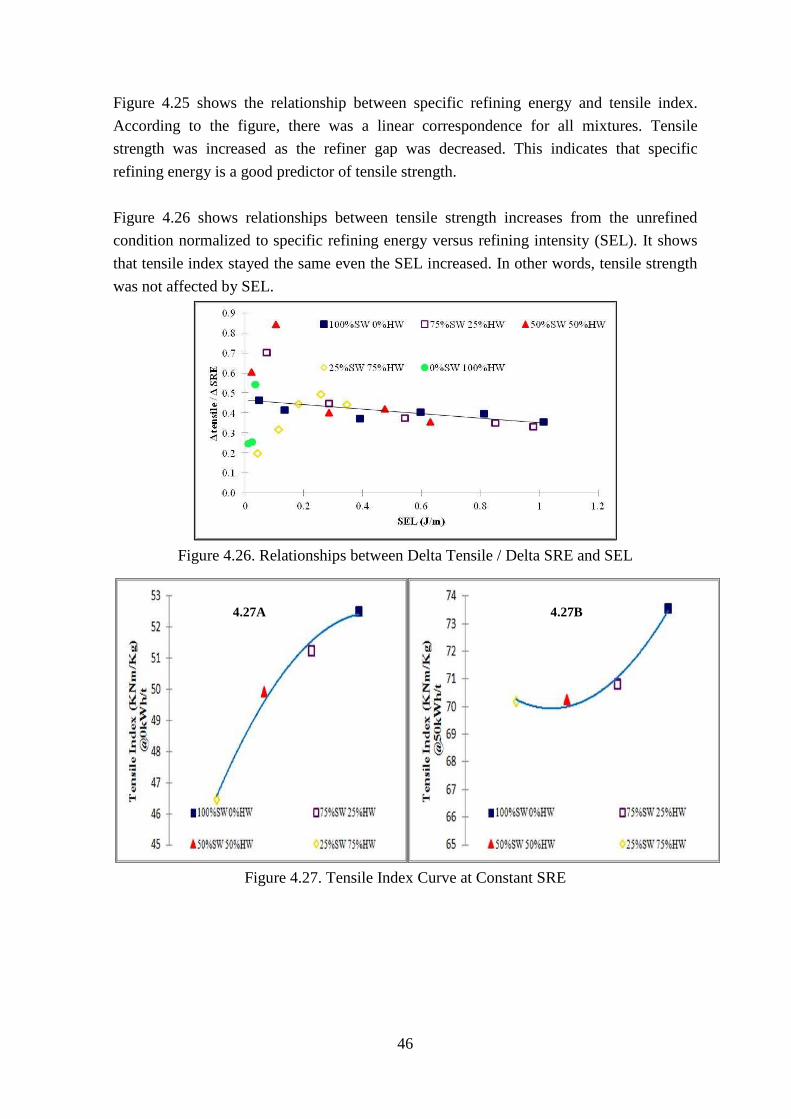
Figure 4.26 shows relationships between tensile strength increases from the unrefined
condition normalized to specific refining energy versus refining intensity (SEL). It shows
that tensile index stayed the same even the SEL increased. In other words, tensile strength
was not affected by SEL.
Figure 4.26. Relationships between Delta Tensile / Delta SRE and SEL
Figure 4.27. Tensile Index Curve at Constant SRE
4.27A 4.27B

47
Figure 4.28. Tensile Index Increase at a Given Specific Refining Energy
As in the case of SEL, tensile index can be examined at a constant specific refining energy.
Figure 4.27 shows the tensile index curve at a constant specific refining energy for
different pulp proportions. This figure does not include 100% hardwood because the SRE
was only 4 kWh/t. Figure 4.27A shows the initial tensile index before refining (SRE: 0
kWh/t). As we can see, the higher percentage of long fibres gives a higher tensile index.
However, when the refiner gives 50 kWh/t of SRE (Fig. 4.27B), the highest tensile index is
still shown by 100% softwood, but another percentage is nearly as high. Similar results are
shown in Figure 4.28, where tensile index increase is plotted at a given specific refining
energy for each pulp percentage. All things considered, refining had a greater effect on the
long fibres, and less on the short fibres. By adding 25% hardwood to 75% softwood, the
same tensile index can be achieved as with 50% and 75% mixtures. This is a benefit
because the price of softwood is more twice of that of hardwood.
4.5. Effects of Refining on Paper Optical Properties
Figure 4.29 shows the relationship between light scattering coefficient and tensile index.
Light scattering coefficient and tensile index interaction for each of the five different
mixtures show a linear reduction with increasing refining and tensile index. The high
percentage of hardwood pulp had the highest light scattering coefficient, and highest
percentage of softwood pulp had the lowest. Light scattering coefficient decreased with
increasing proportions of long fibres.
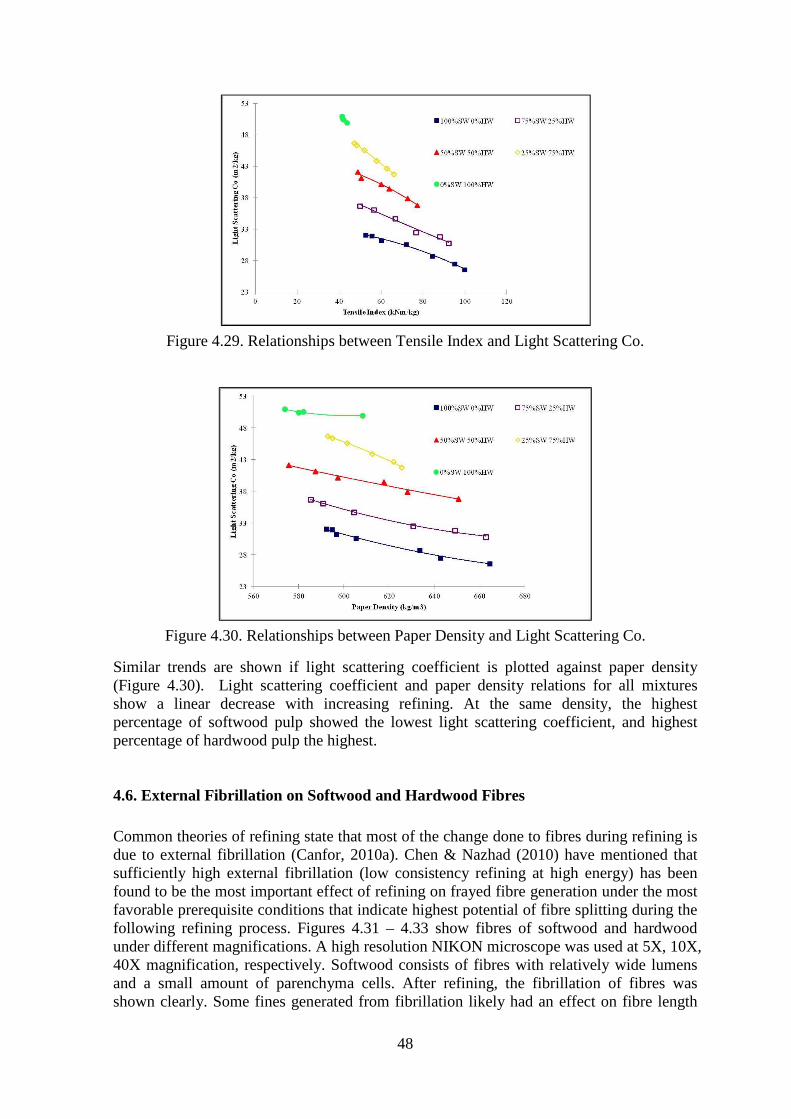
48
Figure 4.29. Relationships between Tensile Index and Light Scattering Co.
Figure 4.30. Relationships between Paper Density and Light Scattering Co.
Similar trends are shown if light scattering coefficient is plotted against paper density (Figure 4.30). Light scattering coefficient and paper density relations for all mixtures show a linear decrease with increasing refining. At the same density, the highest percentage of softwood pulp showed the lowest light scattering coefficient, and highest percentage of hardwood pulp the highest.
4.6. External Fibrillation on Softwood and Hardwood Fibres Common theories of refining state that most of the change done to fibres during refining is due to external fibrillation (Canfor, 2010a). Chen & Nazhad (2010) have mentioned that sufficiently high external fibrillation (low consistency refining at high energy) has been found to be the most important effect of refining on frayed fibre generation under the most favorable prerequisite conditions that indicate highest potential of fibre splitting during the following refining process. Figures 4.31 – 4.33 show fibres of softwood and hardwood under different magnifications. A high resolution NIKON microscope was used at 5X, 10X, 40X magnification, respectively. Softwood consists of fibres with relatively wide lumens and a small amount of parenchyma cells. After refining, the fibrillation of fibres was shown clearly. Some fines generated from fibrillation likely had an effect on fibre length
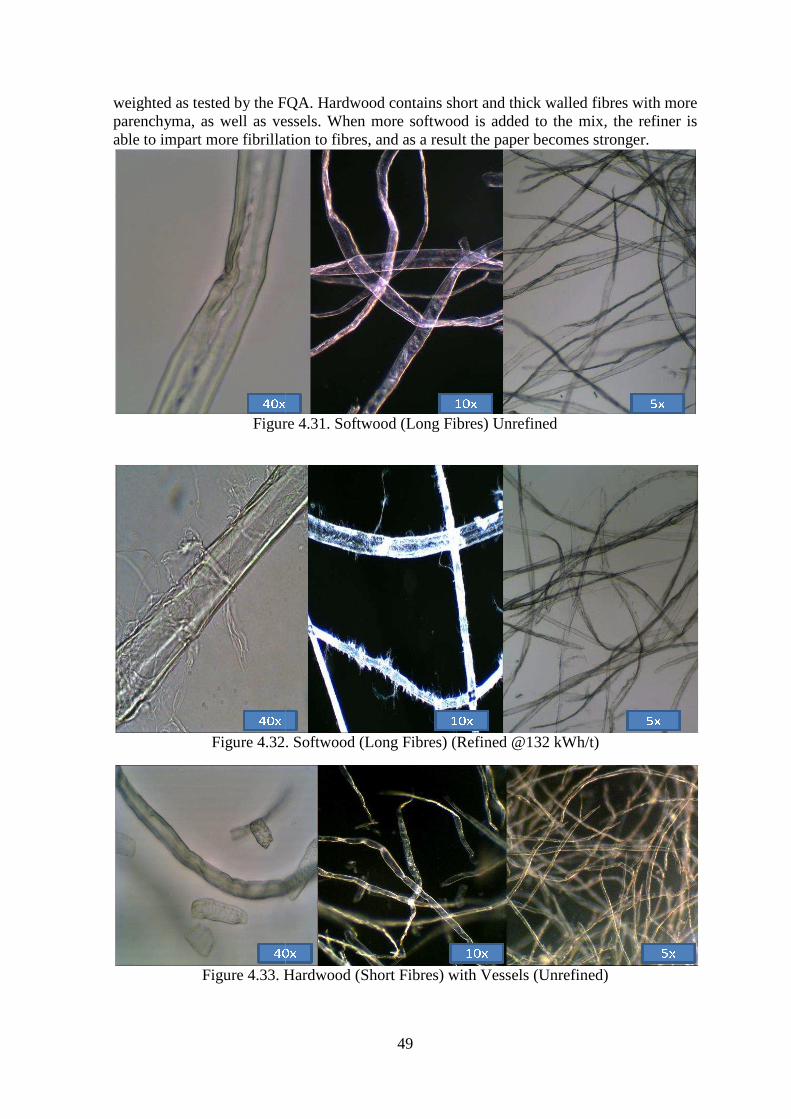
weighted as tested by the FQA. parenchyma, as well as vessels. When more softwood is added to the mix, the refiner is able to impart more fibrillation to
Figure
Figure 4.32.
Figure 4.33. Hardwood (
49
weighted as tested by the FQA. Hardwood contains short and thick walled vessels. When more softwood is added to the mix, the refiner is
able to impart more fibrillation to fibres, and as a result the paper becomes stronger.
Figure 4.31. Softwood (Long Fibres) Unrefined
4.32. Softwood (Long Fibres) (Refined @132 kWh/t)
Hardwood (Short Fibres) with Vessels (Unrefined)
and thick walled fibres with more vessels. When more softwood is added to the mix, the refiner is
paper becomes stronger.
kWh/t)
(Unrefined)
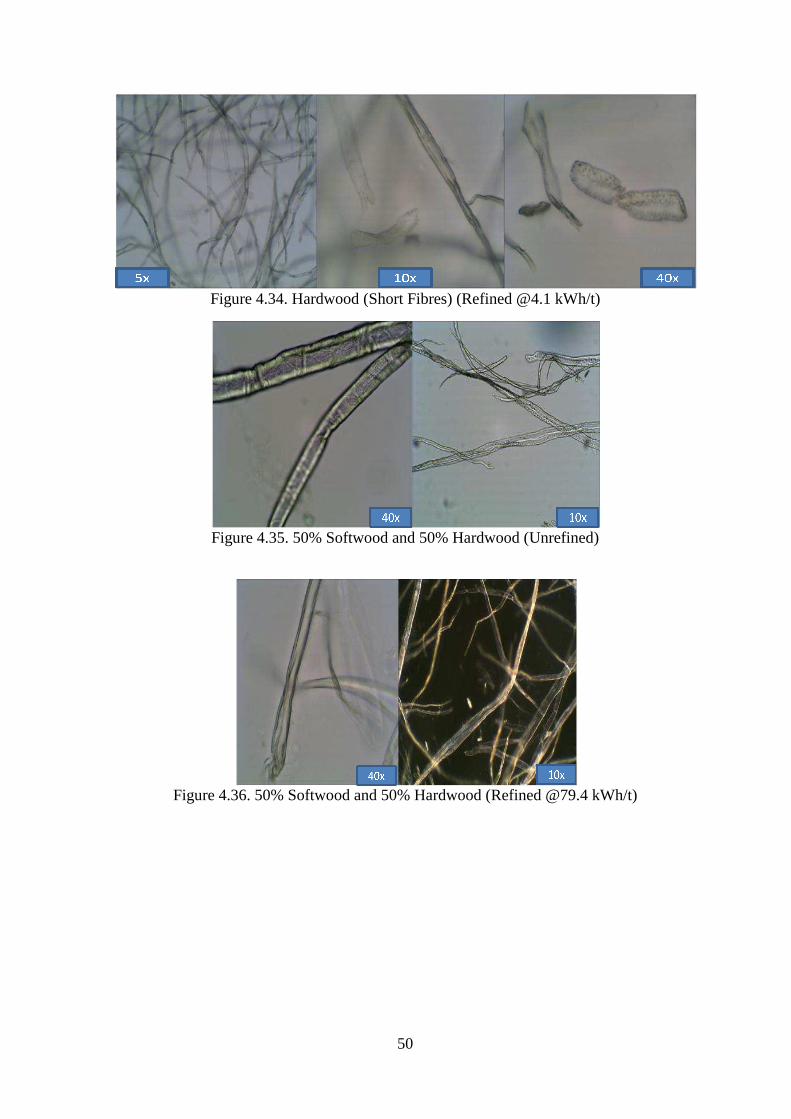
Figure 4.34.
Figure 4.35.
Figure 4.36. 50% Softwood and 50% Hardwood
50
4.34. Hardwood (Short Fibres) (Refined @4.1 kWh/t)
4.35. 50% Softwood and 50% Hardwood (Unrefined
50% Softwood and 50% Hardwood (Refined @79.4
kWh/t)
Unrefined)
79.4 kWh/t)
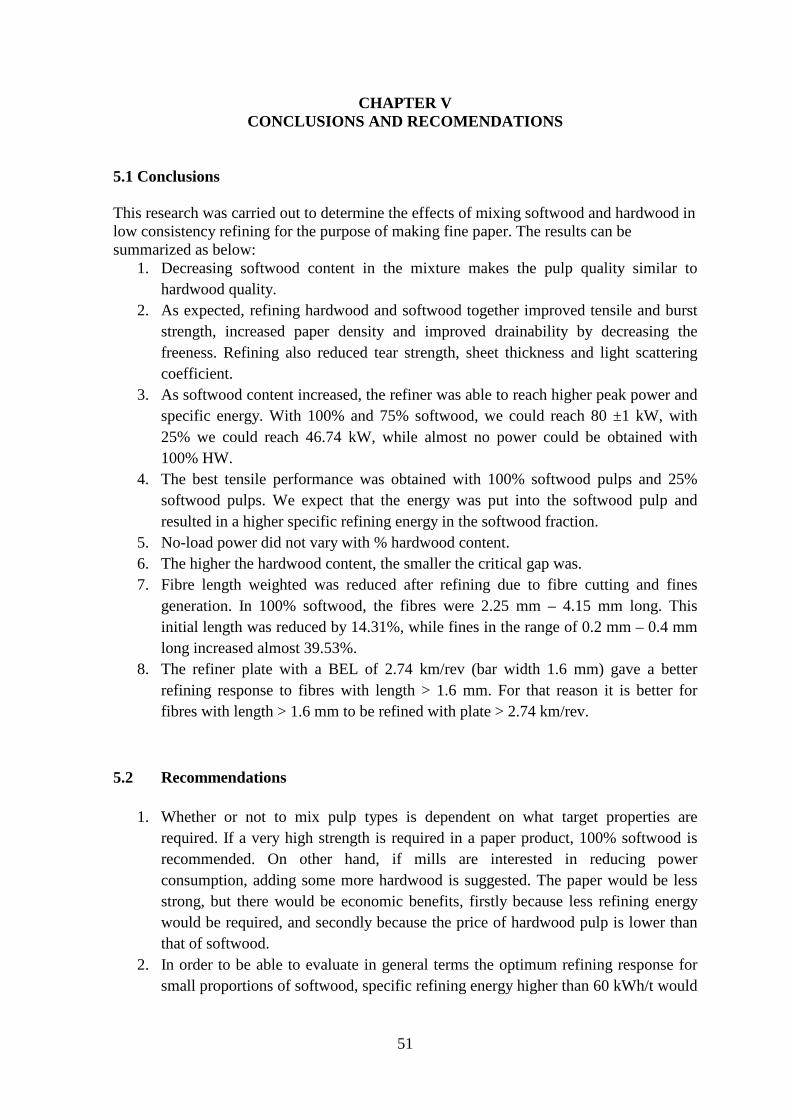
51
CHAPTER V CONCLUSIONS AND RECOMENDATIONS
5.1 Conclusions This research was carried out to determine the effects of mixing softwood and hardwood in low consistency refining for the purpose of making fine paper. The results can be summarized as below:
1. Decreasing softwood content in the mixture makes the pulp quality similar to hardwood quality.
2. As expected, refining hardwood and softwood together improved tensile and burst strength, increased paper density and improved drainability by decreasing the freeness. Refining also reduced tear strength, sheet thickness and light scattering coefficient.
3. As softwood content increased, the refiner was able to reach higher peak power and specific energy. With 100% and 75% softwood, we could reach 80 ±1 kW, with 25% we could reach 46.74 kW, while almost no power could be obtained with 100% HW.
4. The best tensile performance was obtained with 100% softwood pulps and 25% softwood pulps. We expect that the energy was put into the softwood pulp and resulted in a higher specific refining energy in the softwood fraction.
5. No-load power did not vary with % hardwood content. 6. The higher the hardwood content, the smaller the critical gap was. 7. Fibre length weighted was reduced after refining due to fibre cutting and fines
generation. In 100% softwood, the fibres were 2.25 mm – 4.15 mm long. This initial length was reduced by 14.31%, while fines in the range of 0.2 mm – 0.4 mm long increased almost 39.53%.
8. The refiner plate with a BEL of 2.74 km/rev (bar width 1.6 mm) gave a better refining response to fibres with length > 1.6 mm. For that reason it is better for fibres with length > 1.6 mm to be refined with plate > 2.74 km/rev.
5.2 Recommendations
1. Whether or not to mix pulp types is dependent on what target properties are required. If a very high strength is required in a paper product, 100% softwood is recommended. On other hand, if mills are interested in reducing power consumption, adding some more hardwood is suggested. The paper would be less strong, but there would be economic benefits, firstly because less refining energy would be required, and secondly because the price of hardwood pulp is lower than that of softwood.
2. In order to be able to evaluate in general terms the optimum refining response for small proportions of softwood, specific refining energy higher than 60 kWh/t would

52
have to be carried out. Varying different plate geometries would be interesting to explore.
3. It might be useful to see the effect of different RPM, flow rate and consistency for each percentage.
4. Separate refining with the same SRE input to hardwood and softwood may be worthy of further study.
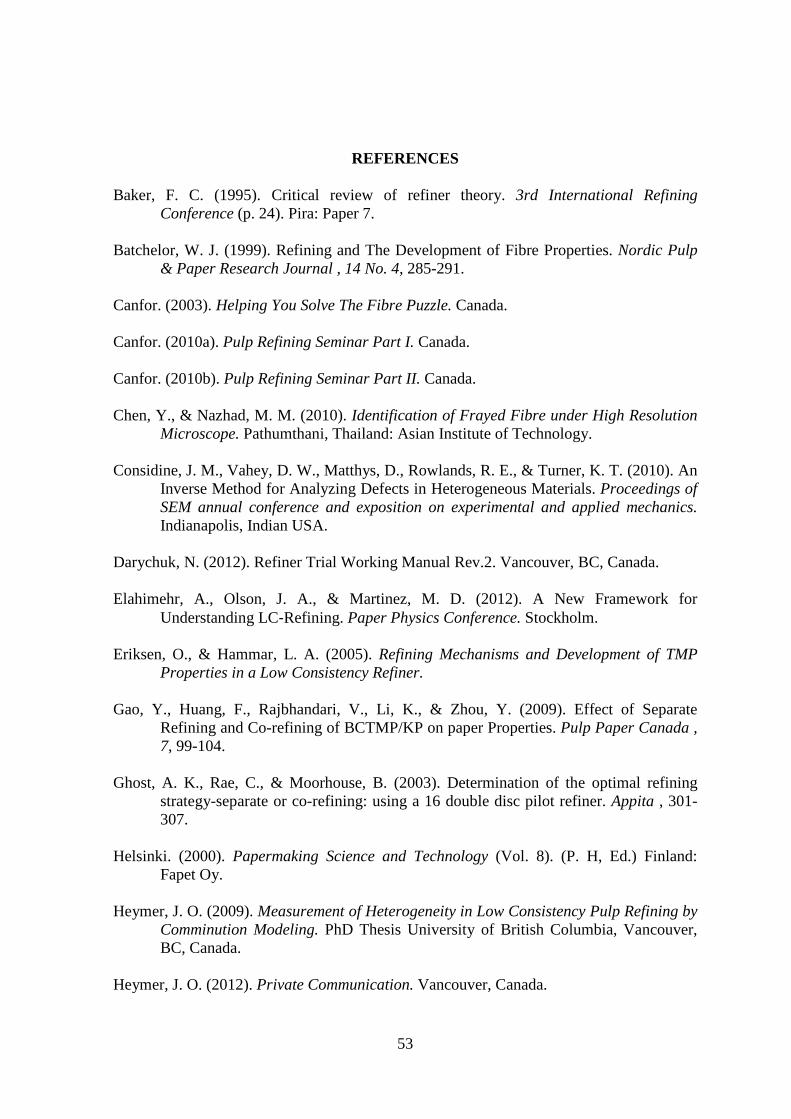
53
REFERENCES
Baker, F. C. (1995). Critical review of refiner theory. 3rd International Refining Conference (p. 24). Pira: Paper 7.
Batchelor, W. J. (1999). Refining and The Development of Fibre Properties. Nordic Pulp
& Paper Research Journal , 14 No. 4, 285-291. Canfor. (2003). Helping You Solve The Fibre Puzzle. Canada. Canfor. (2010a). Pulp Refining Seminar Part I. Canada. Canfor. (2010b). Pulp Refining Seminar Part II. Canada. Chen, Y., & Nazhad, M. M. (2010). Identification of Frayed Fibre under High Resolution
Microscope. Pathumthani, Thailand: Asian Institute of Technology. Considine, J. M., Vahey, D. W., Matthys, D., Rowlands, R. E., & Turner, K. T. (2010). An
Inverse Method for Analyzing Defects in Heterogeneous Materials. Proceedings of SEM annual conference and exposition on experimental and applied mechanics. Indianapolis, Indian USA.
Darychuk, N. (2012). Refiner Trial Working Manual Rev.2. Vancouver, BC, Canada. Elahimehr, A., Olson, J. A., & Martinez, M. D. (2012). A New Framework for
Understanding LC‐Refining. Paper Physics Conference. Stockholm. Eriksen, O., & Hammar, L. A. (2005). Refining Mechanisms and Development of TMP
Properties in a Low Consistency Refiner. Gao, Y., Huang, F., Rajbhandari, V., Li, K., & Zhou, Y. (2009). Effect of Separate
Refining and Co-refining of BCTMP/KP on paper Properties. Pulp Paper Canada , 7, 99-104.
Ghost, A. K., Rae, C., & Moorhouse, B. (2003). Determination of the optimal refining
strategy-separate or co-refining: using a 16 double disc pilot refiner. Appita , 301-307.
Helsinki. (2000). Papermaking Science and Technology (Vol. 8). (P. H, Ed.) Finland:
Fapet Oy. Heymer, J. O. (2009). Measurement of Heterogeneity in Low Consistency Pulp Refining by
Comminution Modeling. PhD Thesis University of British Columbia, Vancouver, BC, Canada.
Heymer, J. O. (2012). Private Communication. Vancouver, Canada.
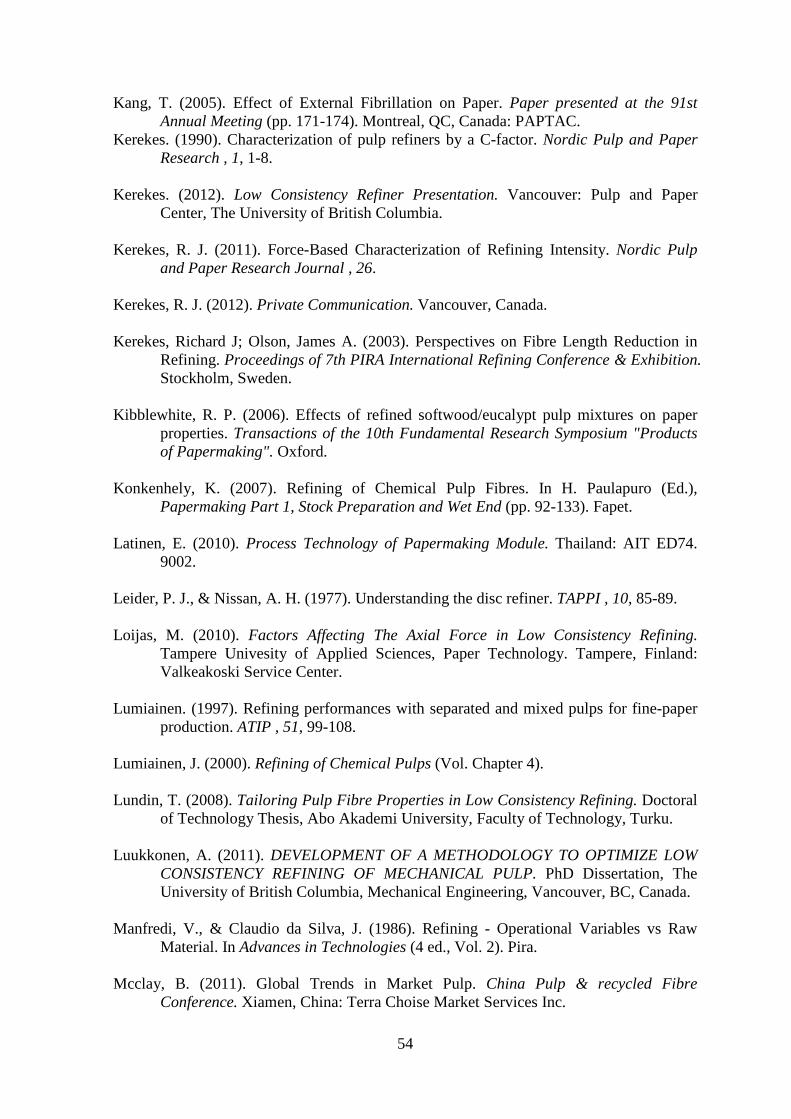
54
Kang, T. (2005). Effect of External Fibrillation on Paper. Paper presented at the 91st Annual Meeting (pp. 171-174). Montreal, QC, Canada: PAPTAC.
Kerekes. (1990). Characterization of pulp refiners by a C-factor. Nordic Pulp and Paper Research , 1, 1-8.
Kerekes. (2012). Low Consistency Refiner Presentation. Vancouver: Pulp and Paper
Center, The University of British Columbia. Kerekes, R. J. (2011). Force-Based Characterization of Refining Intensity. Nordic Pulp
and Paper Research Journal , 26. Kerekes, R. J. (2012). Private Communication. Vancouver, Canada. Kerekes, Richard J; Olson, James A. (2003). Perspectives on Fibre Length Reduction in
Refining. Proceedings of 7th PIRA International Refining Conference & Exhibition. Stockholm, Sweden.
Kibblewhite, R. P. (2006). Effects of refined softwood/eucalypt pulp mixtures on paper
properties. Transactions of the 10th Fundamental Research Symposium "Products of Papermaking". Oxford.
Konkenhely, K. (2007). Refining of Chemical Pulp Fibres. In H. Paulapuro (Ed.),
Papermaking Part 1, Stock Preparation and Wet End (pp. 92-133). Fapet. Latinen, E. (2010). Process Technology of Papermaking Module. Thailand: AIT ED74.
9002. Leider, P. J., & Nissan, A. H. (1977). Understanding the disc refiner. TAPPI , 10, 85-89. Loijas, M. (2010). Factors Affecting The Axial Force in Low Consistency Refining.
Tampere Univesity of Applied Sciences, Paper Technology. Tampere, Finland: Valkeakoski Service Center.
Lumiainen. (1997). Refining performances with separated and mixed pulps for fine-paper
production. ATIP , 51, 99-108. Lumiainen, J. (2000). Refining of Chemical Pulps (Vol. Chapter 4). Lundin, T. (2008). Tailoring Pulp Fibre Properties in Low Consistency Refining. Doctoral
of Technology Thesis, Abo Akademi University, Faculty of Technology, Turku. Luukkonen, A. (2011). DEVELOPMENT OF A METHODOLOGY TO OPTIMIZE LOW
CONSISTENCY REFINING OF MECHANICAL PULP. PhD Dissertation, The University of British Columbia, Mechanical Engineering, Vancouver, BC, Canada.
Manfredi, V., & Claudio da Silva, J. (1986). Refining - Operational Variables vs Raw
Material. In Advances in Technologies (4 ed., Vol. 2). Pira. Mcclay, B. (2011). Global Trends in Market Pulp. China Pulp & recycled Fibre
Conference. Xiamen, China: Terra Choise Market Services Inc.
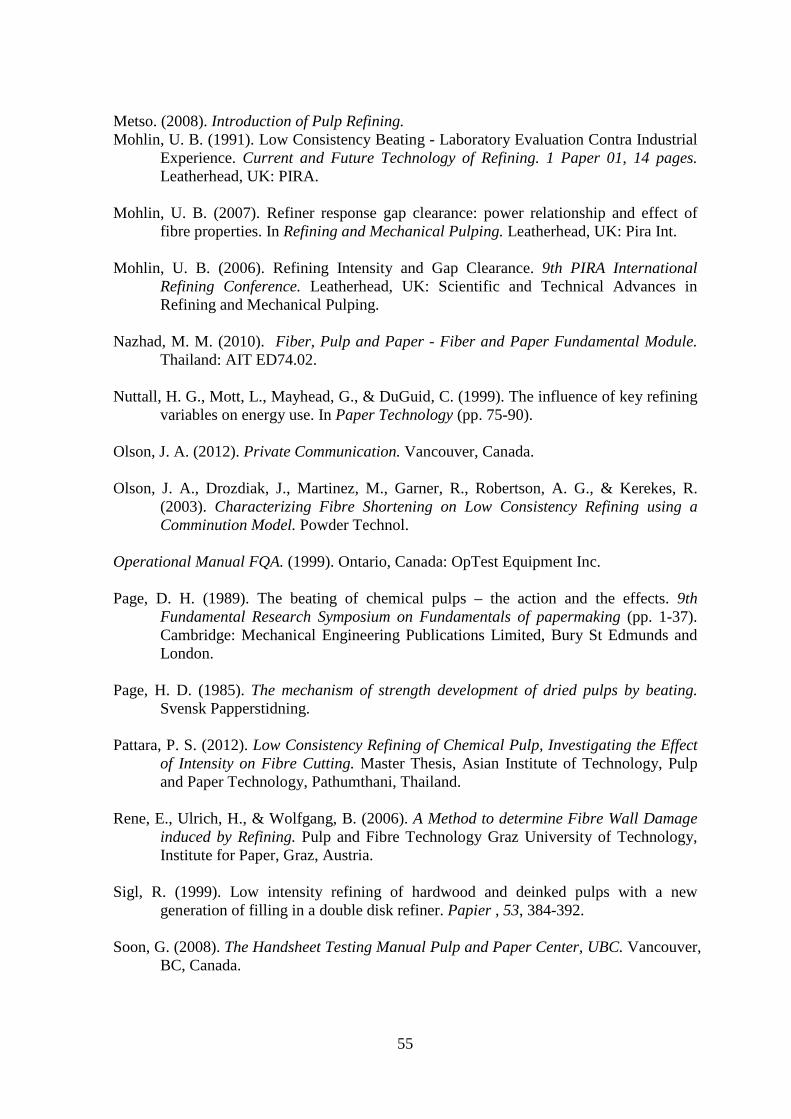
55
Metso. (2008). Introduction of Pulp Refining. Mohlin, U. B. (1991). Low Consistency Beating - Laboratory Evaluation Contra Industrial
Experience. Current and Future Technology of Refining. 1 Paper 01, 14 pages. Leatherhead, UK: PIRA.
Mohlin, U. B. (2007). Refiner response gap clearance: power relationship and effect of
fibre properties. In Refining and Mechanical Pulping. Leatherhead, UK: Pira Int. Mohlin, U. B. (2006). Refining Intensity and Gap Clearance. 9th PIRA International
Refining Conference. Leatherhead, UK: Scientific and Technical Advances in Refining and Mechanical Pulping.
Nazhad, M. M. (2010). Fiber, Pulp and Paper - Fiber and Paper Fundamental Module.
Thailand: AIT ED74.02. Nuttall, H. G., Mott, L., Mayhead, G., & DuGuid, C. (1999). The influence of key refining
variables on energy use. In Paper Technology (pp. 75-90). Olson, J. A. (2012). Private Communication. Vancouver, Canada. Olson, J. A., Drozdiak, J., Martinez, M., Garner, R., Robertson, A. G., & Kerekes, R.
(2003). Characterizing Fibre Shortening on Low Consistency Refining using a Comminution Model. Powder Technol.
Operational Manual FQA. (1999). Ontario, Canada: OpTest Equipment Inc. Page, D. H. (1989). The beating of chemical pulps – the action and the effects. 9th
Fundamental Research Symposium on Fundamentals of papermaking (pp. 1-37). Cambridge: Mechanical Engineering Publications Limited, Bury St Edmunds and London.
Page, H. D. (1985). The mechanism of strength development of dried pulps by beating.
Svensk Papperstidning. Pattara, P. S. (2012). Low Consistency Refining of Chemical Pulp, Investigating the Effect
of Intensity on Fibre Cutting. Master Thesis, Asian Institute of Technology, Pulp and Paper Technology, Pathumthani, Thailand.
Rene, E., Ulrich, H., & Wolfgang, B. (2006). A Method to determine Fibre Wall Damage
induced by Refining. Pulp and Fibre Technology Graz University of Technology, Institute for Paper, Graz, Austria.
Sigl, R. (1999). Low intensity refining of hardwood and deinked pulps with a new
generation of filling in a double disk refiner. Papier , 53, 384-392. Soon, G. (2008). The Handsheet Testing Manual Pulp and Paper Center, UBC. Vancouver,
BC, Canada.

56
Stevens, W. (1992). Pulp and Paper Manufacture. Stock preparation, Refining. TAPPI/CPPA , 6, 187-219.
VTT Industrial, S. (2009). KnowPap Version 11.0.
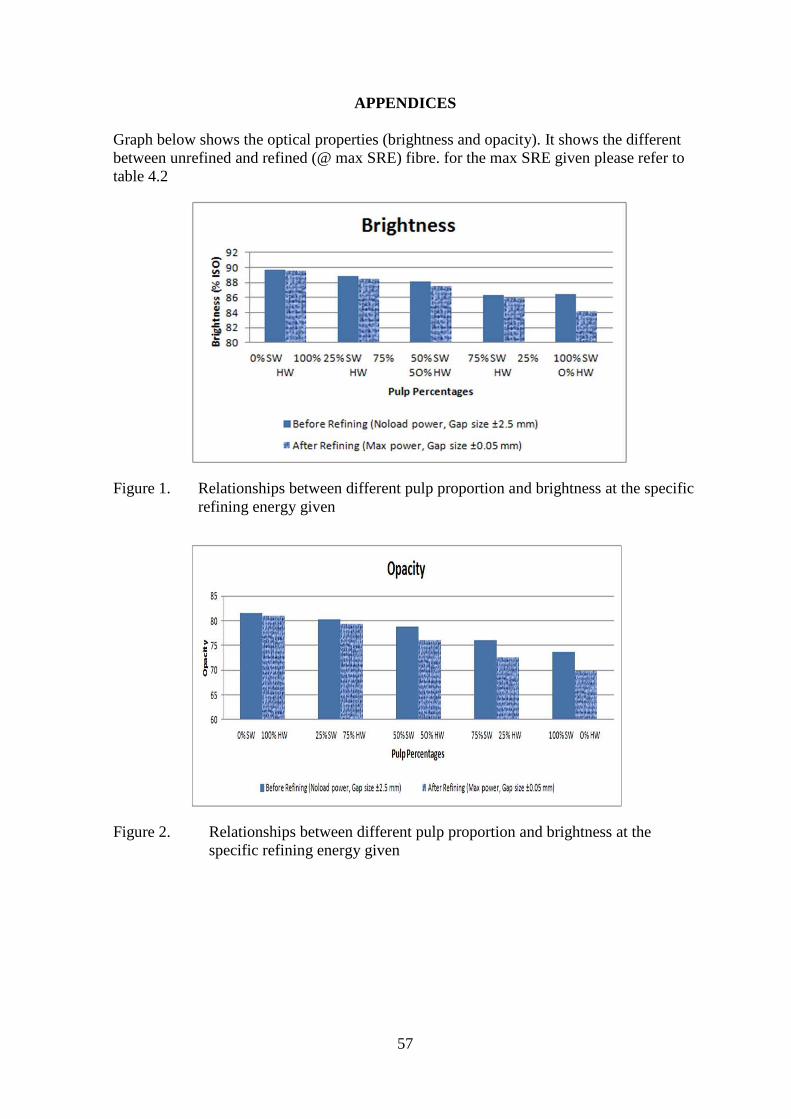
57
APPENDICES Graph below shows the optical properties (brightness and opacity). It shows the different between unrefined and refined (@ max SRE) fibre. for the max SRE given please refer to table 4.2 Figure 1. Relationships between different pulp proportion and brightness at the specific
refining energy given
Figure 2. Relationships between different pulp proportion and brightness at the
specific refining energy given