low carbon society scenario toward 2050 cid ie st … scenario in... · ipb international...
TRANSCRIPT

IPB International Convention Center 16 February 2010
Low Carbon Society Scenario Toward 2050C I d i E S t
16 February 2010
Case: Indonesia Energy Sector
Retno Gumilang DewiCenter for Research on Energy Policy - ITB Indonesiagy y
Takuro Kobashi Institute for Global Environmental Strategies - Japan

BackgroundIndonesia CO2 emission generation (2005) is 0.3 ton C (1.1 ton CO2-eq) per capita and it will achieve 2.9 ton C (10.7 ton CO2) per
it i 2050 i li ith l ti d GDP th if tcapita in 2050 in line with population and GDP growth if current development and society behavior will continue until 2050;
W ld’ LCS t t (2050) 0 5 t C (2 0 CO2 ) itWorld’s LCS target (2050): 0.5 ton C (2.0 CO2-eq) per capita
Indonesia’s LCS dream is to use the World’s LCS target not as the goal of the development but as direction for longterm vision of thegoal of the development but as direction for longterm vision of the development;
LCS is a relatively new concept for Indonesia Therefore mostLCS is a relatively new concept for Indonesia. Therefore, most existing government action plans are not developed as roadmap to achieve Low Carbon Society (LCS) target of the country.
However, all the action plans actually are in lined with and supportive to the LCS concept.

ObjectiveObjective
To describe future visions for achieving the goals of LCS. g g
LCS actions development for Indonesia is not to achieve a certain target; it is more to explore various possibilites of g ; p pIndonesian future within the context of LCS
A study to develop model for Indonesian toward LCS visions y p2050. Three scenarios are developed to depict the direction of future socio economic visions for achieving the LCS goals.
Roadmap to achieve these visions are assesed. The roadmap covers actions and policies needed to materialize the LCS goals

Development scenarios to 2050 with respect to LCSParticular interest:
(a) socio-economic, (b) energy use, (c) associated emission level
Base year: 2005 Projection 2050– BaU (moderate scenario): current socio-economic development,
society behavior, energy systems/structure will continue until 2050; CM1 (moderate scenario): economic growth is similar with BAU more– CM1 (moderate scenario): economic growth is similar with BAU, more energy efficient and lower carbon emitting energy technology compared to BAU, slight change in society behavior (depicted as
l l d t i t d)calmer, slower, and nature oriented) – CM2 (high scenario): high economic growth, very energy efficient,
lower carbon emitting technology, much better energy related g gy, gyinfrastructure compared to BAU, with society behavior depicted as active, quick changing, and technology oriented

forcasting
LCSindicator Path exploration
Compare with LCS Target
t
LCS Target
DevelopingBack casting
BAUDeveloping Countries
LCSindicator LCS Target
Path exploration CMindicator LCS Target
ttDeveloped Countries

Government expenditure
Household sizePrivate consumptionIO
analysisOutput by
Population
Restructure industrySector
FIX
ContentsExport
Fixed capital formation
I i
Input coefficient matrix
Trip per person
Trip distance
Modal share
Output by industry
Number of household
Output of commercial
industry
Passenger transport demand
Output of manufacturing
industry ructure
hanges
Import ratio
Floor area per outputFreight generation per
output
Transport distance
Modal shareEnergy service demand per
driving force
industry
Commercial building floor
area
Freight transport demand
demandindustryIncrease eff of end use tech & less GHG
energy
Better infrasr
& lifestyle ch
Modal sharedriving force
Fuel share
Energy efficiency Final energy demand
Electricity
B &
demand
Central power generation
(CPG)
Dispersed power generation (DPG)
Energy efficiency (DPG)
Energy demand (exc.
electricity)Dispersed power
generation (DPG)
Increase Eff power gen tech & switch to less
GHGs energy
CO2 emission factor (exc.
Energy demand(CPG)
(CPG)
Fuel share (CPG)
gy y ( )
Own use (DPG)
Energy demand(DPG)
(DPG)
Increase eff of power gen
and switch to less GHGs CO2 emission factor (exc.
electricity)
Exogenous variables Endogenous
CO2 emission factor(electricity)
CO emissionsPrimary energy
energy
GovernmentgParameters
gvariables
CO2 emissions(by energy end-use sector)
Primary energy demand
Government (presidential) regulation Decreasing energy demand (energy supply
security) & CO2 (close to world target)

Modeling Tools and Stepsg pThe tool used in this research is ExSS (Extended Snap Shot) using GAMS (General Algebraic Modeling System) 23.3 supported by various technical, ( g g y ) pp yeconomic, and social parameters. In developing the proposed roadmap, there are 5 important steps, i.e.:
Depicting socio economic visions of Indonesia in energy sector toward– Depicting socio economic visions of Indonesia in energy sector toward 2050;
– Estimating current energy service demand-supply and resulting CO22emission that cover quantifying society behavior on energy utilization (activities to spend time and type of services), analyzing the impact of city and transport infrastructure (include travel behavior) and industrial c ty a d t a spo t ast uctu e ( c ude t a e be a o ) a d dust astructure to energy consumption and resulting CO2 emission;
– Exploring innovations for energy demand-supply;E i i i d d d l i BAU d– Estimating energy service demand and supply in BAU and two set scenarios and the amount of resulting CO2 emissions; and
– Analysis of domestic potential to achieve energy-related CO2 emission y p gy 2reduction.
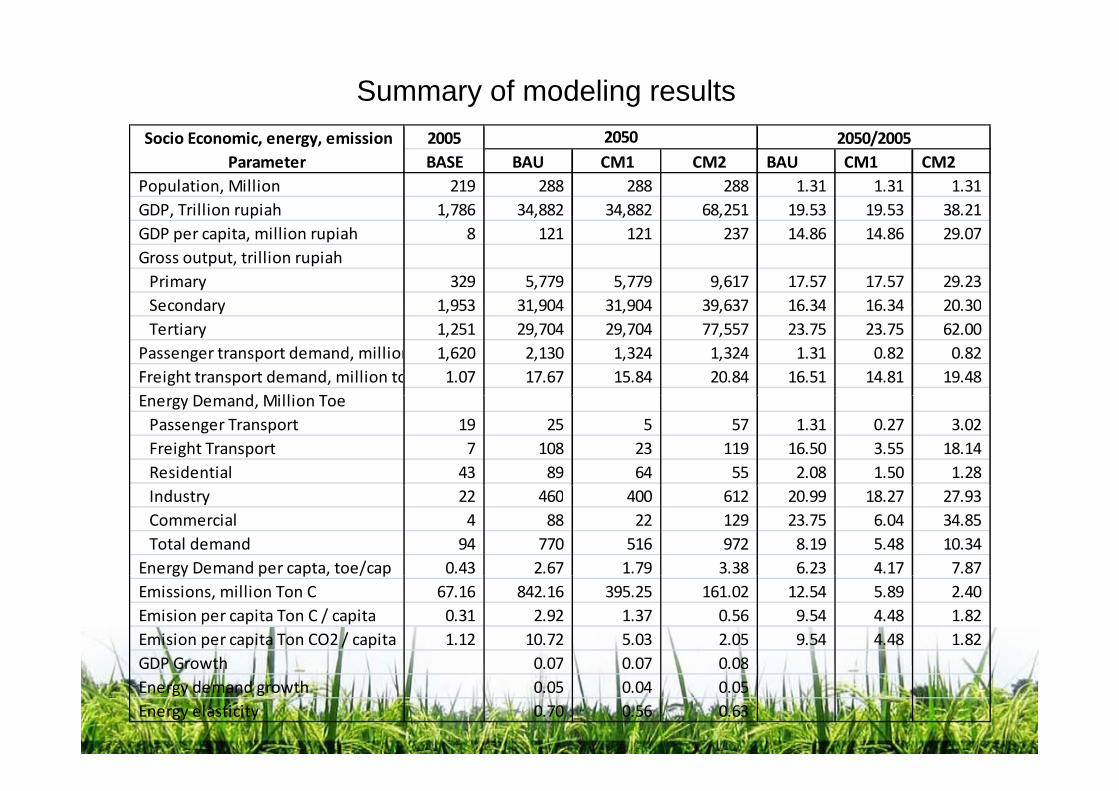
Summary of modeling results2005BASE BAU CM1 CM2 BAU CM1 CM2
Population, Million 219 288 288 288 1.31 1.31 1.31 GDP, Trillion rupiah 1,786 34,882 34,882 68,251 19.53 19.53 38.21
2050 2050/2005 Socio Economic, energy, emission Parameter
, p , , , ,GDP per capita, million rupiah 8 121 121 237 14.86 14.86 29.07 Gross output, trillion rupiah Primary 329 5,779 5,779 9,617 17.57 17.57 29.23 Secondary 1 953 31 904 31 904 39 637 16 34 16 34 20 30 Secondary 1,953 31,904 31,904 39,637 16.34 16.34 20.30
Tertiary 1,251 29,704 29,704 77,557 23.75 23.75 62.00 Passenger transport demand, million 1,620 2,130 1,324 1,324 1.31 0.82 0.82 Freight transport demand, million to 1.07 17.67 15.84 20.84 16.51 14.81 19.48 E D d Milli TEnergy Demand, Million Toe Passenger Transport 19 25 5 57 1.31 0.27 3.02 Freight Transport 7 108 23 119 16.50 3.55 18.14 Residential 43 89 64 55 2.08 1.50 1.28 Industry 22 460 400 612 20.99 18.27 27.93 Commercial 4 88 22 129 23.75 6.04 34.85 Total demand 94 770 516 972 8.19 5.48 10.34 Energy Demand per capta, toe/cap 0.43 2.67 1.79 3.38 6.23 4.17 7.87 gy p p , / pEmissions, million Ton C 67.16 842.16 395.25 161.02 12.54 5.89 2.40 Emision per capita Ton C / capita 0.31 2.92 1.37 0.56 9.54 4.48 1.82 Emision per capita Ton CO2 / capita 1.12 10.72 5.03 2.05 9.54 4.48 1.82 GDP Growth 0 07 0 07 0 08GDP Growth 0.07 0.07 0.08 Energy demand growth 0.05 0.04 0.05 Energy elasticity 0.70 0.56 0.63

Economy Energy and EmissionsEconomy, Energy, and Emissions
• BAU
• CM1CM1
• CM2
• Conclussions?

300
350
Million Rupiah GDP per Capita (2005)
2050
100
150
200
250
Change in GDP
‐
50
100 g
structure toward tertiary industry
140 Commercial
100
120
)Commercial
Cement
Iron and Stel
O
60
80
put (
Billio
n Rp
) Other Industries
Construction
Chemicals
20
40
Out
p
Textile, Wood, Paper
Food and Beverage
Mining and Quarying
0
20
2005 2050 BAU 2050 CM1 2050 CM2
Agriculture

40
Base BAU CM1 CM2
30
)= 1
20
e (2
005
10
e of
Bas
e
0
Valu
e
Economic Output Energy Demand Emissions level

800
1,000 Million Toe solar, wind,
geothermalhydrogen800
1,000 Million Toe Commercial
400
600
800 y g
natural gas
oil product
400
600
800 Industry
Residential
0
200
400 coal
biomass
electricity0
200
400 Freight
Transport
Passenger Transport
Final energy demand by sector Final energy demand by type of energy
0 BASE BAU CM1 CM2
0 BASE BAU CM1 CM2
2.92 3.00
ton C per capita 800
1,000 Million Ton C Freight Transport
P T
1.37 1.00
2.00
400
600
Passenger Transport
Industry
Commercial
0.31 0.56 0.00
2005 BAU CM1 CM20
200
2005 BAU CM1 CM2
Residential
CO2 emissions by sector, million ton C
Per capita CO2 emission
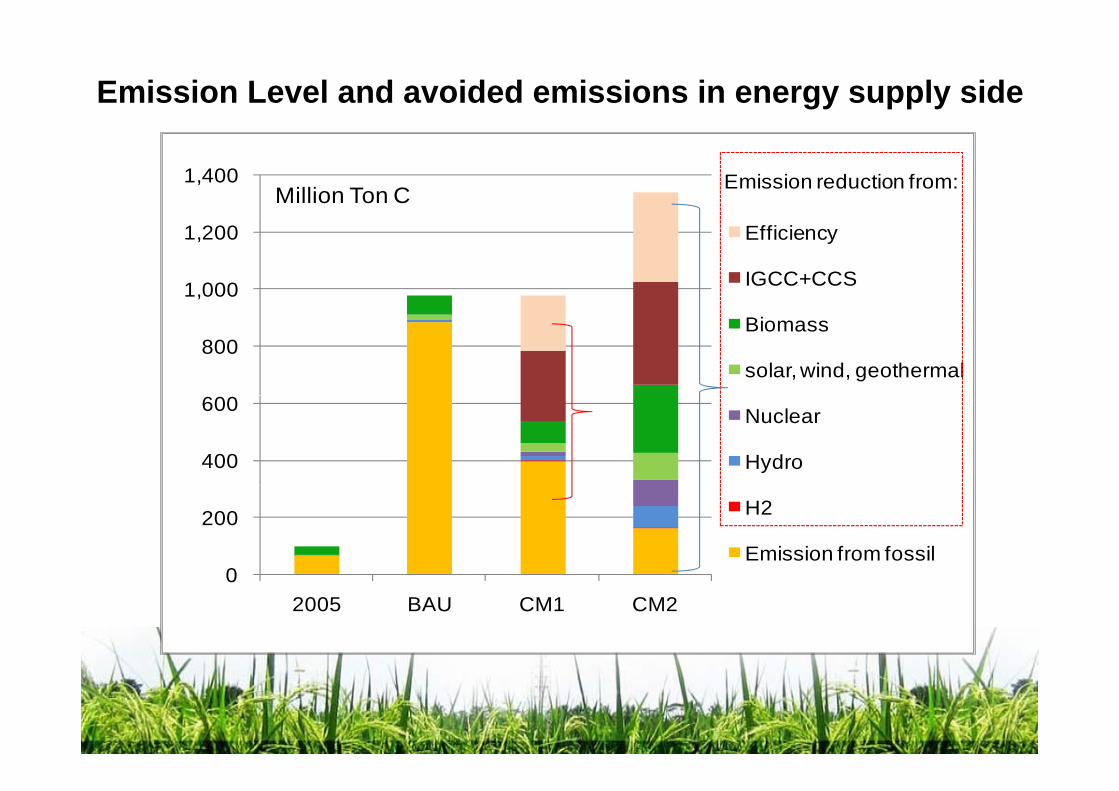
Emission Level and avoided emissions in energy supply side
1,400 Million Ton C Emission reduction from:
1,000
1,200 Efficiency
IGCC+CCS
800 Biomass
solar, wind, geothermal
400
600 Nuclear
Hydro
0
200 H2
Emission from fossil0
2005 BAU CM1 CM2
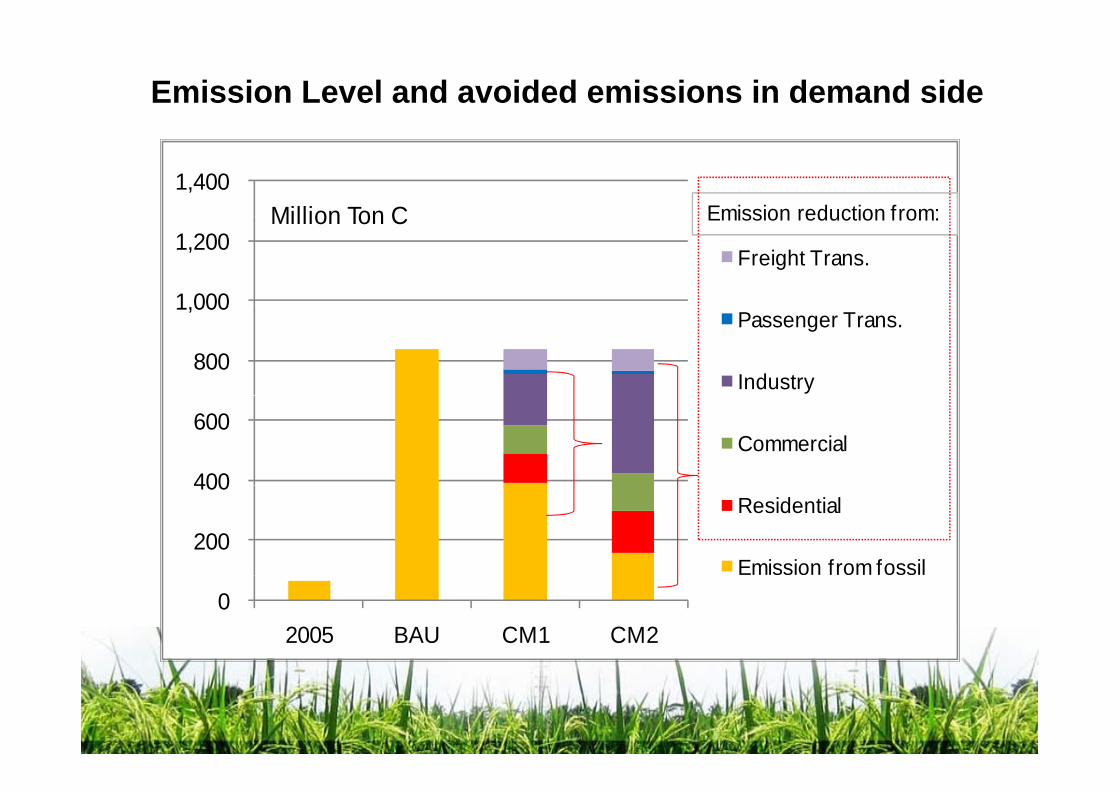
Emission Level and avoided emissions in demand side
1,400 Million Ton C Emission reduction from:
1 000
1,200 Million Ton C
Freight Trans.
Emission reduction from:
800
1,000 Passenger Trans.
Industry
400
600 Commercial
200
400 Residential
Emission from fossil0
2005 BAU CM1 CM2
identi
al
mmerc
ial
ustry
seng
er
ght
identi
al
mmerc
ial
ustry
seng
er
ght
CM1 CM2
(100)
0
Res
Com
Indu
Pass
Frei
Res
Com
Indu
Pass
Frei
(200)
( 00)
(400)
(300)
Coal
Oil Gas
n) eothe
rmal
Coal
Oil Gas
n) eothe
rmal
2050 CM1 2050 CM2
0.00
Effic
iency
in C
Effic
iency
in O
Effic
iency
in G
H2 (H
ydrog
en
Hydro
Powe
r
Nucle
ar
solar
, wind
, ge
Bioma
ss
IGCC
+CCS
Effic
iency
in C
Effic
iency
in O
Effic
iency
in G
H2 (H
ydrog
en
Hydro
Powe
r
Nucle
ar
Solar
, wind
, g
Bioma
ss
IGCC
+ CC
S
(400.00)
(200.00)
(800.00)
(600.00)
Million Ton C
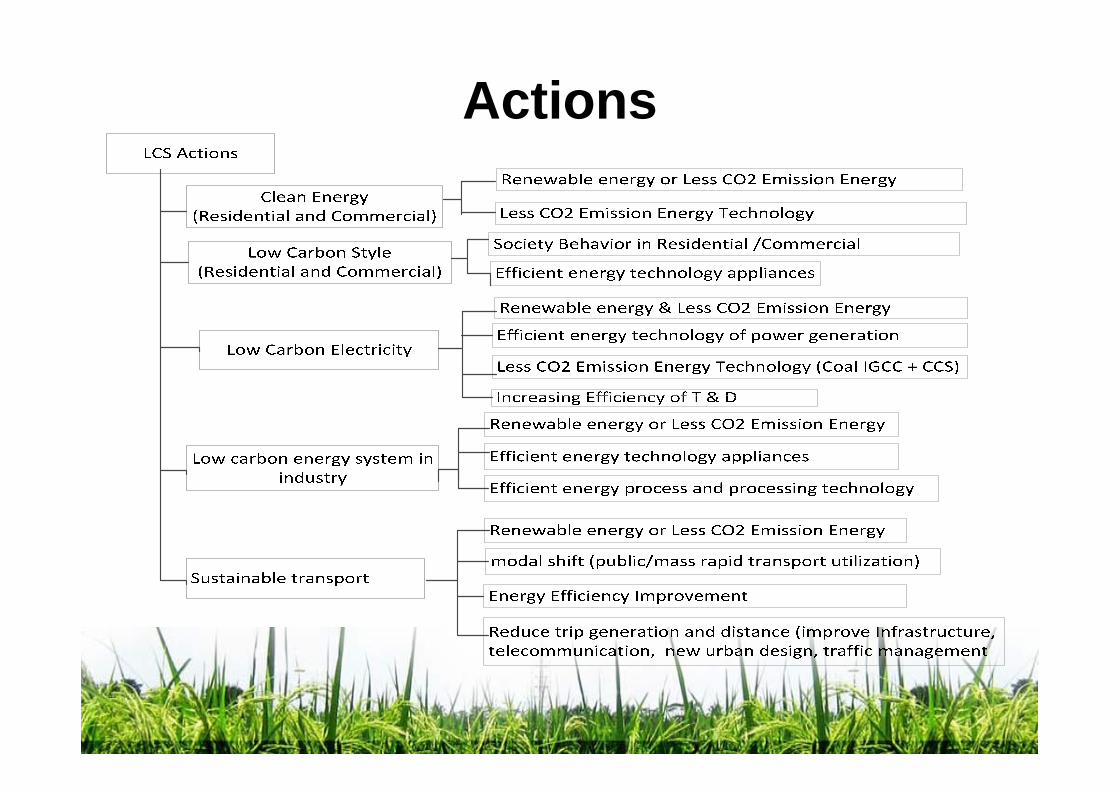
Actions
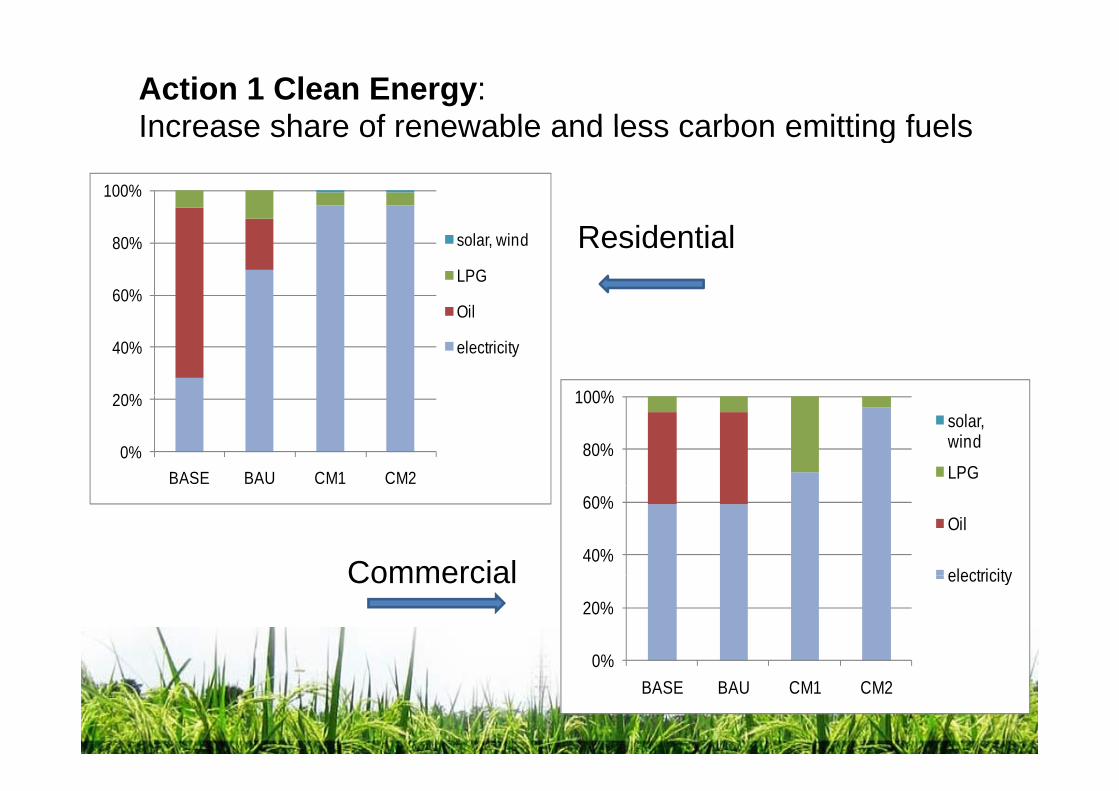
Action 1 Clean Energy: Increase share of renewable and less carbon emitting fuelsIncrease share of renewable and less carbon emitting fuels
100%
60%
80% solar, wind
LPG
Oil
Residential
20%
40%
Oil
electricity
100%
0%
20%
BASE BAU CM1 CM280%
100%solar, wind
LPG
40%
60%Oil
electricityCommercial
0%
20%
electricityCommercial
0%BASE BAU CM1 CM2
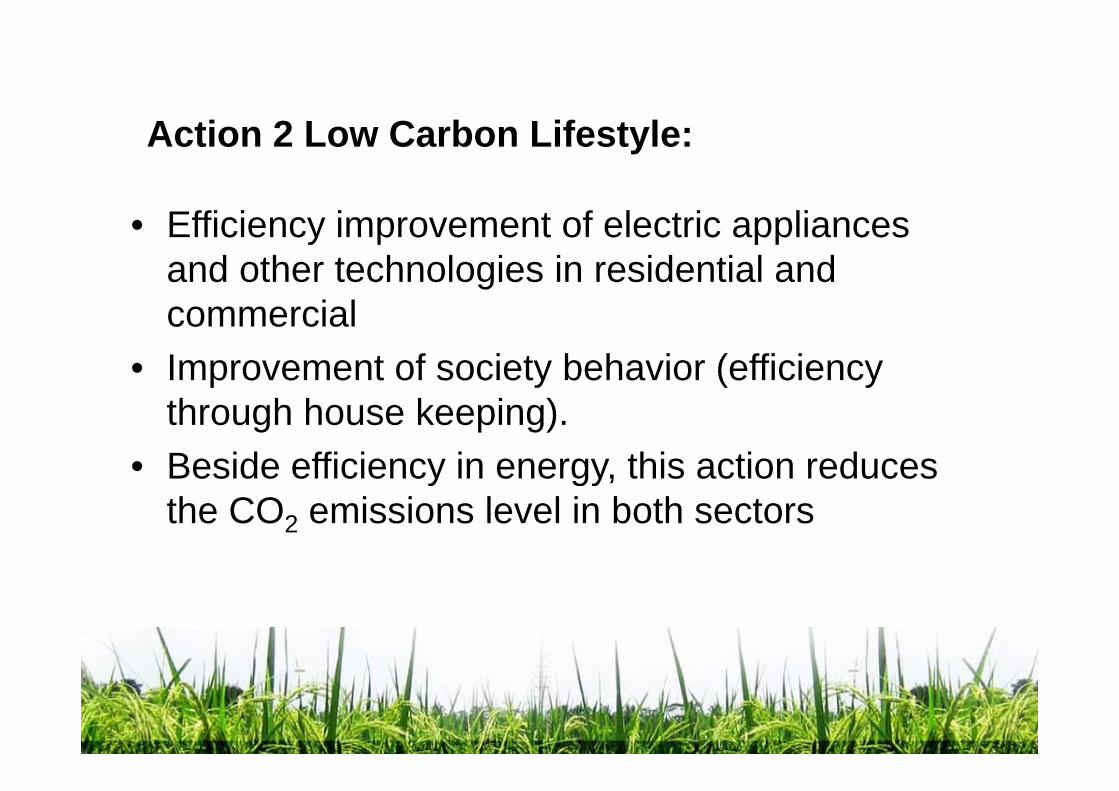
A ti 2 L C b Lif t l
Effi i i t f l t i li
Action 2 Low Carbon Lifestyle:
• Efficiency improvement of electric appliances and other technologies in residential and
i lcommercial • Improvement of society behavior (efficiency
through house keeping). • Beside efficiency in energy, this action reduces y gy
the CO2 emissions level in both sectors
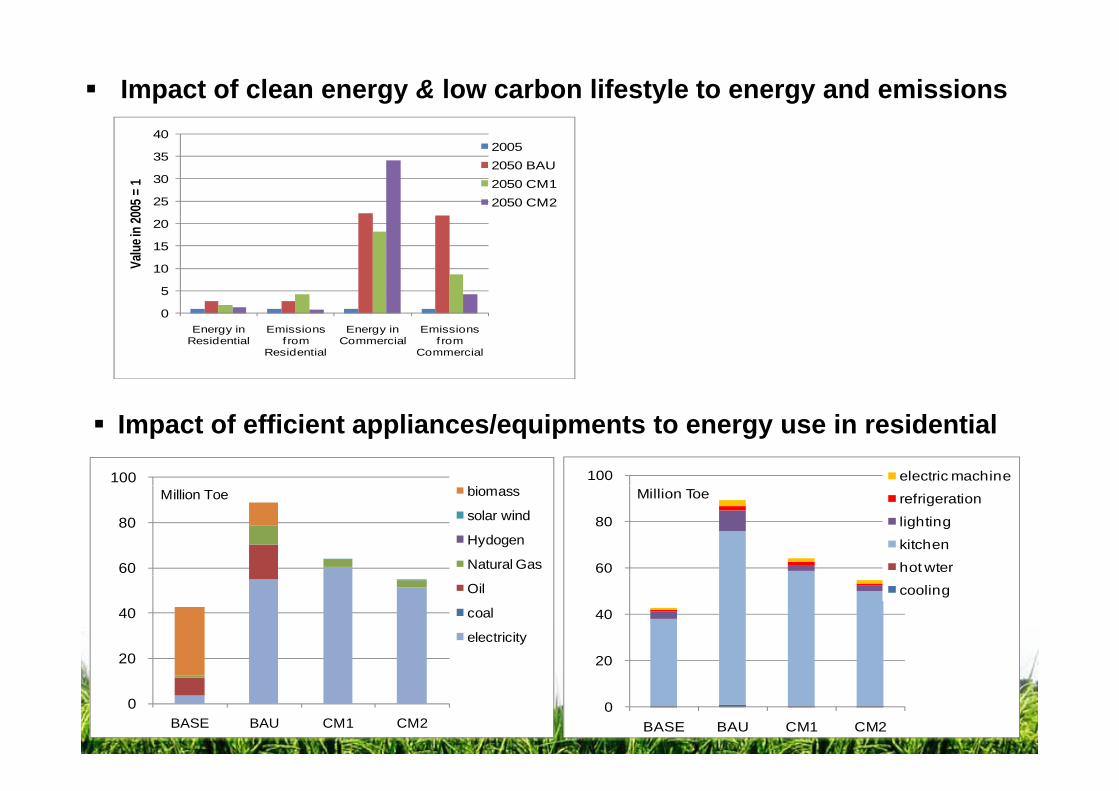
Impact of clean energy & low carbon lifestyle to energy and emissions
25
30
35
4000
5 = 1
20052050 BAU2050 CM12050 CM2
5
10
15
20
Value
in 20
0Energy in
ResidentialEmissions
f rom Residential
Energy in Commercial
Emissions f rom
Commercial
Impact of efficient appliances/equipments to energy use in residential
100 electric machine100
60
80
Million Toe refrigeration
lighting
kitchen
hot wter60
80
Million Toe biomass
solar wind
Hydogen
Natural Gas
20
40
cooling
20
40
Oil
coal
electricity
0
20
BASE BAU CM1 CM2
0 BASE BAU CM1 CM2

Action3: Low Carbon Electricityy
• Increasing the use of renewable energy in energy supply mix of the power generation,
• Developing more efficient power generation p g p g(from pulverized to supercritical or IGCC),
• Reducing losses in transmission and distributionReducing losses in transmission and distribution (T&D) of electricity grids, and
• CCS (carbon capture and storage) application• CCS (carbon capture and storage) application

80%
100%coal
oil
Energy efficiency level of power generation
60%
80% oil
gas
hydro
nuclear power generation
20%
40%nuclear
geothermal
biomass
IGCC + ccs
0%Base BAU CM1 CM2
80%
100%IGCC + ccs
biomassShare of each energy60%
geothermal
nuclear
hydro
Share of each energy type in power generation
20%
40% gas
oil
coal
0%Base BAU CM1 CM2
Figure 18 Share of each energy type in power generation

Action 4: Low Carbon Fuels Industry
30
40
005 =
1
10
20
Value
of 20
I t f i t t f0Economic Output Energy Demand GHG Emissions
2005 2050 BaU 2050 CM1 2050 CM2
Impact of economic output of energy demand and CO2 emissions
500
Energy Service Demand of indutry sectr, Million Toe400,000
Energy demand in industry, kToe
300
400
kiln
carbon steel
others200,000
300,000
ele
bms
100
200
others
machine tech
steam
direct heat
100,000
gas
oil
col
0
Base BAU CM1 CM2
0
Base BAU CM1 CM2
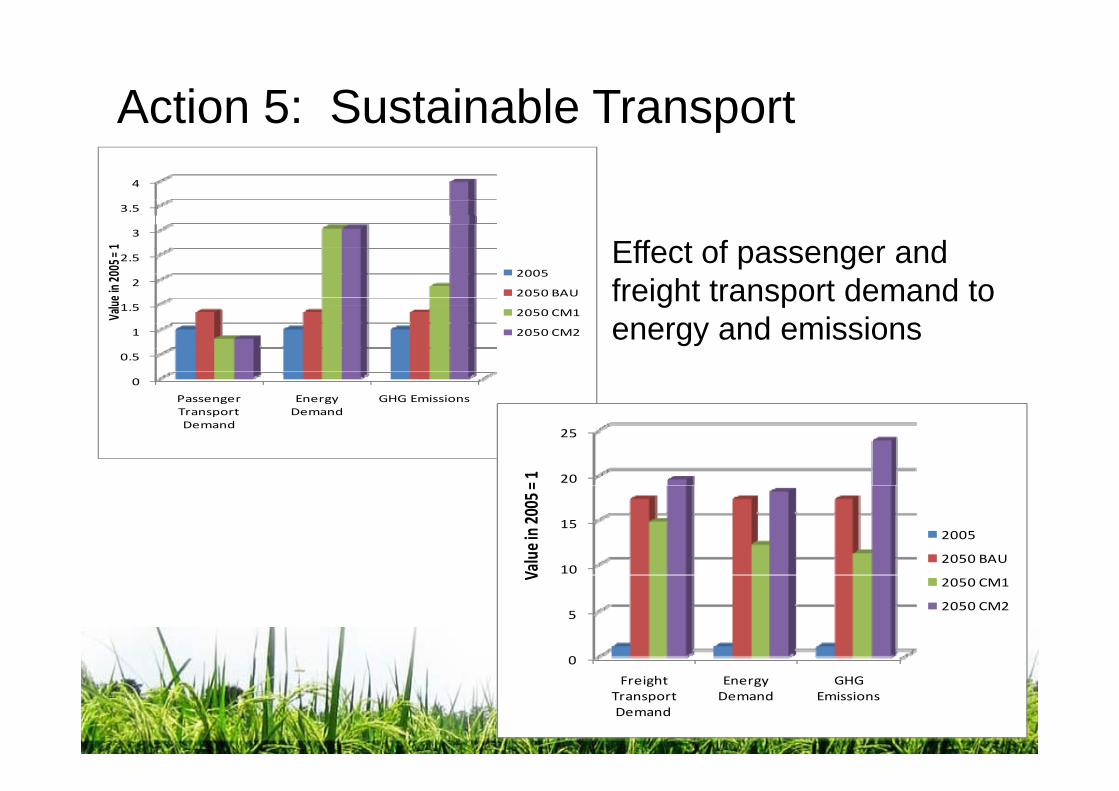
Action 5: Sustainable Transportp
3.5
4
1 5
2
2.5
3
ue in
2005
= 1
2005
2050 BAU
Effect of passenger and freight transport demand to
0
0.5
1
1.5
P E GHG E i i
Valu
2050 CM1
2050 CM2
g penergy and emissions
Passenger Transport Demand
Energy Demand
GHG Emissions
20
25
= 1
10
15Va
lue in 2005
=2005
2050 BAU
0
5
V 2050 CM1
2050 CM2
Freight Transport Demand
Energy Demand
GHG Emissions

2,000
2,500
n p‐km
)
Walk+CycleAirShip
1,500
mand (M
illion Motorcycle
BusCar Passenger transport
demand by type of vehicle
500
1,000
Transport D
em demand by type of vehicle
0
2005 2050 BAU 2050 CM12050 CM2
T
18.5
20.8
20
25
‐km)
15.8
10
15
rt Dem
and (Mn t
‐Freight transport demand
by type of vehicle
1.1
5Transpo
r
1.1
0
2005 2050 BAU 2050 CM1 2050 CM2

Policies and RegulationsPolicies and Regulations
• There are numerous energy climate policy• ₋ There are numerous energy‐climate policy initiatives, regulations, and actions in energy sector that could result in CO2 emission reduction. The latest policy initiative is non‐binding emission reduction target of 26% lower than baseline in 2020 using domesticlower than baseline in 2020 using domestic budget and further increased to 41% with international support To implement noninternational support. To implement non‐binding commitment, GOI prepares National
i l dActions Plan 2010 ‐2020 to Reduce CO2 Emissions.

Policies and Regulations
• There are numerous energy-climate policy initiatives, regulations and actions in energy sector that could result inregulations, and actions in energy sector that could result in CO2 emission reduction.
• The latest policy initiative is non binding emission reduction• The latest policy initiative is non-binding emission reduction target of 26% lower than baseline in 2020 using domestic budget and further increased to 41% with international support. g pp
• To implement non-binding commitment, GOI prepares National Actions Plan 2010 -2020 to Reduce CO2 Emissions. 2
• In addition to the policy initiatives, most actions plan developed for achieving the LCS target will still need policy measures to g g ysupport the implementations of these actions

(1) Increasing share of new/renewable energy and less carbon emitting ( ) g gy gfuels (include less carbon emitting technology) in energy supply mix to support implementation of Presidential Regulation 5/2006. On going programs considered to meet energy supply mix target areOn-going programs considered to meet energy supply mix target are power generation crash program I and II (which include clean coal and geothermal), kerosene to LPG, mandatory of bio-fuel utilization in power l t t t ti d i d t (MEMR 32/2008)plant, transportation, and industry (MEMR 32/2008);
(2) Increasing share of new/renewable (hydro, geothermal) and oil switch to natural gas as stated in the National Plan of Electricity Development g y p(RUPTL) PLN 2008 - 2018;
(3) Regulations that lead to the formulation of national master plan on energy efficiency;energy efficiency;
(4) Policies to support MRT development, diversification of fuels (CNG/LPG, bio-fuel, electricity) in transportation, and emissions monitoring and control of local emission and combustion efficiency that has implication to the CO2 emissions generation.

Conclussion• If current economic growth and socitey behavior continues until 2050
in the BaU scenario the energy demand will increase by 8.2 times gy yand the associated emissions will increase by 12.5 times, both compared to 2005 levels.
• CM1 and CM2 both lead to the CO2 emisssions reduction compared to BAU
CM1• CM1– Moderate economic gowth, with current policies and regulations
and efficiency efforts will lead to 33% energy conservation andand efficiency efforts will lead to 33% energy conservation and 53% emisions avoidance, both compared to the Bau levels
– Low energy conservation and emisions avoidance due to moderate economic growth will limit efforts in improving energy efficiency and investment in infrastrucures related to energy supply – demand
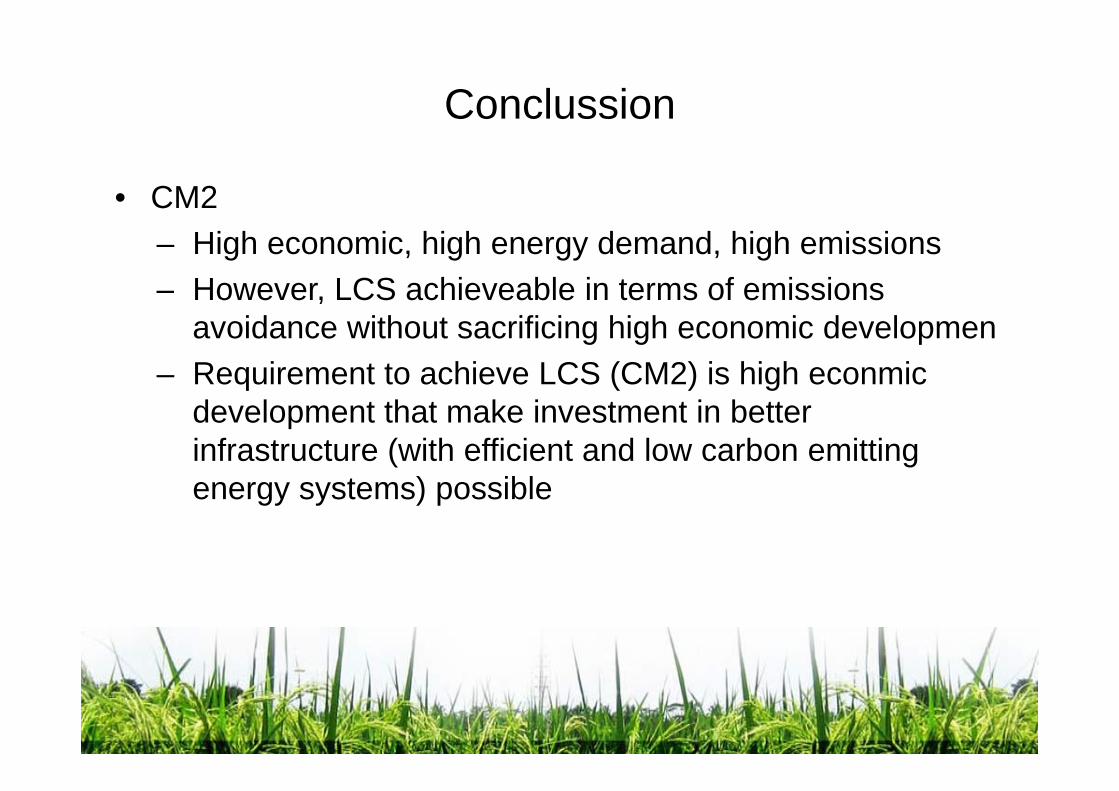
Conclussion
• CM2– High economic, high energy demand, high emissions – However, LCS achieveable in terms of emissions
avoidance without sacrificing high economic developmen– Requirement to achieve LCS (CM2) is high econmic
development that make investment in better infrastructure (with efficient and low carbon emitting energy systems) possibleenergy systems) possible

NIESNIES
Indonesia Low Carbon Society Vision of 2050 In Energy SectorFebruary, 2010
Institut Teknologi Bandung (ITB) IndonesiaInstitut Teknologi Bandung (ITB) - Indonesia Retno Gumilang Dewi
Institute for Global Environmental Strategies (IGES) - JapanTakuro Kobashi
Kyoto University - JapanYuzuru Matsuoka
Kei GomiMizuho Information & Research Institute JapanMizuho Information & Research Institute - Japan
Tomoki EharaNational Institute for Environmental Studies (NIES) - Japan
Mikiko KainumaJunichiro Fujino