low-carbon cars in germany: technical report · low-carbon cars in germany: technical report...
TRANSCRIPT

Final Report October
2017
Cambridge Econometrics
Cambridge, UK
www.camecon.com
European Climate Foundation
Low-Carbon Cars in Germany Technical report

Low-carbon cars in Germany: technical report
2 Cambridge Econometrics
Our mission is to provide clear insights, based on rigorous and independent economic analysis, to support policy-makers and strategic planners in government, civil society and business in addressing
the complex challenges facing society.
Cambridge Econometrics Limited is owned by a charitable body, the Cambridge Trust for New Thinking in Economics.
www.neweconomicthinking.org

Low-carbon cars in Germany: technical report
3 Cambridge Econometrics
Authorisation and Version History
Version Date Authorised for release by
Description
1.0 11/10/17 Philip Summerton Final report

Low-carbon cars in Germany: technical report
4 Cambridge Econometrics
Acknowledgments
This study on the impacts of low-carbon mobility in Germany builds on a series of previous studies examining the potential impacts of the transition to low-carbon mobility in the UK (‘Fuelling Britain’s Future’, 2015), France (‘En route pour un transport durable’, 2016), and in the wider EU (‘Fuelling Europe’s Future, 2012). The technology cost analysis published in Fuelling Europe’s Future, developed by Ricardo-AEA and the core working group for that project, forms the starting point for this analysis.
Cambridge Econometrics provided the lead for the analytical work presented in this report, principally relating to the development and application of the passenger car stock model for Germany and for the economic modelling undertaken in E3ME.
Element Energy, which previously contributed analysis on hydrogen and synergies between electric vehicle charging and the functioning of the electricity grid, carried out a similar analysis within the German context and carried out a detailed assessment of charging infrastructure requirements and battery costs.
M-Five’s role in the project was to undertake a detailed review of the supply chain for low-carbon vehicles and an assessment of the extent to which these supply chains could be captured by German industries.
The report was funded by the European Climate Foundation who convened a core working group to advise and review the analysis and reporting. The authors would like to thank all members of the core working group for their respective inputs.
The stakeholders who contributed to this study shared the aim of establishing a constructive and transparent exchange of views on the technical, economic and environmental issues associated with the development of low-carbon technologies for cars. The objective was to evaluate the boundaries within which vehicle technologies can contribute to mitigating carbon emissions from cars in Germany. Each stakeholder contributed their knowledge and vision of these issues. The information and conclusions in this report represent these contributions, but should not be treated as binding on the companies and organisations involved.
The technology cost analysis was independently reviewed by Peter Mock, Managing Director of the International Council for Clean Transportation.
Background
Core analytical team
Disclaimer
Review

Low-carbon cars in Germany: technical report
5 Cambridge Econometrics
Contents
Page
Executive Summary 7
1 Introduction 9
2 Overview of scenarios 13
3 Modelling assumptions 17
4 Infrastructure requirements 33
5 Consumers’ Perspective 38
6 Value Chains 43
7 Synergies between EVs and the electricity grid 51
8 Economic impacts 55
9 Environmental impacts 63
10 Conclusions 65
Appendix A E3ME model description 67
Appendix B ICE Vehicle Technology improvements 74
Appendix C Charging infrastructure assumptions 76

Low-carbon cars in Germany: technical report
6 Cambridge Econometrics
Acronyms and Abbreviations
Table 1.1 sets out the acronyms and abbreviations commonly used in the report.
Table 1.1 Acronyms and abbreviations
Abbreviation Definition
Powertrain types
Internal combustion engine
ICE These are conventional petrol or diesel cars with an internal combustion engine. In the various scenarios modelled there is variation in the level of efficiency improvements to the ICE. Efficiency improvements cover engine options, transmission options, driving resistance reduction, tyres and hybridisation. Under our definition of an ICE, hybridisation is limited to micro-hybrids with start-stop technology and regenerative breaking.
Hybrid electric vehicles
HEV This definition covers full hybrid electric vehicles that can be run in pure EV mode for some time. They have a larger battery than the micro-hybrids (that are classified as ICEs).
Plug-in hybrid electric vehicle
PHEV Plug-in hybrid electric vehicles have a large battery and an internal combustion engine. They can be plugged in to recharge the vehicle battery. EVs with range extenders are not included in the study.
Battery electric vehicle
BEV This category refers to fully electric vehicles, with a battery but no engine.
Fuel cell electric vehicle
FCEV FCEVs are hydrogen fuelled vehicles, which include a fuel cell and a battery-powered electric motor.
Zero emissions vehicle
ZEV Includes all vehicles with zero tailpipe emissions (e.g. FCEVs and BEVs).
Economic terminology
Gross domestic product
GDP A monetary measure of the market value of all final goods and services in the national economy
Gross Value added
GVA A measure of the total value of goods and services in the economy netted from value of inputs and taxes.
Other acronyms
Original equipment manufacturers
OEMs Refers to equipment manufacturers of motor vehicles
Million barrels of oil equivalent
mboe A unit for measuring oil volumes

Low-carbon cars in Germany: technical report
7 Cambridge Econometrics
Executive Summary
Renowned for its high quality and innovation, the German automotive industry is among the largest global producers of vehicles: in 2016 alone, over 5.7 million passenger cars were produced in Germany1. The automotive industry’s contribution to the German economy is also substantial, supporting 880,000 jobs and €100bn in GVA each year. Considered to be one of Germany’s most successful export industries, the automotive sector is also likely to be one of the sectors most affected by the low-carbon transition.
Cambridge Econometrics, Element Energy and M-Five were commissioned by the European Climate Foundation (ECF) to assess the likely economic impacts and the transitional challenges associated with decarbonising the German car fleet in the medium term (to 2030) and the long term (to 2050).
This technical report sets out the findings from our analysis of the impacts of decarbonising transport in Germany. It provides details about the EV charging infrastructure requirements, technology costs and economic impacts of the transition to low-carbon mobility. A summary report, presenting the key messages from the study, is also available2.
The study results show that, whilst there are potentially large economic and environmental benefits associated with decarbonising transport in Germany, there are also considerable transitional challenges which must be addressed if the benefits are to be realised. In recent years, there has been a strong push to decarbonise transport in Europe and this change is coming irrespective of how transport policy in Germany evolves. If Germany is to continue as a global leader in automotive sector, then the German automotive manufacturers must be supported to adapt to this change.
The potential benefits if Germany embraces the transition are substantial:
• The reduced dependence on imported oil and petroleum products will not only deliver benefits in terms of reduced energy dependence, but also large reductions in carbon emissions, particularly as Germany already has a high share of electricity generated from renewable, low-carbon electricity, that is set to increase going forwards
• Net economic and employment gains which increase as oil imports are reduced over the time frame assessed. By 2030, the TECH scenario would lead to an increase in GDP of 0.5-0.6% and an increase in net employment of around 145,000 jobs.
• The potential for EV and grid synergies using smart charging strategies to shift EV charging demand away from peak periods to periods of low system demand, would mitigate the challenges posed on the electricity system by EVs, limiting increases in peak electricity demand to 3GW by 2050.
1 OICA Production Statistics (2017), available at: http://www.oica.net/category/production-statistics/ 2 See: https://www.camecon.com/how/our-work/low-carbon-cars-in-germany/

Low-carbon cars in Germany: technical report
8 Cambridge Econometrics
• For the consumer, we expect that the 4-year total cost of ownership of Zero-Emission Vehicles could converge towards that for conventional petrol and diesel cars by the year 2030, even with conservative assumptions for battery costs
However, our modelling in combination with insight from the Core Working Group also highlights a number of transitional challenges:
• Sustainable and low CO2 mobility needs to take into account solutions beyond the passenger car sector. Efforts to reduce CO2 emissions in the automotive sector (by new cars) until 2050 will be comprehensive, but won´t achieve the ambitious national goals alone. There will need to be improvements in the efficiency of heavy duty vehicles, such as buses and trucks alongside a consideration of advanced low-carbon fuels.
• Locating battery cell production in Germany is an important part of the economic transition and, if achieved, will contribute to the continuation of a strong, competitive automotive sector in Germany. If the transition to battery electric vehicles happens quickly, it is of considerable importance to the German economy that battery cell manufacturing takes place at scale in the next five to ten years.
• The implementation of a rapid charging infrastructure in Germany will require investments reaching several billion euros by 2030. A determined and joint effort of the industry, government and civil society is needed in order to deploy sufficient charging infrastructure. Timing, location, capability and interoperability are key issues.
• The transition to low-carbon mobility causes a wide range of impacts in employment across several sectors. Employment in the automotive sector will remain stable until 2030 in our central scenario, where climate goals are met through a balanced mix of hybrids, plug-in vehicles and increasingly efficient ICEs. After 2030, the transition to electric mobility will increase employment in sectors such as construction and infrastructure, as well as services, but is likely to have an adverse impact on employment in the automotive value chain.

Low-carbon cars in Germany: technical report
9 Cambridge Econometrics
1 Introduction
1.1 Background
In November 2013, the European Parliament and the Council of the European Union set out new legislation to limit the emissions of new vehicles. The EU CO2 standards required fleet-wide average vehicle emissions to be below 95g CO2 per km by 2021. In line with the EU’s “Strategy on Low Emissions Mobility” it is expected that more stringent new vehicle emissions standards will soon be announced for 2030, to ensure continuation along a low carbon pathway and to meet EU-wide targets for a 60% reduction in transport emissions by 2050.
Announcements in 2017 by the French and UK governments to ban new sales of conventional petrol and diesel cars by 2040 has also sent a clear signal that change is coming. As well as supporting the curtailment of CO2 emissions, the impetus for this change is, in part, due to increasing concern about the level of local air pollutants (such as NOx) emitted by vehicles and the negative health outcomes associated with this pollution, especially in densely populated urban areas.
As in France and the UK, transport policy in Germany is also on a low carbon path. The German government has a target for 1 million EVs on the road by 2020 and 6 million EVs by 2030. In addition, the government has committed to reducing transport CO2 emissions by 40-42% by 2030.
To meet the requirements of EU legislation, most major car manufacturers in Germany had previously developed new product lines that are increasingly fuel efficient, and are now moving increasingly towards electrification:
• Volkswagen has announced investments of $84bn into electric vehicles and battery development, targeting 1m electric vehicle sales by 2025. The company also stated it would offer electric versions of all 300 of its brands by 2030.
• Audi has announced three all electric vehicles to be produced in 2018, 2019 and 2020 and has agreed to cooperate with Porsche on a shared architecture for electric and autonomous vehicles.
• Mercedes-Benz (Daimler) has announced an acceleration of their electric vehicle plans to have ten new all-electric models and 15-25% of all production electric by 2022.
• BMW has developed the i3 and i8 electric vehicles (both manufactured in Leipzig). In September 2017 it announced that it plans to mass produce electric cars by 2020 and offer twelve different electric models by 2025.
Low-carbon transport policy
Low-carbon initiatives by
German OEMs

Low-carbon cars in Germany: technical report
10 Cambridge Econometrics
There has been much debate about the potential impacts of the transition to ZEVs. As one of the largest vehicle manufacturers in the world, Germany is sometimes considered as one of the countries that has most to lose from the low-carbon transition. However, if the transition is well-managed, it could be one of the countries with most to gain.
The purpose of this study is to shed light on the potential benefits and the transitional challenges of decarbonising passenger cars for the German automotive industry and the wider economy over the period to 2050. In doing so, it highlights some of the key issues that policy makers should focus on. As Germany becomes increasingly dependent on battery technologies, this study seeks to address questions about supply chains, labour requirements and the wider economic impacts brought about by this change: Where will EV batteries be manufactured? What will be the impact on traditional automotive sector value chains and jobs? Is Germany (and the wider EU) well-equipped to deal with the potential skills challenges? How will government tax revenues be affected due to reduced fuel duty? What will be the impact on the electricity grid and peak electricity demand?
The study also addresses some of the key uncertainties about the transition: What if future oil prices are higher (or lower) than projected? What if technology costs and battery costs are different to expected? What if PHEVs or FCEVs become the ‘technology winner’, instead of BEVs?
1.2 Methodology
For this study, a set of scenarios were defined where it was assumed that a certain low-carbon vehicle technology mix would be achieved by vehicle CO2 emissions regulations. The factors affecting consumers decisions to purchase alternative vehicle technologies was not assessed.
As shown in the graphic below, the methodology involved three key stages:
1) Stakeholder consultation to define the scenarios and agree on the key modelling assumptions
2) An integrated modelling framework that involved (i) application of the Cambridge Econometrics’ vehicle stock model to assess the impact of alternative low-carbon vehicle sales mix on energy demand and emissions, vehicle prices, technology costs and the total cost vehicle of ownership and (ii) application of the E3ME model to assess the wider socio-economic effects of the low-carbon vehicle transition.
3) Off model analysis to consider (i) how vehicle value chains would evolve under the low-carbon vehicle transition and (ii) the energy system and grid benefits of increased use of BEVs and FCEVs (eg. through the provision of grid balancing services).
Motivation for the study

Low-carbon cars in Germany: technical report
11 Cambridge Econometrics
Figure 1.1: Our approach
The two models that were applied in our framework are the Cambridge Econometrics’ Vehicle Stock Model and E3ME.
Cambridge Econometrics’ vehicle stock model calculates vehicle fuel demand, vehicle emissions and vehicle prices for a given mix of vehicle technologies. The model uses information about the efficiency of new vehicles and vehicle survival rates to assess how changes in vehicles sales affect stock characteristics. The model also includes a detailed technology sub-model to calculate how the efficiency and price of new vehicles are affected, with increasing take-up of fuel efficient technologies. The vehicle stock model is highly disaggregated, modelling 16 different technology types across three different size-bands (small, medium and large)3.
Some of the outputs from the vehicle stock model (including fuel demand and vehicle prices) are then used as inputs to E3ME, an integrated macro-econometric model, which has full representation of the linkages between the energy system, environment and economy at a global level. The high regional and sectoral disaggregation (including explicit coverage of every EU Member State) allows modelling of scenarios specific to Germany and detailed analysis of sectors and trade relationships in key supply chains (for the automotive and petroleum refining industries). E3ME was used to assess how the transition to low carbon vehicles affected household incomes, trade in oil and petroleum, consumption, GDP, employment, CO2, NOx and particulates.
For more information and the full model manual, refer to www.e3me.com. A summary description of the model is also available in Appendix A.
3 See Section 3, Table 3.1 for more details.
Cambridge Econometrics’ Vehicle Stock
Model
E3ME

Low-carbon cars in Germany: technical report
12 Cambridge Econometrics
1.3 Structure of the report
The report is structured as follows:
• Section 2 sets out the scenarios that were developed to inform the analysis and are required to answer the questions raised by the Core Working Group
• The main modelling assumptions and technology cost data are set out in Section 3
• New infrastructure requirements are a key consideration for the deployment of zero emission vehicles, these are considered in Section 4
• Above all, a transition requires consumers to adopt low and zero emission cars. In Section 5 we look at the capital and fuel costs facing the consumer for new cars in the future
• The automotive sector and supply chain is an integral part of the German economy, drawing exclusively on the analysis of M-FIVE, Section 6 looks in details at the extent to which battery manufacturing could take place in Germany
• A transition to electric vehicles has implications for the electricity grid. In Section 7, Element Energy has assessed the implications for the German electricity grid of electric vehicles and the extent to which the challenges that arise are offset by the application of smart charging
• The core analysis, focuses on the macroeconomic impact of the difference scenarios. The net impacts and transitional challenges are set out in Section 8.
• The main driver of low emission cars, is to reduce the harmful impact that road transport has on the local and global environment. The contribution of passenger cars to CO2 emissions and local air quality pollutants is set out in Section 9.
• The report finishes with our conclusions in Section 10. These are the views of the report’s authors and do not necessarily represent the views of the European Climate Foundation or the members of the Core Working Group, either individually or collectively.

Low-carbon cars in Germany: technical report
13 Cambridge Econometrics
2 Overview of scenarios
2.1 Scenario design
The analysis set out in this report is based on a set of scenarios developed by the Core Working Group, which each assume a different vehicle sales mix. To assess the economic impacts of the transition to low-carbon vehicles over 2015-2050, six scenarios were compared:
• A reference scenario (REF) which assumes no improvements to new vehicle efficiency after 2015. This is used as a clean baseline for comparison, to assess the impact of new ‘current policy’ vehicle emissions legislation. Despite no change to the vehicles sales mix over the projection period, total energy use in the vehicle stock falls in the short-term in this scenario, as the new vehicles replace older (less efficient) vehicles in the stock.
• A ‘current policy initiative’ scenario (CPI) which is based on the latest European Commission legislation to regulate the new vehicle efficiency of cars to 95 g/km by 2021, with emissions savings predominantly driven by ICE efficiency improvements.
• A low-carbon technology scenario (TECH), which assumes a rapid take-up of advanced powertrains (PHEVs, BEVs and FCEVs) in the medium term. This is combined with ambitious deployment of fuel-efficient technologies (such as light-weighting and low rolling resistance tyres) in all new vehicles over the period to 2050.
• A variant of the TECH scenario where PHEVs emerge as a ‘technology winner’ post 2030 (TECH PHEV) and take the majority share of advance powertrain deployment whereas BEVs and FCEV remain slow to deploy.
• A variant of the low carbon technology scenario, where FCEVs are rapidly deployed post-2030 and emerge as a ‘technology winner’ (TECH FCEV).
• A low carbon technology scenario with a more ambitious deployment for advanced powertrains (TECH RAPID) where, in line with German Greens’ targets, there are no new sales of ICEs from 2030 onwards, which are replaced predominately by BEVs.
For the most part, this technical report focusses on the impact of the central TECH scenario, but the variants are picked up in the following way:
• TECH FCEV is assessed in the infrastructure section to consider whether a large roll-out of FCEVs, although more expensive that BEVs on current technology cost outlooks, benefits society because of lower infrastructure requirements.
• TECH PHEV is used to understand the implication for jobs in the automotive supply chain
• TECH RAPID is used to understand the impact that a very fast transition would have on road transport CO2 emissions and the economic risks and potential benefits of moving more rapidly

Low-carbon cars in Germany: technical report
14 Cambridge Econometrics
2.2 Vehicle sales and stock
The composition of vehicle sales and the vehicle stock over time in each scenario is shown in Figure 2.1.
In the TECH scenario in 2030, new vehicle sales are still predominately mild and micro hybrid ICEs (53%), but there is a large share of full hybrids (11%), plug-in hybrids (20%) and BEVs (10%). Post-2030, the market for BEVs takes off as sales grow to 49% by 2040 and 69% by 2050. Fuel cell vehicles are assumed to only capture a small share by 2050 as they are slowly introduced to target the ‘longer range’ market. PHEVs are taken up as a ‘bridging’ technology and are deployed initially but sales of PHEVs are gradually phased out by 2050.
Figure 2.1:Powertrain deployments in new sales for TECH scenario
In Figure 2.2, we see the impact of the new sales deployments on the vehicle stock. Despite the ambitious deployment of new advanced powertrains in the TECH scenario, ICEs continue to make up a large share of the stock in 2030 and BEVs only just achieve a majority in the vehicle stock by 2050. The stock of EVs (PHEV, BEV and FCEV) does not reach the German target of 1 million

Low-carbon cars in Germany: technical report
15 Cambridge Econometrics
vehicles by 2020 but does meet the target of 6 million EVs by 2030. By 2040, the stock of EVs grows to 19 million and by 2050 reaches around 32 million.
In the TECH RAPID scenario, the majority of cars in the stock (86%) are advanced powertrains by 2040.
Figure 2.2: Composition of vehicle stock in TECH scenario
2.3 Fuel demand
Figure 2.3 shows the combined effects on efficiency improvements and deployment of advanced powertrains on fuel consumption by the German vehicle stock in the TECH scenario. By 2030, we see a substantial reduction in demand for fuel, with a 40% reduction in petrol and diesel demand relative to 2015 (equivalent to 3.3m barrels of oil saved by 2030). By 2050, the passenger car stocks oil and petroleum demand will have fallen by 90% compared to 2015 levels.
Electricity and hydrogen demand grows in line with rollout of the stock of PHEVs, BEVs and FCEVs and, by 2050, due to the relative efficiency of advanced powertrains, demand for these fuels only makes up 55% of total fuel consumption, despite PHEVs, BEVs and FCEVs making up 75% of the

Low-carbon cars in Germany: technical report
16 Cambridge Econometrics
vehicle stock. The additional electricity demand is around 46TWh by 2050 which is, equivalent to 8% of total German electricity demand.
Figure 2.3: Stock Fuel consumption in TECH scenario

Low-carbon cars in Germany: technical report
17 Cambridge Econometrics
3 Modelling assumptions
This section sets out the key modelling assumptions underpinning the analysis.
The scenarios are defined by (i) the sales mix by vehicle powertrain type and (ii) the take-up of fuel efficient technologies. Key assumptions common to all scenarios and are briefly outlined in Section 3.1. The subsequent sections provide information about our technology costs, battery costs and power sector assumptions.
3.1 Key modelling assumptions
Details of assumptions used
Vehicle sales • Historical data taken from the ICCT
• In line with results for Trend Scenario from the Shell study4 we assume a gradual reduction in new vehicle sales in all scenarios over the period to 2050, with new vehicle sales falling from the 3 million per annum currently to around 2.8 million per annum by 2050
• Reflecting the gradual reduction in vehicle sales, the size of the vehicle fleet falls slightly in all scenarios, reaching around 43 million passenger cars by 2050
Efficiency of new vehicles
• This is an outcome of the vehicle stock model, based on assumptions about the vehicle powertrain and the energy efficient technologies that are installed in the vehicle. For more information see Section 3.2.
Mileage by age cohort
• Based on the Shell study and the Ricardo AEA analysis for EC5, we assume that an average car travels around 14,500 km per year. We assume that average annual mileage falls gradually over the lifetime of the vehicle and we assume that the mileage for diesel cars is around 50% higher than that for petrol cars and EVs.
Vehicle survival rates
• Survival rate assumptions are based on a report by the Öko Institute, TML, COWI 6 and data from the German KBA and “Anfac vehicle parc”7 The survival rates have then been adjusted to calibrate to the existing German vehicle fleet.
Fuel prices • Historical data for fuel prices is taken from the European Commission’s Oil Bulletin8
• For the central scenarios, we assume oil prices grow in line with the IEA’s 2016 World Energy Outlook Current Policies Scenario (and a constant percentage mark-up is applied to derive the petrol and diesel fuel price)
• Fossil fuel price sensitivities were also tested
Electricity prices • These are based on a high share of renewables in the power sector (80% renewable electricity generation by 2050)
• The electricity price for EV users is assumed to be the same as that paid by households at 25-30 cents/KWh over the period to 2050 (in 2014 prices)
4 Shell passenger car scenarios for Germany to 2040 (2014) 5 http://ec.europa.eu/clima/events/docs/0089/study_mileage_en.pdf 6 Oko-Institut, TML and COWI (2010) European second-hand car market analysis A report for the European Commission‟s DG Climate Action 7 http://www.acea.be/statistics/tag/category/anfac-vehicles-in-use-report 8 http://ec.europa.eu/energy/en/data-analysis/weekly-oil-bulletin
Low-carbon cars in Germany: technical report
18 Cambridge Econometrics
Rest of world • In each scenario, we assume that low-carbon transport policy in the rest of Europe is consistent with that in Germany
• Rest of world assumptions on low carbon transport policy affect the global oil price and are tested through sensitivity analysis
Value chains • In all scenarios, we assume that Germany captures a consistent share of the vehicle value chain for conventional ICEs. For the central scenarios, we assume that, for EVs, battery modules and battery packs are assembled in Germany but that the battery cells are manufactured in Asia.
• A sensitivity is tested where we assume that the battery cells, battery modules and battery packs are all manufactured and assembled in Germany.
Trade in motor vehicles
• We assume the same volume of vehicle imports and exports in each scenario. The price of vehicle imports and vehicle exports changes in line with the change in domestic vehicle prices (reflecting that transport policy in Germany is assumed to be consistent with that in the rest of the EU).
3.2 Cost of fuel-efficient technologies
To achieve the vehicle emissions targets, as well as a transition to advanced low-carbon powertrains, the low-carbon scenarios also assume efficiency improvements through use of low-carbon technologies and lighter materials.
There is considerable uncertainty about the future cost of vehicle technologies. Recent studies reflect a wide range of costs of carbon abatement technologies for vehicles, ranging from IKA (2015) figures9, at the top end of the range, to the ICCT (2016) analysis10 at the low end of the range. For this study, values from a cost analysis for the European Commission by Ricardo-AEA (2015)11 were used, which falls roughly in the middle of this range of cost estimates, above that of the ICCT and below that of IKA. A high-cost sensitivity has been modelled that is in line with IKA, and a low-cost sensitivity has been modelled that is in line with ICCT. Thus, we have been able to capture the range of views on future technology costs within the modelling framework. The range of costs of fuel-efficient technologies are shown in Figure 3.1.
9 IKA (2015), Institut für Kraftfahrzeuge, “CO2-Emissionsreduktion bei Pkw und leichten Nutzfahrzeugen nach 2020,” http://www.bmwi.de/DE/Mediathek/publikationen,did=686692.html 10 ICCT (2016), ‘2020–2030 CO2 standards for new cars and light-commercial vehicles in the European Union’ http://www.theicct.org/sites/default/files/publications/ICCT_EU-CO2-stds_2020-30_brief_nov2016.pdf 11 Ricardo-AEA (2015), Ricardo-AEA, “Improving understanding of technology and costs for CO2 reductions from cars, and LCVs in the period to 2030 and development of cost curves,” 28 July 2015 draft version, distributed at a stakeholder workshop of the European Commission DG CLIMA

Low-carbon cars in Germany: technical report
19 Cambridge Econometrics
Figure 3.1 Alternative technology cost assumptions
Source: Mock, P., ‘2020–2030 CO2 standards for new cars and light-commercial vehicles in the European
Union’, 2016
Building on the definitions of the TNO 2011 study “Support for the revision of Regulation (EC) No 443/2009 on CO2 emissions from cars”, we use the following set of definitions for downsizing options, compared to a comparable 2010 car (without downsizing).
Definitions:
• mild downsizing (15% cylinder content reduction)
• medium downsizing (30% cylinder content reduction)
• strong downsizing (45% cylinder content reduction)
Other engine options include:
• Direct injection (homogenous)
• Direct injection (stratified charge)
• Thermodynamic cycle improvements (e.g. homogenous charge compression injection HCCI)
• Cam phasing
• Variable valve actuation and lift
While other transmission options include:
• optimising gearbox ratios
• automated manual transmission
• dual clutch transmission
• continuously variable transmission
The scale of hybridisation included in the modelling is as follows:
• start-stop hybridisation
Definitions

Low-carbon cars in Germany: technical report
20 Cambridge Econometrics
• start-stop hybridisation with regenerative breaking
• full and mild hybrid (modelled as a powertrain switch)
Our cost assumptions are based on Ricardo-AEA (2015), with high and low variants based on IKA (2015) and ICCT (2016) respectively.
The costs in Table 3.1 are sourced from the latest R-AEA (2016) datasets developed for the European Commission. Table 3.1 summarises the main technologies included and the associated energy savings and cost increase compared to a 2015 new car without those same features.
Table 3.1: Engine and transmission options – 2015 cost curve data
Downsizing options Energy saving Cost (€)
Small car Medium car Large car
Mild (15% cylinder content reduction)
4-6% 88 110 115
Medium (30% cylinder content reduction)
10-13% 120 180 180
Strong (45% cylinder content reduction)
15-19% 165 195 195
Combustion improvements (petrol)
5% 224 224 314
Combustion improvements (diesel)
2% 204 204 285
Cylinder deactivation 5% 155 155 155
Other engine options (petrol only)
Energy saving Cost (€)
Small car Medium car Large car
Direct injection (homogenous)
4.5-5.5% 130 130 184
Direct injection (stratified)
10-14% 250 350 435
Thermodynamic cycle improvements
11-13% 280 300 400
Cam phasing 5% 50 50 80
Variable valve actuation and lift (petrol and diesel)
9% 144 150 235
Transmission options Energy saving Cost (€)
Small car Medium car Large car
Optimising gearbox ratios / downspeeding
4% 40 40 40
Automated manual transmission
2-5% 220 220 230
Dual clutch transmission 3-6% 233 250 257
Partial hybridisation Energy saving Cost (€)
Small car Medium car Large car
Start-stop 2.5-5% 66 80 96
Start-stop with regenerative breaking
6-10% 219 235 300
Note: Costs are at mass production levels.
There remains much more that can be done to improve the efficiency of the internal combustion engine and transmission system, and many of the technologies that are already available on the marketplace can make a significant impact on fuel consumption in the 2020-2025 timeframe. Start-stop technology using advanced lead-based batteries is perhaps the most cost-effective way of achieving reductions of 5-10 per cent in CO2 emissions
Technology costs and energy savings

Low-carbon cars in Germany: technical report
21 Cambridge Econometrics
(depending on whether the system is able to recapture braking energy). Ricardo-AEA has estimated that the cost per gram of CO2 reduction is about half that of improving the fuel efficiency of the internal combustion engine, and less than a quarter of that for hybridisation.
Other options that are likely to be applied first include engine downsizing coupled with boost (e.g. combination of turbo- and super-charging) and direct injection for petrol engines. For example, there has already been a 31 per cent reduction in g/km of CO2 between 2010 petrol Ford Focus variants (at 159 g/km) and 2012 EcoBoost branded variants (at 109 g/km), achieved mainly through the use of downsized engines (from 1.6 litres to 1.0 litres) with turbo-charging, direct injection and start-stop technologies. Systems combined also with increasing levels of hybridisation offer even greater potential benefits – e.g. 52 per cent reduction in CO2 going from the 2010 petrol Toyota Yaris (at 164 g/km) to the 2012 Toyota Yaris hybrid (at 79 g/km). Most recently Mazda announced the possibility of increasing fuel efficiency in petrol cars by up to 30%, through the elimination of spark plugs in its SkyactiveX engines.
Table 3.2 highlights the efficiency improvements in the ICE that come about from engine improvements, transmission improvements and partial hybridisation in the CPI and TECH scenarios respectively. In the post 2030 period relatively little is done to improve the efficiency of the ICE, as sales in advanced powertrains dominate the market and few additional improvements are deemed cost effective.
In 2030, nearly all new ICE vehicles have the following features (as applicable12):
• start-stop (all) plus regenerative breaking (75%)
• between 30% and 45%-cylinder content reduction
• variable valve actuation and lift
• gear box optimisation
• direct injection or HCCI
In the period to 2050 the additional improvements to ICE efficiency that can be attributed to the engine and transmission (rather than light-weighting and improved rolling resistance) are the mainstreaming of dual clutch transmissions, regenerative breaking and 45% cylinder content reduction across the board.
The data suggests less technological potential to improve the efficiency of a diesel engine than petrol engines.
12 Some technologies are not applicable to diesel cars
Efficiency improvements in the CPI and TECH
scenario

Low-carbon cars in Germany: technical report
22 Cambridge Econometrics
Table 3.2: New car efficiency CPI Scenario and TECH Scenario (% reduction in MJ/km to 2010)
CPI TECH
Size Fuel 2010 2015 2020 2020 2030 2050
Small Petrol - 11% 22% 24% 41% 45%
Medium Petrol - 12% 23% 25% 43% 47%
Large Petrol - 12% 24% 26% 45% 48%
Small Diesel - 4% 12% 13% 24% 27%
Medium Diesel - 4% 12% 13% 24% 27%
Large Diesel - 4% 12% 13% 24% 27%
In 2015, full hybridisation adds around €2,000 to the cost of a car compared to a like-for-like ICE and delivers 22%-25% reductions in energy consumption per kilometre driven. The cost of a full hybrid falls to around €1,000 by 2030 and €750 by 2050. These costs are in line with the ICCT’s latest data, but are lower than the 2015 cost data from Ricardo-AEA which puts the cost of full hybridisation for a medium car at €2,500. The ICCT’s lower cost estimates for hybrids assume that ‘P2’ hybrids are introduced by OEMs. These systems have one electric motor and two clutches, and hence are cheaper than the Toyota power-split system which uses two electric motors and a planetary gear system. As noted by ICCT, the current hybrid market is dominated by Toyota, but the majority of other OEMs now offering full hybrids (Kia/Hyundai, VW Group, BMW, Nissan etc.) offer P2 solutions. Hence the costs assumptions in this study reflect the lower cost solution favoured by a greater number of OEMs, while recognising that the two systems (and variations within each) could continue to exist in the market place.
In the short term, the TECH scenario includes a rapid adoption of the lower cost 48-volt mild hybrid, which delivers around two-thirds of the efficiency improvement of a full hybrid for around one-third of the current cost.
In the long term in the TECH scenario, the relative efficiency gap between ICE’s and standard hybrids (non-plugin) closes because of ICE engine improvements that can only be considered as additional technologies applied to non-hybrid engines13. However, this is partially offset by improvement in the performance of hybrid engines which are expected to improve in line with the development of electric motor systems. The net effect is that the efficiency gap closes by 3 percentage points, so that new hybrids offer a 19-22% efficiency improvement relative to a new ICE from 2030.
13 As an example, hybrids include start-stop technology and so while it is possible to add start-stop to an ICE, it is not possible to add it to a hybrid as defined by this framework because it is already included
The impact of full hybridisation in the
TECH scenario
Low-carbon cars in Germany: technical report
23 Cambridge Econometrics
3.3 Battery costs
Table 3.3 shows the battery size assumptions for hybrid, plug-in hybrid and battery electric vehicles between 2020 and 2050. There is currently considerable uncertainty on future battery pack sizes, as these will depend both on future reductions in battery costs and OEM design choices to balance vehicle driving ranges against cost based on customer preferences. The battery electric vehicle market in particular is beginning the transition from first generation vehicles such as the Nissan Leaf and VW Golf with driving ranges of 150-200km to second generation models such as the Chevrolet Bolt and Tesla Model 3 and new entrants from German OEMs in the premium sector such as the Audi E-tron/Q8 and Porsche Mission E concepts. OEM statements suggest that medium size next generation BEVs will target driving ranges of 200 miles (320km) or more, while large vehicles will have longer ranges of 500km or more, similar to the Tesla Model S. In smaller segments, Renault indicated that it expects to double the range of the B-segment Zoe by 2018, with an implied battery pack size of around 45kWh.
Given the costs of increasing BEV driving ranges through additional battery capacity, it is expected that OEMs will offer multiple battery configurations to allow customers to make a trade-off between vehicle price and range. This is already seen in the new Nissan Leaf, where two battery size configurations are available, and in the BMW i3, where a new battery with a c.50% increase in driving range will be offered alongside the existing model range. To account for this, we assume ‘short range’ and ‘long range’ (standard) versions of BEVs in the modelling in the short term before battery costs fall to the point where the shorter-range option is no longer a likely mass market option.
Beyond 2020, we have used different assumptions for PHEVs and BEVs on changes in battery capacity. For PHEVs, we assume that OEMs maintain an electric driving range of c.50km, and decrease pack sizes over time as efficiency improvements lead to reductions in energy use per km. For BEVs, we assume that pack sizes are held constant, and vehicle driving ranges increase over time as improvements in battery energy density reduce pack weight (currently over 400kg for the 60kWh pack in the Chevrolet Bolt) and vehicle-level efficiency improvements reduce energy consumption per kilometre.
The battery sizes are intended to be representative, since in practice there are a wide range of options and specifications available to manufacturers, leading to a wide range of costs, performance and range.
Definitions

Low-carbon cars in Germany: technical report
24 Cambridge Econometrics
Table 3.3: Assumed battery sizes
Battery sizes (kWh)
Powertrain Market segment
2020 2030 2040 2050
HEV Small 0.86 0.69 0.53 0.43
HEV Medium 1.05 0.84 0.65 0.52
HEV Large 1.43 1.15 0.89 0.71
PHEV Small 7.00 6.30 5.60 4.90
PHEV Medium 10.00 9.00 8.00 7.00
PHEV Large 15.00 13.50 12.00 10.50
BEV – Short range
Small 21.00
BEV – Short range
Medium 28.00
BEV – Long range Small 45.00 45.00 45.00 45.00
BEV – Long range Medium 60.00 60.00 60.00 60.00
BEV – Long range Large 90.00 90.00 90.00 90.00
The primary influence on plug-in vehicle cost and performance is battery technology, since other components such as electric motors are already well developed and have more limited potential for future improvements. Battery cost projections are based on a recent Element Energy study for the European Climate Foundation and BEUC (the European Consumer Association). That study employed Element Energy’s component-level model of battery costs, which takes into account cell costs and performance developments over time, as well as packing costs such as thermal management, wiring harnesses, containers and the Battery Management System (BMS).
There are four key areas of battery technology where breakthroughs are needed:
• Reducing the cost
• Increasing the specific energy (to improve vehicle range/performance for a given battery weight or reduce weight for a given battery kWh capacity)
• Improving usable operational lifetime
• Reducing recharging time, for example allowing rapid charging at 150kW+ with no impact on battery state of health
In the short- to medium-term, lithium ion battery technology is expected to form the principal basis of batteries for use in full HEVs and more advanced plug-in vehicles (i.e. PHEVs, BEVs). Discussions with OEMs and cell suppliers have confirmed there is significant scope for innovation within lithium ion chemistries, such as increasing use of silicon in the anode, use of solid state electrolytes and improved packaging efficiency. In the medium-term, lithium-sulphur holds perhaps the most promise (up to five times the energy density
Costs and energy savings

Low-carbon cars in Germany: technical report
25 Cambridge Econometrics
of lithium ion) with lithium-air having greater potential (up to ten times lithium ion energy density), but these technologies are believed to be relevant only in 2030 and beyond.
Results from Element Energy’s latest battery cost model suggest strong reductions in battery costs between now and 2030, reaching a cost of €138 per kWh for a large (>60kWh) pack. This is based on materials and manufacturing costs plus a margin, and does not account for short term strategic pricing such as incurring losses in early deployments to build market share. These strategic pricing decisions could take place either at the OEMs or their suppliers, for example with cell manufacturers offering low prices to build market share and maximise throughput in new plants, or OEMs cross-subsidising zero emission models with profits from conventional vehicles,
Our baseline estimates are conservative and are higher than some more optimistic cost projections recently published. These include estimates from GM that the cost of the Chevrolet Bolt battery is $145 per kWh at the cell level (equivalent to €175 per kWh at a pack level assuming that packing costs add 33% to the cell cost)14. GM also published a roadmap for cell costs suggesting that a cell cost of $100 per kWh is expected by 2022. The most optimistic recent estimates suggest that battery packs from the Tesla Gigafactory could reach $125 per kWh by 2020 at a pack level ($88 per kWh cell cost plus $38 per kWh for packing costs)15. Tesla itself expects a 33% reduction in cost from the approximately $250 per kWh pack costs in the current Model S.
To test the impact of these more optimistic estimates, we used a sensitivity based on these recent cost estimates and targets. In this sensitivity, we assume that battery costs reach $150/kWh at a pack level by 2020, falling to $100/kWh by 2030. This is equivalent to achieving the 2030 baseline battery costs 10 years early, in 2020. Under this low-cost scenario, only long range BEVs are assumed to be sold since vehicles would be cost effective even with relatively large battery packs. The two cost scenarios are shown in Table 3.4 and Table 3.5.
The costs above refer to relatively high capacity batteries used in Battery Electric Vehicles. For PHEV, batteries cost more than BEV batteries, per kWh. This is because the power requirements place a proportionally larger demand on the smaller battery pack in a PHEV, so batteries with higher power are needed at a somewhat higher cost.
The costs presented in Table 3.4 and Table 3.5 refer to both the battery and the battery system (or pack), but not the electric drive powertrain (see Table 3.5. The costs are therefore lower per kWh for a large battery than a small battery. In addition, PHEV and HEV batteries cost more than BEV batteries on a per kWh basis. This is due to the use of different chemistries to allow high current draws from a comparatively small battery, and the fact that fixed battery costs (e.g. thermal management, BMS) are spread over fewer kilowatt-hours of capacity.
14 http://cleantechnica.com/2015/10/05/chevy-bolt-battery-cells-145kwh-new-chevy-volt-with-autonomous-driving/ 15http://www.streetinsider.com/Analyst+Comments/Jeffereis+Sees+1%2C000bps+of+GM+Tailwind+for+Tesla+%28TSLA%29%3B+PT+Up+to+%24365/10899606.html

Low-carbon cars in Germany: technical report
26 Cambridge Econometrics
Table 3.4: Battery system costs – baseline costs
Battery system costs (€/kWh)
Powertrain Market segment
2020 2030 2040 2050
HEV Small 490 326 256 222
HEV Medium 490 326 256 222
HEV Large 490 326 256 222
PHEV Small 411 278 227 185
PHEV Medium 411 278 227 185
PHEV Large 301 215 176 144
BEV – Short Small 264
BEV – Short Medium 235
BEV – Long Small 202 132 97 72
BEV – Long Medium 202 132 97 72
BEV – Long Large 202 132 97 72
Table 3.5: Battery costs - low cost scenario based on OEM announcements
Battery system costs (€/kWh)
Powertrain Market segment
2020 2030 2040 2050
HEV Small 490 326 256 222
HEV Medium 490 326 256 222
HEV Large 490 326 256 222
PHEV Small 411 278 227 185
PHEV Medium 411 278 227 185
PHEV Large 301 215 176 144
BEV – Long Small 132 88 72 72
BEV – Long Medium 132 88 72 72
BEV – Long Large 132 88 72 72

Low-carbon cars in Germany: technical report
27 Cambridge Econometrics
Table 3.6: Electric powertrain costs
Electric powertrain costs (€)
Powertrain Market segment
2020 2030 2040 2050
HEV Small 728 655 589 532
HEV Medium 890 800 720 650
HEV Large 1,214 1,091 982 886
PHEV Small 844 761 687 622
PHEV Medium 1,031 930 840 760
PHEV Large 1,406 1,268 1,145 1,036
BEV – Short range Small 844
BEV – Short range Medium 1,031
BEV Small 844 761 687 622
BEV Medium 1,031 930 840 760
BEV Large 1,406 1,268 1,145 1,036
The powertrain costs range by approximately a factor of two between the powertrain required for a small HEV and a large BEV. Overall, the total battery system and powertrain costs are show below for the total electric system and powertrain for each of the different market segments based on the derived battery size.

Low-carbon cars in Germany: technical report
28 Cambridge Econometrics
Table 3.7: Total cost of electric powertrain and battery
Total cost of electric powertrain and battery €
Powertrain Market segment
2020 2030 2040 2050
HEV Small 1,149 880 725 627
HEV Medium 1,405 1,074 886 765
HEV Large 1,915 1,466 1,210 1,044
PHEV Small 3,721 2,512 1,958 1,529
PHEV Medium 5,141 3,432 2,656 2,055
PHEV Large 5,921 4,171 3,257 2,548
BEV – Short range
Small 6,388
BEV – Short range
Medium 7,611
BEV – Long Small 10,384 7,151 5,907 4,897
BEV – Long Medium 13,151 8,850 7,260 6,040
BEV – Long Large 19,586 13,148 10,775 7,920
Note: The cost difference between BEV and PHEV will be smaller than the battery cost difference, since a BEV system entirely displaces an ICE, whereas a PHEV only allows for a smaller ICE engine to support it. An ICE has a cost of around €2,000 in the medium category. BEV costs are consistent with the stated ranges, but we should discuss the trade-off between ranges and costs.
Table 3.8: Total cost of electric powertrain and battery (OEM announcement cost assumptions)
Total cost of electric powertrain and battery €
Powertrain Market segment
2020 2030 2040 2050
BEV – Long Small 6,784 4,721 3,927 3,862
BEV – Long Medium 8,951 6,210 5,160 5,080
BEV – Long Large 13,286 9,188 7,625 7,516
Note: The cost difference between BEV and PHEV will be smaller than the battery cost difference, since a BEV system entirely displaces an ICE, whereas a PHEV only allows for a smaller ICE engine to support it. An ICE has a cost of around €2,000 in the medium category. BEV costs are consistent with the stated ranges, but we should discuss the trade-off between ranges and costs.

Low-carbon cars in Germany: technical report
29 Cambridge Econometrics
In line with Fuelling Europe’s Future and Element Energy (2012) and recent vehicle cost modelling for ECF and BEUC (2016), we apply State of Charge (SOC) assumptions (Table 3.9) to derive the useable energy of the battery. The expected range (Table 3.10) is then derived based on the test cycle efficiency of the vehicle (in all electric mode).
Table 3.9: Battery usable State of Charge (SOC)
Battery usable SOC for electric range (%)
Powertrain Market segment
2020 2030 2040 2050
PHEV Small 70% 72% 74% 75%
PHEV Medium 70% 72% 74% 75%
PHEV Large 70% 72% 74% 75%
BEV – Short range Small 85%
BEV – Short range Medium 85%
BEV – Long range Small 85% 90% 90% 90%
BEV – Long range Medium 85% 90% 90% 90%
BEV – Long range Large 85% 90% 90% 90%
Table 3.10: Vehicle range in all electric mode
All electric range (km – NEDC)
Powertrain Market segment
2020 2030 2040 2050
PHEV Small 42 44 46 46
PHEV Medium 49 51 53 54
PHEV Large 61 64 67 67
BEV – Short range Small 176
BEV – Short range Medium 223
BEV – Long range Small 377 378 397 414
BEV – Long range Medium 477 473 501 534
BEV – Long range Large 556 554 589 624
The values in Table 3.10 for 2020 reflect announced ranges of next generation models. For example, a Chevrolet Bolt or Tesla Model 3 with a range of 200 miles on the US EPA test cycle would have a range of 460-480km on the NEDC, since the NEDC gives an approximately 40-45% increase in range for a given vehicle16. Ranges continue to increase after 2020 due to improvements in
16 For example, the NEDC range for the Nissan Leaf 30kWh is 155 miles, compared with 107 on the EPA test.
Battery range

Low-carbon cars in Germany: technical report
30 Cambridge Econometrics
energy use per km (from light-weighting, improved ancillaries, aerodynamics etc.). PHEV ranges increase modestly beyond 2020 for the same reason, but it is assumed that the majority of reduced energy consumption is used to reduce the pack size and cost, since a range of 40-60km is considered sufficient for a large proportion of daily driving.
In 2020, we assume that EV sales are split evenly between the short range and long-range option. By 2030, the long range (large battery options) are much more cost effective than the short-range options and so at this point, we make the assumption that BEV sales are dominated entirely by the long-range option.
3.4 Power sector assumptions
The structure of the power sector and the renewable content of electricity generation has three important implications for the results of the study:
• it determines the net environmental impact of electrification of the vehicle fleet
• it determines the price of electricity that EV owners will be charged, which has implications for the Total Cost of Ownership (TCO) for an EV relative to a conventional ICE
• it could affect net electricity system costs negatively (distribution costs and additional power requirements) or positively (through synergies between EV and the power grid)
Our power sector projections are based on studies for the German government by EWI, GWS and Prognos (2014)17 and by Öko-Institut e.V.and Fraunhofer ISI (2014)18. In both studies, energy market projections for Germany are produced under a reference/trend scenario and a low-carbon ‘target’ scenario. The share of renewables in the power sector under each scenario is shown in Figure 3.2, below.
Figure 3.2 Share of renewables in the power sector
17 EWI, GWS and Prognos (2014), ‘Development of Energy Markets– Energy Reference Forecast’ 18 Öko-Institut e.V.and Fraunhofer ISI (2014), ‘Klimaschutzszenario 2050’
0%
10%
20%
30%
40%
50%
60%
70%
80%
90%
2010 2020 2030 2040 2050
%
Reference Scenario Target Scenario

Low-carbon cars in Germany: technical report
31 Cambridge Econometrics
We assume that the power sector has similar characteristics to the Target scenario so that maximum environmental benefits are realised from the transition to EVs. The key characteristics of the power sector in this study include:
• a reduction in the share of electricity generation from nuclear power plants with nuclear power completely phased out by 2030
• a reduction in electricity generation from fossil fuels (which together account for less than 20% of total generation in 2050, compared to around 50% today)
• these sources of generation are replaced by an increase in renewables, most notably an increase in wind generation
The power generation mix is shown in Figure 3.3.
Figure 3.3 Power generation mix (TWh) – Target Scenario
Due to the difficulty in charging different electricity prices to EV users and other final consumers, the price of electricity paid by vehicle users is assumed to be the same to the rate paid by households. In Germany, this is particularly high due to the expected additional taxes and levies added to the wholesale price.

Low-carbon cars in Germany: technical report
32 Cambridge Econometrics
Figure 3.4 Electricity price, 2014 prices (€cents/kWh)
0
5
10
15
20
25
30
35
2011 2020 2030 2050
cents
/kW
h
Households Light Industry Heavy Industry

Low-carbon cars in Germany: technical report
33 Cambridge Econometrics
4 Infrastructure requirements
This section describes the definition, costs and deployment of electric charging posts. It also provides a breakdown of our calculation for total charging infrastructure requirements. In the final subsection we look at the impact on infrastructure of a scenario for the future that is more dominated by FCEVs (TECH FCEV)
4.1 Definition and cost
Building on the definitions implemented in Fuelling Europe’s Future, and following comments from ABB and ERDF for the recent ECF-funded study ‘En Route pour un Transport Durable’ published in 2015, the definitions and costs for charging points for use in the German macroeconomic study are shown in Table 4.1. The table is intended to represent the range of charging archetypes available to end users to illustrate the characteristics and costs of charging posts. For example, each ‘archetype’ represents a typical option but in reality there will be a range of options in each market with variations in price and features. For the residential sector, the standard option is a wall box with a Type 2 connector and a charging capacity of 3.7kW (16 amp single phase) or 7.4kW (32 amp). This solution is often offered through OEM dealerships either with an OEM-branded charging point or through a partnership with an independent provider. For example, BMW offers the Wallbox Pure (3.7kW) and Wallbox Pro (7.4kW) solutions for the i3.
For residential sites with no access to a private driveway or garage, solutions are similar to a private domestic charge point with the addition of options for metering electricity and controlling access to authorised users. In the workplace we consider that two plug ground-mounted charging posts will prevail in the short term, but these could be replaced in the market by 11kW accelerated recharging posts in the medium term.
For public stations in public places such as on-street parking spaces, dedicated car parks and retail car parks, a rate of 11kW is assumed. This reflects the transition to 11KW on-board chargers observed among car OEMs. A 22kW rate is not relevant because the few EV model compatible with this rate are transitioning to a different solution (e.g. Renault Zoe going to a Combined Charging System).
For stations on motorways, a multi-standard AC/DC rapid recharging unit is proposed allowing for an 80% recharge in 20-30 minutes for a BEV with a c.25kWh pack . Future rapid charging power is likely to increase, given the agreement on a 150kW Combined Charging System (CCS) standard in late 2015. Higher powers are necessary to maintain acceptable charging times for vehicles with large batteries (above 50kWh), expected in 2nd generation BEVs. The CharIN initiative (launched in 2016 by BMW, Audi, VW, Porsche, Daimler, Ford, Mennekes, GM, Phoenix contact, TUV) is aiming at developing and establishing the CCS as the standard for charging battery-powered electric vehicles of all kinds. It envisages using CCS for rates up to 350 kW.

Low-carbon cars in Germany: technical report
34 Cambridge Econometrics
Table 4.1: Charging post definition and costs
Main application
Charging point features
Power (kW)
Charge time - 25kWh battery
(approx.)
Cost (€)
Production Installation
Residential - individual
Wall box (+ inductive pad in
future) One plug
User protection during charging
Options for metering
3 kW /7kW
4-8 hours 400 1000
Residential - collective
Wall box One plug
Choice of access control systems
3 kW /7kW
4-8 hours 800 2000
Workplace
Ground mounted Two plugs
Choice of access control systems
7 kW 4 hours 800 1000
Parking (on-street and shopping centres)
Ground mounted Two plugs
High resilience Different access
options
11 kW 2.5 hour 2,500 5,000
Stations on motorways
Rapid charging Three plugs
High resilience
50 kW DC Likely to
shift to 150kW by 2020 (and higher kW
after)
30 minutes (for 80% charge)
25,000 15,000
4.2 Deployment
For deployment, we assume that each EV sold has, on average, either a residential wall box or a workplace charging post in place. In addition, we assume that there will be two public charging posts in urban areas for every ten EVs on the road. These assumptions are in line with the approach developed and reviewed by industry players for the ECF France study of 2015.
For rapid charging, there are two elements to the required number of charging points. The first is the minimum geographic coverage needed to provide full mobility to EV drivers on long journeys. For reference, there are 12,645 km of autobahn in Germany, and with a spacing of 50km this implies that 506 rapid charging sites are needed. This does not account for sites needed on both sides of the autobahn (i.e. where it is not possible to access a site from both sides of the motorway). There are approximately 390 motorway service areas in Germany, and the SLAM project19 in 2014 aims to deploy 400 rapid charge points by 2017. In addition to motorways, there are approximately 40,000km of national roads, implying a need for approximately 800 sites at a spacing of 50km. This suggests that 1,200 sites (400 + 800)
19 http://www.slam-projekt.de/

Low-carbon cars in Germany: technical report
35 Cambridge Econometrics
would be required to cover all motorway service areas plus the national road network.
The second element to a rapid charge network is the ability to serve sufficient vehicles per day without unacceptably long queues. This implies that the number of charging points per site must increase with the parc of plug-in vehicles. This in turn depends on the proportion of kilometres driven by EVs that are supplied by ‘en-route’ chargers rather than charging at the trip origin or destination. Our previous analysis of EU driving statistics suggests that 80-90% of total EV energy use could be supplied by home or destination charging. Assuming that 15% of annual kilometres are supplied by rapid charging suggests an annual demand of 300kWh per vehicle per year (based on 15,000km per year and 0.2kWh/km in real world driving). A 50kW rapid charger could supply 1200kWh per day if 100% utilised, or c. 600 kWh if 50% utilised (allowing for lower traffic levels over night and less than full utilisation during the day). This implies that a single rapid charger could support the en-route charging needs of c.500 vehicles, and hence a large vehicle parc of 10 million battery electric vehicles would require 20,000 unique charge points (or approximately c.10-15 charging bays for each of the 1,200 sites on the motorway and major road network).
Changing the power of rapid chargers to 150kW may not have a large impact on the number of vehicles that can be supported by each charging point in the short term, because existing BEVs will not support the higher power and new vehicles are likely to have significantly larger batteries (e.g. 60kWh plus) that offsets any potential reduction in charging time. For this reason, the analysis does not differentiate 50kW and 150kW posts. However, even higher powers of 350kW are likely to significantly decrease charging times as battery pack sizes are unlikely to continue to grow rapidly beyond 60kWh (or 80kW-100kW in larger vehicles). This means that 350kW chargers could potentially support larger numbers of vehicles, and hence fewer of them are required for a given EV parc, but the reduced number of sites is likely to be offset by the increased cost of the chargers and related grid connection costs. Finally, a shift towards larger batteries and longer driving ranges between charges will make BEVs viable for longer range duty cycles, but could reduce proportion of annual energy use supplied by rapid chargers if the ranges were sufficient to allow long trips to be completed with charging before and after the journey. This trend is likely to be stronger if the prices of delivered energy from rapid chargers are higher than domestic or destination charging. The combination of very high-power charging in future and relatively high range BEVs mean that the estimated infrastructure numbers below are likely to over-estimate rather than under-estimate the numbers needed to support a given fleet of BEVs.
We have assumed that after an initial deployment of 1000 motorway/major road rapid charge points before 2020, the number of rapid charge points is in proportion to the number of BEVs in the parc, with a ratio of 500 BEVs per charging point. This number is subject to significant uncertainty. There is also debate about whether rapid chargers will be used exclusively for long journeys, or whether they will provide a substantial fraction of a vehicle’s

Low-carbon cars in Germany: technical report
36 Cambridge Econometrics
annual energy demand during local trips, and even allowing people without access to dedicated home charging spaces to own an EV.
Given the uncertainty around future infrastructure deployment, we have tested a variant of each scenario where infrastructure investments are not included. This sensitivity analysis can be used to infer then impact of varying degrees of infrastructure spend on the macroeconomic results.
Table 4.2: EV charging post deployment
2020 2030 2040 2050
Charging posts per EV (PHEV +BEV)
Residential 0.7 0.6 0.6 0.6
Workplace 0.2 0.2 0.2 0.2
Parking 0.2 0.2 0.2 0.2
BEVs per rapid charging post Fixed number of charging
points required for geographic
coverage
500 500 500
4.3 Calculating total charging infrastructure requirements
The total number of residential, workplace and public slow charging posts required each year is calculated by multiplying the total number of EVs (PHEVs +BEVs) in the stock by the density assumptions outlined in Table 4.2. For rapid charging infrastructure, we assume deployment grows in line with the BEV fleet. The number of charging points (plugs) is then calculated based on our assumptions about the number of plugs on each post (see Table 4.1).
From the total infrastructure requirements, we calculate the net additional charging posts installed each year and add to this replacement of charging posts that are retiring from the stock.
The additional charging requirements in each year are then multiplied by the cost per post in that year. To project changes in charging infrastructure costs out to 2050, we apply a 10% learning rate (ie a 10% cost reduction for each doubling of cumulative charging capacity.
Appendix B shows the key steps in our calculations to derive the total number of charging posts (and plugs) in each scenario, and the total investment requirements.

Low-carbon cars in Germany: technical report
37 Cambridge Econometrics
4.4 The impact of FCEV deployment on infrastructure requirements
The TECH FCEV scenario was developed to look at the impact on infrastructure requirements, as well as the wider economic impacts of a fuel cell dominated future.
If FCEVs were to dominate the market, this would be likely to only happen after 2030, as the technology is still relatively nascent and expensive. However, the opportunity for FCEVs would be to reduce the substantial requirements for charging plugs (see Figure 4.1).
Figure 4.1 Investment requirements in charging infrastructure
However, there would need to be significant investment in hydrogen refuelling stations, production facilities for green hydrogen and a distribution network (whether pipelines, or trucks). The overall economic impacts of the TECH FCEV include these investments and are reported in section 8.

Low-carbon cars in Germany: technical report
38 Cambridge Econometrics
5 Consumers’ Perspective
5.1 Vehicle costs
The capital cost of each vehicle in the model is derived by combining projections of the powertrain and glider cost (by market segment) with estimates of the cost of fuel-efficient technologies installed in the car (including low-rolling resistance tyres, aerodynamic improvements, weight reductions).
Margins, distribution costs and VAT are added to the vehicle production costs in order to derive the retail price. In 2030 it is assumed that, in monetary terms, the additional retail and distribution costs for ICEs, EVs, PHEVs and FCEVs are broadly equivalent.
VAT is added at 19% and is charged on consumer sales of all vehicle types over the period to 2050. As VAT is applied as a percentage of the final sale price, the VAT component for (relatively expensive) BEVs, PHEVs and FCEVs is higher than that for conventional petrol and diesel cars.
We assume that car owners would pay for the capital cost of a car over its lifetime (13 years, on average) in monthly instalments with a 3.5% interest rate (other rates of interest are assessed). The retail price of new vehicles in the TECH scenario is shown in the Figure 5.1 Capital and financing cost of a new medium sized vehicle in the TECH scenario.
Figure 5.1 Capital and financing cost of a new medium sized vehicle in the TECH scenario
Note(s): High and low sensitivities reflect high/low assumptions on, borrowing costs and technology
costs and battery costs.

Low-carbon cars in Germany: technical report
39 Cambridge Econometrics
The cost of technologies to reduce CO2 from cars will reduce over time as scale economies are achieved, but the aggregate costs will increase as more technologies are added to reach tighter CO2 limits. In 2020, battery-electric and fuel-cell electric vehicles are projected to be significantly more expensive than diesel and gasoline vehicles and their hybrid variants. But by 2030, the difference in price will be narrowed, as the cost of diesel and petrol cars increase to meet environmental goals and as zero-emissions cars get cheaper as they start being manufactured at scale. In the German context, there is a convergence in costs in our central case, but not complete parity by 2030.
However, we can see from error bars that the assumptions around financing (interest rate of 1.5% and 8% in the low and high case respectively) and technology costs can make a considerable impact on the lifetime capital cost. Although the trend of narrowing costs persists. In the case of BEVs, we see that low battery costs based on OEM announcements bring the costs much closer to ICEs.
5.2 Fuel costs
One feature of the TECH scenario is a substantial improvement to the efficiency of conventional ICEs, leading to fuel bill savings for owners of petrol and diesel cars. In addition, the transition towards an increase in the share of PHEVs, BEVs and FCEVs has implications for fuel bills in the TECH scenario due to the differences in the costs of these alternative fuels, as well as the improvements in the efficiency of energy conversion in an electric powertrain relative to a conventional ICE.
The oil price projections used for this analysis are taken from IEA’s November 2016 World Energy Outlook and the cost of petrol and diesel production is assumed to grow in line with these oil prices over the period to 2050.
Figure 5.2 Fuel price assumptions (2014 prices)
0
50
100
150
200
250
300
350
2010 2015 2020 2025 2030 2035 2040 2045 2050
€/MWh
Petrol Diesel Electricity

Low-carbon cars in Germany: technical report
40 Cambridge Econometrics
As PHEVs, EVs and FCEVs, become more prevalent in the vehicle mix, assumptions about the price of electricity becomes more important. The electricity price is calculated based on the residential electricity price in the 2014 German Government target scenario. Electricity prices are expected to remain high due to the surcharge paid for renewables feed-in-tariff. Over the period to 2050, it is expected that the surcharge will be reduced which will more than offset increases in the wholesale energy prices leading to a small reduction over time.
In the TECH scenario, we see a reduction in annual fuel costs across all vehicles though improved fuel efficiency. Savings vary substantially for vehicles for different powertrain types. In 2015, a new medium ICE in the German fleet would cost €1,290 to run. In the TECH scenario, efficiency improvements mean that the average annual cost of fuel for a new ICE is nearly €400 less by 2030 and around €550 less for a new HEV (see Figure 5.3).
Despite falling residential electricity prices in real terms, Germany is still expected to have electricity prices well above the EU average. In 2015, residential prices were 40% higher than the EU average20 predominately due to higher taxes and levies to support renewable electricity deployment. This presents a challenge to the consumer benefits of PHEVs and BEVs as the potential value of fuel savings are reduced. Figure 5.3 shows that to 2030, the fuel cost savings of HEV and PHEV converge and are comparable, even though fuel consumption by a PHEV is substantially lower, because of the relatively high cost of electricity. To demonstrate the impact of high electricity prices, in Figure 5.3 we show the fuel cost if electricity prices were in line the EU average, and see that PHEVs and BEVs would have a considerable fuel saving over ICE powertrains.
Figure 5.3 New vehicle annual fuel bill saving compared to average new 2015 ICE
20 Eurostat data series nrg_pc_204 Electricity prices for domestic consumers - bi-annual data), band DB
Low-carbon cars in Germany: technical report
41 Cambridge Econometrics
However, the price of electricity for charging electric vehicles is unlikely to deviate from the price faced by residential consumers, as the majority of charging is expected to take place at home. Although, there may be scope to lower electricity prices for passenger cars through smart charging by taking advantage of off-peak price tariffs (see Section 7).
5.3 Total cost of ownership (TCO)
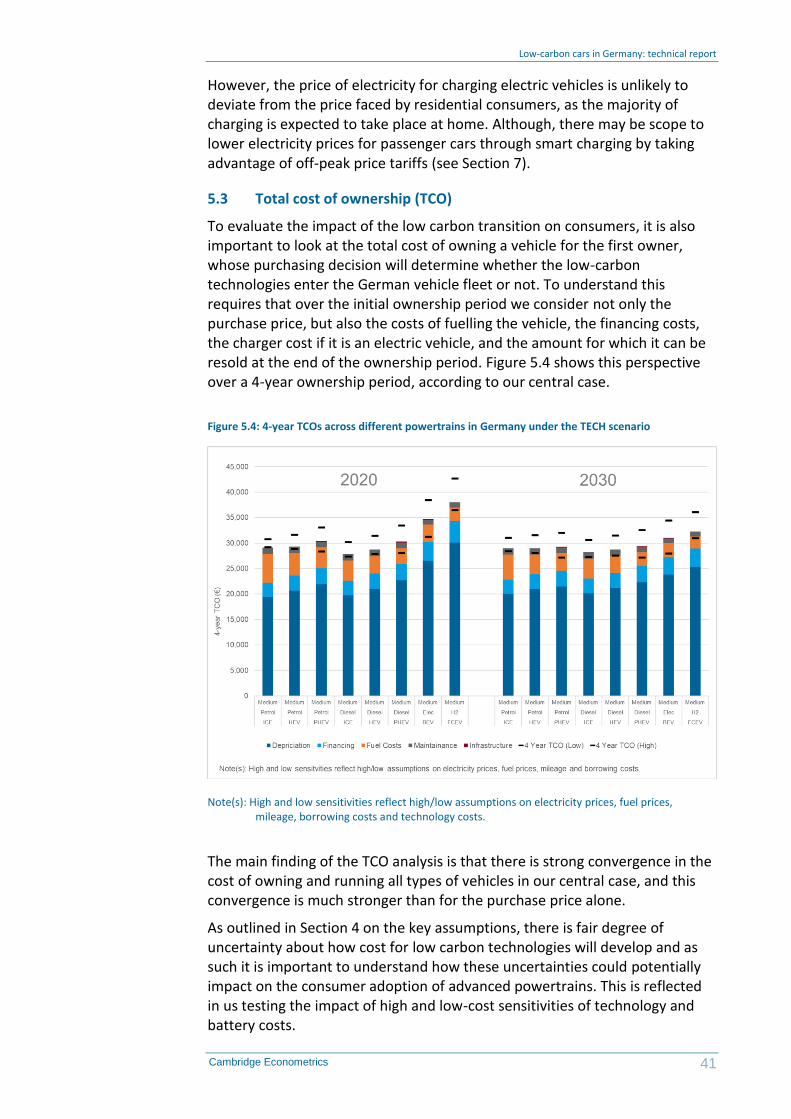
To evaluate the impact of the low carbon transition on consumers, it is also important to look at the total cost of owning a vehicle for the first owner, whose purchasing decision will determine whether the low-carbon technologies enter the German vehicle fleet or not. To understand this requires that over the initial ownership period we consider not only the purchase price, but also the costs of fuelling the vehicle, the financing costs, the charger cost if it is an electric vehicle, and the amount for which it can be resold at the end of the ownership period. Figure 5.4 shows this perspective over a 4-year ownership period, according to our central case.
Figure 5.4: 4-year TCOs across different powertrains in Germany under the TECH scenario
Note(s): High and low sensitivities reflect high/low assumptions on electricity prices, fuel prices,
mileage, borrowing costs and technology costs.
The main finding of the TCO analysis is that there is strong convergence in the cost of owning and running all types of vehicles in our central case, and this convergence is much stronger than for the purchase price alone.
As outlined in Section 4 on the key assumptions, there is fair degree of uncertainty about how cost for low carbon technologies will develop and as such it is important to understand how these uncertainties could potentially impact on the consumer adoption of advanced powertrains. This is reflected in us testing the impact of high and low-cost sensitivities of technology and battery costs.
Low-carbon cars in Germany: technical report
42 Cambridge Econometrics
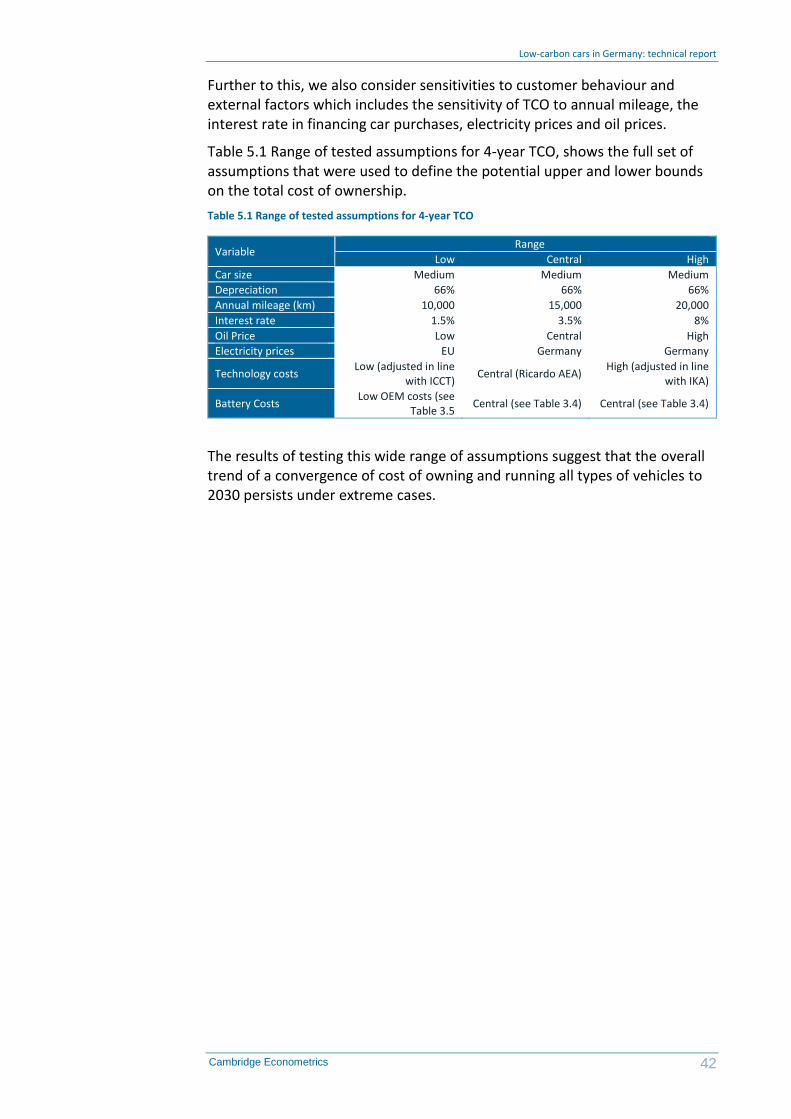
Further to this, we also consider sensitivities to customer behaviour and external factors which includes the sensitivity of TCO to annual mileage, the interest rate in financing car purchases, electricity prices and oil prices.
Table 5.1 Range of tested assumptions for 4-year TCO, shows the full set of assumptions that were used to define the potential upper and lower bounds on the total cost of ownership.
Table 5.1 Range of tested assumptions for 4-year TCO
Variable Range
Low Central High
Car size Medium Medium Medium
Depreciation 66% 66% 66%
Annual mileage (km) 10,000 15,000 20,000
Interest rate 1.5% 3.5% 8%
Oil Price Low Central High
Electricity prices EU Germany Germany
Technology costs Low (adjusted in line
with ICCT) Central (Ricardo AEA)
High (adjusted in line with IKA)
Battery Costs Low OEM costs (see
Table 3.5 Central (see Table 3.4) Central (see Table 3.4)
The results of testing this wide range of assumptions suggest that the overall trend of a convergence of cost of owning and running all types of vehicles to 2030 persists under extreme cases.

Low-carbon cars in Germany: technical report
43 Cambridge Econometrics
6 Value Chains
The extent to which Germany could benefit from the transition to low-carbon mobility is crucially dependent on the characteristics and location of the supply chain for low-carbon technologies, such as lightweight materials and batteries. This section summarises the pertinent parts of M-Five’s analysis and literature review of the structure of these supply chains and the potential of the Germany to capture a share of them.
6.1 Lightweight materials
Lightweight materials are expected to be an increasingly important part of a transition to a low-carbon mobility. Future car structures will have to be much lighter to compensate for the heavier drive trains in hybrid and fully electric vehicles. There will likely be multi-material designs, with aluminium, high strength steel, plastics, and carbon-fibre reinforced plastics, all likely to play a role. The Energiewende will ensure low-carbon electricity in Germany, which in future will help minimize the carbon footprint of lightweight materials. All these materials have a history of production in Germany that is expected to continue.
As a result, in the economic modelling presented in section 8 we have not made any specific assumptions to assess the risks and opportunities of more or less of the lightweight materials value chain being located in Germany. Instead we assume that the proportion of domestically produced supply and imports remains broadly at historical levels.
6.2 Batteries
Powertrain, engine and ancillary components together account for about 26% of the value added of a compact car. These components are largely manufactured by the OEMs which, under their current business models, are at risk of losing a substantial share of value added and employment opportunities that they offer under a transition to electric vehicles.
Lithium-based batteries are, and will, be traded on the world market and at least three Asian manufacturers from Japan and Korea will compete on this market. It is expected that this competition will bring down the cost of battery cells and it may be that the technological advancement of these manufacturers could not be easily caught up by a late market entrant. However, the German National Platform for Electric Mobility (NPE) estimate that, by 2021, supply will fall short of sharply increasing demand for lithium-based cells, opening up a window of opportunity to establish at least one additional battery cell manufacturer in Germany.
This section describes the manufacturing of EV batteries, the value-chain of the batteries and the potential criteria of selecting a manufacturing site. Scenarios for German shares of the battery value-chain in the future are also discussed.
Since electrification is a key element of the studies scenarios and the lithium-based batteries have been identified as the most viable solution, the following
Will the reduced investment in the manufacturing of
conventional ICEs be
compensated for by investment in
battery cell production in
Germany?

Low-carbon cars in Germany: technical report
44 Cambridge Econometrics
sections provide a deeper analysis of Li-Ion battery manufacturing and their value-chains only.
There are many roadmaps showing how the lithium-based battery technology could develop (e.g. Thielmann et al. 2012, Thielmann et al. 2015a, b). Discussions of developments of lithium-based batteries concern the structure and the materials of the cathode, the anode, the electrolyte, the separator, the geometric form of the cells and their production processes.
The battery system consists of the battery pack, the temperature control and the battery management system. The battery pack in turn consists of several battery modules consisting themselves of single cells. These cells are connected in rows or in parallel. The battery requires a cooling concept that can be based on air or liquid. The battery management regulates the voltage, currents, temperatures and state of charge of the single cells and recognizes and avoids errors (Propfe et al., 2011). Further components exist for the mechanic, electric and electronic linking and for communication. Different cell types require different characteristics of the system, concerning cooling and packaging for example (emobil BW GmbH, 2015).
The market for electric vehicle batteries is expected to triple by 2020 and to grow by a factor of 10 to 30 by 2030. This could lead to a five or ten-fold reduction in battery costs by 2030, compared to costs in 2015. Although the precise development of the battery market is uncertain, the value-added potential of the battery cells over this period is expected to decrease significantly due to economies of scale and learning effects.
At the same time, the share of material costs for the production of the components in comparison to the pure cell production will increase. A comprehensive battery and electrification strategy has to include technical change through research and development, production, recycling etc. These have to be analyzed in their reciprocal technical, economic and chronological dependency. Due to the importance of various raw materials the strategy would have to be accompanied by a sound raw material strategy considering also to attain long-term independence from singular technical solutions and materials (Thielmann et al., 2015). The framework conditions of the production of lithium-ion batteries consist of the raw material criticality, the material efficiency (recyclability), the life cycle energy demand and the technological synergies (Thielmann et al., 2015):
• Raw material criticality: the significant share of cobalt in the battery costs is supposed to go back in favour of Nickel in the short term (before 2020). In the longer term, rare earths could become critical for electric engines.
• Material efficiency and recyclability: pilot plants for the recycling of cobalt and nickel are already being tested. In order to foster the development of cobalt, nickel, copper and aluminum, the battery design will soon have to be adapted on the battery system level. In the longer term (2020), the battery design will have to be adapted for recycling purposes and further materials will have to be recycled in order to reduce material costs.
• Life cycle energy demand: the energy need and bad environmental balance of the production of Cobalt and Graphite are critical already and will remain critical in the long run.
Technology and production of Li-Ion
batteries

Low-carbon cars in Germany: technical report
45 Cambridge Econometrics
• Technological synergies: technology platforms for lithium-ion batteries are already active in several locations in Germany (e.g. Kompetenznetzwerk Lithium Ionen Batterien (KLIB), Innovationsallianz "Lithium Ionen Batterie LIB2015").
There are different options to describe the value chain of the LIB. Figure 4 depicts the lithium-ion battery supply chain using the value-chain of a best-in-class technology for a PHEV battery of 2014. Raw materials (e.g. lithium, cobalt, phosphorite, etc.) and processed materials (e.g. sheets of the materials) account for 29% of the total value-added of the battery, which was estimated at 571 US$/kWh. 5% account for the manufacturing of the electrodes. Value-added of cell manufacturing amounts to 26% and of producing the battery pack including the intermediate step of producing modules to 40% (Chung et al. 2015).
Source: Chung et al. 2015
The different steps of the lithium-ion battery value chain can be spatially organized in a different approach. Due to substantial cost of shipping heavy battery packs and to the close interaction required for the design and integration of the battery packs into the vehicles it is widely expected that the pack production will be located close to the OEM. High quality electrodes require that no contaminations and moisture affect the materials. Therefore, long transport distances and times should be avoided for electrodes such that regional production with shorter transport distances is recommended. For raw materials, processed materials and cells such transport issues do not emerge. For these three components global distribution from centralized production facilities with high output are feasible and economical. Nevertheless, as batteries or their components constitute a costly good also the cost of capital should not be neglected that matters in case of long travel times when shipping the components from one manufacturing site to another.
Due to these characteristics of production and distribution of lithium-ion batteries the value-chain can be differently split between OEMs and their suppliers. In 2013/2014, all OEMs remained responsible for vehicle integration of the batteries. But for instance, BMW split the chain between cells and
Value chain of Li-Ion battery
manufacturing
Figure 6.1: Aggregate structure of a lithium-ion battery value chain in 2014

Low-carbon cars in Germany: technical report
46 Cambridge Econometrics
modules receiving their cells from Samsung SDI and producing modules and pack by themselves. The same approach was applied by Chrysler with LG Chem as supplier for the Chevy Volt and the VW group with Sanyo as supplier. Toyota and Nissan both established a Joint Venture with a battery manufacturer that provided them with packs, while Daimler had established two daughter companies to produce the cells (Li-Tec) and to produce modules and packs (Deutsche Accumotive). BYD was the only manufacturer that captured the full value-chain of the batteries in their vehicles.
A closer look at the value structure of the different components for a BEV battery of 48 kWh reveals that the cathode is the most expensive component making up about 14% of the battery price in 2010, or even 20% of the battery production cost. The total share of the cell is 45% of the battery price and 66% of the cost estimated by Hettesheimer et al. (2013) for 2010, which is roughly the share indicated by Chung et al. 2015 for 2014. However, for the future years the expectations differ. While Hettesheimer et al. (2013) assume an increase of the value share of the cell on the total battery other authors expect the strongest future cost decreases for the cell manufacturing, which then would reduce the share of the cell cost on the total battery cost.
However, because of the expected falls in cost, existing plants producing lithium-ion batteries with previous technologies are facing a substantial risk of not being able to reach the necessary sales volumes to recover their investment cost as demand will shift fast to the new cell compositions. Such examples could enfold impacts in two directions. Either it discourages further investments in cell manufacturing given the daunting example of these sunk cost, or it encourages new investments possibly even by new entrants as it becomes apparent that with choosing the right battery technology leap-frogging the incumbents will be possible in the cell market.
Source: Hackmann/Stanek 2016
Figure 6.2: Battery cost evolution

Low-carbon cars in Germany: technical report
47 Cambridge Econometrics
Given that the cell manufacturing plays an important role in the lithium-ion value chain the locations where lithium-ion battery manufacturing takes place are relevant. As Figure 6.3 reveals the largest existing manufacturing sites exist in China, Korea and Japan in this order, while the US and Europe lag behind. Also in terms of planned extensions as of 2015 mainly China and the US (in particular Tesla Gigafactory) reveal plans to extend their capacities, which is not surprising as the market in 2015 was facing large overcapacity. It should also be noted that most recently further plans for new capacity were announced including capacities to be established in Europe.
Figure 6.3: Location of lithium-ion cell manufacturing
Source: Chung et al. 2015
Following the description of current lithium-ion battery value chains, expected future cost developments and the locations of global cell production as of today we take a closer look at the potentials to locate battery, modules and cell manufacturing in Germany.
Starting with financial and economic crisis of 2008 and the appearance of the Tesla Roadster on the market, electric mobility became a hype topic in Germany, including that through the economic stimulus program substantial funds to develop knowledge and technologies for electric mobility have been made available by the government. This included also alliances and networks cooperating on the lithium ion battery technology. Figure 8 provides an overview of stakeholders that have joined forces in the KLIB network and that could cover specific steps of the value-chain. This overview is not exhaustive as there exist further alliances in Germany, but it demonstrates that competencies for all relevant production steps of lithium-ion cells and batteries would be available in Germany.
Lithium-ion battery value-chain in
Germany

Low-carbon cars in Germany: technical report
48 Cambridge Econometrics
Figure 6.4: Research and industry stakeholders of production of lithium-ion batteries
Source: M-FIVE representation after Kompetenznetzwerk Lithium Ionen Batterien - KLIB
The Chair of Production Engineering of E-Mobility Components at the University of Aachen maintains a database of lithium-ion battery cell production sites in Germany as well as of sites that produce battery modules and packs. For 2015 they report eight pilot cell manufacturing sites operated by research organisations and nine industrial cell manufacturing sites, though it should be noted that all of them produce small batch series, only, and are not capable to go into mass production. The number of module and pack manufacturing sites in Germany is reported to be substantially larger (VDMA 2015).
The association of the German machinery manufacturers put forward an argument that though the German machinery manufacturers have been successful to equip some of the global cell manufacturing plants with their machines, it will be important that the machinery manufacturers demonstrate at their home base that they equip mass production sites with their machines. VDMA also concludes that given the competencies of the German industry it will also be feasible to build-up a lithium-ion battery cell manufacturing in Germany (VDMA 2015). VDMA obviously sees the risk that Germany would lose the key competence of providing battery manufacturing machinery, which in fact provides for a strong argument in favour of establishing a mass production in Germany as the machinery sector is even more relevant for the German industry then the automotive sector. Losing a key competence in a large future market of the machinery sector would in fact disadvantage the German economy in the future.
While it is demonstrated that battery module and pack manufacturing can be successfully located in Germany it has been questioned if this also would hold for large scale cell manufacturing. This section briefly discusses the criteria, which influence location decisions for new cell factories. The literature lists a number of such criteria which either have been identified to assess the viability of implementing a battery cell factory in the US or in Germany (e.g. Chung et al. 2015, NPE 2016):
Criteria for selecting a
battery cell manufacturing
site

Low-carbon cars in Germany: technical report
49 Cambridge Econometrics
• access to raw materials (graphite, lithium, cobalt, nickel, manganese)
• proximity to machinery suppliers
• existing clusters of battery and materials manufacturers
• protection of intellectual property, including process innovations
• energy cost and environmental legislation
• logistical risks and proximity to end-markets
• supply chain optimization e.g. degree of vertical integration
• access to talented workforce, especially in R&D
• labour cost of R&D staff and of skilled factory staff
• competitive edge of incumbents
• discounts provided to regional customers or members of the regional cluster but not to foreign customers
• opportunity to generate lead markets or at least export markets
• policy and regulatory context
• ease-of-doing-business-considerations
• brand and reputation
A few of these criteria could be prohibitive for building a battery cell plant if these would hold for Germany. For example, if there was no access to raw materials or a lack of skilled labour. However, we do not see this as the case for Germany which has developed both a raw materials strategy and an education and research strategy for electric mobility over the past years.
The other decisive question concerns the competitive edge that Asian incumbents have achieved. For today’s advanced generation of lithium-ion battery cells the incumbents have too large an advantage that cannot be caught up by new cell manufacturing established in Germany. However, technological development is moving fast and third or fourth generations of lithium ion battery cells still also need to be commercialized at large scale by Asian manufacturers. For these future technologies there is a considerable possibility that these technologies are manufactured by new market entrants.
The German NPE has made an attempt to integrate many of these criteria into an assessment framework and to evaluate the position of building a LIB cell manufacturing in Germany against globally competing locations in Asia, in the US and in Europe. Figure 9 presents the outcome of this assessment. Under certain assumptions (exemption from the renewable energy surcharge on electricity) a production in East-Germany, an area with low labour costs, will be as competitive as the other leading regions in the future, which are expected to be Korea, Poland and the USA, while China and Japan are expected to be less competitive locations. Particular German advantages are considered with respect to logistics, transparency, innovation system and stability. The result was even achieved with putting a rather high weight on the influence of subsidies (15%), which play an important role in Korea and China.

Low-carbon cars in Germany: technical report
50 Cambridge Econometrics
Figure 6.5: NPE assessment of potential locations for future LIB cell manufacturing plants
5 = best performer, 1 = worst performer Source: NPE 2016
The NPE analysis thus supports our conclusion that Germany would constitute a potential location for cell manufacturing. The NPE identified no obstacles for establishing lithium-based battery manufacturing in Germany that could not be overcome. Of course, a joint effort of German stakeholders will be needed to invest into R&D and the manufacturing plants to turn a large-scale German cell and battery manufacturing into reality.
Chung et al. (2015) did a similar assessment than the NPE for the US and Mexico against the Asian manufacturing locations, but excluding any European location. They conclude that future US plants will be competitive with Asia (better than Japan, equal to Korea, indifferent to China). The most competitive location would be Mexico due to the lower labour costs. Given the high automation of battery manufacturing this seems to put too much weight on the cost of labour. Nevertheless, it indicates that when considering competition of a potential new battery cell plant in Germany also the option of potential new entrants from outside the US and Asia should be considered.
In the economic modelling, described in Section 8, we therefore explore the wider economic impact of cell manufacturing taking place in Germany. First in the main TECH scenario we consider the impact of between zero and a hundred per cent of battery cell manufacturing taking place in Germany. We also examine this for the TECH RAPID scenario, because under this scenario the risk (and opportunity) of securing the cell manufacturing is much greater because there are far more battery electric vehicles being produced and sold.

Low-carbon cars in Germany: technical report
51 Cambridge Econometrics
7 Synergies between EVs and the electricity grid
This section sets out the results of Element Energy’s assessment of synergies between EVs and the electricity system, the potential value of grid services to EVs and the potential impact on distribution networks.
The analysis carried out for this study was developed through a combination of literature review, techno-economic modelling of ancillary services provision and impacts on the distribution network, and electricity generation modelling. The analysis is based on the EV deployment in the TECH scenario, which is defined by:
• Meeting 95 gCO2 per km target in 2021
• Ambitious deployment of fuel-efficient technologies in all new vehicles over the period to 2050 (e.g. light-weighting)
• Ambitious deployment of advanced powertrains (BEVs and FCEVs) in the period to 2050
The analysis shows that large uptake of EVs would adversely impact the electricity system, if charging is un-managed/passive. If EV owners charge on arrival at home or at work (passive charging), this would significantly increase evening electricity peak demand, resulting in increased network and generation capacity requirements, as well as high electricity production costs to meet the additional EV charging demand. On the other hand, smart charging strategies could largely avoid these impacts and in addition enable EVs to deliver balancing services to the system, providing revenues to EV owners.
Figure 7.1: Comparing passive and smart charging

Low-carbon cars in Germany: technical report
52 Cambridge Econometrics
The level of EV deployment in the TECH scenario is 5.7m EVs in 2030 and 25.4m EVs in 2050. With passive charging, there is an increase in peak demand of 5.5 GW in 2030 and 21 GW in 2050, which is significant compared to a typical system peak demand of approximately 65 GW with no EV charging.
By using smart charging strategies to shift EV charging demand away from peak periods to periods of low system demand, the challenges posed on the electricity system by EVs, can be largely mitigated. Smart charging can largely mitigate any increase in peak demand in 2030. By 2050, instead of an increase in peak demand by 21GW, smart charging can limit this to just 3GW.
Though there are costs to implementing smart charging, the potential benefits are much greater. Smart charging results in a net benefit across the EV fleet of €140m per year for smart charging in 2030, compared to a net system cost of €350m per year system for passive charging.
Smart charging mitigates, to a large extent, the costs of distribution network reinforcements and additional generation capacity, provides additional revenue streams for EVs by providing ancillary services, and reduces electricity production costs. These potential benefits are larger than the costs of implementing smart charging, which consist of additional hardware, communications and telemetry infrastructure and operation.
By 2050 the net benefit across the EV fleet could amount to €110m per year, compared to an EV system cost of €1,350 million per year for passive charging. For passive charging, the network reinforcement requirements and generation capacity requirements increases by a factor of four going from 2030 to 2050 due to the increase in EVs.
Based on current commercial arrangements, EVs have the potential to provide a large fraction of German ancillary service requirements from 2030 onwards.
Figure 7.2: The impact of smart charging in 2030 and 2050

Low-carbon cars in Germany: technical report
53 Cambridge Econometrics
Figure 7.3: The role for EVs in providing grid services
With increasing EV uptake, EVs can provide a large proportion of ancillary service requirements in Germany through managing unidirectional charging. By 2050, the 25m EVs in Germany, representing roughly half the German car fleet, can provide over 60% of requirements for all services.
The smart charging benefits per EV would amount to €100 per year in 2030 and €80 per year by 2050.
The revenue from ancillary services per EV reduces from €99 per EV, per year in 2030; to €81 per EV per year by 2050, because the increasing number of EVs saturate the service requirements and average charging demand per EV decreases.
The electricity generation savings from smart charging reduces from €27 per EV per year in 2030 to €20 per EV per year, because of a reduction in EV charging demand and increasing efficiency of the remaining thermal generation.
While the opportunity for smart charging EVs is large, with a significant potential overall benefit, the revenue per EV is relatively low (less than €100 per vehicle). This presents a key challenge in developing this opportunity, as
Figure 7.4: Smart charging benefits (per EV, per year)

Low-carbon cars in Germany: technical report
54 Cambridge Econometrics
efficient commercial models are needed to incentivise participation by EV owners. Access to balancing services and the ability to combine the provision of multiple services to different actors are therefore key aspects in maximising the benefit available at an individual EV level. Developing these services moreover requires installation of charge points/onboard charging systems that support the required control and communication signals, as well as development of the telemetry and communication platforms (such as between aggregators and EV charge points).
EVs capable of bi-directional service provision can provide a greater amount of ancillary services per EV. Revenues from ancillary services for a 7 kW bidirectional charger could be €970 per EV per annum by 2030, compared to €386 per EV per annum for a 3 kW charger.
Figure 7.5: The costs and opportunities for bi-directional charging
The potential revenues for vehicle to grid enabled EVs are significantly higher than in the base unidirectional charging case. This is because they are able to offer their full charge capacity for the duration of their available charge window, subject to the constraint of being fully charged at departure time. There are however also additional costs compared to unidirectional managed charging, including hardware costs to enable bi-directional charging and ongoing operational costs due to battery round trip efficiency losses and increased battery degradation. Widespread deployment of 7kW EV charging/discharging is beyond the capacity of most Distribution Grids which are designed for residential loads (which are much lower after diversity is taken into account).
The economic value of the opportunities provided by smart charging are not included in the central economic analysis presented in Section 8.

Low-carbon cars in Germany: technical report
55 Cambridge Econometrics
8 Economic impacts
The economic impact of decarbonising Germany’s passenger vehicles, compared to a reference case (REF) in which cars remain unchanged from today, was modelled using E3ME21.
Whilst, in isolation, the increasing cost of vehicles has a negative impact on the consumers and the economy, leading to price inflation and putting downward pressure on real incomes and spending, it also diverts spending towards the value chain for manufacturing vehicles and their component parts and away from all other sectors of the economy. Since the vehicles supply chain is by German suppliers than consumer goods on average, the negative impact of price inflation is partially offset by improvements to the balance of trade.
However, better fuel-efficiency lowers the cost of living, with positive consequences for the economy, and diverts spending away from oil supply chains and towards other areas of the economy. Since oil is imported to Germany, the positive impact on the economy of lower spending on fuel is further improved by an improvement in the balance of trade. A summary of the main economic indicators in presented in Table 8.1.
Table 8.1: Main macroeconomic indicators
CPI TECH TECH PHEV
TECH FCEV
TECH RAPID
2030 Impacts (relative to REF)
GDP (%) 0.4% 0.6% 0.5% 0.5% 0.7%
Employment (000's) 73 145 143 147 212
Oil Imports (mboe) -43 -87 -85 -87 -131
CO2 emissions from passenger cars (mtCO2) -16.4 -33.4 -32.7 -33.5 -50.1
CPI TECH TECH PHEV
TECH FCEV
TECH RAPID
2050 Impacts (relative to REF)
GDP (%) 0.3% 1.3% 1.2% 0.7% 1.6%
Employment (000's) 63 197 257 197 303
Oil Imports (mboe) -39 -163 -155 -165 -181
CO2 emissions from passenger cars (mtCO2) -18.8 -78.7 -74.8 -79.8 -88.4
21 https://www.camecon.com/how/e3me-model/

Low-carbon cars in Germany: technical report
56 Cambridge Econometrics
The economic impact is highly uncertain and is dependent on a number of competing factors: the cost of vehicles, low-carbon technologies and EV batteries, the location of vehicle supply chains and future oil prices, to name a few of the key uncertainties. However, the overriding impact arises from the reduction in oil imports. This is noticeable in the macroeconomic results whereby the GDP impact tends to follow oil imports in the CPI and TECH scenarios. Compared to the TECH scenario, TECH PHEV leads to greater employment, but fewer emissions savings and a slightly lower impact on GDP. The most ambitious scenario is TECH RAPID and this also yields the greatest economic benefits in terms of the impact on both GDP and employment which comes directly from the substantial reduction in oil imports. However, there are substantial risks attached to this future which are discussed in section 8.5 below.
Figure 8.1 below shows the GDP impacts under the CPI and TECH scenarios under a range of assumptions about the location of battery cell manufacturing. In the TECH scenario, by 2030, there is a modest (0.5%-0.6%) GDP improvement, as the economic benefits of reduced spending on oil and petroleum imports outweigh the negative economic impacts associated with higher vehicle prices. Moreover, as shown in Figure 8.1 the scale of the economic benefit of the TECH scenario is only slightly dependent on whether German industries are able to capture a share of the market for battery cells because of the relatively slow transition towards EVs in this scenario before 2030.
Figure 8.1 GDP results relative to the reference scenario
Further sensitivity analysis was undertaken where, as well as the vehicle efficiency improvements in TECH, there are lower oil prices in this scenario, based on the logic that, if there is a global transition away from oil, this would reduce global oil prices22. In this scenario, the GDP impacts are far greater (1.8%), as the value of spending on imported oil will be reduced considerably (diverting spending away from imports and towards the domestic economy).
22 https://europeanclimate.org/oil-market-futures/

Low-carbon cars in Germany: technical report
57 Cambridge Econometrics
Thus, a global transition to a low-carbon economy, as foreseen in the Paris agreement, delivers a greater GDP benefit for Germany than a national transition.
8.1 Sectoral impacts
The costs and benefits are not evenly distributed among different socio-economic groups, with some benefitting and some adversely affected by the transition.
In the TECH scenario, spending on road fuel is €72 bn lower than in the reference scenario by 2030. Whilst much of this spending in the REF scenario flows out of the German economy (in the form of import spending), reduced spending has an adverse impacts on the domestic refining industries. In the TECH scenario, gross output in the petroleum refining sector is considerably lower than in the reference scenario by 2030.
Electricity (and hydrogen) sectors gain directly through investment in charging infrastructure and through consumers’ expenditure on electricity & hydrogen. In the TECH scenario, gross output in the electricity sector is €1.7bn higher than in the reference scenario by 2030.
In the TECH scenario, the automotive supply chain shows a net increase in gross output of €10 bn and an increase of 28,000 jobs in 2030 compared to the reference scenario. However, with the supply chain there is a substantial transition from traditional motor vehicles production to electrical equipment in the long term. As such, we see by 2050, output in traditional motor vehicles falls by €7 bn whereas electrical equipment output increases by €14 bn.
8.2 Government revenues
In many countries (including Germany), fuel tax is levied to pay for road infrastructure improvements, which can cost the German government €40bn per year. By reducing spending on petrol and diesel fuels, vehicle efficiency improvements and a switch to EVs could have profound impacts on government tax revenues and the model for financing road maintenance and road infrastructure improvements.
Our analysis shows that the agreed EU CO2 targets for 2021 (the CPI scenario) will lead to a fuel tax revenue shortfall of around €6 billion in Germany by 2030. And the deployment of ZEVs, as foreseen in our TECH scenario would reduce fuel tax revenues by a further €7 billion. However, as described above, the structural shifts created by this transition leads to an economic boost, and taxation of this additional economic activity will entirely offset the accompanying reduction in fuel tax revenues by 2030.
Oil and petroleum refining
Other energy industries
The automotive supply chain

Low-carbon cars in Germany: technical report
58 Cambridge Econometrics
Figure 8.2 Fuel duty revenues (€2014bn)
While economic modelling shows this to be the case, it is unlikely to be so clear from the perspective of the German finance ministry, which will simply observe dwindling fuel tax revenues. From this perspective, the German finance ministry may seek to recoup the lost revenue directly through a road tax. The level of road tax required, would be equivalent to 2 cents per km or approximately €285 per motorist. This additional tax would cause a small reduction in the overall GDP impact due to an additional cost faced by consumers reducing their expenditure on other goods and services in the economy.
Nonetheless, it is worth noting these two important trends during the transition to low-carbon mobility. And as stated earlier, this highlights the importance of industry, government and civil society working together to find consensus on the optimal approach.
8.3 Employment
The impact on employment, while linked to the overall economic impact, is somewhat different. To measure the impact on employment, we also need to take account of the different employment intensities in the various sectors that are affected. There is a trend in increasing automation of the auto industry, leading to lower jobs overall, regardless of the low-carbon transition. Building battery-electric vehicles is expected to be less labour-intensive than building the gasoline and diesel vehicles they will replace. Meanwhile, building hybrids and plug-in hybrids is expected to be more labour intensive. Our modelling shows that the net employment impact for the auto sector from this transition will depend on the balance achieved between these various technologies, and the degree to which they are imported or produced in Germany.
Figure 8.3 shows the evolution of jobs in Germany as a result of the transition to low-carbon cars in 2030 and 2050 under our central TECH scenario, relative

Low-carbon cars in Germany: technical report
59 Cambridge Econometrics
to the Reference case. As a result of the economic shifts described above, there is a net increase in employment in the following sectors: construction, electricity, hydrogen, services and most manufacturing sectors. Employment in the fuels sector is reduced. Employment in the automotive manufacturing sector is increased until 2030, but decreases thereafter in our central TECH scenario.
Figure 8.3 The employment impact per sector of the transition to low-carbon cars (thousands)
In our TECH scenario, net auto sector jobs increase by 2030, because diesel and gasoline engines are built to greater levels of sophistication and efficiency to meet climate goals; and because of the increasing deployment of hybrids; plug-in hybrids and fuel-cell vehicles, which also contain increasing technological complexity. However, by 2050, the net impact on jobs starts to enter negative territory in our TECH scenario, because hybrids are increasingly replaced by battery-electric vehicles, which are simpler to build and therefore generate less jobs.
We have also explored a scenario in which plug-in hybrids remain dominant for longer (TECH PHEV). In such a case, German workers continue to benefit from building more complex vehicles for longer, and the net employment impact in the auto sector remains positive in 2050. While it is tempting to conclude that this indicates that Germany should prioritise PHEVs to maximise employment, this should be evaluated carefully. If Germany were to place a major industrial bet on PHEVs, but then car-buyers in Germany and its export markets were to favour BEVs, this would create risks of stranded assets. Nonetheless, the analysis does support the assertion that a transition to PHEVs, if embraced by consumers, is beneficial for German auto sector employment.
Employment impacts within the German auto sector are an important issue and deserve further analysis. The benefit of using a macro-economic modelling approach is that it allows us to assess the economy-wide impacts of this transition, but there are limits to the level of detail that can be provided.

Low-carbon cars in Germany: technical report
60 Cambridge Econometrics
For the low-carbon transition to be successful, care will need to be taken of those who will lose their jobs in technologies that become redundant. We thus recommend further analysis to explore how a “just transition” can be achieved in the auto sector, where these changes will take place against an overall background of increasing automation, which causes progressively lower employment.
8.4 Skills challenges
In Fuelling Europe’s Future, we assessed the skills challenges facing Europe and the differences between Member States to adapt the transition challenge. That study found that of all the EU Member States, Germany’s labour force is among the best-placed to face the challenge of decarbonising light duty vehicles.
In 2016, substantial proportions of Europe’s highest paid and highly-skilled occupations in the Automotive sector were in Germany. According to the Labour Force Survey, some 58% of Europe’s automotive sector workers are employed in Germany, 60% of the sectors Other Professionals and 58% of the sectors Mechanics. By contrast only 23% of assembly line workers and machine operators in the sector were employed by Germany. Put simply, the German automotive sector specialises in the higher value-added, more innovative, part of the sector and would be well placed to benefit from a transition requiring technological innovation.
Moreover, the German workforce is highly skilled in this respect. Among German 25-29 year olds, over 1.6% have post graduate qualifications in maths, science or computing. This is a higher proportion than in any other European country and is more than double the rate in the Netherlands and Spain.
The previous analysis at the European level23 has found some parts of the industry are experiencing skills shortages, particularly in the field of ‘mechatronics’ where mechanical and electrical engineering skills are combined. There is also significant competition for software developers needed to develop battery management systems. The pace of the transition in the scenarios investigated here allows time for development of the relevant skill sets in Germany, but only if industry, government and academic institutions start planning now.
Overall, the evidence suggests that the German workforce would be comparatively well-placed to meet the challenge of transition to low carbon vehicles.
8.5 The economic risks and opportunities of a faster transition
The Core Working Group developed and tested the TECH RAPID scenario to understand the contribution of a faster strategy towards emissions reductions but also to assess the economic impacts.
Whereas the gradual transition characterised in the TECH scenario leads to small economic benefits in the short term and gradually these increase to 2030 and beyond; a fast transition to battery electric vehicles (TECH RAPID) could lead to small reductions in GDP in the short term. This happens because
23 Fuelling Europe’s Future (2013), see https://www.camecon.com/how/our-work/fuelling-europes-future/

Low-carbon cars in Germany: technical report
61 Cambridge Econometrics
the economic costs of batteries in electric vehicles are not immediately outweighed by the benefits of reduced oil imports. This problem is worsened if expensive battery cells are imported but wholly mitigated if battery cell manufacturing is located in Germany. It is important to note, though, that even in the case where battery cells are entirely imported into Germany, there would still be net economic benefits by 2030. Moreover, this is the case even if battery costs only fall in line with our conservative central estimate and not the more optimistic low-cost estimates that might be considered more consistent with a rapid take-up of electric vehicles.
Figure 8.4 GDP impacts in the TECH RAPID scenario and sensitivities for battery manufacturing
As a result, we consider that a rapid deployment of electric vehicles offers both increased risk and reward: the economic benefits are potentially greater but much more reliant on securing battery cell manufacturing in Germany.
8.6 Oil imports
By 2030, In the core TECH scenario, oil imports are reduced by around 80 mboe annually. By 2050, the reduction in oil imports compared to the REF has increased to 160 mboe. For the TECH RAPID scenario, this reduction happens much quicker with a reduction of 130 mboe by 2030 (see Figure 8.5).
The reduction in oil imports is the main economic driver and explains the levelling off of economic benefits in the CPI scenario relative to the REF from 2030 onwards, compared to the increasing GDP benefits in the TECH and TECH RAPID scenarios out to 2050.

Low-carbon cars in Germany: technical report
62 Cambridge Econometrics
Figure 8.5 Oil imports

Low-carbon cars in Germany: technical report
63 Cambridge Econometrics
9 Environmental impacts
9.1 Impacts on CO2 emissions
In the central TECH scenario, CO2 emissions from cars are reduced from around 95 Mt per annum in 2017 to about 12 Mt per annum in 2050 (Figure 9.1). This is achieved via a combination of increased fuel efficiency and switching the energy source from diesel and gasoline to low-carbon electricity and hydrogen. While this trajectory achieves a substantial reduction in CO2 by 2050, it does not on its own achieve Germany’s goal of reducing transport CO2 by 40-42% by 2030.
Figure 9.1 Road Transport CO2 emissions in the TECH and TECH RAPID scenarios
This analysis neatly demonstrates the scale of the challenge in meeting Germany’s 2030 climate action plan in that it cannot be simply met through passenger cars alone without drastic action and most likely will require decarbonisation of other road transport to meet the target.
In the TECH RAPID scenario, the 40-42% target for a reduction in road transport CO2 emissions would be met, without additional effort for heavy duty vehicles such as trucks and buses.
9.2 Impacts on particulate matter
Particulate matter (PM2.5 and PM10) emitted from road transport can have a substantial impact on local air quality which has led to harmful consequences for human health in many urban centres.
At the same time as reducing CO2 emissions, a substantial co-benefit of decarbonising passenger cars is achieved as emissions of particulate matter from vehicle exhausts would be cut from around 5,000 tonnes per year in 2017 to below 500 tonnes in 2050.

Low-carbon cars in Germany: technical report
64 Cambridge Econometrics
In the short to medium term, much of the reduction seen across all scenarios, is through the impact from the Euro 5 and Euro 6 emissions standards. As these standards are already in place and set out to 2020 for ICEs, as shown in Figure 9.2, the reduction to 2030 is through these more efficient ICE-based vehicles gaining a larger share of the vehicle stock and the least efficient vehicles retiring. However, beyond 2030, PM10 emissions in the CPI emissions remain almost constant around 1,000 tonnes whereas the TECH scenario reach levels more than half that by 2050. This in predominately achieved through the transition away from petrol and diesel vehicles towards zero emission electricity and hydrogen.
Figure 9.2: Stock tailpipe particulate emissions (PM2.5 & PM10) in CPI and TECH
However, these particulate emissions that we model only refer to tailpipe emissions. While substantial, it is only part of the issue for local air pollutants from road transport. For road transport, the largest source of emission of particulates, is through tyre & brake wear and road abrasion. In 2014, according to the European environment agency, these two factors accounted for 68% of Germany’s total Particulate emissions from road transport in comparison, tailpipe emissions from passenger cars accounted for just 15%.

Low-carbon cars in Germany: technical report
65 Cambridge Econometrics
10 Conclusions
This study focused on the potential benefits and the transitional challenges of decarbonising cars in Germany.
We find that all the scenarios yield net economic benefits in the short term (under all but one of the conditions tested) and in the medium to long term. This comes about because of the economic benefits of reducing oil imports, and all scenarios lead to reductions in oil consumption and emissions. The economic benefit increases over the period to 2050 as oil imports are reduced. The implication of this finding, is that a transition towards low carbon cars to meet Germany’s climate goals can be adopted without fear of economic collapse.
While this study has not sought to analyse impacts on competitiveness in the sector, participants of the Core Working Group agreed that the German auto industry needs to remain at the cutting edge of innovation of low-carbon vehicle technologies in order to remain competitive during this transition. Failing to remain competitive would result in far fewer jobs in the German automotive sector and supply chain than the REF scenario projects.
Lowering Germany’s dependence on imported oil also contributes to its energy security. Moreover, all of the TECH scenario variants would substantially reduce CO2 emissions and improve local air quality.
Considerable transitional challenges were observed:
• A significant part of the value chain of battery electric vehicles is the manufacture of battery cells. Although the German economy is well-placed to capture this part of the value chain, it has yet to do so in a substantial way. In a rapid transition to battery electric vehicles (TECH RAPID) this capture of the value chain is a substantial source of economic benefits. The overall success of the transition is reliant on the development of domestic production.
• The transition depends on the rapid deployment of charging infrastructure at considerable scale and cost. Without this, take-up of EVs will be limited.
• Employment in the motor vehicles sector would likely fall post 2030 as advanced powertrains dominate the market, since they require fewer people to manufacture and assemble the components. There is time to plan for this within the sector by looking at natural rates of retirement and retraining, but if the transition occurs as quickly as set out in TECH RAPID, that planning has to start now.
• An alternative pathway that would mitigate this disruption to employment in the sector would be to pursue a PHEV-dominated transition. However, the trade-off is that the technologies are more CO2-intensive, potentially putting Germany’s climate ambitions at risk.
• Fuel duty revenues would decline, but the net benefits in the rest of the economy would make up the shortfall by expanding the tax base

Low-carbon cars in Germany: technical report
66 Cambridge Econometrics
elsewhere. However, politicians might be tempted to introduce other taxes on road users to directly (rather than indirectly) recoup the shortfall.
• A shift to electric vehicles could put considerable strain on the electricity generation and distribution system by exacerbating peak loads. However, our research suggests that there are technologies that could manage this by helping to spread out the demand (e.g. smart-charging). Moreover, such technologies could afford benefits to EV owners by offering flexibility services back to the grid.

Appendix A E3ME model description
Introduction
E3ME is a computer-based model of the world’s economic and energy systems and the environment. It was originally developed through the European Commission’s research framework programmes and is now widely used in Europe and beyond for policy assessment, for forecasting and for research purposes.
Recent applications of E3ME include:
• a global assessment of the economic impact of renewables for IRENA
• contribution to the EU’s Impact Assessment of its 2030 climate and energy package
• evaluations of the economic impact of removing fossil fuel subsidies in India and Indonesia
• analysis of future energy systems, environmental tax reform and trade deals in East Asia
• an assessment of the potential for green jobs in Europe
• an economic evaluation for the EU Impact Assessment of the Energy Efficiency Directive
This model description provides a short summary of the E3ME model. For further details, the reader is referred to the full model manual available online from www.e3me.com.
E3ME’s basic structure and data
The structure of E3ME is based on the system of national accounts, with further linkages to energy demand and environmental emissions. The labour market is also covered in detail, including both voluntary and involuntary unemployment. In total there are 33 sets of econometrically estimated equations, also including the components of GDP (consumption, investment, international trade), prices, energy demand and materials demand. Each equation set is disaggregated by country and by sector.
E3ME’s historical database covers the period 1970-2014 and the model projects forward annually to 2050. The main data sources for European countries are Eurostat and the IEA, supplemented by the OECD’s STAN database and other sources where appropriate. For regions outside Europe, additional sources for data include the UN, OECD, World Bank, IMF, ILO and national statistics. Gaps in the data are estimated using customised software algorithms.
The main dimensions of the model
The main dimensions of E3ME are:
• 59 countries – all major world economies, the EU28 and candidate countries plus other countries’ economies grouped
Overview
Recent applications

Low-carbon cars in Germany: technical report
68 Cambridge Econometrics
• 43 or 69 (Europe) industry sectors, based on standard international classifications
• 28 or 43 (Europe) categories of household expenditure
• 22 different users of 12 different fuel types
• 14 types of air-borne emission (where data are available) including the six greenhouse gases monitored under the Kyoto protocol
The countries and sectors covered by the model are listed at the end of this document.
Standard outputs from the model
As a general model of the economy, based on the full structure of the national accounts, E3ME is capable of producing a broad range of economic indicators. In addition there is range of energy and environment indicators. The following list provides a summary of the most common model outputs:
• GDP and the aggregate components of GDP (household expenditure, investment, government expenditure and international trade)
• sectoral output and GVA, prices, trade and competitiveness effects
• international trade by sector, origin and destination
• consumer prices and expenditures
• sectoral employment, unemployment, sectoral wage rates and labour supply
• energy demand, by sector and by fuel, energy prices
• CO2 emissions by sector and by fuel
• other air-borne emissions
• material demands
This list is by no means exhaustive and the delivered outputs often depend on the requirements of the specific application. In addition to the sectoral dimension mentioned in the list, all indicators are produced at the national and regional level and annually over the period up to 2050.
E3ME as an E3 model
The figure below shows how the three components (modules) of the model - energy, environment and economy - fit together. Each component is shown in its own box. Each data set has been constructed by statistical offices to conform with accounting conventions. Exogenous factors coming from outside the modelling framework are shown on the outside edge of the chart as inputs into each component. For each region’s economy the exogenous factors are economic policies (including tax rates, growth in government expenditures, interest rates and exchange rates). For the energy system, the outside factors are the world oil prices and energy policy (including regulation of the energy industries). For the environment component, exogenous factors include policies such as reduction in SO2 emissions by means of end-of-pipe filters from large combustion plants. The linkages between the
The E3 interactions

Low-carbon cars in Germany: technical report
69 Cambridge Econometrics
components of the model are shown explicitly by the arrows that indicate which values are transmitted between components.
The economy module provides measures of economic activity and general price levels to the energy module; the energy module provides measures of emissions of the main air pollutants to the environment module, which in turn can give measures of damage to health and buildings. The energy module provides detailed price levels for energy carriers distinguished in the economy module and the overall price of energy as well as energy use in the economy.
Technological progress plays an important role in the E3ME model, affecting all three Es: economy, energy and environment. The model’s endogenous technical progress indicators (TPIs), a function of R&D and gross investment, appear in nine of E3ME’s econometric equation sets including trade, the labour market and prices. Investment and R&D in new technologies also appears in the E3ME’s energy and material demand equations to capture energy/resource savings technologies as well as pollution abatement equipment. In addition, E3ME also captures low carbon technologies in the power sector through the FTT power sector model24.
Treatment of international trade
An important part of the modelling concerns international trade. E3ME solves for detailed bilateral trade between regions (similar to a two-tier Armington model). Trade is modelled in three stages:
• econometric estimation of regions’ sectoral import demand
24 See Mercure (2012).
The role of technology

Low-carbon cars in Germany: technical report
70 Cambridge Econometrics
• econometric estimation of regions’ bilateral imports from each partner
• forming exports from other regions’ import demands
Trade volumes are determined by a combination of economic activity indicators, relative prices and technology.
The labour market
Treatment of the labour market is an area that distinguishes E3ME from other macroeconomic models. E3ME includes econometric equation sets for employment, average working hours, wage rates and participation rates. The first three of these are disaggregated by economic sector while participation rates are disaggregated by gender and five-year age band.
The labour force is determined by multiplying labour market participation rates by population. Unemployment (including both voluntary and involuntary unemployment) is determined by taking the difference between the labour force and employment. This is typically a key variable of interest for policy makers.
Comparison with CGE models and econometric specification
E3ME is often compared to Computable General Equilibrium (CGE) models. In many ways the modelling approaches are similar; they are used to answer similar questions and use similar inputs and outputs. However, underlying this there are important theoretical differences between the modelling approaches.
In a typical CGE framework, optimal behaviour is assumed, output is determined by supply-side constraints and prices adjust fully so that all the available capacity is used. In E3ME the determination of output comes from a post-Keynesian framework and it is possible to have spare capacity. The model is more demand-driven and it is not assumed that prices always adjust to market clearing levels.
The differences have important practical implications, as they mean that in E3ME regulation and other policy may lead to increases in output if they are able to draw upon spare economic capacity. This is described in more detail in the model manual.
The econometric specification of E3ME gives the model a strong empirical grounding. E3ME uses a system of error correction, allowing short-term dynamic (or transition) outcomes, moving towards a long-term trend. The dynamic specification is important when considering short and medium-term analysis (e.g. up to 2020) and rebound effects25, which are included as standard in the model’s results.
Key strengths of E3ME
In summary the key strengths of E3ME are:
25 Where an initial increase in efficiency reduces demand, but this is negated in the long run as greater efficiency lowers the relative cost and increases consumption. See Barker et al (2009).

Low-carbon cars in Germany: technical report
71 Cambridge Econometrics
• the close integration of the economy, energy systems and the environment, with two-way linkages between each component
• the detailed sectoral disaggregation in the model’s classifications, allowing for the analysis of similarly detailed scenarios
• its global coverage, while still allowing for analysis at the national level for large economies
• the econometric approach, which provides a strong empirical basis for the model and means it is not reliant on some of the restrictive assumptions common to CGE models
• the econometric specification of the model, making it suitable for short and medium-term assessment, as well as longer-term trends
Applications of E3ME
Although E3ME can be used for forecasting, the model is more commonly used for evaluating the impacts of an input shock through a scenario-based analysis. The shock may be either a change in policy, a change in economic assumptions or another change to a model variable. The analysis can be either forward looking (ex-ante) or evaluating previous developments in an ex-post manner. Scenarios may be used either to assess policy, or to assess sensitivities to key inputs (e.g. international energy prices).
For ex-ante analysis a baseline forecast up to 2050 is required; E3ME is usually calibrated to match a set of projections that are published by the European Commission and the IEA but alternative projections may be used. The scenarios represent alternative versions of the future based on a different set of inputs. By comparing the outcomes to the baseline (usually in percentage terms), the effects of the change in inputs can be determined.
It is possible to set up a scenario in which any of the model’s inputs or variables are changed. In the case of exogenous inputs, such as population or energy prices, this is straight forward. However, it is also possible to add shocks to other model variables. For example, investment is endogenously determined by E3ME, but additional exogenous investment (e.g. through an increase in public investment expenditure) can also be modelled as part of a scenario input.
Model-based scenario analyses often focus on changes in price because this is easy to quantify and represent in the model structure. Examples include:
• changes in tax rates including direct, indirect, border, energy and environment taxes
• changes in international energy prices
• emission trading schemes
All of the price changes above can be represented in E3ME’s framework reasonably well, given the level of disaggregation available. However, it is also possible to assess the effects of regulation, albeit with an assumption about effectiveness and cost. For example, an increase in vehicle fuel-efficiency standards could be assessed in the model with an assumption about how
Scenario-based analysis
Price or tax scenarios
Regulatory impacts

Low-carbon cars in Germany: technical report
72 Cambridge Econometrics
efficient vehicles become, and the cost of these measures. This would be entered into the model as a higher price for cars and a reduction in fuel consumption (all other things being equal). E3ME could then be used to determine:
• secondary effects, for example on fuel suppliers
• rebound effects26
• overall macroeconomic impacts
Table 1: Main dimensions of the E3ME model
Regions Industries (Europe)
Industries (non-Europe)
1 Belgium Crops, animals, etc Agriculture etc 2 Denmark Forestry & logging Coal 3 Germany Fishing Oil & Gas etc 4 Greece Coal Other Mining 5 Spain Oil and Gas Food, Drink & Tobacco 6 France Other mining Textiles, Clothing & Leather 7 Ireland Food, drink & tobacco Wood & Paper 8 Italy Textiles & leather Printing & Publishing 9 Luxembourg Wood & wood prods Manufactured Fuels 10 Netherlands Paper & paper prods Pharmaceuticals 11 Austria Printing & reproduction Other chemicals 12 Portugal Coke & ref petroleum Rubber & Plastics 13 Finland Other chemicals Non-Metallic Minerals 14 Sweden Pharmaceuticals Basic Metals 15 UK Rubber & plastic products Metal Goods 16 Czech Rep. Non-metallic mineral prods Mechanical Engineering 17 Estonia Basic metals Electronics 18 Cyprus Fabricated metal prods Electrical Engineering 19 Latvia Computers etc Motor Vehicles 20 Lithuania Electrical equipment Other Transport Equipment 21 Hungary Other machinery/equipment Other Manufacturing 22 Malta Motor vehicles Electricity 23 Poland Other transport equip Gas Supply 24 Slovenia Furniture; other manufacture Water Supply 25 Slovakia Machinery repair/installation Construction 26 Bulgaria Electricity Distribution 27 Romania Gas, steam & air cond. Retailing 28 Norway Water, treatment & supply Hotels & Catering 29 Switzerland Sewerage & waste Land Transport etc 30 Iceland Construction Water Transport 31 Croatia Wholesale & retail MV Air Transport 32 Turkey Wholesale excl MV Communications 33 Macedonia Retail excl MV Banking & Finance 34 USA Land transport, pipelines Insurance 35 Japan Water transport Computing Services 36 Canada Air transport Professional Services 37 Australia Warehousing Other Business Services 38 New Zealand Postal & courier activities Public Administration 39 Russian Fed. Accommodation & food serv Education 40 Rest of Annex I Publishing activities Health & Social Work 41 China Motion pic, video, television Miscellaneous Services 42 India Telecommunications Unallocated 43 Mexico Computer programming etc.
26 In the example, the higher fuel efficiency effectively reduces the cost of motoring. In the long-run this is likely to lead to an increase in demand, meaning some of the initial savings are lost. Barker et al (2009) demonstrate that this can be as high as 50% of the original reduction.

Low-carbon cars in Germany: technical report
73 Cambridge Econometrics
44 Brazil Financial services 45 Argentina Insurance 46 Colombia Aux to financial services 47 Rest Latin Am. Real estate 48 Korea Imputed rents 49 Taiwan Legal, account, consult 50 Indonesia Architectural & engineering 51 Rest of ASEAN R&D 52 Rest of OPEC Advertising 53 Rest of world Other professional 54 Ukraine Rental & leasing 55 Saudi Arabia Employment activities 56 Nigeria Travel agency 57 South Africa Security & investigation, etc 58 Rest of Africa Public admin & defence 59 Africa OPEC Education 60 Human health activities
61 Residential care
62 Creative, arts, recreational
63 Sports activities 64 Membership orgs 65 Repair comp. & pers. goods 66 Other personal serv. 67 Hholds as employers 68 Extraterritorial orgs 69 Unallocated/Dwellings Source(s): Cambridge Econometrics.

Low-carbon cars in Germany: technical report
74 Cambridge Econometrics
Appendix B ICE Vehicle Technology improvements
Table B.1 Engine and transmission options – 2015 cost curve data
Downsizing options Energy saving Cost (€)
Small car Medium car Large car
Mild (15% cylinder content reduction)
4-6% 88 110 115
Medium (30% cylinder content reduction)
10-13% 120 180 180
Strong (45% cylinder content reduction)
15-19% 165 195 195
Combustion improvements (petrol)
5% 224 224 314
Combustion improvements (diesel)
2% 204 204 285
Cylinder deactivation
5% 155 155 155
Other engine options
Energy saving Cost (€)
(petrol only) Small car Medium car Large car
Direct injection (homogenous)
4.5-5.5% 130 130 184
Direct injection (stratified)
10-14% 250 350 435
Thermodynamic cycle improvements
11-13% 280 300 400
Cam phasing 5% 50 50 80
Variable valve actuation and lift (petrol and diesel)
9% 144 150 235
Transmission options
Energy saving Cost (€)
Small car Medium car Large car
Optimising gearbox ratios / downspeeding
4% 40 40 40

Low-carbon cars in Germany: technical report
75 Cambridge Econometrics
Automated manual transmission
2-5% 220 220 230
Dual clutch transmission
3-6% 233 250 257
Partial hybridisation Energy saving Cost (€)
Small car Medium car Large car
Start-stop 2.5-5% 66 80 96
Start-stop with regenerative breaking
6-10% 219 235 300

Low-carbon cars in Germany: technical report
76 Cambridge Econometrics
Appendix C Charging infrastructure assumptions

Low-carbon cars in Germany: technical report
77 Cambridge Econometrics
Table C.1: Number of charging points calculation breakdown for the TECH scenario
Variable Type 2015 2020 2025 2030 2035 2040 2045 2050 Vehicle stock (000s) All 44,241 44,273 45,056 46,215 47,211 47,552 47,055 45,610
Vehicle stock (000s) PHEV + BEV 29
489
2,291
5,673
10,409
16,069
21,340
25,470
BEVs 29
266
941
2,057
4,828
9,867
15,782
21,351
Share of vehicle stock PHEV + BEV 0% 1% 5% 12% 22% 34% 45% 56%
BEVs 0% 1% 2% 4% 10% 21% 34% 47%
Infrastructure density (vehicles per charging post)27
Household charging 1.25 1.4 1.5 1.7 1.7 1.7 1.7 1.7
Work charging 5.0 5.0 5.0 5.0 5.0 5.0 5.0 5.0
Public charging 5.0 5.0 5.0 5.0 5.0 5.0 5.0 5.0
Fast charging (highways) 500 500 500 500 500 500 500 500
Total number of charging posts (000s)
Household charging 23 349 1527 3337 6123 9452 12553 14982
Work charging 6 98 458 1135 2082 3214 4268 5094
Public charging 6 98 458 1135 2082 3214 4268 5094
Fast charging (highways) 0 1 5 11 21 32 43 51
Total number of charging plugs (000s)
Household charging (1 plug per post) 23 349 1527 3337 6123 9452 12553 14982
Work charging (2 plug per post) 12 196 916 2270 4164 6428 8536 10188
Public charging (2 plugs per post) 12 196 916 2270 4164 6428 8536 10188
Fast charging (3 plugs per post) 0 3 15 33 63 96 129 153
Total 47 744 3374 7910 14514 22404 29754 35511
27 Note that density assumption have been rounded to 1 decimal place.

Low-carbon cars in Germany: technical report
78 Cambridge Econometrics
Table C.2: Calculating the cost of infrastructure investment in the TECH scenario
Variable Type 2015 2020 2025 2030 2035 2040 2045 2050 A. Net additional posts required each year (000s)
Household charging 6 101 304 420 624 707 579 441
Work charging 1 29 100 157 208 236 193 147
Public charging 1 29 100 157 208 236 193 147
Fast charging (highways) 0 0 0 1 1 2 2 2
Total 8 159 504 735 1041 1181 967 737
B. Number of charging posts retiring from the stock each year (000s)28
Household charging 1 plug per post - - - - 6 101 304 420
Work charging 2 plugs per post - - - - 1 29 100 157
Public charging 2 plugs per post - - - - 1 29 100 157
Fast charging (highways) 3 plugs per post
- - - - 0 0 0 1
Total - - - - 8 159 504 735
C. Gross additional charging posts required each
year29 (000s) = A +
B
Household charging 1 plug per post 6 101 304 420 629 808 883 861
Work charging 2 plugs per post 1 29 100 157 209 265 292 304
Public charging 2 plugs per post 1 29 100 157 209 265 292 304
Fast charging (highways) 3 plugs per post
0 0 0 1 2 2 3 3
Total 8 159 504 735 1049 1340 1470 1472
D. Cost per charging post excl. installation (€)
Household charging 1 plug per post 400 260 206 179 163 152 144 138
Work charging 2 plugs per post 800 520 411 358 326 304 288 276
Public charging 2 plugs per post 2,500 1,625 1,285 1,119 1,020 951 901 864
Fast charging (highways) 3 plugs per post
25,000 16,248 12,846 11,192 10,201 9,510 9,009 8,639
28 Assume all charging points are retired after 20 years since construction 29 Figures in the table represent annual figures required. So, 2020 refers to additional posts required from 2019 to 2020.

Low-carbon cars in Germany: technical report
79 Cambridge Econometrics
E. Cost per charging post incl.
installation (€)30
Household charging 1 plug per post 1,400 910 719 627 571 533 505 484
Work charging 2 plugs per post 1,800 1,170 925 806 734 685 649 622
Public charging 2 plugs per post 7,500 4,874 3,854 3,357 3,060 2,853 2,703 2,592
Fast charging (highways) 3 plugs per post
40,000 25,996 20,553 17,907 16,321 15,216 14,415 13,823
E. Total annual investment requirements (€m) = (B × D) + (A × E)
Household charging 1 plug per post 8 92 219 264 357 392 336 271
Work charging 2 plugs per post 3 34 92 126 153 170 154 135
Public charging 2 plugs per post 11 144 384 526 638 701 611 516
Fast charging (highways) 3 plugs per post
1 4 7 9 25 37 37 34
Total 23 274 702 925 1173 1300 1138 956
F. Total cumulative investment requirements (€m)
Household charging 1 plug per point 8 338 1224 2475 4157 6065 7863 9349
Work charging 2 plugs per post 3 121 478 1049 1770 2594 3398 4110
Public charging 2 plugs per post 11 503 1991 4369 7371 10776 14017 16787
Fast charging (highways) 3 plugs per post
1 14 44 86 180 342 528 704
Total 23 976 3737 7979 13478 19777 25806 30950
30 Assume a 10% learning rate (Cost of a post fall by 10% for a doubling of the stock of charging posts)

Low-carbon cars in Germany: technical report
80 Cambridge Econometrics