low back pain (lbp) mechanics of the human spine mmh …leyland/kin201 files/spinal...
TRANSCRIPT

1
Mechanics of the Human Spine
Lifting and Spinal Compression
Hamill and Knutzen: Chapter 7 Nordin and Frankel: Ch. 10 by Margareta Lindh
Hall: Ch. 9 (more muscle anatomy detail than required)
Low Back Pain (LBP) Lifetime prevalence of LBP is very high (80+%) MMH is a major cause of work related LBP and
other musculoskeletal injuries. However, LBP is common in work environments
where no MMH occur, such as seated work. Work-related psychological stress and lifestyle
factors may also increase LBP risk. Possibly only 33% of work-related LBP is due to
lifting and bending tasks (Brown, 1973 & Magora, 1974)
Most flexion in these regions
Review terms: tension, compression, shear, bending, torsion.

2
Relative loads on the third lumbar disk for living subjects
Upright standing depicted as 100%
Many subjects report the position below gives them the most relief from back pain as this relaxes the psoas muscle.
The line of gravity shifts further ventrally during relaxed unsupported sitting (B) as the pelvis is tilted backward and the lumbar lordosis flattens (this creates a longer lever arm). When sitting erect (C) the pelvic backward tilt is reduced and the lever arm shortens (still longer than when standing (A).

3
Decrease is seen in all spinal regions
Another use of EMG
Compressive Disk Force vs. different backrest inclination and size of lumbar support
4
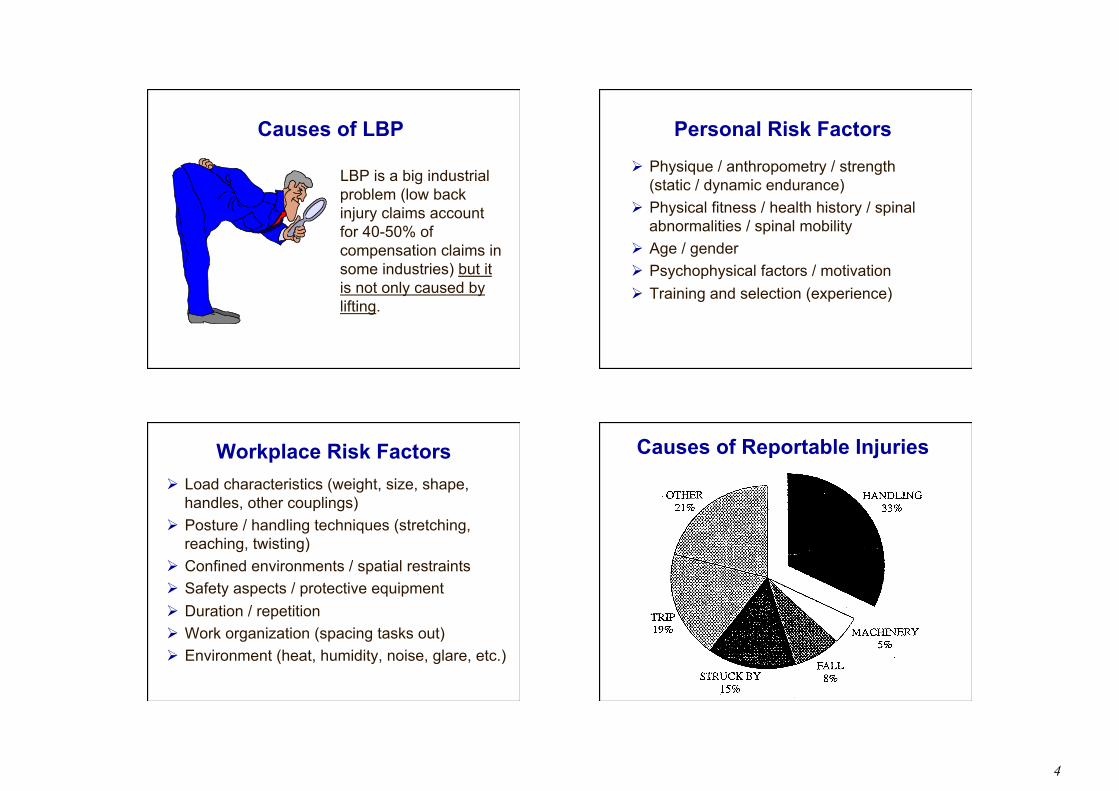
Causes of LBP
LBP is a big industrial problem (low back injury claims account for 40-50% of compensation claims in some industries) but it is not only caused by lifting.
Personal Risk Factors Physique / anthropometry / strength
(static / dynamic endurance) Physical fitness / health history / spinal
abnormalities / spinal mobility Age / gender Psychophysical factors / motivation Training and selection (experience)
Workplace Risk Factors Load characteristics (weight, size, shape,
handles, other couplings) Posture / handling techniques (stretching,
reaching, twisting) Confined environments / spatial restraints Safety aspects / protective equipment Duration / repetition Work organization (spacing tasks out) Environment (heat, humidity, noise, glare, etc.)
Causes of Reportable Injuries

5
Manual Handling Injuries Approximate 33% of the U.S. workforce is
presently required to exert significant force as part of their jobs (NIOSH, 1981).
This figure has not changed much in recent years.
This can lead to external injuries (cuts, bruises, crush injuries, lacerations of fingers, hands, forearms, ankles and feet), internal injuries (muscle and ligament tears, hernias, knee ankle and shoulder injuries, slipped disc).
Types of Handling Accidents
Analysing Lifting Tasks
More detail in specialized ergonomics courses
Epidemiological Analysis The approach is concerned with identifying the incidence, distribution and type of injury in the workforce. It is hoped that by studying comparative data, conclusions can be drawn about injury type, contributing factors and probability of occurrence.

6
Lifting task evaluation criteria Biomechanical
maximum disc compressive force limits lumbosacral stress NIOSH cut-off value of 3.4 kN (≈350 kg) most important for infrequent lifting tasks
Physiological maximum energy expenditure limits metabolic stress and fatigue NIOSH cut-off value of 2.2-4.7 kcal/min
(varies with specific task variables) most important in repetitive lifting tasks
Lifting task evaluation criteria Psychophysical
limits loads based on workers perception uses the concept of a maximum acceptable
weight applicable to nearly all lifting tasks (except
high-frequency lifting above 6 lifts per min) NIOSH cut-off acceptable to 75% of
female workers and 99% of male workers. other researchers (Snook, Mital et.al. provide
different tables for males and females).
Justification for the Criteria Our focus is the biomechanical criteria Questions regarding the Biomechanical
criteria in the revised NIOSH equation (1991): why choose L5/S1? why compressive force [Fcomp]? why 3.4 kN?
L5 / S1 ?

7
Compressive Force Vector? The relative importance of compressive, shear
and torsional forces is not well understood. Disc compression is thought to be largely
responsible for vertebral end-plate fracture, disc herniation, and resulting nerve root irritation.
Back compression is a good predictor of low-back and other overexertion injuries? [Herrin+, 1986]
Due to clinical interest in this area data exists on the compressive strength of the lumbar vertebral bodies and intevertebral disks.
3.4 kN = maximum compression NIOSH reviewed data from cross-sectional
field studies that provided estimates (from biomechanical modeling) of Fcomp generated by lifting tasks and subsequent injuries.
Herrin et. al. 1986 studied 55 jobs (2934 potentially stressful MMH tasks) and traced medical records (6912 workers).
For jobs with Fcomp between 4.5-6.8 kN the rate of back problems was 1.5 times greater than for jobs with Fcomp less than 4.5 kN
Cadaver Data Jager & Luttman (1989) found the mean
compressive strength of lumbar segments to be 4.4 kN with a SD of 1.88 kN.
If normally distributed, 30% of segments had a lumbar strength less than 3.4 kN.
Brinckmann et. al. (1988) found compressive strength ranged 2.1 to 9.6 kN. <21% fractured (or suffered end-plate failure) below 3.4 kN
How relevant are cadaver results to LBP?

8
L5
L4
5-6 cm S1

9
Lw = 0.18 m Lp = 0.35 m
Lw = 0.25 m Lp = 0.5 m
Find the muscle moment and muscle force
1 2
Muscle Force 151/0.05 = 3020 N
Muscle Force 212.5/0.05 = 4250 N
1 2
Compression and Shear Once you have calculated the muscle force
you can calculate the compressive and shear forces across L5/S1.
However, you cannot do this for the questions just given. Why? Think about what information you would need and how you would go about calculating these values.
You need to know the alignment of the segment in question (i.e. trunk).
Lw = 0.18 m Lp = 0.35 m
Lw = 0.25 m Lp = 0.5 m
Find the compressive and shear forces at L5/S1
Trunk angle 80o
Trunk angle 65o
1
2

10
Compression & Shear Solution In this simple model, three main forces act
on the lumbar spine at the lumbosacral (L5/S1) level: The force produced by the weight of the
upper body (body mass above L5/S1). The force produced by the weight of the
object. The force produced by the erector spinae
muscles (which acts approximately at right angles to the disc inclination).
Free Body Diagrams
Arm Segment
Trunk Segment
200 N
200 N 200 N
ΣFy = 0
450 N
Fm
Compressive Force Shear
Ignore arm weight
Compression and Shear
Trunk Segment
200 N
450 N
Fm
Compressive force components in pink
Shear force components in blue
θ
Same diagram as used earlier As the other examples
calculate the total forward bending moment produced by these two forces and the resultant muscle force required to maintain stable equilibrium.
Assuming the trunk is aligned 55o to the horizontal (forward bend of 35o) find the compressive and shear forces acting on L5/S1.
The solution to this diagram is in the Nordin and Frankel text Lw = 0.25 m
Lp = 0.4 m
11
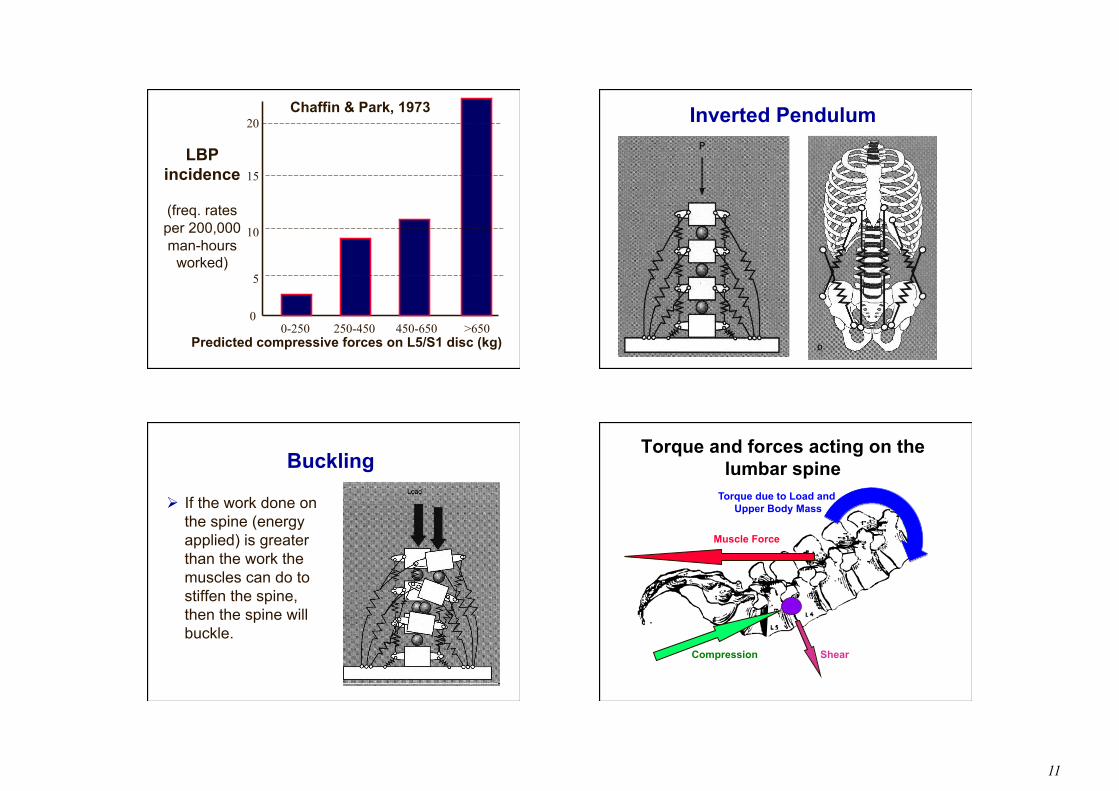
LBP incidence
(freq. rates per 200,000 man-hours
worked)
0
5
20
15
10
0-250 250-450 450-650 >650 Predicted compressive forces on L5/S1 disc (kg)
Chaffin & Park, 1973 Inverted Pendulum
Buckling
If the work done on the spine (energy applied) is greater than the work the muscles can do to stiffen the spine, then the spine will buckle.
Torque and forces acting on the lumbar spine
Compression Shear
Muscle Force
Torque due to Load and Upper Body Mass
12
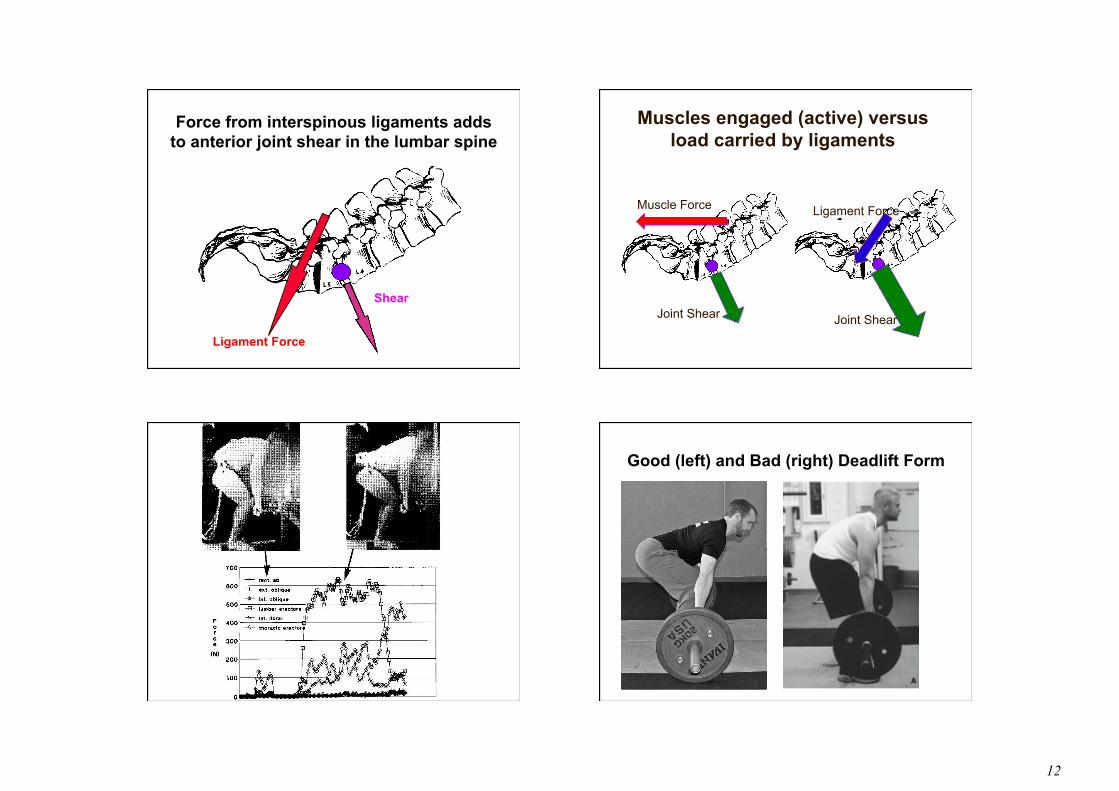
Force from interspinous ligaments adds to anterior joint shear in the lumbar spine
Ligament Force
Shear
Muscles engaged (active) versus load carried by ligaments
Ligament Force
Joint Shear
Muscle Force
Joint Shear
Good (left) and Bad (right) Deadlift Form

13
Fully flexed spine inactivates back extensors, loads the posterior passive tissues and results in
high shearing forces. Neutral spine posture disables interspinous ligaments reducing shear.
Shear
Compression
Straight Rounded
4D WATBAK
WATBAK manikin model of two deadlift lifting positions
Spinal Exercises / Core Strength
Joint Shear
Muscle Force Ligament Force
Joint Shear