louisiana real estate appraisal board (lreab)the louisiana real estate appraisal board (lreab)...
TRANSCRIPT

May 30, 2013 The Southeastern Louisiana University Business Research Center (BRC) is jointly operated by the Southeast Louisiana Business Center and the Southeastern College of Business. The BRC provides applied economic analyses and research studies that aid business and economic development efforts. The Center represents one aspect of the University’s commitment to economic development in the region. The Center is located in the Southeast Louisiana Business Center on Martens Drive, two blocks west of the main campus of Southeastern Louisiana University. The Business Research Center is a proud member of the Association for University Business and Economic Research (AUBER) and the Council for Community and Economic Research (C2ER). The following study was commissioned by the Louisiana Real Estate Appraisal Board, and was conducted using generally accepted research methods, models and techniques. The information gathered and/or study results are for informational purposes only and are not intended to be used for investment, lending, or legal decisions. Research and results of this study do not represent any form of endorsement by Southeastern Louisiana University. Sincerely,
William Joubert Director Business Research Center
Louisiana Residential Real Estate Appraisal Fees: 2012 A study funded by and conducted for the
Louisiana Real Estate Appraisal Board (LREAB)
May 2013
Herb Holloway
Dr. A.M.M. Jamal
William Joubert
i
Table of Contents Index of Figures ......................................................................................................... ii
Index of Tables ......................................................................................................... iii
EXECUTIVE SUMMARY ................................................................................................ 1
INTRODUCTION ......................................................................................................... 2
METHODOLOGY.......................................................................................................... 3
Lender Survey Timeline, Sample Pool, and Number of Responses .................................. 3
Appraiser Survey Timeline, Sample Pool, and Number of Responses .............................. 4
DEMOGRAPHIC AND CLASSIFICATION INFORMATION ..................................................... 5
Mortgage Lenders .................................................................................................... 5
Percentage of Appraisals Ordered Directly from Licensed Real Estate Appraisers in 2012 .......................................................................................................................... 5
Position/Occupation of Respondents ........................................................................ 6
Employer/Company of Lender Respondents ............................................................. 7
Primary Office Location of Respondents ................................................................... 8
Number of Mortgage Loans Processed in 2012 .......................................................... 9
Appraisers ............................................................................................................ 10
Position/Occupation During 2012 .......................................................................... 11
Experience Levels of Responding Appraisers........................................................... 11
Primary Office Location of Responding Appraisers ................................................... 13
Volume of Residential Appraisals Conducted in 2012 ............................................... 15
Percentage of Appraisals Done Directly for Clients or Lenders (non-AMC) .................. 15
APPRAISAL FEE DATA ............................................................................................... 17
2012 Median Appraisal Fees by Type of Appraisal (Statewide) ..................................... 17
2012 Median Appraisal Fees by Region ..................................................................... 19
Form 1004 Appraisal Fees by Region ..................................................................... 19
ii
Form 1004 FHA Appraisal Fees by Region .............................................................. 20
Form 1025 Appraisal Fees by Region ..................................................................... 21
Form 1073 Appraisal Fees by Region ..................................................................... 24
Form 2055 Appraisal Fees by Region ..................................................................... 25
ADDITIONAL APPRAISAL FEE ADJUSTMENTS ............................................................... 27
Additional Fee for Appraisals of Complex, Unique, or Very Expensive Properties ............ 27
Additional Fee for Appraisals of Properties in Remote or Distant Locations .................... 28
SUMMARY ............................................................................................................... 29
APPENDICES............................................................................................................ 30
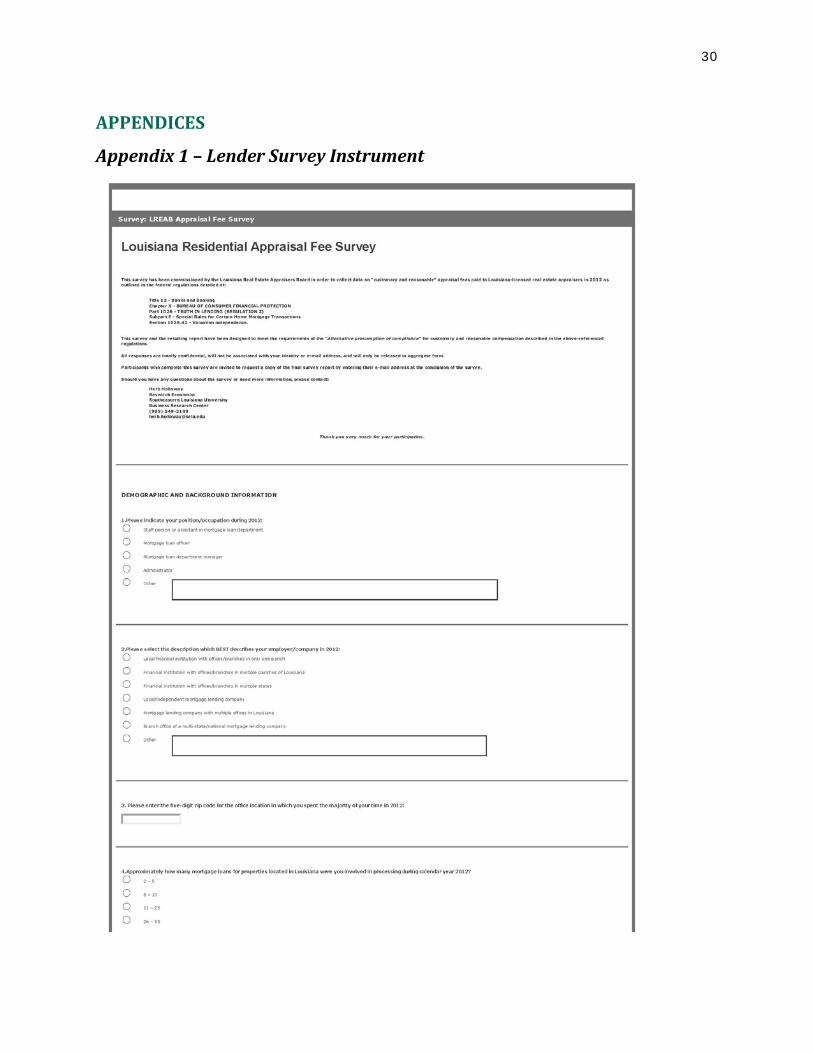
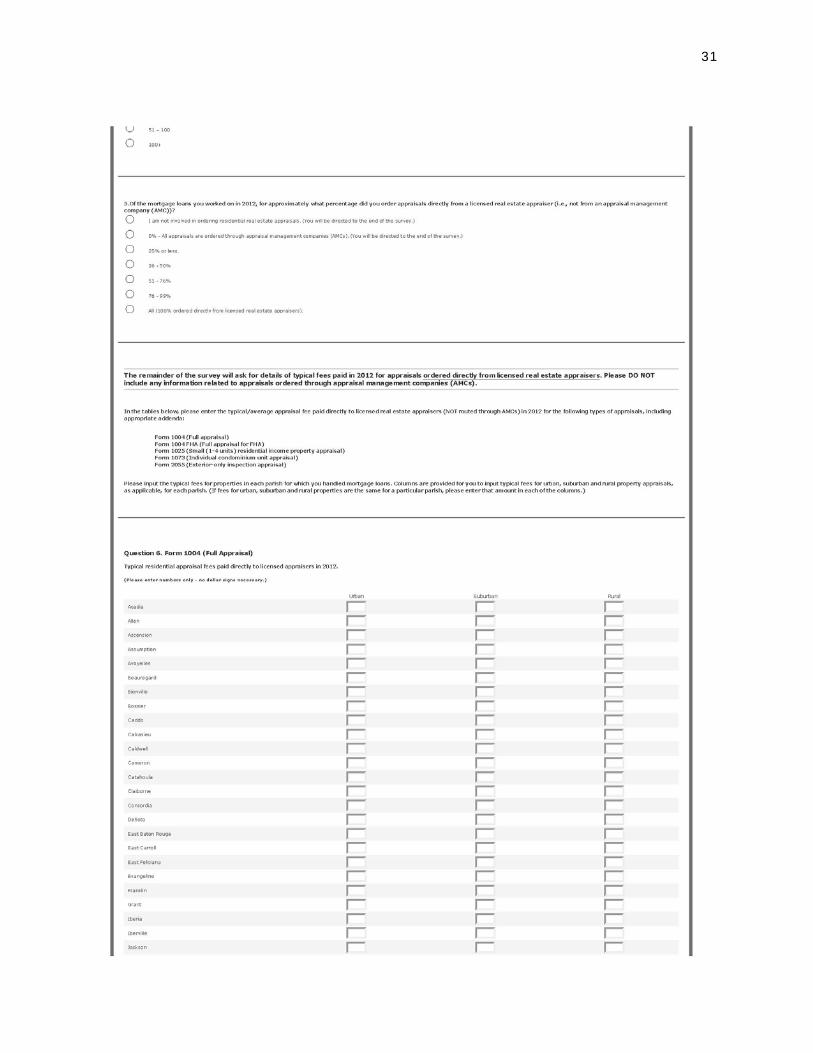
Appendix 1 – Lender Survey Instrument .................................................................. 30
Appendix 2 – Appraiser Survey Instrument ............................................................... 39
Appendix 3 – Parishes in each GOHSEP Region .......................................................... 48
Index of Figures Figure Title Page
Figure 1 Percentage of Residential Appraisals Ordered Directly from Appraisers…. 6 Figure 2 Percentage of Various Company Types by Their Response to Q5: % Non-
AMC Appraisals……………………………………………………………… 6 Figure 3 Number of Louisiana Mortgage Loans Processed in 2012 by Survey
Respondents…………………………………………………………………. 10 Figure 4 Position/Occupation of Responding Appraisers in 2012……………………... 12 Figure 5 Years of Experience of Responding Appraisers………………………………. 13 Figure 6 Number of LA Residential Appraisals Conducted in 2012…………………… 15 Figure 7 Percentage of 2012 Residential Appraisals Completed Directly for Clients
(non-AMC)……………………………………………………………………. 16 Figure 8 Median Statewide Appraisal Fees by Type of Appraisal and Location of
Property……………………………………………………………………..... 18 Figure 9 GOHSEP regional map used to group the 64 parishes into nine regions….. 19 Figure 10 Form 1004 Median Appraisal Fees by Region and Location………………... 21 Figure 11 Form 1004 FHA Median Appraisal Fees by Region and Location………….. 22 Figure 12 Form 1025 Median Appraisal Fees by Region and Location………………... 23 Figure 13 Form 1073 Median Appraisal Fees by Region and Location………………... 25 Figure 14 Form 2055 Median Appraisal Fees by Region and Location………………... 26
iii
Index of Tables Table Title Page
Table 1 Percentage of mortgage loans processed in 2012 for which appraisals were ordered directly from licensed appraisers (i.e., not routed through an AMC) 5
Table 2 Position/occupation of lender respondents: 2012 .………………………………. 7 Table 3 Text responses for those lenders indicating “Other” positions/ occupations in
2012……………………………………………………………………………… 7 Table 4 Employer/company of lender respondents: 2012………………………………… 8 Table 5 Parishes of primary office location of responders to the lender survey…….….. 9 Table 6 Number of mortgage loans processed by lender respondents in 2012………… 10 Table 7 Position/occupation held in 2012 by respondents to the appraiser survey……. 11 Table 8 Text responses from appraisers indicating “Other” positions/occupations……. 11 Table 9 Experience levels of responding appraisers………………………………………. 12 Table 10 Number and percentage of responding appraisers by parish of primary office. 14 Table 11 Number of Louisiana residential appraisals conducted in 2012………………… 15 Table 12 Percentage of 2012 residential appraisals done directly for clients (not routed
through AMCs)………………………………………………………………….. 16 Table 13 Median appraisal fees by type of appraisal (statewide/all locations)…………… 17 Table 14 Median appraisal fees by type of appraisal and location (statewide)…………... 18 Table 15 Median Form 1004 appraisal fees for URBAN properties by region….…….. 20 Table 16 Median Form 1004 appraisal fees for SUBURBAN properties by region…….. 20 Table 17 Median Form 1004 appraisal fees for RURAL properties by region…………... 20 Table 18 Median Form 1004 FHA appraisal fees for URBAN properties by region……. 21 Table 19 Median Form 1004 FHA appraisal fees for SUBURBAN properties by region 21 Table 20 Form 1004 FHA appraisal fees for RURAL properties by region………………. 21 Table 21 Comparison of Form 1004 FHA median fees with median fees for Form 1004
appraisals in nine Louisiana regions…………………………………………. 22 Table 22 Median Form 1025 appraisal fees for URBAN properties by region…………… 23 Table 23 Median Form 1025 appraisal fees for SUBURBAN properties by region……… 23 Table 24 Median Form 1025 appraisal fees for RURAL properties by region……………. 23 Table 25 Median Form 1073 appraisal fees for URBAN properties by region…………… 24 Table 26 Median Form 1073 appraisal fees for SUBURBAN properties by region……… 24 Table 27 Median Form 1073 appraisal fees for RURAL properties by region……………. 24 Table 28 Median Form 2055 appraisal fees for URBAN properties by region…………… 26 Table 29 Median Form 2055 appraisal fees for SUBURBAN properties by region……… 26 Table 30 Median Form 2055 appraisal fees for RURAL properties by region……………. 26 Table 31 Variable distance fees based on provided mileage brackets……………………. 28 Table 32 Summary of median residential appraisal fees for five appraisal types for
properties in three types of locations, by region of Louisiana……………... 29

1
EXECUTIVE SUMMARY The Business Research Center at Southeastern Louisiana University conducted an online survey of mortgage lenders with offices in Louisiana and licensed Louisiana real estate appraisers to collect information on typical residential real estate appraisal fees paid in Louisiana in 2012. Fee data were restricted to appraisal fees paid directly to licensed appraisers (i.e., not routed through appraisal management companies (AMCs)), per guidance of relevant federal regulations for determining “customary and reasonable” fees.
Useable responses were received from 113 mortgage lenders located in 25 parishes (plus out-of-state) and 383 appraisers with primary offices in 38 parishes (plus out-of-state). Appraisal fee data were provided for properties located in all 64 parishes.
Typical appraisal fees were collected for five appraisal types for properties in urban, suburban, and rural locations. Median fees were analyzed by region of the state based on geographic designations by the Governor’s Office of Homeland Security and Emergency Preparedness (GOHSEP), illustrated in Figure 9 and listed in Appendix 3.
The five appraisal types for which typical fees were collected included:
• Form 1004 (Full appraisal)
• Form 1004 FHA (Full appraisal for FHA)
• Form 1025 (Small (1–4 units) residential income property appraisal)
• Form 1073 (Individual condominium unit appraisal)
• Form 2055 (Exterior-only inspection appraisal)
Median fees across all regions ranged from a low of $300 - $350 for Form 2055 appraisals to a high of $500 - $650 for Form 1025 appraisals.
There was little difference in median fees for urban and suburban properties, while fees for rural properties tended to be somewhat higher.
There was significant variation in typical fees between regions, precluding the use of statewide averages for any appraisal type. Table 32 on page 29 provides a summary of median fees for all appraisal types by every region and location type.
The baseline appraisal fees shown in Table 32 should be considered minimum “standard” appraisal fees, with adjustments necessary for large or complex properties or properties located in distant or remote locations.
Although there was much variation depending on property details, the median typical large/complex property fee adjustment was $125, while the additional distance fee ranged from $25 for travel distances of 16-25 miles to $100 for distances of 51 miles and over.
2
INTRODUCTION
Enacted May 1, 2009, the Home Valuation Code of Conduct (HVCC) drastically changed the method in which residential real estate appraisal services were procured for secondary mortgage loans delivered to the Federal National Mortgage Association (Fannie Mae) and the Federal Home Loan Mortgage Corporation (Freddie Mac). The required separation of mortgage production from appraiser selection led to the rapid growth in the number and volume of business of appraisal management companies (AMCs).
Due to debates about the fairness of fees paid to appraisers by some AMCs, the Consumer Financial Protection Bureau enacted additional regulations on December 22, 2011 which required that “… the creditor and its agents shall compensate a fee appraiser for performing appraisal services at a rate that is customary and reasonable for comparable appraisal services performed in the geographic market of the property being appraised.”
These federal regulations are detailed at:
Title 12 – Banks and Banking Chapter X – BUREAU OF CONSUMER FINANCIAL PROTECTION Part 1026 – TRUTH IN LENDING (REGULATION Z) Subpart E – Special Rules for Certain Home Mortgage Transactions Section 1026.42 – Valuation independence Sub-section (f) – Customary and reasonable compensation. (1) Requirement
to provide customary and reasonable compensation to fee appraisers.
Paragraph (f) (3) – Alternative presumption of compliance states:
“A creditor and its agents shall be presumed to comply with paragraph (f)(1) of this section if the creditor or its agents determine the amount of compensation paid to the fee appraiser by relying on information about rates that :
(i) Is based on objective third-party information, including fee schedules, studies, and surveys prepared by independent third parties such as government agencies, academic institutions, and private research firms;
(ii) Is based on recent rates paid to a representative sample of providers of appraisal services in the geographic market of the property being appraised or the fee schedules of those providers; and
(iii) In the case of information based on fee schedules, studies, and surveys, such fee schedules, studies, or surveys, or the information derived therefrom, excludes compensation paid to fee appraisers for appraisals ordered by appraisal management companies, as defined in paragraph (f)(4)(iii) of this section.”
The Louisiana Real Estate Appraisal Board (LREAB) commissioned this study to provide mortgage lenders and appraisal management companies doing business in Louisiana with a convenient, concise, and complete report meeting the requirements under the above Alternative presumption of compliance.
3
METHODOLOGY
The Southeastern Louisiana University Business Research Center (BRC), in consultation with staff and officers of LREAB, decided to conduct an online survey of both Louisiana mortgage lenders and Louisiana-licensed residential real estate appraisers to collect a diverse sample of data regarding typical residential appraisal fees for various appraisal types in all geographic areas of the state.
The survey instruments, attached to this report as Appendices A & B, differed slightly for the two groups – lenders and appraisers – in order to collect different background and classification information from the two groups. Both groups were asked to provide data on their typical appraisal fees paid/charged for appraisals of properties in urban, suburban, and rural locations in all 64 parishes.
The lender and appraiser survey instruments were both hosted on the QuestionPro™ survey service, and were protected with separate passwords provided to potential survey respondents.
Lender Survey Timeline, Sample Pool, and Number of Responses In late November 2012, BRC staff obtained lists of
• Licensed mortgage loan originators, • State-chartered banks, • State-chartered thrifts, and • State-chartered credit unions
from the Louisiana Office of Financial Institutions.
The BRC also downloaded lists of Louisiana banks and credit unions from www.fdic.gov and www.ncua.gov, respectively.
Working from master lists derived from these sources, BRC staff conducted internet searches and telephoned institutions to attempt to gather e-mail addresses for mortgage lenders and mortgage-lending administrators within these institutions.
Introductory e-mails were sent out on 2/8/2013. A copy of the introductory e-mail was also provided to the Louisiana Bankers Association (LBA) on 2/6/2013 for distribution to approximately 675 LBA members.
The announcement of the opening of the online survey site, along with the link and password, was distributed to 1,216 e-mail contacts on 2/13/2013. The announcement e-mail was also provided to LBA, who distributed it to their members on 2/18/2013.
Reminder e-mails were distributed to the BRC contact list through Constant Contact on 2/26, 3/11, and 3/25/2013. LBA also sent one reminder to their members on or about 2/25/2013.
4
The lender survey site was closed on April 1, 2013, at which point there were 149 partial or complete survey responses from lenders.
In order to check for duplicate/multiple responses, IP addresses and/or e-mail addresses (when provided) were used to compare responses. Based on these comparisons, six of the responses were determined to be partially completed duplicates of other more complete responses, where the lender had left the survey incomplete and later come back and completed the survey again. (Due to the branching nature of some of the questions, it was not possible to go back to a previous question in the survey, and there was no mechanism for saving an incomplete survey for later completion.)
Although it is difficult to calculate a response rate due to overlap between the BRC and LBA contact lists, the 143 valid responses would represent approximately 12 percent of the 1,216 notification e-mails distributed by BRC.
Thirty of the 143 respondents indicated that they were not actively involved in mortgage lending, so their responses were removed from the data, leaving 113 useable responses from lenders.
Of these, 45 respondents indicated that all of their appraisals in 2012 were ordered through appraisal management companies, so they were directed to the end of the survey without providing any fee information, but their demographic and classification information was retained.
This left 68 responses from lenders who potentially could provide non-AMC appraisal fee information for 2012, of which 61 did.
Appraiser Survey Timeline, Sample Pool, and Number of Responses
Louisiana residential real estate appraisers received the introductory e-mail, survey opening announcement, and follow-up reminders via the LREAB membership contact list, which included 742 certified appraisers at the time of the survey.
The timing of the e-mail notifications was similar to that for the lenders described above.
By the time the appraiser survey site was closed on April 1, 2013, there were 415 partial or complete survey responses from appraisers. Ten of these were from individuals who did not hold a Louisiana residential real estate appraisal license in 2012, and thus were directed to the end of the survey without answering any questions. Another two respondents failed to indicate whether they held a license or not, so their responses were removed from the data. After closely reviewing the data and originating IP addresses, 20 responses were determined to be either duplicates of other responses or blank responses with no useable fee data, so these were also removed from the data before analysis began.
This left 383 potentially useable responses, representing 51.6 percent of the 742 certified Louisiana real estate appraisers. Of these 383, appraisal fee information was provided by 338, while the other 45 provided only classification information and/or comments.
5
DEMOGRAPHIC AND CLASSIFICATION INFORMATION
Mortgage Lenders
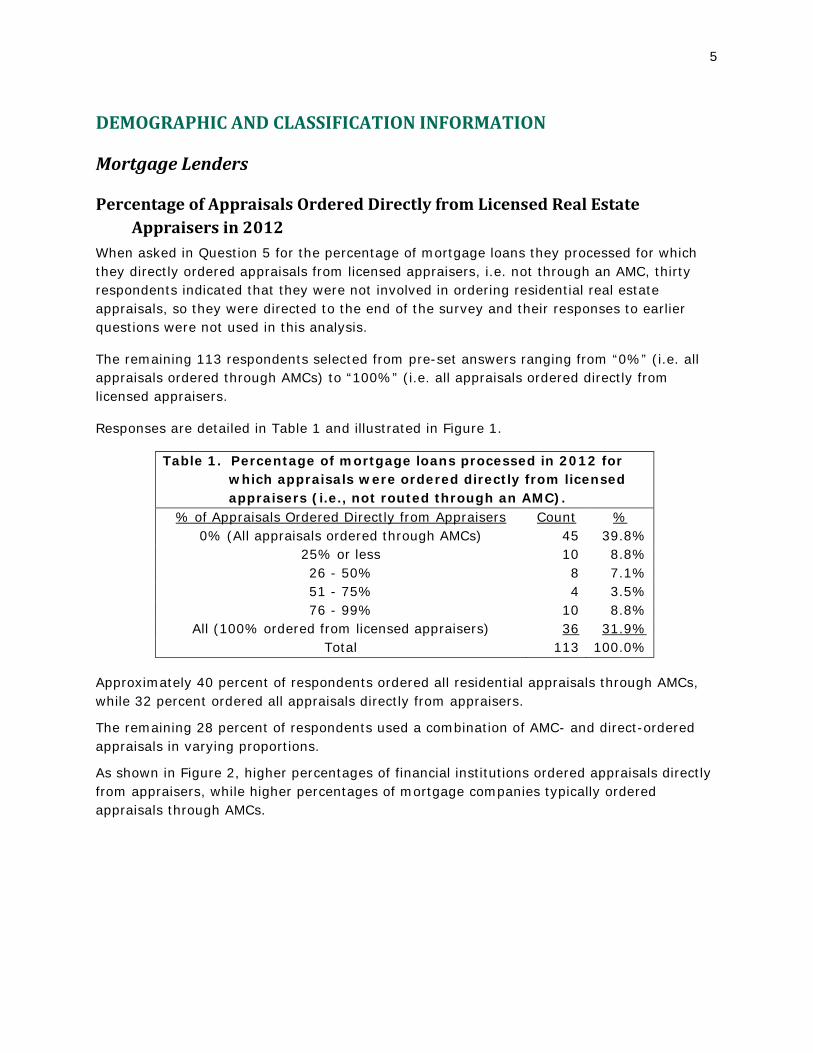
Percentage of Appraisals Ordered Directly from Licensed Real Estate Appraisers in 2012
When asked in Question 5 for the percentage of mortgage loans they processed for which they directly ordered appraisals from licensed appraisers, i.e. not through an AMC, thirty respondents indicated that they were not involved in ordering residential real estate appraisals, so they were directed to the end of the survey and their responses to earlier questions were not used in this analysis.
The remaining 113 respondents selected from pre-set answers ranging from “0%” (i.e. all appraisals ordered through AMCs) to “100%” (i.e. all appraisals ordered directly from licensed appraisers.
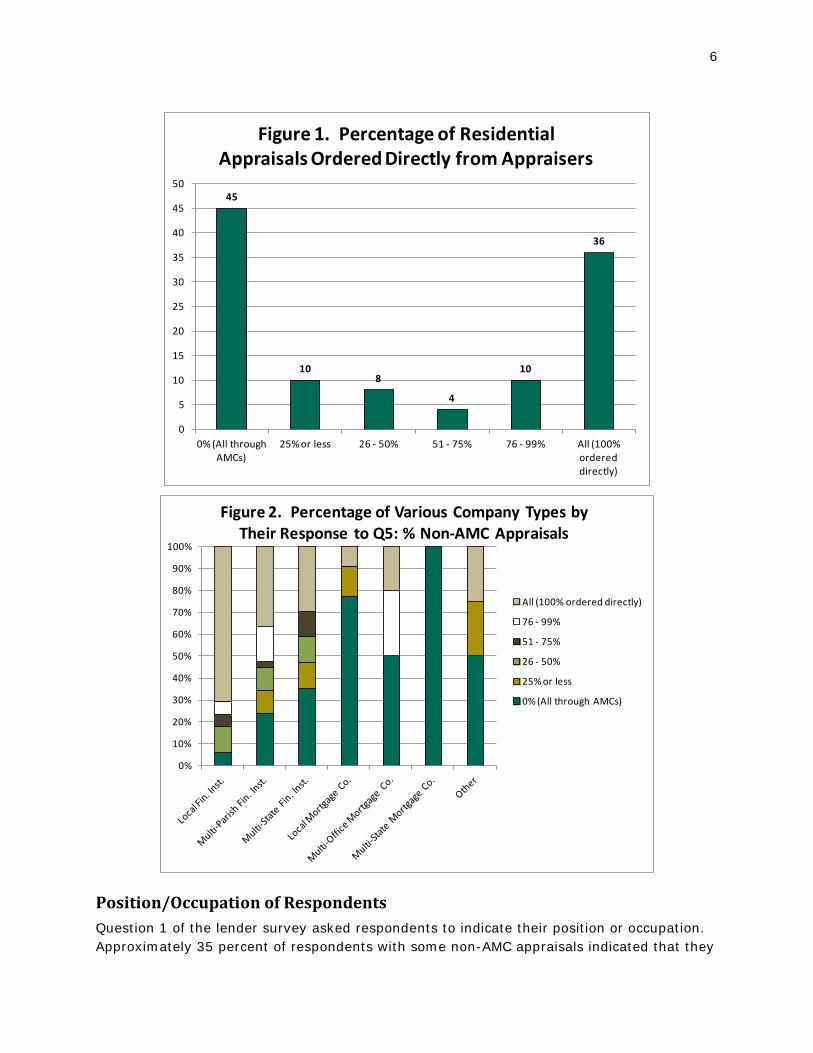
Responses are detailed in Table 1 and illustrated in Figure 1.
Table 1. Percentage of mortgage loans processed in 2012 for which appraisals were ordered directly from licensed appraisers (i.e., not routed through an AMC).
% of Appraisals Ordered Directly from Appraisers Count % 0% (All appraisals ordered through AMCs) 45 39.8%
25% or less 10 8.8% 26 - 50% 8 7.1% 51 - 75% 4 3.5% 76 - 99% 10 8.8%
All (100% ordered from licensed appraisers) 36 31.9% Total 113 100.0%
Approximately 40 percent of respondents ordered all residential appraisals through AMCs, while 32 percent ordered all appraisals directly from appraisers.
The remaining 28 percent of respondents used a combination of AMC- and direct-ordered appraisals in varying proportions.
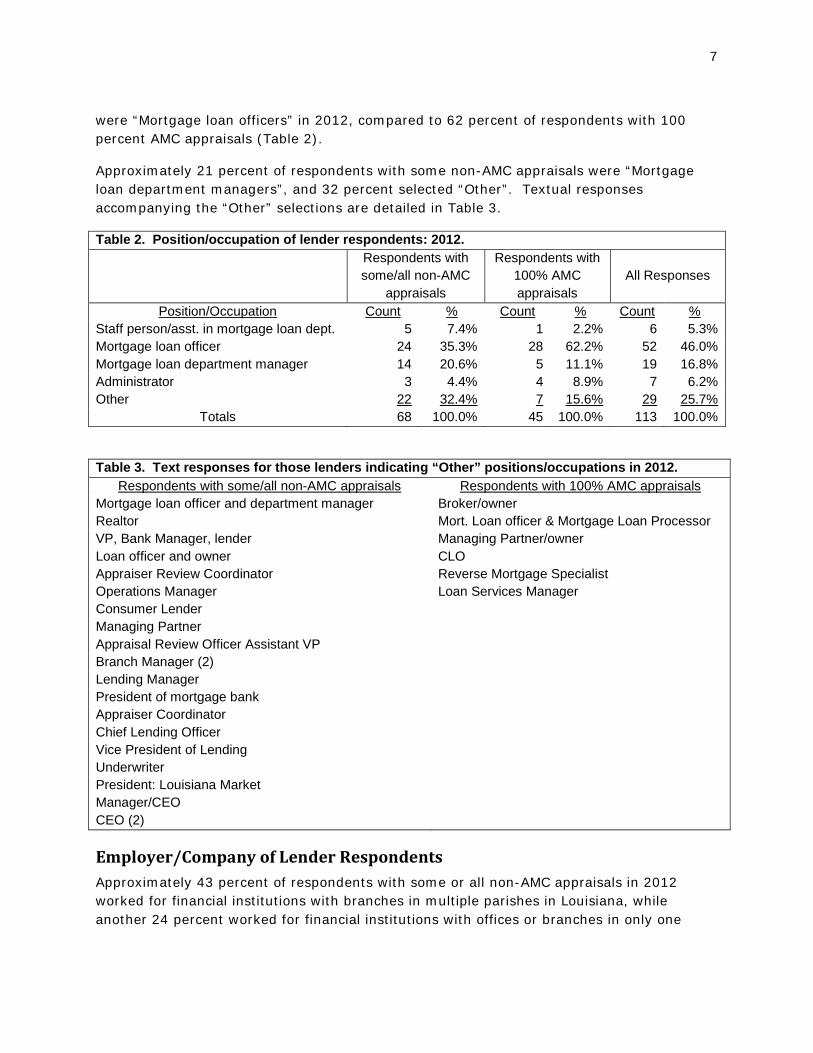
As shown in Figure 2, higher percentages of financial institutions ordered appraisals directly from appraisers, while higher percentages of mortgage companies typically ordered appraisals through AMCs.
6
45
108
4
10
36
0
5
10
15
20
25
30
35
40
45
50
0% (All through AMCs)
25% or less 26 - 50% 51 - 75% 76 - 99% All (100% ordered directly)
Figure 1. Percentage of Residential Appraisals Ordered Directly from Appraisers
0%
10%
20%
30%
40%
50%
60%
70%
80%
90%
100%
Figure 2. Percentage of Various Company Types by Their Response to Q5: % Non-AMC Appraisals
All (100% ordered directly)
76 - 99%
51 - 75%
26 - 50%
25% or less
0% (All through AMCs)
Position/Occupation of Respondents Question 1 of the lender survey asked respondents to indicate their position or occupation. Approximately 35 percent of respondents with some non-AMC appraisals indicated that they
7
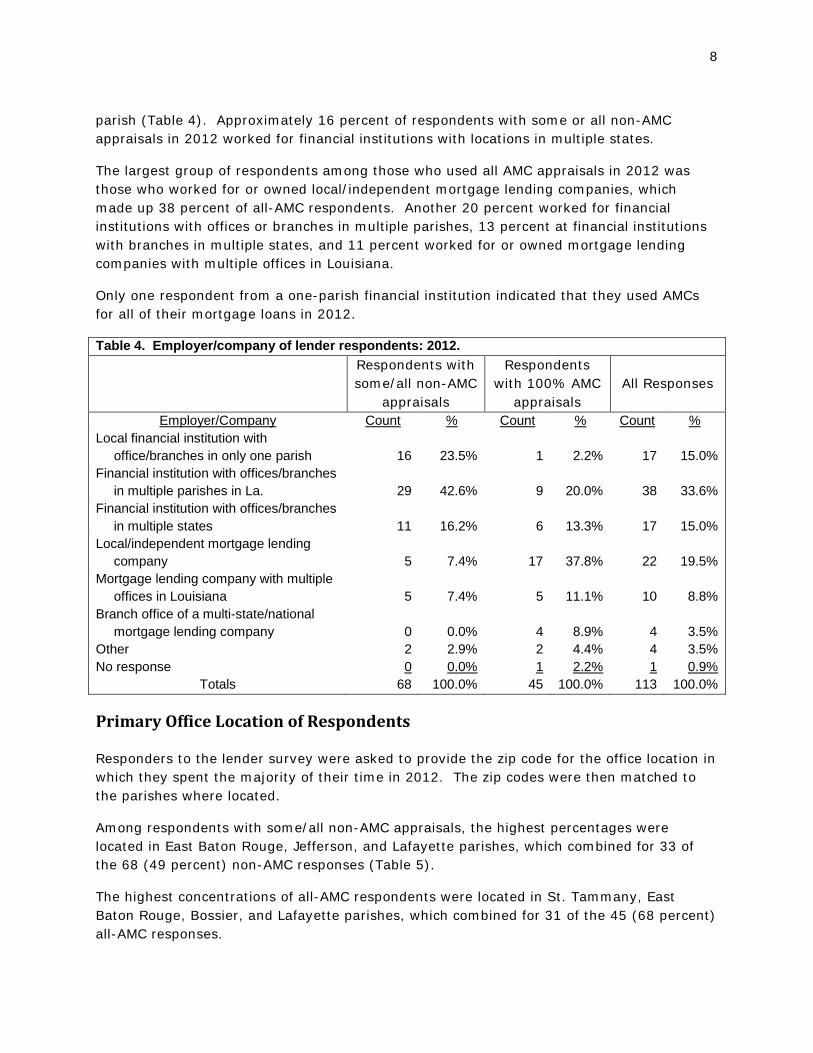
were “Mortgage loan officers” in 2012, compared to 62 percent of respondents with 100 percent AMC appraisals (Table 2).
Approximately 21 percent of respondents with some non-AMC appraisals were “Mortgage loan department managers”, and 32 percent selected “Other”. Textual responses accompanying the “Other” selections are detailed in Table 3.
Table 2. Position/occupation of lender respondents: 2012. Respondents with
some/all non-AMC appraisals
Respondents with 100% AMC appraisals
All Responses
Position/Occupation Count % Count % Count % Staff person/asst. in mortgage loan dept. 5 7.4% 1 2.2% 6 5.3% Mortgage loan officer 24 35.3% 28 62.2% 52 46.0% Mortgage loan department manager 14 20.6% 5 11.1% 19 16.8% Administrator 3 4.4% 4 8.9% 7 6.2% Other 22 32.4% 7 15.6% 29 25.7%
Totals 68 100.0% 45 100.0% 113 100.0%
Table 3. Text responses for those lenders indicating “Other” positions/occupations in 2012. Respondents with some/all non-AMC appraisals Respondents with 100% AMC appraisals
Mortgage loan officer and department manager Broker/owner Realtor Mort. Loan officer & Mortgage Loan Processor VP, Bank Manager, lender Managing Partner/owner Loan officer and owner CLO Appraiser Review Coordinator Reverse Mortgage Specialist Operations Manager Loan Services Manager Consumer Lender Managing Partner Appraisal Review Officer Assistant VP Branch Manager (2) Lending Manager President of mortgage bank Appraiser Coordinator Chief Lending Officer Vice President of Lending Underwriter President: Louisiana Market Manager/CEO CEO (2)
Employer/Company of Lender Respondents Approximately 43 percent of respondents with some or all non-AMC appraisals in 2012 worked for financial institutions with branches in multiple parishes in Louisiana, while another 24 percent worked for financial institutions with offices or branches in only one
8
parish (Table 4). Approximately 16 percent of respondents with some or all non-AMC appraisals in 2012 worked for financial institutions with locations in multiple states.
The largest group of respondents among those who used all AMC appraisals in 2012 was those who worked for or owned local/independent mortgage lending companies, which made up 38 percent of all-AMC respondents. Another 20 percent worked for financial institutions with offices or branches in multiple parishes, 13 percent at financial institutions with branches in multiple states, and 11 percent worked for or owned mortgage lending companies with multiple offices in Louisiana.
Only one respondent from a one-parish financial institution indicated that they used AMCs for all of their mortgage loans in 2012.
Table 4. Employer/company of lender respondents: 2012. Respondents with
some/all non-AMC appraisals
Respondents with 100% AMC
appraisals
All Responses
Employer/Company Count % Count % Count % Local financial institution with
office/branches in only one parish 16 23.5% 1 2.2% 17 15.0% Financial institution with offices/branches
in multiple parishes in La. 29 42.6% 9 20.0% 38 33.6% Financial institution with offices/branches
in multiple states 11 16.2% 6 13.3% 17 15.0% Local/independent mortgage lending
company 5 7.4% 17 37.8% 22 19.5% Mortgage lending company with multiple
offices in Louisiana 5 7.4% 5 11.1% 10 8.8% Branch office of a multi-state/national
mortgage lending company 0 0.0% 4 8.9% 4 3.5% Other 2 2.9% 2 4.4% 4 3.5% No response 0 0.0% 1 2.2% 1 0.9%
Totals 68 100.0% 45 100.0% 113 100.0%
Primary Office Location of Respondents
Responders to the lender survey were asked to provide the zip code for the office location in which they spent the majority of their time in 2012. The zip codes were then matched to the parishes where located.
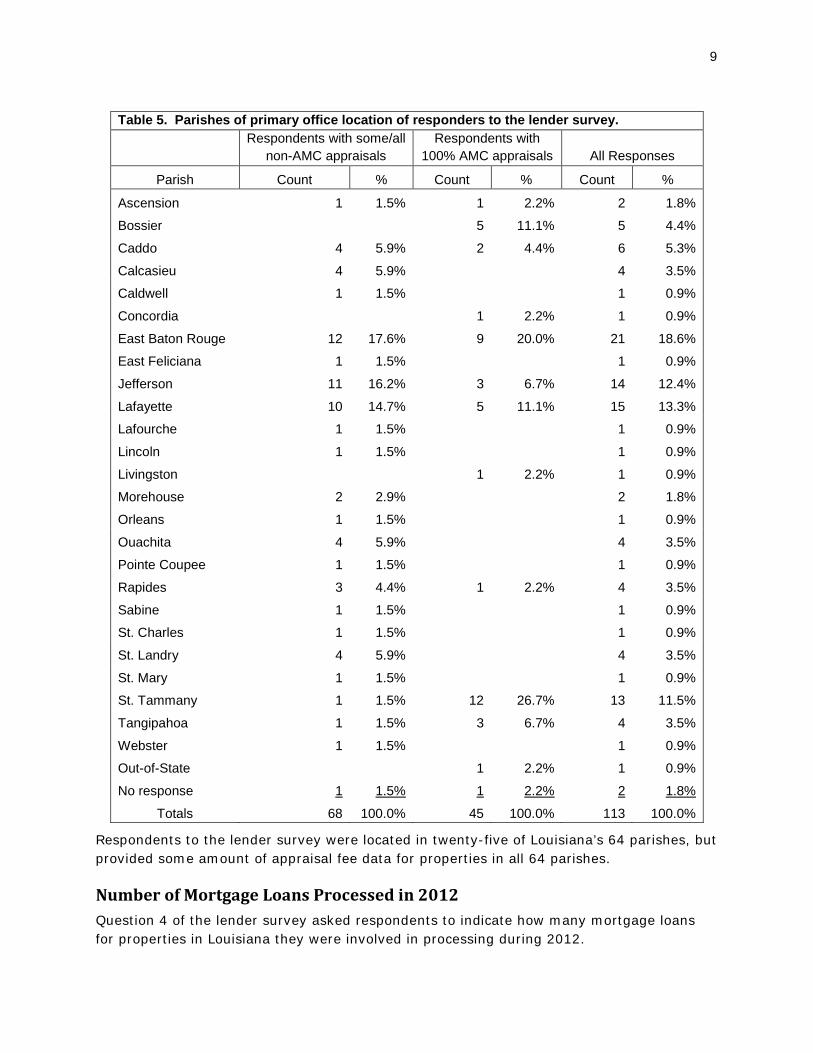
Among respondents with some/all non-AMC appraisals, the highest percentages were located in East Baton Rouge, Jefferson, and Lafayette parishes, which combined for 33 of the 68 (49 percent) non-AMC responses (Table 5).
The highest concentrations of all-AMC respondents were located in St. Tammany, East Baton Rouge, Bossier, and Lafayette parishes, which combined for 31 of the 45 (68 percent) all-AMC responses.
9
Table 5. Parishes of primary office location of responders to the lender survey. Respondents with some/all
non-AMC appraisals Respondents with
100% AMC appraisals
All Responses
Parish Count % Count % Count %
Ascension 1 1.5% 1 2.2% 2 1.8%
Bossier 5 11.1% 5 4.4%
Caddo 4 5.9% 2 4.4% 6 5.3%
Calcasieu 4 5.9% 4 3.5%
Caldwell 1 1.5% 1 0.9%
Concordia 1 2.2% 1 0.9%
East Baton Rouge 12 17.6% 9 20.0% 21 18.6%
East Feliciana 1 1.5% 1 0.9%
Jefferson 11 16.2% 3 6.7% 14 12.4%
Lafayette 10 14.7% 5 11.1% 15 13.3%
Lafourche 1 1.5% 1 0.9%
Lincoln 1 1.5% 1 0.9%
Livingston 1 2.2% 1 0.9%
Morehouse 2 2.9% 2 1.8%
Orleans 1 1.5% 1 0.9%
Ouachita 4 5.9% 4 3.5%
Pointe Coupee 1 1.5% 1 0.9%
Rapides 3 4.4% 1 2.2% 4 3.5%
Sabine 1 1.5% 1 0.9%
St. Charles 1 1.5% 1 0.9%
St. Landry 4 5.9% 4 3.5%
St. Mary 1 1.5% 1 0.9%
St. Tammany 1 1.5% 12 26.7% 13 11.5%
Tangipahoa 1 1.5% 3 6.7% 4 3.5%
Webster 1 1.5% 1 0.9%
Out-of-State 1 2.2% 1 0.9%
No response 1 1.5% 1 2.2% 2 1.8%
Totals 68 100.0% 45 100.0% 113 100.0%
Respondents to the lender survey were located in twenty-five of Louisiana’s 64 parishes, but provided some amount of appraisal fee data for properties in all 64 parishes.
Number of Mortgage Loans Processed in 2012 Question 4 of the lender survey asked respondents to indicate how many mortgage loans for properties in Louisiana they were involved in processing during 2012.
10
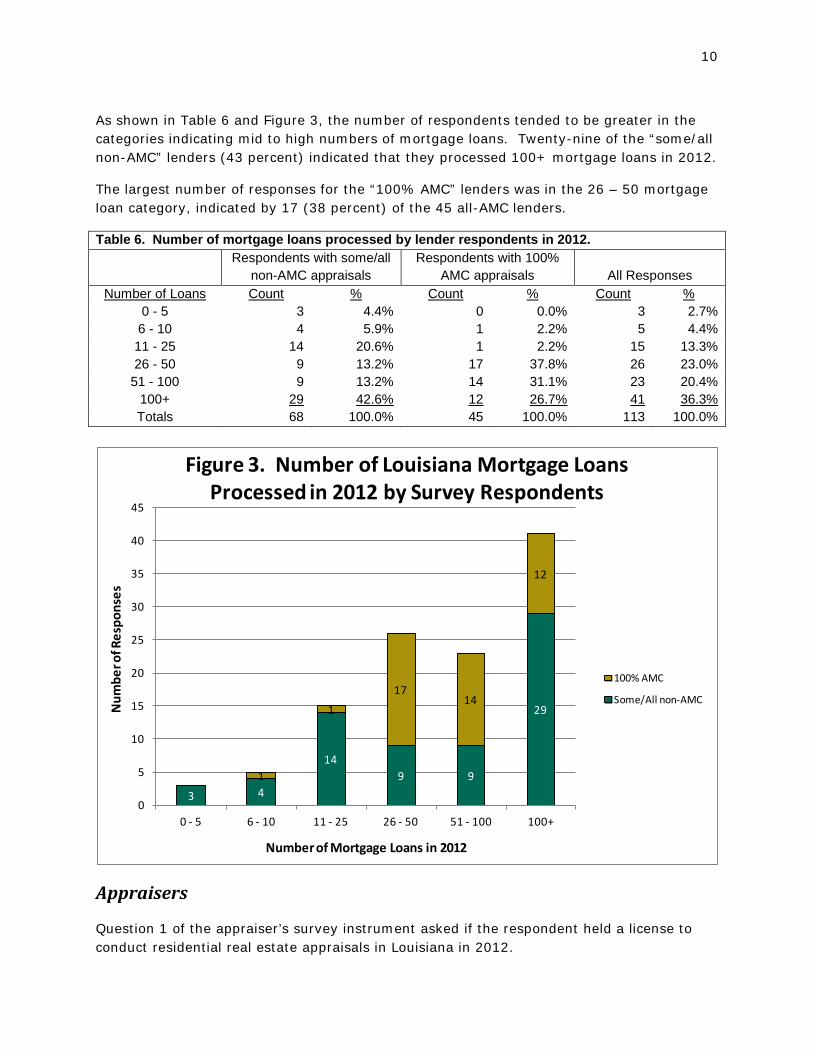
As shown in Table 6 and Figure 3, the number of respondents tended to be greater in the categories indicating mid to high numbers of mortgage loans. Twenty-nine of the “some/all non-AMC” lenders (43 percent) indicated that they processed 100+ mortgage loans in 2012.
The largest number of responses for the “100% AMC” lenders was in the 26 – 50 mortgage loan category, indicated by 17 (38 percent) of the 45 all-AMC lenders.
Table 6. Number of mortgage loans processed by lender respondents in 2012. Respondents with some/all
non-AMC appraisals Respondents with 100%
AMC appraisals
All Responses Number of Loans Count % Count % Count %
0 - 5 3 4.4% 0 0.0% 3 2.7% 6 - 10 4 5.9% 1 2.2% 5 4.4% 11 - 25 14 20.6% 1 2.2% 15 13.3% 26 - 50 9 13.2% 17 37.8% 26 23.0%
51 - 100 9 13.2% 14 31.1% 23 20.4% 100+ 29 42.6% 12 26.7% 41 36.3% Totals 68 100.0% 45 100.0% 113 100.0%
3 4
149 9
29
1
1
1714
12
0
5
10
15
20
25
30
35
40
45
0 - 5 6 - 10 11 - 25 26 - 50 51 - 100 100+
Num
ber o
f Res
pons
es
Number of Mortgage Loans in 2012
Figure 3. Number of Louisiana Mortgage Loans Processed in 2012 by Survey Respondents
100% AMC
Some/All non-AMC
Appraisers
Question 1 of the appraiser’s survey instrument asked if the respondent held a license to conduct residential real estate appraisals in Louisiana in 2012.
11
Ten respondents indicated that they did not, so they were directed to the end of the survey before answering any other questions. Two respondents failed to answer Question 1, so their responses were removed from the analysis.
After removing 20 duplicate and incomplete responses, 383 useable responses from appraisers remained.
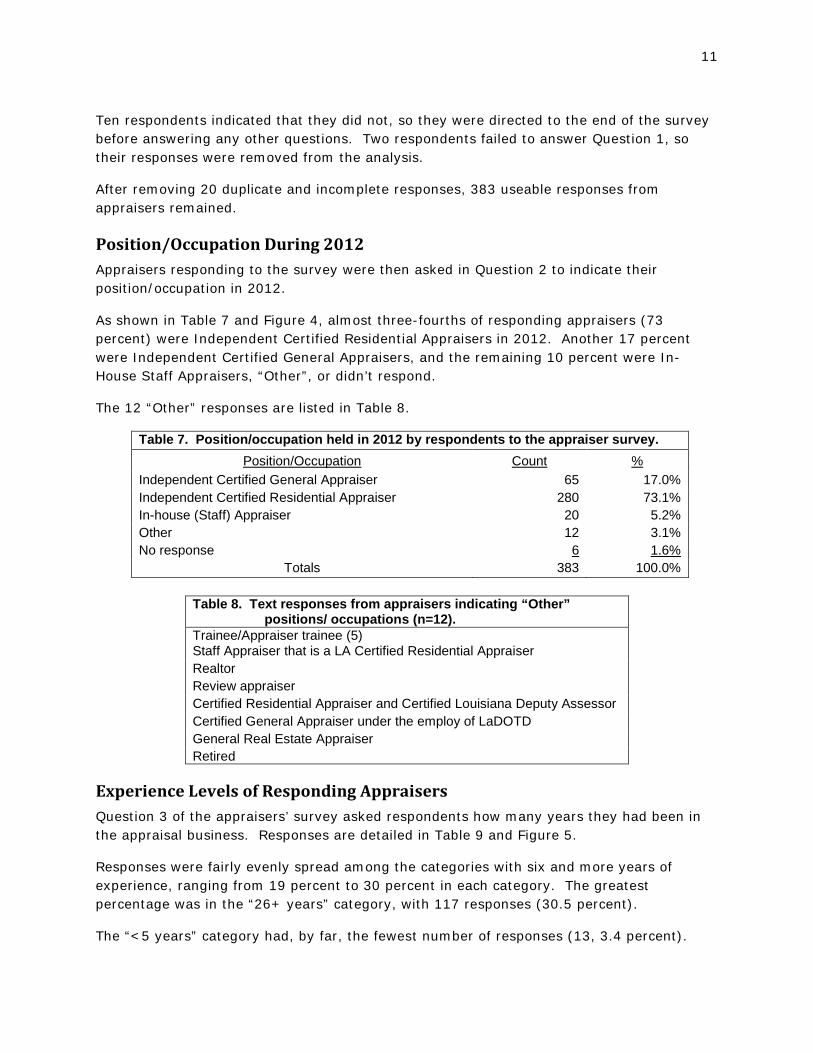
Position/Occupation During 2012 Appraisers responding to the survey were then asked in Question 2 to indicate their position/occupation in 2012.
As shown in Table 7 and Figure 4, almost three-fourths of responding appraisers (73 percent) were Independent Certified Residential Appraisers in 2012. Another 17 percent were Independent Certified General Appraisers, and the remaining 10 percent were In-House Staff Appraisers, “Other”, or didn’t respond.
The 12 “Other” responses are listed in Table 8.
Table 7. Position/occupation held in 2012 by respondents to the appraiser survey. Position/Occupation Count %
Independent Certified General Appraiser 65 17.0% Independent Certified Residential Appraiser 280 73.1% In-house (Staff) Appraiser 20 5.2% Other 12 3.1% No response 6 1.6%
Totals 383 100.0%
Table 8. Text responses from appraisers indicating “Other” positions/ occupations (n=12).
Trainee/Appraiser trainee (5) Staff Appraiser that is a LA Certified Residential Appraiser Realtor Review appraiser Certified Residential Appraiser and Certified Louisiana Deputy Assessor Certified General Appraiser under the employ of LaDOTD General Real Estate Appraiser Retired
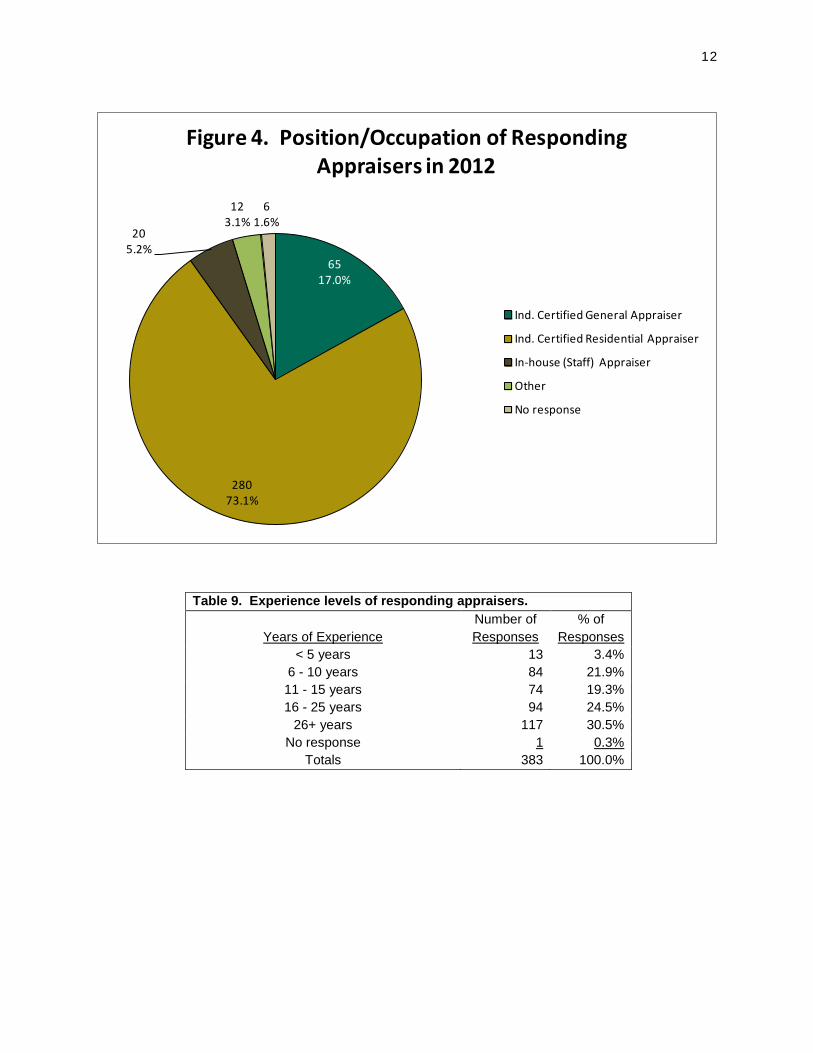
Experience Levels of Responding Appraisers Question 3 of the appraisers’ survey asked respondents how many years they had been in the appraisal business. Responses are detailed in Table 9 and Figure 5.
Responses were fairly evenly spread among the categories with six and more years of experience, ranging from 19 percent to 30 percent in each category. The greatest percentage was in the “26+ years” category, with 117 responses (30.5 percent).
The “<5 years” category had, by far, the fewest number of responses (13, 3.4 percent).
12
6517.0%
28073.1%
205.2%
123.1%
61.6%
Figure 4. Position/Occupation of Responding Appraisers in 2012
Ind. Certified General Appraiser
Ind. Certified Residential Appraiser
In-house (Staff) Appraiser
Other
No response
Table 9. Experience levels of responding appraisers.
Years of Experience Number of Responses
% of Responses
< 5 years 13 3.4% 6 - 10 years 84 21.9% 11 - 15 years 74 19.3% 16 - 25 years 94 24.5%
26+ years 117 30.5% No response 1 0.3%
Totals 383 100.0%
13
133.4%
8421.9%
7419.3%
9424.5%
11730.5%
10.3%
Figure 5. Years of Experience of Responding Appraisers.
< 5 years
6 - 10 years
11 - 15 years
16 - 25 years
26+ years
No response
Primary Office Location of Responding Appraisers
Respondents were asked to provide the zip code of the office location where they spent the majority of their time in 2012. These zip codes were then converted to the parish where the zip code is located.
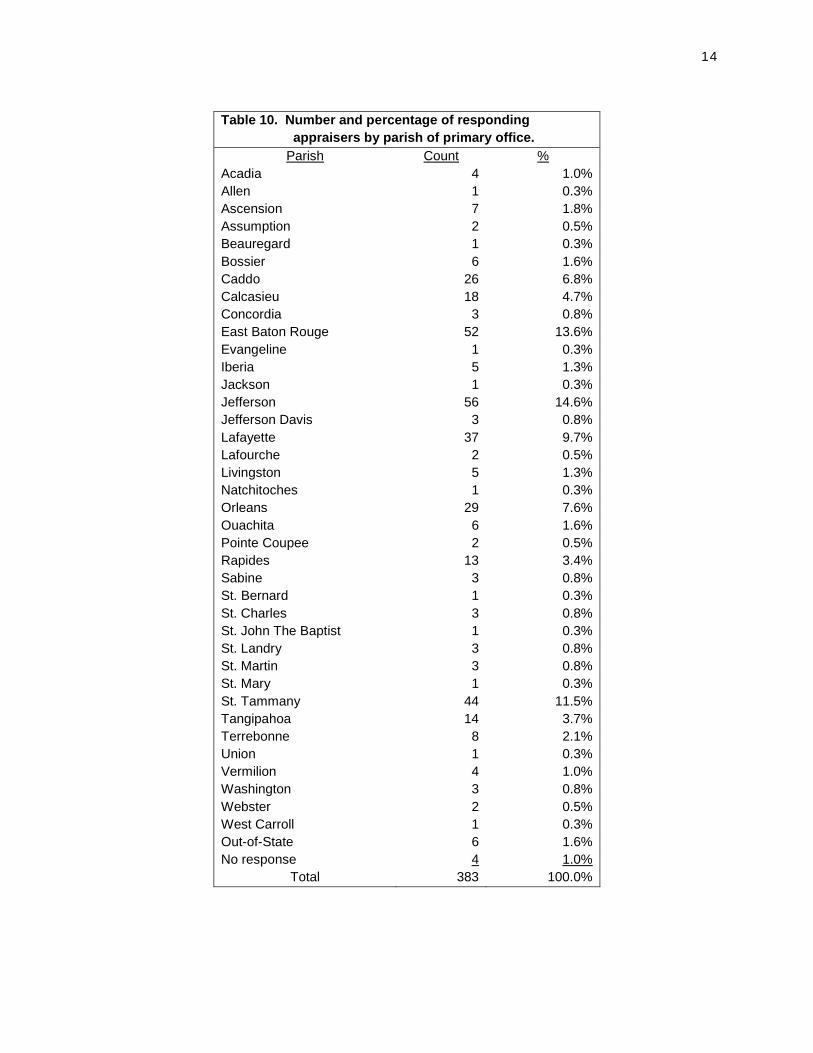
The number and percentage of responding appraisers by parish are detailed in Table 10.
Three parishes – Jefferson, East Baton Rouge, and St. Tammany – were each the primary office locations for over 10 percent of respondents, with 14.6 percent, 13.6 percent, and 11.5 percent of all responses, respectively.
Lafayette, Orleans, and Caddo parishes each contributed between five and 10 percent of responses, with 9.7 percent, 7.6 percent, and 6.8 percent, respectively.
Of the remaining 139 responses, 129 were from 32 other parishes, while 6 were from nearby states (3=MS, 1=AL, 1=AR, 1=TX). Four responding appraisers did not provide their office zip code.
Twenty-six parishes were not indicated as the primary office location of any responding appraisers, although fee data were reported for all 64 parishes.
14
Table 10. Number and percentage of responding appraisers by parish of primary office.
Parish Count % Acadia 4 1.0% Allen 1 0.3% Ascension 7 1.8% Assumption 2 0.5% Beauregard 1 0.3% Bossier 6 1.6% Caddo 26 6.8% Calcasieu 18 4.7% Concordia 3 0.8% East Baton Rouge 52 13.6% Evangeline 1 0.3% Iberia 5 1.3% Jackson 1 0.3% Jefferson 56 14.6% Jefferson Davis 3 0.8% Lafayette 37 9.7% Lafourche 2 0.5% Livingston 5 1.3% Natchitoches 1 0.3% Orleans 29 7.6% Ouachita 6 1.6% Pointe Coupee 2 0.5% Rapides 13 3.4% Sabine 3 0.8% St. Bernard 1 0.3% St. Charles 3 0.8% St. John The Baptist 1 0.3% St. Landry 3 0.8% St. Martin 3 0.8% St. Mary 1 0.3% St. Tammany 44 11.5% Tangipahoa 14 3.7% Terrebonne 8 2.1% Union 1 0.3% Vermilion 4 1.0% Washington 3 0.8% Webster 2 0.5% West Carroll 1 0.3% Out-of-State 6 1.6% No response 4 1.0%
Total 383 100.0%
15
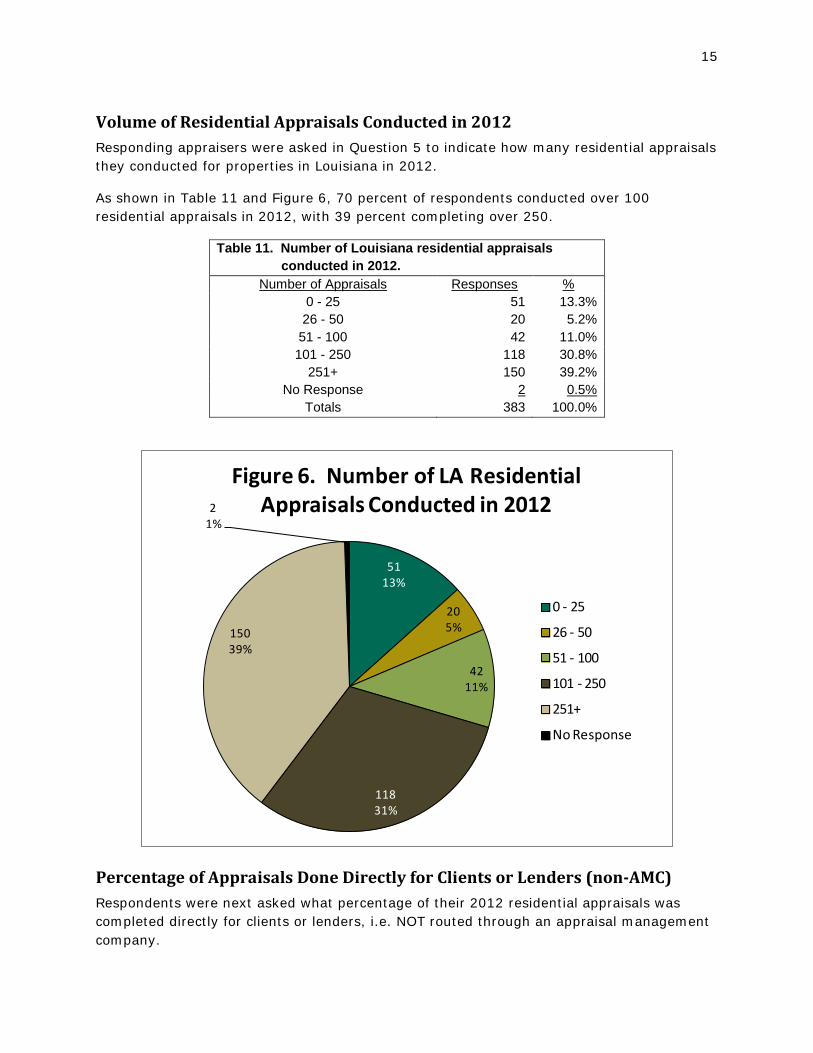
Volume of Residential Appraisals Conducted in 2012 Responding appraisers were asked in Question 5 to indicate how many residential appraisals they conducted for properties in Louisiana in 2012.
As shown in Table 11 and Figure 6, 70 percent of respondents conducted over 100 residential appraisals in 2012, with 39 percent completing over 250.
Table 11. Number of Louisiana residential appraisals conducted in 2012.
Number of Appraisals Responses % 0 - 25 51 13.3% 26 - 50 20 5.2%
51 - 100 42 11.0% 101 - 250 118 30.8%
251+ 150 39.2% No Response 2 0.5%
Totals 383 100.0%
5113%
205%
4211%
11831%
15039%
21%
Figure 6. Number of LA Residential Appraisals Conducted in 2012
0 - 25
26 - 50
51 - 100
101 - 250
251+
No Response
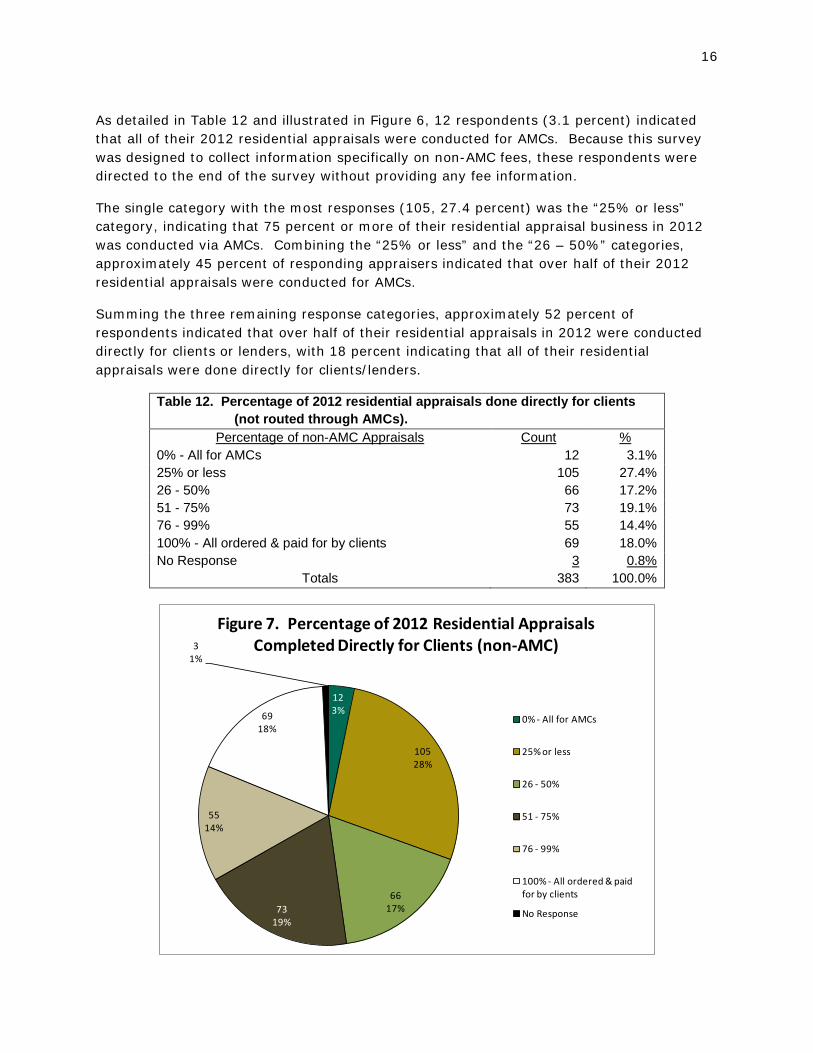
Percentage of Appraisals Done Directly for Clients or Lenders (non-AMC) Respondents were next asked what percentage of their 2012 residential appraisals was completed directly for clients or lenders, i.e. NOT routed through an appraisal management company.
16
As detailed in Table 12 and illustrated in Figure 6, 12 respondents (3.1 percent) indicated that all of their 2012 residential appraisals were conducted for AMCs. Because this survey was designed to collect information specifically on non-AMC fees, these respondents were directed to the end of the survey without providing any fee information.
The single category with the most responses (105, 27.4 percent) was the “25% or less” category, indicating that 75 percent or more of their residential appraisal business in 2012 was conducted via AMCs. Combining the “25% or less” and the “26 – 50%” categories, approximately 45 percent of responding appraisers indicated that over half of their 2012 residential appraisals were conducted for AMCs.
Summing the three remaining response categories, approximately 52 percent of respondents indicated that over half of their residential appraisals in 2012 were conducted directly for clients or lenders, with 18 percent indicating that all of their residential appraisals were done directly for clients/lenders.
Table 12. Percentage of 2012 residential appraisals done directly for clients (not routed through AMCs).
Percentage of non-AMC Appraisals Count % 0% - All for AMCs 12 3.1% 25% or less 105 27.4% 26 - 50% 66 17.2% 51 - 75% 73 19.1% 76 - 99% 55 14.4% 100% - All ordered & paid for by clients 69 18.0% No Response 3 0.8%
Totals 383 100.0%
123%
10528%
6617%73
19%
5514%
6918%
31%
Figure 7. Percentage of 2012 Residential Appraisals Completed Directly for Clients (non-AMC)
0% - All for AMCs
25% or less
26 - 50%
51 - 75%
76 - 99%
100% - All ordered & paid for by clients
No Response
17
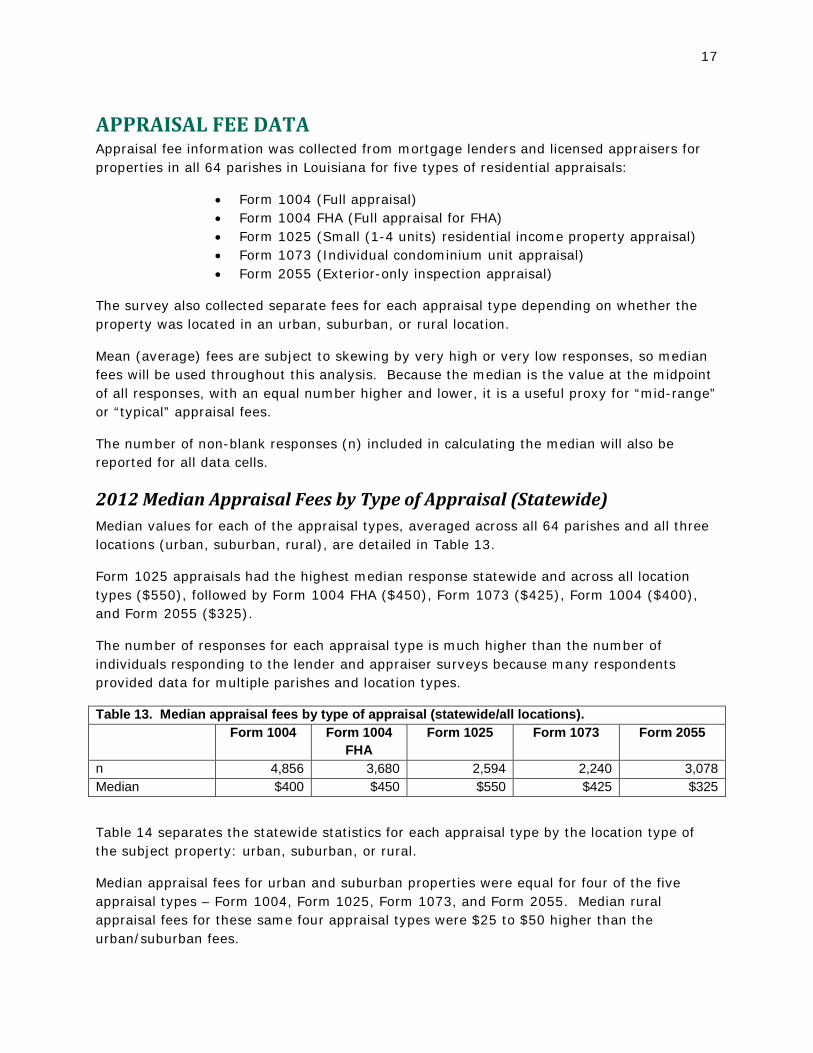
APPRAISAL FEE DATA Appraisal fee information was collected from mortgage lenders and licensed appraisers for properties in all 64 parishes in Louisiana for five types of residential appraisals:
• Form 1004 (Full appraisal) • Form 1004 FHA (Full appraisal for FHA) • Form 1025 (Small (1-4 units) residential income property appraisal) • Form 1073 (Individual condominium unit appraisal) • Form 2055 (Exterior-only inspection appraisal)
The survey also collected separate fees for each appraisal type depending on whether the property was located in an urban, suburban, or rural location.
Mean (average) fees are subject to skewing by very high or very low responses, so median fees will be used throughout this analysis. Because the median is the value at the midpoint of all responses, with an equal number higher and lower, it is a useful proxy for “mid-range” or “typical” appraisal fees.
The number of non-blank responses (n) included in calculating the median will also be reported for all data cells.
2012 Median Appraisal Fees by Type of Appraisal (Statewide) Median values for each of the appraisal types, averaged across all 64 parishes and all three locations (urban, suburban, rural), are detailed in Table 13.
Form 1025 appraisals had the highest median response statewide and across all location types ($550), followed by Form 1004 FHA ($450), Form 1073 ($425), Form 1004 ($400), and Form 2055 ($325).
The number of responses for each appraisal type is much higher than the number of individuals responding to the lender and appraiser surveys because many respondents provided data for multiple parishes and location types.
Table 13. Median appraisal fees by type of appraisal (statewide/all locations). Form 1004 Form 1004
FHA Form 1025 Form 1073 Form 2055
n 4,856 3,680 2,594 2,240 3,078 Median $400 $450 $550 $425 $325
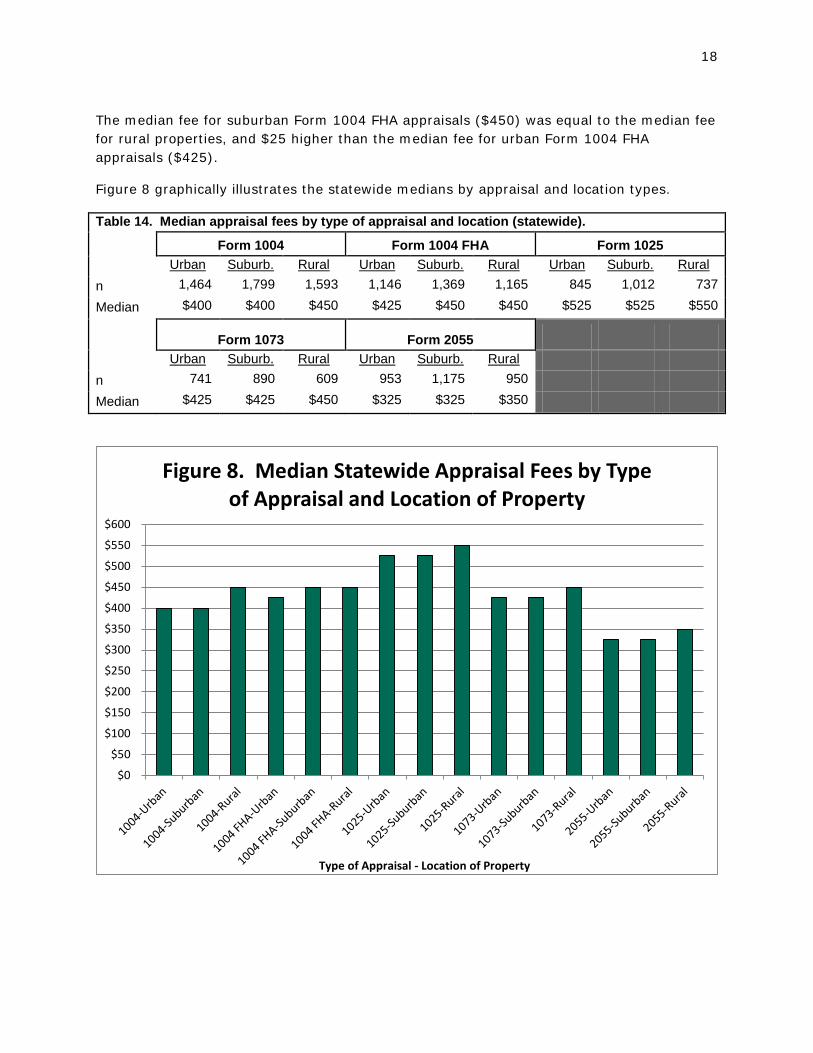
Table 14 separates the statewide statistics for each appraisal type by the location type of the subject property: urban, suburban, or rural.
Median appraisal fees for urban and suburban properties were equal for four of the five appraisal types – Form 1004, Form 1025, Form 1073, and Form 2055. Median rural appraisal fees for these same four appraisal types were $25 to $50 higher than the urban/suburban fees.
18
The median fee for suburban Form 1004 FHA appraisals ($450) was equal to the median fee for rural properties, and $25 higher than the median fee for urban Form 1004 FHA appraisals ($425).
Figure 8 graphically illustrates the statewide medians by appraisal and location types.
Table 14. Median appraisal fees by type of appraisal and location (statewide). Form 1004 Form 1004 FHA Form 1025 Urban Suburb. Rural Urban Suburb. Rural Urban Suburb. Rural n 1,464 1,799 1,593 1,146 1,369 1,165 845 1,012 737
Median $400 $400 $450 $425 $450 $450 $525 $525 $550
Form 1073 Form 2055
Urban Suburb. Rural Urban Suburb. Rural n 741 890 609 953 1,175 950
Median $425 $425 $450 $325 $325 $350
$0
$50
$100
$150
$200
$250
$300
$350
$400
$450
$500
$550
$600
Type of Appraisal - Location of Property
Figure 8. Median Statewide Appraisal Fees by Type of Appraisal and Location of Property
19
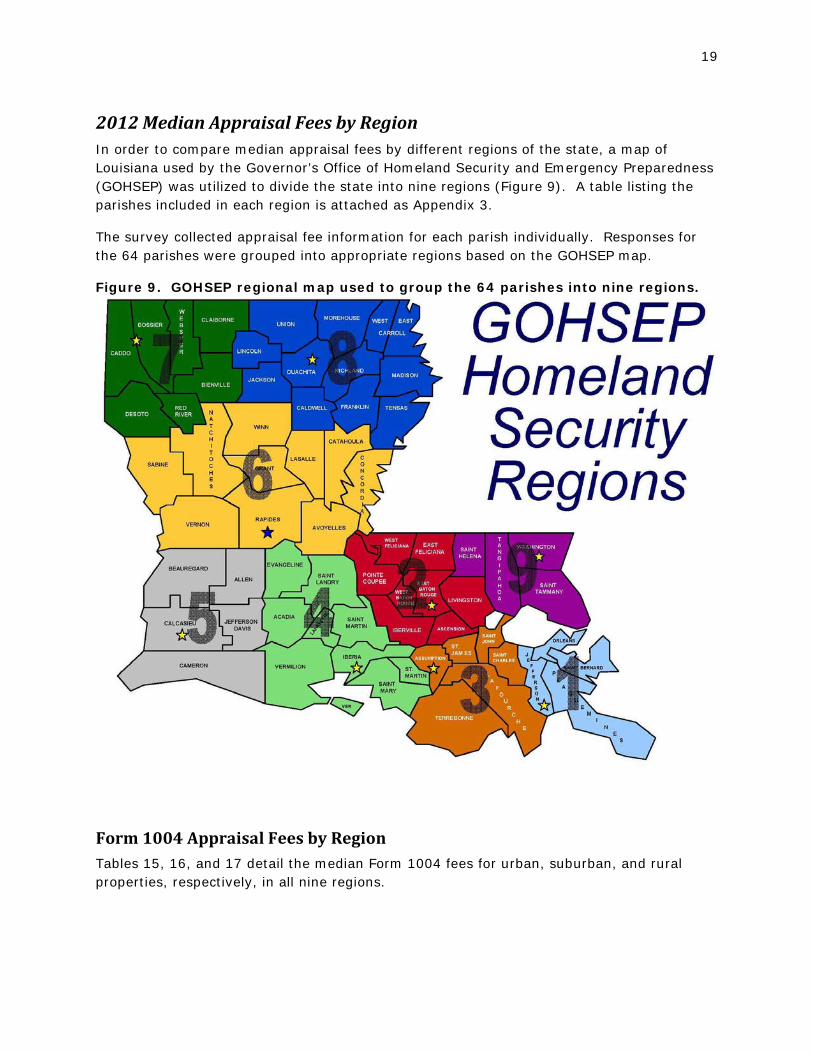
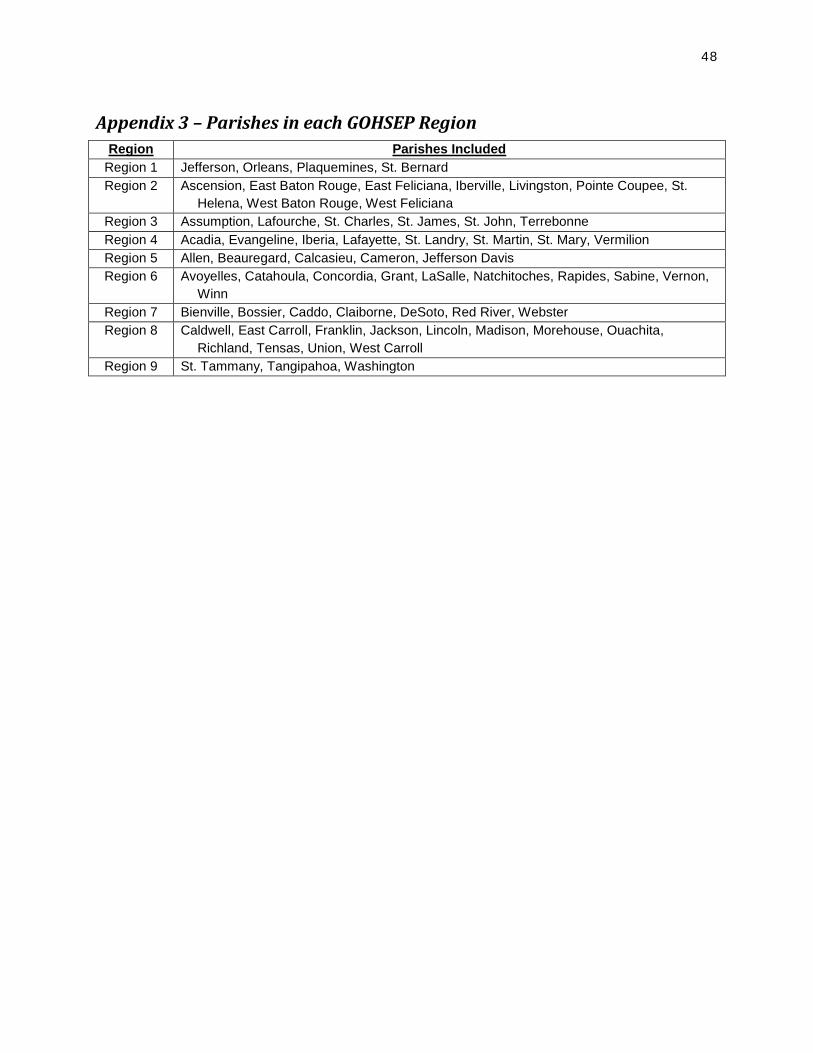
2012 Median Appraisal Fees by Region In order to compare median appraisal fees by different regions of the state, a map of Louisiana used by the Governor’s Office of Homeland Security and Emergency Preparedness (GOHSEP) was utilized to divide the state into nine regions (Figure 9). A table listing the parishes included in each region is attached as Appendix 3.
The survey collected appraisal fee information for each parish individually. Responses for the 64 parishes were grouped into appropriate regions based on the GOHSEP map.
Figure 9. GOHSEP regional map used to group the 64 parishes into nine regions.
Form 1004 Appraisal Fees by Region Tables 15, 16, and 17 detail the median Form 1004 fees for urban, suburban, and rural properties, respectively, in all nine regions.
20
Median Form 1004 fees for urban and suburban properties (Tables 15 & 16) were no different from each other, and were highest in Regions 4 and 6 ($425). Median urban and suburban fees in the other seven regions were all equal at $400.
Table 15. Median Form 1004 appraisal fees for URBAN properties by region.
Region
1 Region
2 Region
3 Region
4 Region
5 Region
6 Region
7 Region
8 Region
9 n 258 372 141 196 95 82 119 50 151 Median $400 $400 $400 $425 $400 $425 $400 $400 $400 Table 16. Median Form 1004 appraisal fees for SUBURBAN properties by region.
Region
1 Region
2 Region
3 Region
4 Region
5 Region
6 Region
7 Region
8 Region
9 n 326 438 219 241 104 81 118 58 214 Median $400 $400 $400 $425 $400 $425 $400 $400 $400
Median Form 1004 fees for rural properties (Table 17) were $50 higher than median urban/suburban fees in Regions 2, 7, and 9, $25 higher in Regions 1, 3, 4 and 6, and equal in Regions 5 and 8.
Table 17. Median Form 1004 appraisal fees for RURAL properties by region.
Region
1 Region
2 Region
3 Region
4 Region
5 Region
6 Region
7 Region
8 Region
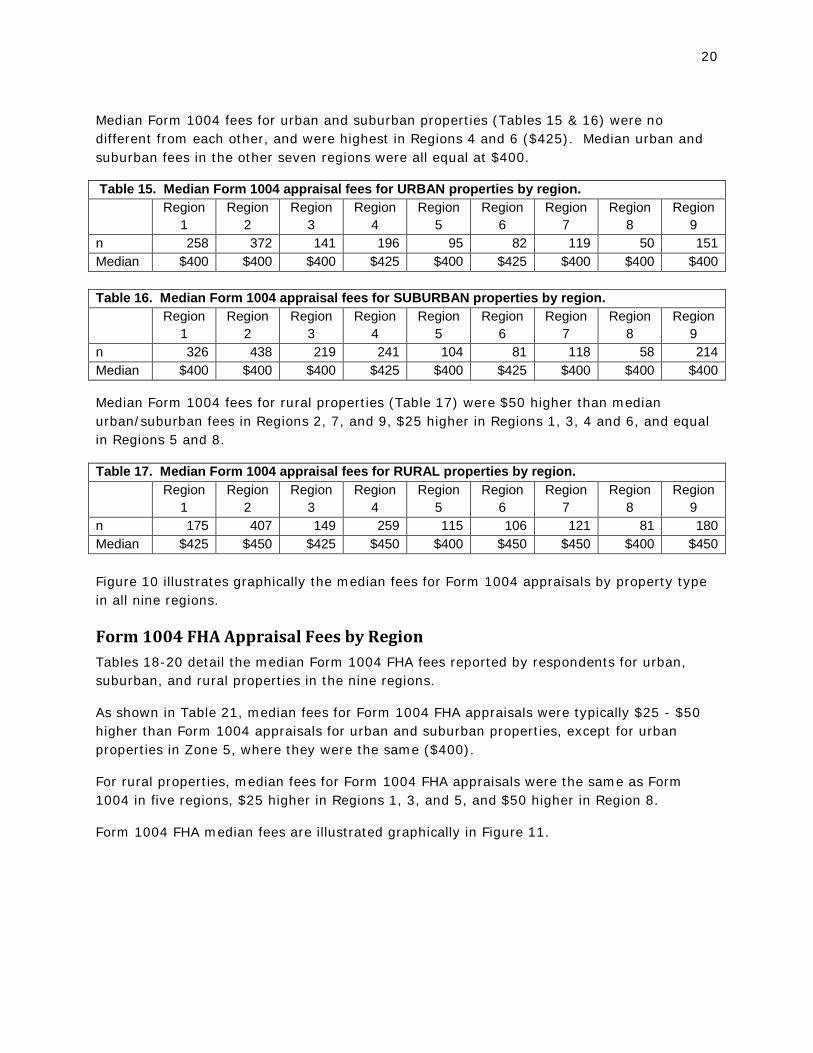
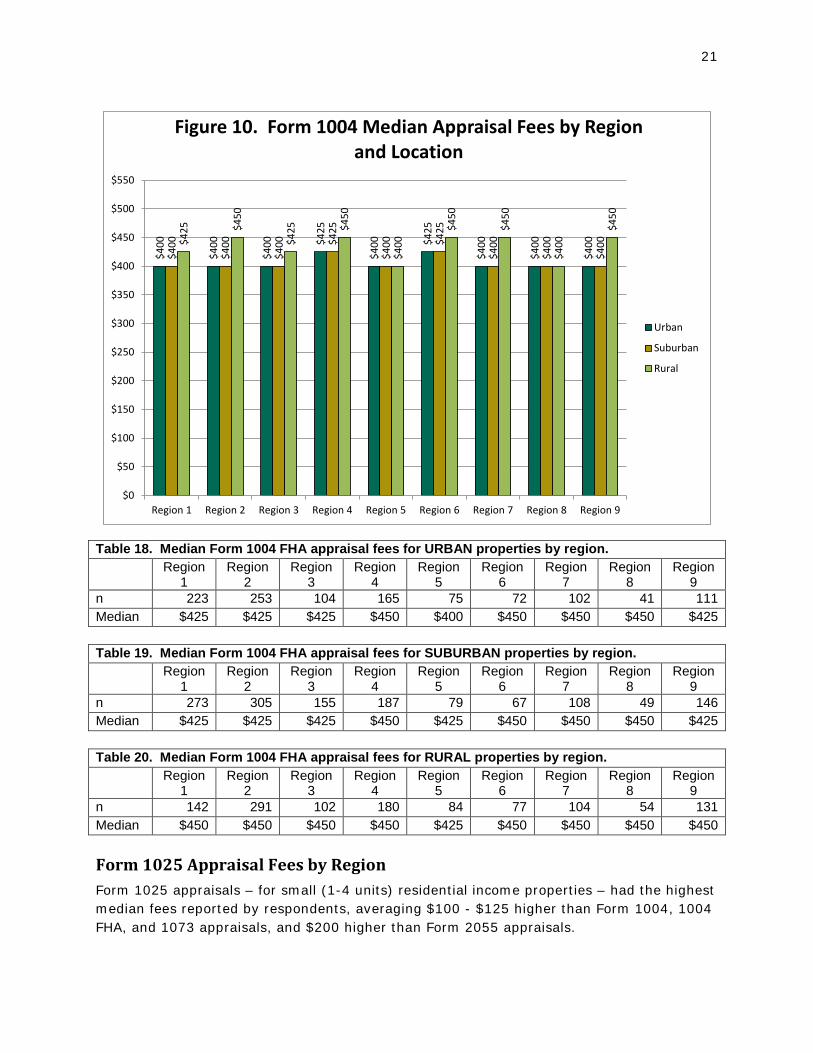
9 n 175 407 149 259 115 106 121 81 180 Median $425 $450 $425 $450 $400 $450 $450 $400 $450 Figure 10 illustrates graphically the median fees for Form 1004 appraisals by property type in all nine regions.
Form 1004 FHA Appraisal Fees by Region Tables 18-20 detail the median Form 1004 FHA fees reported by respondents for urban, suburban, and rural properties in the nine regions.
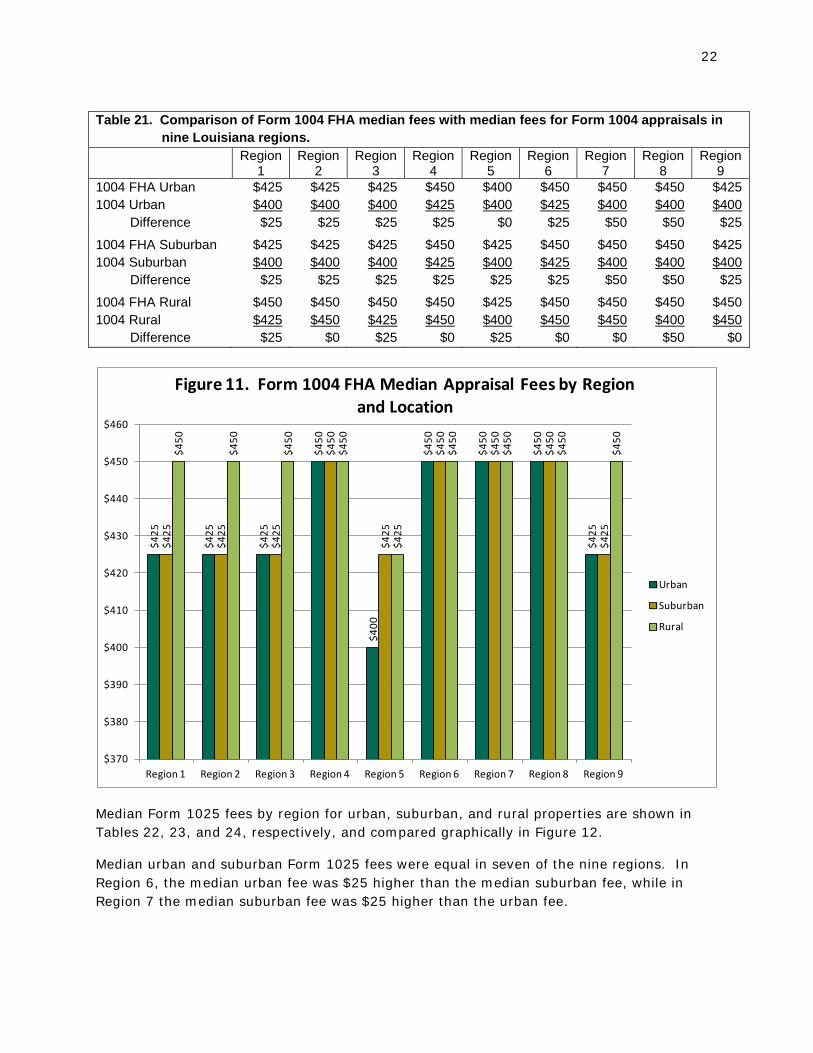
As shown in Table 21, median fees for Form 1004 FHA appraisals were typically $25 - $50 higher than Form 1004 appraisals for urban and suburban properties, except for urban properties in Zone 5, where they were the same ($400).
For rural properties, median fees for Form 1004 FHA appraisals were the same as Form 1004 in five regions, $25 higher in Regions 1, 3, and 5, and $50 higher in Region 8.
Form 1004 FHA median fees are illustrated graphically in Figure 11.
21
$400
$400
$400 $4
25
$400 $4
25
$400
$400
$400
$400
$400
$400 $4
25
$400 $4
25
$400
$400
$400$4
25 $450
$425 $4
50
$400
$450
$450
$400
$450
$0
$50
$100
$150
$200
$250
$300
$350
$400
$450
$500
$550
Region 1 Region 2 Region 3 Region 4 Region 5 Region 6 Region 7 Region 8 Region 9
Figure 10. Form 1004 Median Appraisal Fees by Region and Location
Urban
Suburban
Rural
Table 18. Median Form 1004 FHA appraisal fees for URBAN properties by region.
Region
1 Region
2 Region
3 Region
4 Region
5 Region
6 Region
7 Region
8 Region
9 n 223 253 104 165 75 72 102 41 111 Median $425 $425 $425 $450 $400 $450 $450 $450 $425 Table 19. Median Form 1004 FHA appraisal fees for SUBURBAN properties by region.
Region
1 Region
2 Region
3 Region
4 Region
5 Region
6 Region
7 Region
8 Region
9 n 273 305 155 187 79 67 108 49 146 Median $425 $425 $425 $450 $425 $450 $450 $450 $425 Table 20. Median Form 1004 FHA appraisal fees for RURAL properties by region.
Region
1 Region
2 Region
3 Region
4 Region
5 Region
6 Region
7 Region
8 Region
9 n 142 291 102 180 84 77 104 54 131 Median $450 $450 $450 $450 $425 $450 $450 $450 $450
Form 1025 Appraisal Fees by Region Form 1025 appraisals – for small (1-4 units) residential income properties – had the highest median fees reported by respondents, averaging $100 - $125 higher than Form 1004, 1004 FHA, and 1073 appraisals, and $200 higher than Form 2055 appraisals.
22
Table 21. Comparison of Form 1004 FHA median fees with median fees for Form 1004 appraisals in nine Louisiana regions.
Region
1 Region
2 Region
3 Region
4 Region
5 Region
6 Region
7 Region
8 Region
9 1004 FHA Urban $425 $425 $425 $450 $400 $450 $450 $450 $425 1004 Urban $400 $400 $400 $425 $400 $425 $400 $400 $400
Difference $25 $25 $25 $25 $0 $25 $50 $50 $25 1004 FHA Suburban $425 $425 $425 $450 $425 $450 $450 $450 $425 1004 Suburban $400 $400 $400 $425 $400 $425 $400 $400 $400
Difference $25 $25 $25 $25 $25 $25 $50 $50 $25 1004 FHA Rural $450 $450 $450 $450 $425 $450 $450 $450 $450 1004 Rural $425 $450 $425 $450 $400 $450 $450 $400 $450
Difference $25 $0 $25 $0 $25 $0 $0 $50 $0
$425
$425
$425
$450
$400
$450
$450
$450
$425
$425
$425
$425
$450
$425
$450
$450
$450
$425
$450
$450
$450
$450
$425
$450
$450
$450
$450
$370
$380
$390
$400
$410
$420
$430
$440
$450
$460
Region 1 Region 2 Region 3 Region 4 Region 5 Region 6 Region 7 Region 8 Region 9
Figure 11. Form 1004 FHA Median Appraisal Fees by Region and Location
Urban
Suburban
Rural
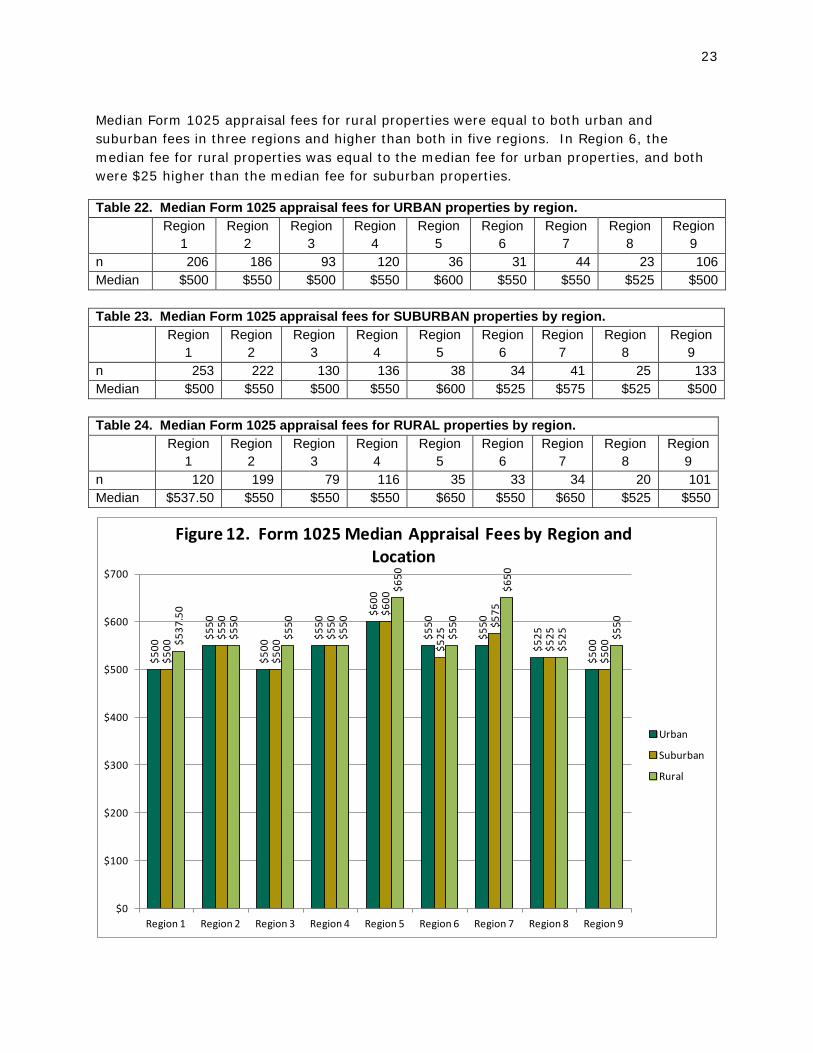
Median Form 1025 fees by region for urban, suburban, and rural properties are shown in Tables 22, 23, and 24, respectively, and compared graphically in Figure 12.
Median urban and suburban Form 1025 fees were equal in seven of the nine regions. In Region 6, the median urban fee was $25 higher than the median suburban fee, while in Region 7 the median suburban fee was $25 higher than the urban fee.
23
Median Form 1025 appraisal fees for rural properties were equal to both urban and suburban fees in three regions and higher than both in five regions. In Region 6, the median fee for rural properties was equal to the median fee for urban properties, and both were $25 higher than the median fee for suburban properties.
Table 22. Median Form 1025 appraisal fees for URBAN properties by region.
Region
1 Region
2 Region
3 Region
4 Region
5 Region
6 Region
7 Region
8 Region
9 n 206 186 93 120 36 31 44 23 106 Median $500 $550 $500 $550 $600 $550 $550 $525 $500 Table 23. Median Form 1025 appraisal fees for SUBURBAN properties by region.
Region
1 Region
2 Region
3 Region
4 Region
5 Region
6 Region
7 Region
8 Region
9 n 253 222 130 136 38 34 41 25 133 Median $500 $550 $500 $550 $600 $525 $575 $525 $500 Table 24. Median Form 1025 appraisal fees for RURAL properties by region.
Region
1 Region
2 Region
3 Region
4 Region
5 Region
6 Region
7 Region
8 Region
9 n 120 199 79 116 35 33 34 20 101 Median $537.50 $550 $550 $550 $650 $550 $650 $525 $550
$500
$550
$500
$550
$600
$550
$550
$525
$500
$500
$550
$500
$550
$600
$525
$575
$525
$500$5
37.5
0
$550
$550
$550
$650
$550
$650
$525 $5
50
$0
$100
$200
$300
$400
$500
$600
$700
Region 1 Region 2 Region 3 Region 4 Region 5 Region 6 Region 7 Region 8 Region 9
Figure 12. Form 1025 Median Appraisal Fees by Region and Location
Urban
Suburban
Rural
24
Form 1073 Appraisal Fees by Region Form 1073 appraisals – for individual condominium units - had similar median fees to Form 1004/1004-FHA appraisals in several regions, but were somewhat higher in Regions 5, 6, and 8 (Tables 25-27).
Table 25. Median Form 1073 appraisal fees for URBAN properties by region.
Region
1 Region
2 Region
3 Region
4 Region
5 Region
6 Region
7 Region
8 Region
9 n 193 196 83 91 16 19 46 7 90 Median $400 $400 $400 $450 $525 $500 $437.50 $500 $400
Table 26. Median Form 1073 appraisal fees for SUBURBAN properties by region.
Region
1 Region
2 Region
3 Region
4 Region
5 Region
6 Region
7 Region
8 Region
9 n 231 235 113 107 16 21 41 7 119 Median $400 $400 $400 $450 $525 $500 $450 $550 $400
Table 27. Median Form 1073 appraisal fees for RURAL properties by region.
Region
1 Region
2 Region
3 Region
4 Region
5 Region
6 Region
7 Region
8 Region
9 n 103 196 64 92 14 19 31 4 86 Median $425 $450 $425 $450 $550 $500 $450 $537.50 $450
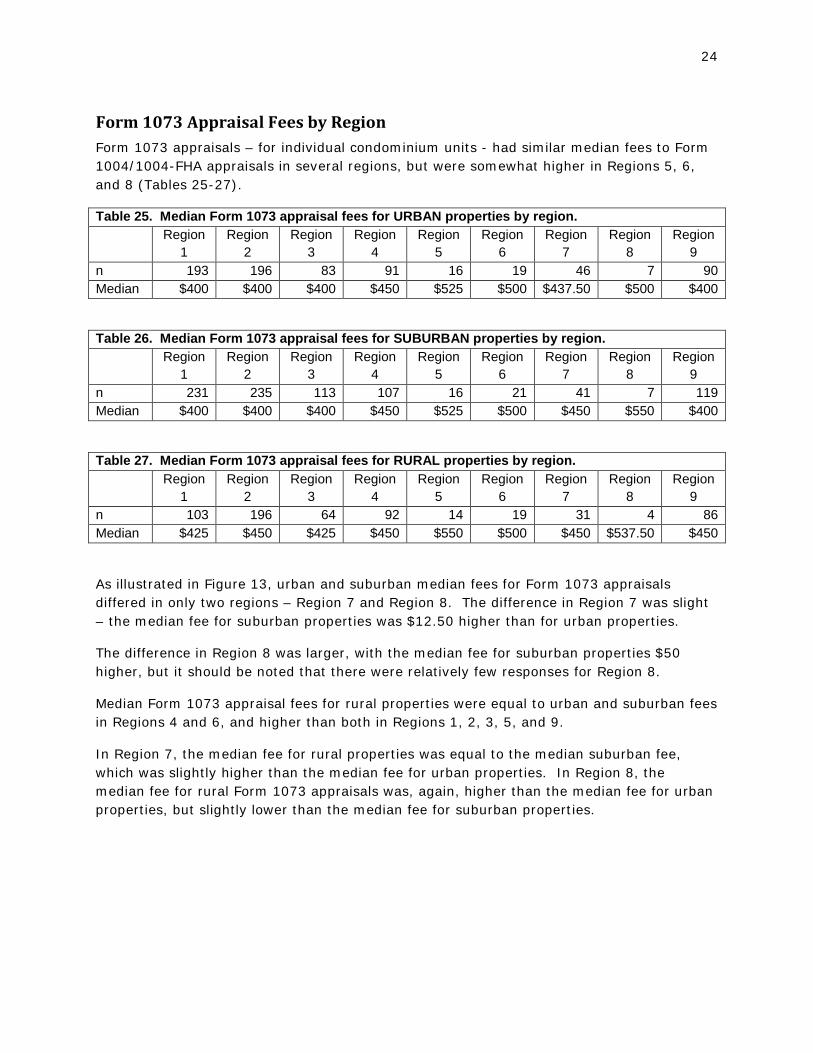
As illustrated in Figure 13, urban and suburban median fees for Form 1073 appraisals differed in only two regions – Region 7 and Region 8. The difference in Region 7 was slight – the median fee for suburban properties was $12.50 higher than for urban properties.
The difference in Region 8 was larger, with the median fee for suburban properties $50 higher, but it should be noted that there were relatively few responses for Region 8.
Median Form 1073 appraisal fees for rural properties were equal to urban and suburban fees in Regions 4 and 6, and higher than both in Regions 1, 2, 3, 5, and 9.
In Region 7, the median fee for rural properties was equal to the median suburban fee, which was slightly higher than the median fee for urban properties. In Region 8, the median fee for rural Form 1073 appraisals was, again, higher than the median fee for urban properties, but slightly lower than the median fee for suburban properties.
25
$400
$400
$400
$450
$525
$500
$437
.50 $5
00
$400
$400
$400
$400
$450
$525
$500
$450
$550
$400$4
25 $450
$425 $4
50
$550
$500
$450
$537
.50
$450
$0
$100
$200
$300
$400
$500
$600
Region 1 Region 2 Region 3 Region 4 Region 5 Region 6 Region 7 Region 8 Region 9
Figure 13. Form 1073 Median Appraisal Fees by Region and Location
Urban
Suburban
Rural
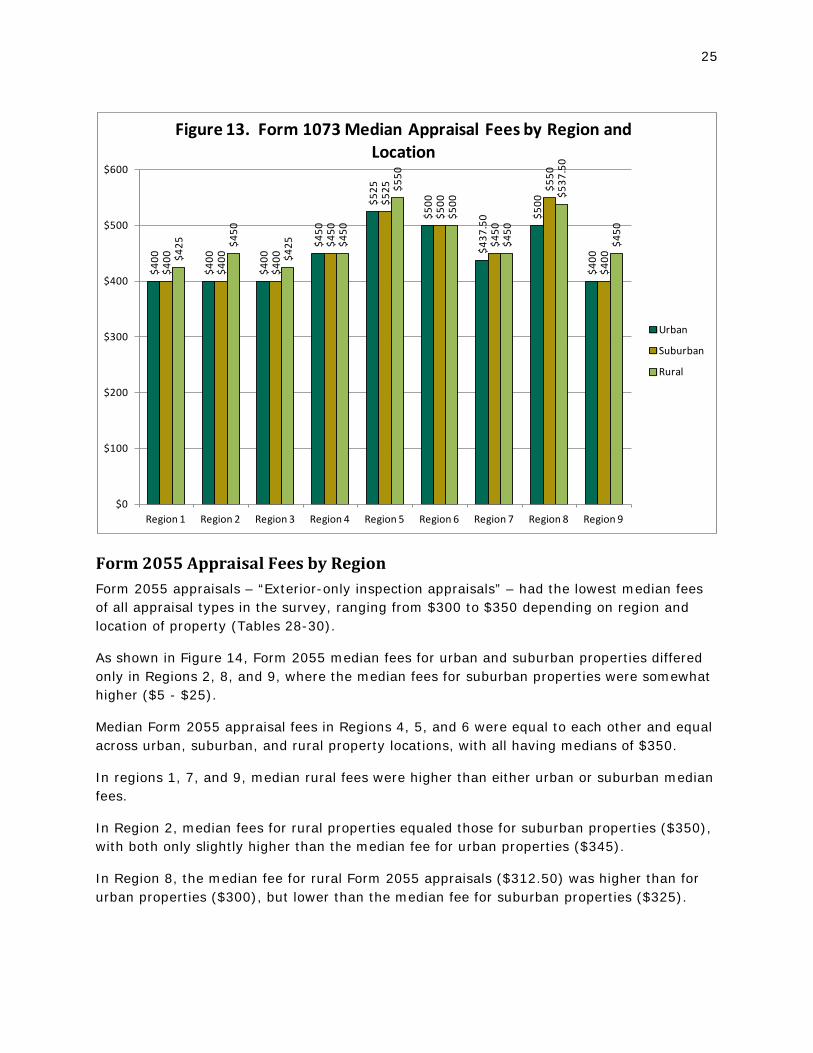
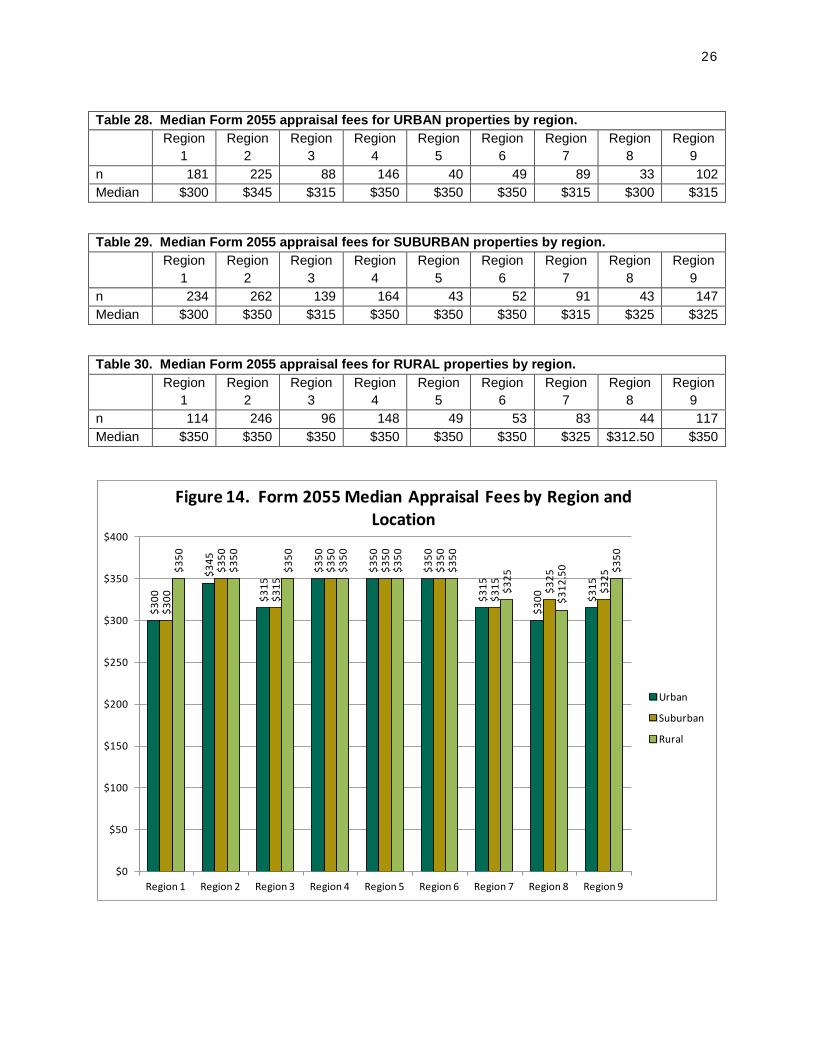
Form 2055 Appraisal Fees by Region Form 2055 appraisals – “Exterior-only inspection appraisals” – had the lowest median fees of all appraisal types in the survey, ranging from $300 to $350 depending on region and location of property (Tables 28-30).
As shown in Figure 14, Form 2055 median fees for urban and suburban properties differed only in Regions 2, 8, and 9, where the median fees for suburban properties were somewhat higher ($5 - $25).
Median Form 2055 appraisal fees in Regions 4, 5, and 6 were equal to each other and equal across urban, suburban, and rural property locations, with all having medians of $350.
In regions 1, 7, and 9, median rural fees were higher than either urban or suburban median fees.
In Region 2, median fees for rural properties equaled those for suburban properties ($350), with both only slightly higher than the median fee for urban properties ($345).
In Region 8, the median fee for rural Form 2055 appraisals ($312.50) was higher than for urban properties ($300), but lower than the median fee for suburban properties ($325).
26
Table 28. Median Form 2055 appraisal fees for URBAN properties by region.
Region
1 Region
2 Region
3 Region
4 Region
5 Region
6 Region
7 Region
8 Region
9 n 181 225 88 146 40 49 89 33 102 Median $300 $345 $315 $350 $350 $350 $315 $300 $315
Table 29. Median Form 2055 appraisal fees for SUBURBAN properties by region.
Region
1 Region
2 Region
3 Region
4 Region
5 Region
6 Region
7 Region
8 Region
9 n 234 262 139 164 43 52 91 43 147 Median $300 $350 $315 $350 $350 $350 $315 $325 $325
Table 30. Median Form 2055 appraisal fees for RURAL properties by region.
Region
1 Region
2 Region
3 Region
4 Region
5 Region
6 Region
7 Region
8 Region
9 n 114 246 96 148 49 53 83 44 117 Median $350 $350 $350 $350 $350 $350 $325 $312.50 $350
$300
$345
$315
$350
$350
$350
$315
$300 $3
15
$300
$350
$315
$350
$350
$350
$315 $3
25
$325
$350
$350
$350
$350
$350
$350
$325
$312
.50 $3
50
$0
$50
$100
$150
$200
$250
$300
$350
$400
Region 1 Region 2 Region 3 Region 4 Region 5 Region 6 Region 7 Region 8 Region 9
Figure 14. Form 2055 Median Appraisal Fees by Region and Location
Urban
Suburban
Rural
27
ADDITIONAL APPRAISAL FEE ADJUSTMENTS
The appraisal fees collected in the survey and discussed in the preceding sections were for “typical” appraisals and should be considered as minimum or baseline fees for the various types of appraisals.
Fees may need to be adjusted upward for complex, unique, or high-value properties, or for properties at distant locations requiring significant travel.
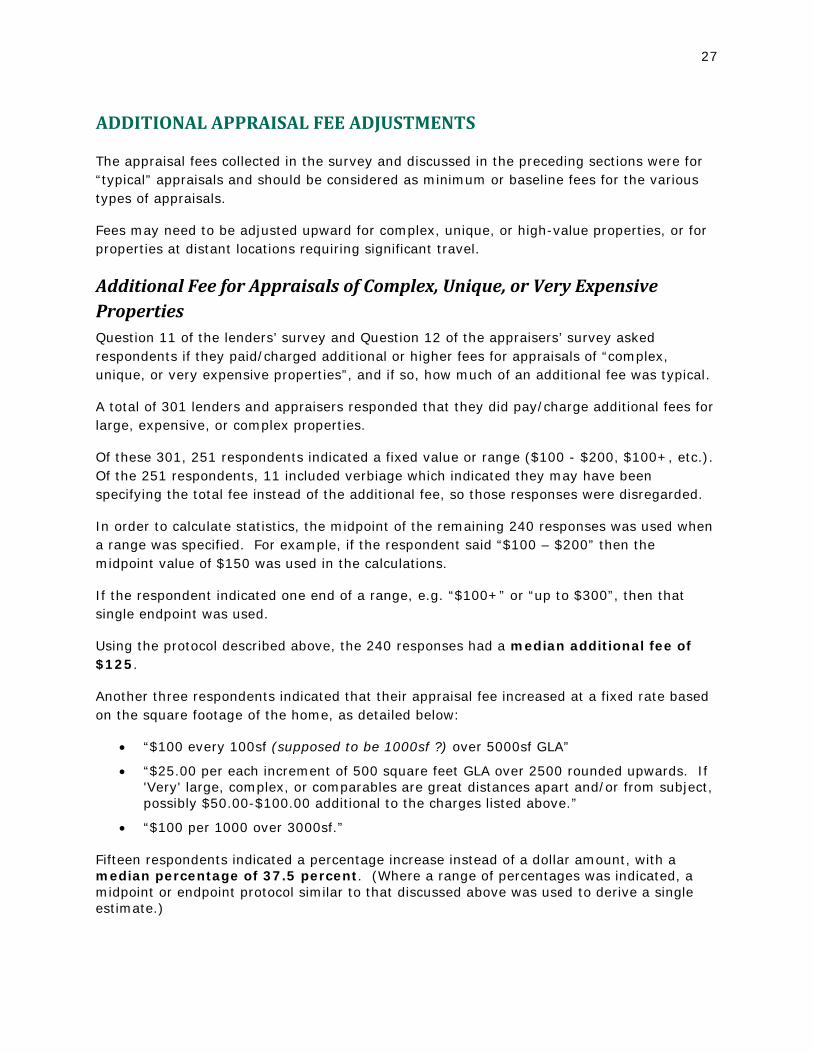
Additional Fee for Appraisals of Complex, Unique, or Very Expensive Properties Question 11 of the lenders’ survey and Question 12 of the appraisers’ survey asked respondents if they paid/charged additional or higher fees for appraisals of “complex, unique, or very expensive properties”, and if so, how much of an additional fee was typical.
A total of 301 lenders and appraisers responded that they did pay/charge additional fees for large, expensive, or complex properties.
Of these 301, 251 respondents indicated a fixed value or range ($100 - $200, $100+, etc.). Of the 251 respondents, 11 included verbiage which indicated they may have been specifying the total fee instead of the additional fee, so those responses were disregarded.
In order to calculate statistics, the midpoint of the remaining 240 responses was used when a range was specified. For example, if the respondent said “$100 – $200” then the midpoint value of $150 was used in the calculations.
If the respondent indicated one end of a range, e.g. “$100+” or “up to $300”, then that single endpoint was used.
Using the protocol described above, the 240 responses had a median additional fee of $125.
Another three respondents indicated that their appraisal fee increased at a fixed rate based on the square footage of the home, as detailed below:
• “$100 every 100sf (supposed to be 1000sf ?) over 5000sf GLA”
• “$25.00 per each increment of 500 square feet GLA over 2500 rounded upwards. If 'Very' large, complex, or comparables are great distances apart and/or from subject, possibly $50.00-$100.00 additional to the charges listed above.”
• “$100 per 1000 over 3000sf.” Fifteen respondents indicated a percentage increase instead of a dollar amount, with a median percentage of 37.5 percent. (Where a range of percentages was indicated, a midpoint or endpoint protocol similar to that discussed above was used to derive a single estimate.)
28
Eighteen respondents did not specify a percentage or an amount, but said that the additional fee varied or depended on the characteristics of the property.
The remaining 13 respondents who indicated that they paid/charged higher fees for appraisals of large or complex properties did not indicate a typical amount or explanation, or provided an explanation that was not applicable.
Additional Fee for Appraisals of Properties in Remote or Distant Locations
Questions 12 – 13c of the lenders’ survey and Questions 13 – 14c of the appraisers’ survey asked respondents if they paid/charged additional or higher appraisal fees for properties in remote or distant locations, and, if so, what the typical increase was, how it was determined, and how it varied with distance.
Of the 372 respondents who answered the distance fee questions, 297 indicated that they did pay/charge additional fees for remote or distant locations, while 75 respondents said they did not.
Of the 297 who indicated that they paid/charged additional distance fees, 130 said the fee was a flat rate, and 120 of these provided information on typical fees. The median additional flat rate distance fee was $50, which was also the most common response (mode).
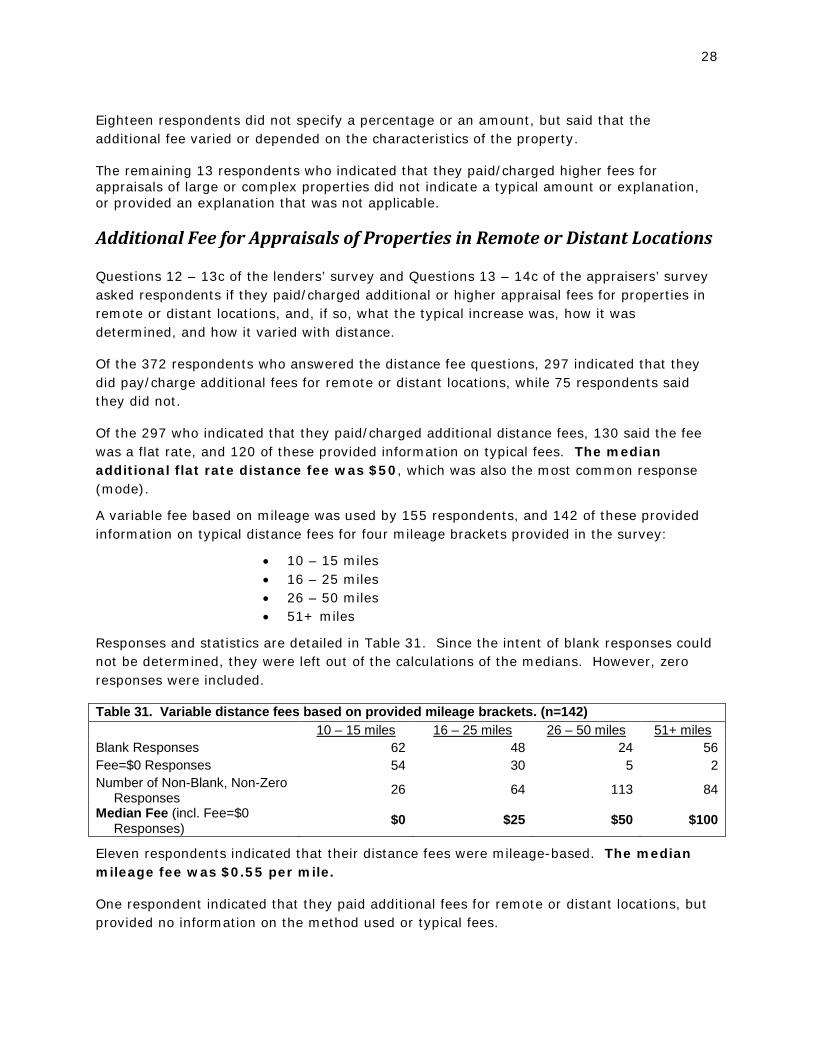
A variable fee based on mileage was used by 155 respondents, and 142 of these provided information on typical distance fees for four mileage brackets provided in the survey:
• 10 – 15 miles • 16 – 25 miles • 26 – 50 miles • 51+ miles
Responses and statistics are detailed in Table 31. Since the intent of blank responses could not be determined, they were left out of the calculations of the medians. However, zero responses were included.
Table 31. Variable distance fees based on provided mileage brackets. (n=142) 10 – 15 miles 16 – 25 miles 26 – 50 miles 51+ miles Blank Responses 62 48 24 56 Fee=$0 Responses 54 30 5 2 Number of Non-Blank, Non-Zero
Responses 26 64 113 84
Median Fee (incl. Fee=$0 Responses) $0 $25 $50 $100
Eleven respondents indicated that their distance fees were mileage-based. The median mileage fee was $0.55 per mile.
One respondent indicated that they paid additional fees for remote or distant locations, but provided no information on the method used or typical fees.
29
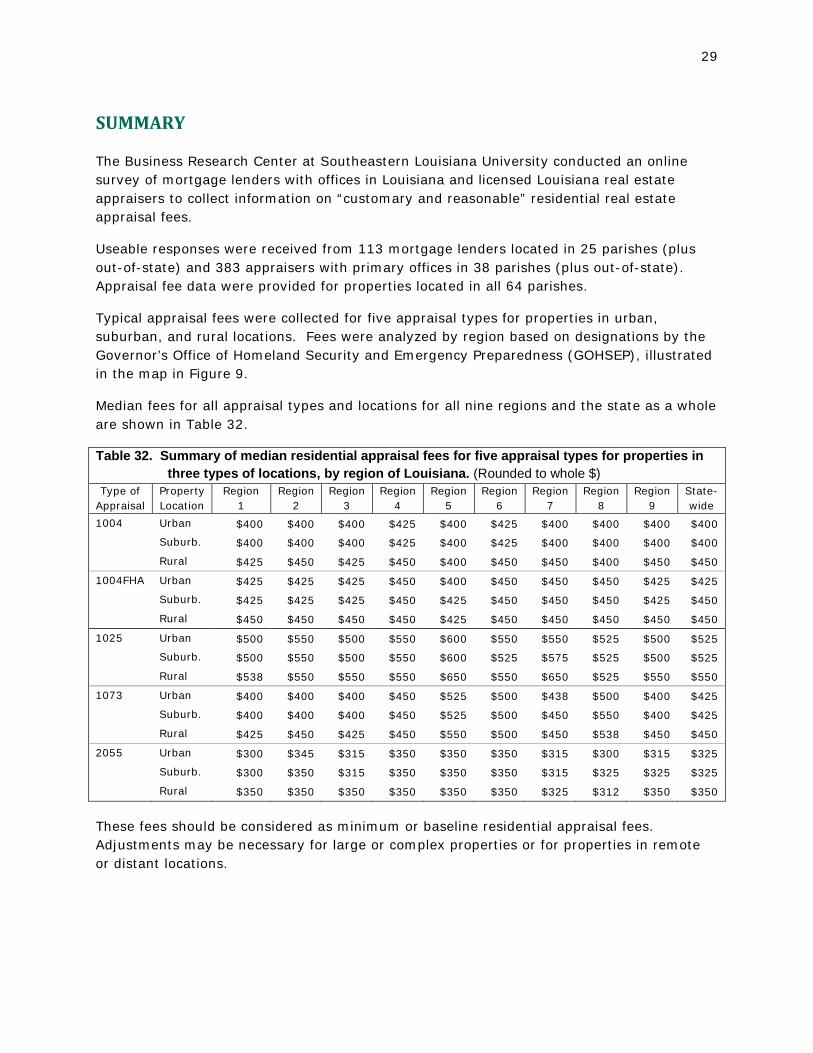
SUMMARY
The Business Research Center at Southeastern Louisiana University conducted an online survey of mortgage lenders with offices in Louisiana and licensed Louisiana real estate appraisers to collect information on “customary and reasonable” residential real estate appraisal fees.
Useable responses were received from 113 mortgage lenders located in 25 parishes (plus out-of-state) and 383 appraisers with primary offices in 38 parishes (plus out-of-state). Appraisal fee data were provided for properties located in all 64 parishes.
Typical appraisal fees were collected for five appraisal types for properties in urban, suburban, and rural locations. Fees were analyzed by region based on designations by the Governor’s Office of Homeland Security and Emergency Preparedness (GOHSEP), illustrated in the map in Figure 9.
Median fees for all appraisal types and locations for all nine regions and the state as a whole are shown in Table 32.
Table 32. Summary of median residential appraisal fees for five appraisal types for properties in three types of locations, by region of Louisiana. (Rounded to whole $)
Type of Appraisal
Property Location
Region 1
Region 2
Region 3
Region 4
Region 5
Region 6
Region 7
Region 8
Region 9
State-wide
1004 Urban $400 $400 $400 $425 $400 $425 $400 $400 $400 $400
Suburb. $400 $400 $400 $425 $400 $425 $400 $400 $400 $400
Rural $425 $450 $425 $450 $400 $450 $450 $400 $450 $450
1004FHA Urban $425 $425 $425 $450 $400 $450 $450 $450 $425 $425
Suburb. $425 $425 $425 $450 $425 $450 $450 $450 $425 $450
Rural $450 $450 $450 $450 $425 $450 $450 $450 $450 $450
1025 Urban $500 $550 $500 $550 $600 $550 $550 $525 $500 $525
Suburb. $500 $550 $500 $550 $600 $525 $575 $525 $500 $525
Rural $538 $550 $550 $550 $650 $550 $650 $525 $550 $550
1073 Urban $400 $400 $400 $450 $525 $500 $438 $500 $400 $425
Suburb. $400 $400 $400 $450 $525 $500 $450 $550 $400 $425
Rural $425 $450 $425 $450 $550 $500 $450 $538 $450 $450
2055 Urban $300 $345 $315 $350 $350 $350 $315 $300 $315 $325
Suburb. $300 $350 $315 $350 $350 $350 $315 $325 $325 $325
Rural $350 $350 $350 $350 $350 $350 $325 $312 $350 $350
These fees should be considered as minimum or baseline residential appraisal fees. Adjustments may be necessary for large or complex properties or for properties in remote or distant locations.
30
APPENDICES
Appendix 1 – Lender Survey Instrument
31
32
33

34
35
36
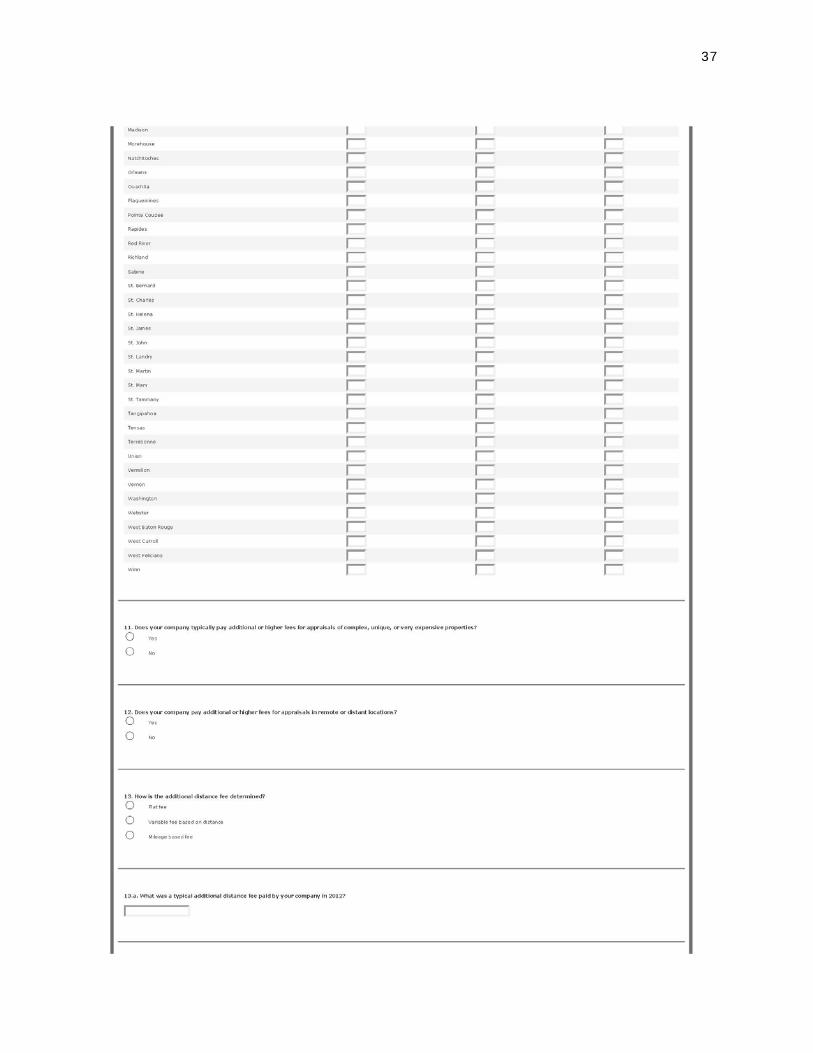
37

38
39
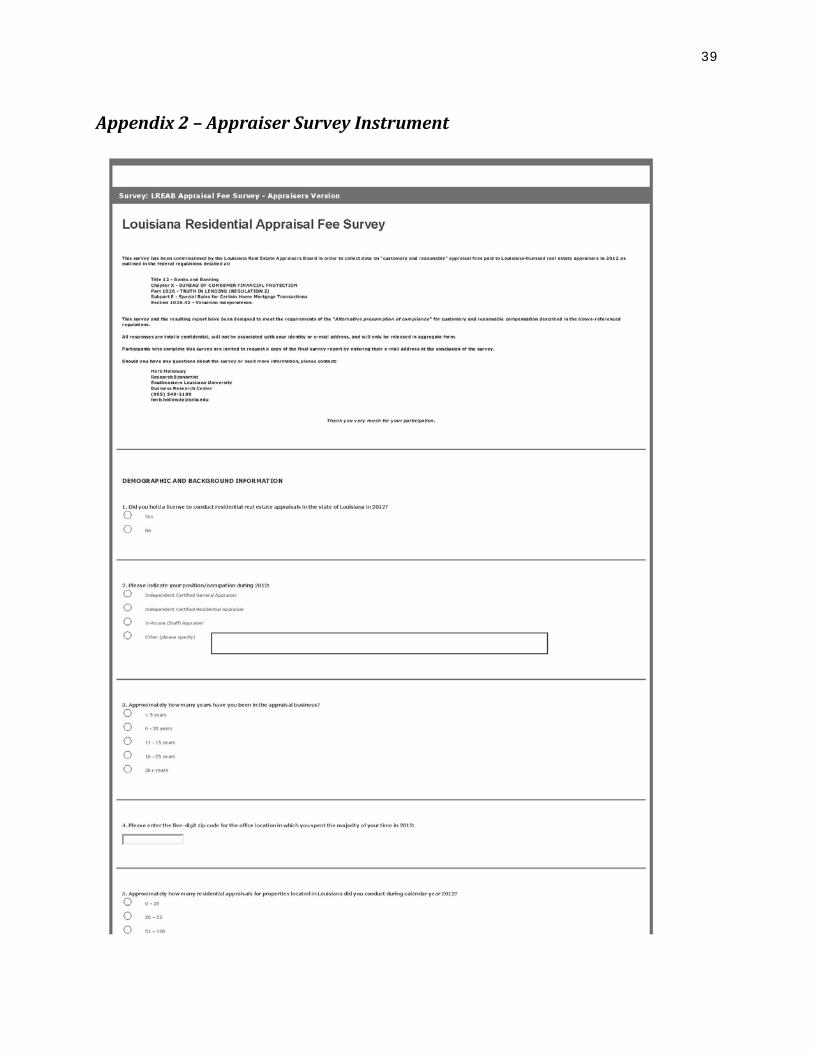
Appendix 2 – Appraiser Survey Instrument
40
41
42
43

44

45

46
47
48
Appendix 3 – Parishes in each GOHSEP Region Region Parishes Included
Region 1 Jefferson, Orleans, Plaquemines, St. Bernard Region 2 Ascension, East Baton Rouge, East Feliciana, Iberville, Livingston, Pointe Coupee, St.
Helena, West Baton Rouge, West Feliciana Region 3 Assumption, Lafourche, St. Charles, St. James, St. John, Terrebonne Region 4 Acadia, Evangeline, Iberia, Lafayette, St. Landry, St. Martin, St. Mary, Vermilion Region 5 Allen, Beauregard, Calcasieu, Cameron, Jefferson Davis Region 6 Avoyelles, Catahoula, Concordia, Grant, LaSalle, Natchitoches, Rapides, Sabine, Vernon,
Winn Region 7 Bienville, Bossier, Caddo, Claiborne, DeSoto, Red River, Webster Region 8 Caldwell, East Carroll, Franklin, Jackson, Lincoln, Madison, Morehouse, Ouachita,
Richland, Tensas, Union, West Carroll Region 9 St. Tammany, Tangipahoa, Washington