loss in species caused by tropical deforestation and their
TRANSCRIPT

Royal Swedish Academy of Sciences
Loss in Species Caused by Tropical Deforestation and Their Recovery through ManagementAuthor(s): Ariel E. Lugo, John A. Parrotta, Sandra BrownSource: Ambio, Vol. 22, No. 2/3, Biodiversity: Ecology, Economics, Policy (May, 1993), pp. 106-109Published by: Allen Press on behalf of Royal Swedish Academy of SciencesStable URL: http://www.jstor.org/stable/4314054Accessed: 15/04/2009 16:34
Your use of the JSTOR archive indicates your acceptance of JSTOR's Terms and Conditions of Use, available athttp://www.jstor.org/page/info/about/policies/terms.jsp. JSTOR's Terms and Conditions of Use provides, in part, that unlessyou have obtained prior permission, you may not download an entire issue of a journal or multiple copies of articles, and youmay use content in the JSTOR archive only for your personal, non-commercial use.
Please contact the publisher regarding any further use of this work. Publisher contact information may be obtained athttp://www.jstor.org/action/showPublisher?publisherCode=acg.
Each copy of any part of a JSTOR transmission must contain the same copyright notice that appears on the screen or printedpage of such transmission.
JSTOR is a not-for-profit organization founded in 1995 to build trusted digital archives for scholarship. We work with thescholarly community to preserve their work and the materials they rely upon, and to build a common research platform thatpromotes the discovery and use of these resources. For more information about JSTOR, please contact [email protected].
Allen Press and Royal Swedish Academy of Sciences are collaborating with JSTOR to digitize, preserve andextend access to Ambio.
http://www.jstor.org

Ariel E. Lugo, John A. Parrotta and Sandra Brown
Loss in Species Caused by Tropical Deforestation and Their Recovery
Through Management
The loss of species as a result of deforestation and degradation of tropical forest lands is widely discussed. Models based on island biogeography theory are used to evaluate the relationship between extinctions of species and deforestation. The analysis shows that natural resiliency causes the models to overestimate the rates of species extinctions for given intensities of deforestation. There is an opportunity to couple natural processes with management activities to reduce species extinctions and restore species richness to degraded lands. As an example we show how tropical monoculture tree plantations can foster diverse native forests in areas previously deforested. The central point is that well-directed human actions provide us with the means to conserve biodiversity and restore it in locations previously degraded.
INTRODUCTION The classic monograph by McArthur and Wilson (1) on island biogeography visualized the number of species on an island as a balance between species gains by immigration and losses through extinction. Using this simple concept, McArthur and Wilson developed a quantitative theory to explain the number of species in islands at species steady state. Today the species-area relationship, upon which island biogeography theory is based, is used to estimate the extinction of species as a result of deforestation of tropical forest lands (2, 3). Little attention is given to the other side of the equation (gains of species on a site) to arrive at a better estimate of the actual number of species present following human modification of the landscape (4, 5). Our objective is to discuss both the losses and gains of species in damaged lands with particular attention to the opportunities for augmenting the numbers of species per unit area through management. We focus on the importance of managed forest stands as species refugia and more importantly, as tools forrestoring species richness in degraded sites. Studies in Caribbean island coffee plantations suggest that these human-managed ecosystems served as refuges for orchids (6) and avifauna (7) when high deforestation rates had consumed and/or fragmented available natural habitat.
MANAGEMENT FOR SPECIES DIVERSITY An important area of study in ecology is succession, or the changes that occur in ecosystems as they mature. A working hypothesis for which there are few exception-i.e., highly stressed ecosystems-is that as ecosystems mature, their net primary productivity decreases and their respiration, ecosystem metabolism, and species richness increase (8). In fact, ecologists suggested that the overall biotic complexity of ecosystems increases as net primary productivity decreases (8). The inverse relation between ecosystem complexity and net primary
productivity explains why monocultures are necessary when the management objective is to maximize net yield and profit. In fact, most agricultural and silvicultural prescriptions for maximizing yield involve the simplification of the ecosystem, by whatever means necessary, including weeding or poisoning of any species that may compete with those favored for their high yield and low respiration. In these cases, human labor, fossil fuels, and technology substitute for ecosystem metabolism and in so doing assures a measure of ecosystem stability.
Taken to the extreme, these techniques have given manage- ment a poor image in relation to current interests in maximizing biodiversity. The conflict between management for high-yield and maintaining biodiversity cannot be reconciled in high yield systems such as clonal forestry or hydroponic agriculture, be- cause the measures taken to increase yields are extreme and the biota is reduced to almost uniform genetic material. As a result, management and monocultures are commonly viewed as irrel- evant to the solution of preserving, conserving, or restoring biodiversity in the landscape.
It is unfortunate that extreme application of management systems that result in high biomass yields have led to a general repudiation of management activities with regards to the con- servation of biodiversity. We propose that management activi- ties, including the use of monoculture tree plantations, can be useful for restoring the species composition of damaged sites. To put management activities in context we will discuss first the relationship between species extinctions and deforestation.
DEFORESTATION AND SPECIES EXTINCTIONS The relationship between deforestation and species extinctions, using the species-area model of McArthur and Wilson (1) is shown in equation 1 where: S = the number of species, A = the area, and C is a parameter that depends on the taxon, its population density, and biogeographic region.
S = CAZ (equation 1)
The shape of the species-area curve is determined by Z (Fig. 1), a factor that is < 0.7 (9). Most regions of the world are char- acterized by Z factors between 0.16 and 0.39. Islands tend to have Z factors of about 0.35 while comparable continental areas have Z factors of about 0.20 (9). However, the Z factor increases as the area under consideration becomes smaller. For Caribbean islands, tree and plant species-area curves, covering up to 1500 kM2, had Z factors of 0.12 and 0.23 for trees and all plant spe- cies, respectively (10). Other examples, using tree species data for even smaller areas, had Z factors of 0.67 and 0.68 for dry and wet forests and 0.47 for lower montane rainforests (1 1).
The predicted magnitude of the extinction of species in rela- tion to the loss of forest area is a function of the Z factor (Fig. 1). The model is very sensitive to Z and thus allows for a wide envelope of extinctions given a similar magnitude of deforesta-
106 AMBIO VOL. 22 NO. 2-3, MAY 1993

tion. Unfortunately, an understanding of the factors that affect the value of Z is still incomplete (9). Nevertheless, when Z val- ues are low (< 0.20), the model predicts that more than 50% of the land area can be deforested before the slope of the extinction curve increases rapidly with increasing deforestation (Fig. 1). Conversely, at high Z values (> 0.60) the model suggests ex- tinction rates that are almost proportional to deforestation rates. For the model to predict rates of species extinctions that are faster than the rates of forest loss, the Z factors must be much higher than empirical data suggest possible.
Limited data for bird and plant species for the island of Puerto Rico (4, 12) suggest that the model in Figure 1 overesti- mates extinction rates even when Z values as low as 0.15 are used. Brash (12) reported an extinction of 11.6% of the avian species of the island after a loss of 99% of the primary forests and a net deforestation of 90%. The implication is that the rate of species extinctions cannot be explained by changes in area of forests alone. Other factors come into play and the net result of these is that the species-area model appears to overestimate extinction rates.
An obvious explanation for the overestimation of extinctions by species-area curve models is the implicit assumption that deforestation results in lands that are biotically sterile, which of course is rarely true. Moreover, human pressure on the land is variable and after abandonment, species can reinvade sites through successional mechanisms. In addition, as discussed by Williamson (9), the species-area approach has limitations that reduce its usefulness for detailed explanations of biotic phe- nomena. For example, the curves are based on single taxa, and it is likely that assemblages of species will exhibit different re- lationships with area than do individual taxa because the curves are not additive. Habitat diversity, a key factor in the explana- tion of species richness in islands, is not accounted for in the species-area models except for the implicit assumption that larger areas have more habitats. These considerations make it clear that the biology and rate of species extinctions caused by human activity are different phenomena than that implied using only species-area models.
The discussion above suggests the need for better models for predicting species extinctions due to human activities such as deforestation. Clearly, research is needed on the mechanisms that cause resistance to the loss of species following distur- bances. Meanwhile, we must take action to reduce species extinctions and where possible, restore lost biodiversity.
TREE PLANTATIONS AS FOSTER ECOSYSTEMS FOR DIVERSE FORESTS Tree plantations usually consist of fast growing, light-demanding tree species that have valuable wood properties or other useful product such as latex, resins, or tannins. These plantations are often established on degraded lands where agricultural activity is no longer possible due to declines in soil productivity. We have noticed in our studies of tree plantations in Puerto Rico and in a review of the literature mostly from India, that species-rich understories of native trees develop inside plantations and that the species composition of these understories change over time (5, 13-23). Under conventional plantation management, considerable effort is exerted to control or eliminate understory colonization by vegetation.
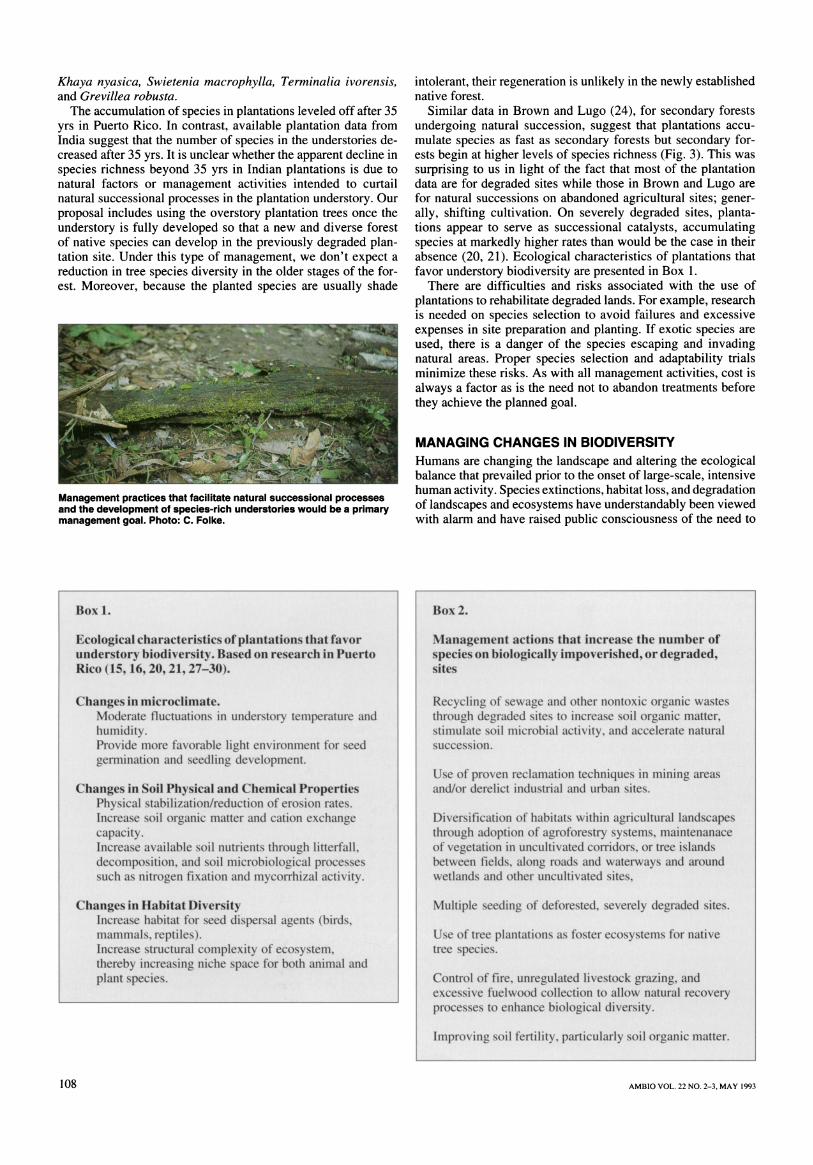
Our proposal to use plantations to accelerate successional processes and increase biodiversity requires a broadening of conventional management objectives. While management for high overstory wood yields will continue to be important in or- der to recover investments in plantation forestry, management practices that facilitate natural successional processes and the development of species-rich understories would be a primary management goal.
.............................. . ................. .............................. ........ ........... .......... ...........
. ...........
..................... Z Zx44x
...............
"M
. .............
. .................. ........... sxF tU
........... . ............ N
2 Z:
..........
ig g z -mo n
3: 81 M
2
........ ...
Vpg-i
. ... ...................
Figure 1. Relationship between deforestation and loss of species to extinction using different slopes (Z factor) for the species-area curve shown in equation 1.
MEN RIX-2-
8
gN mg
r tg
MgM,M o. pgm mm
gg
MMm 'IM
g
N
Ojg,, 1-,migjg, gp. ;-.-g qgi,
a.?
M MEMN
M M
Figure 2. Relationship between number of understory tree species in tree plantations and the age of the plantation. Data sources and discussion in the text. The relationship for these data is y = 0.74 + 0.93 x, (r 2 = 0.62).
Data from the above sources showed that the number of
understory species in plantations increased at a constant rate for
approximately 30 yr (Fig. 2). These data were for 44 plantations in Puerto Rico and India ranging in age from 4 to 32 yr. Rainfall
among sites ranged from 500 to 3800 mm yr-'. Sampling area for the understory ranged from 30 to 250 M2 and the minimum size recorded for understory species ranged from seedlings to
large saplings. We obtained the same relation when we analyzed
AMBIO VOL. 22 NO. 2-3, MAY 1993 107
Khaya nyasica, Swietenia macrophylla, Terminalia ivorensis, and Grevillea robusta.
The accumulation of species in plantations leveled off after 35 yrs in Puerto Rico. In contrast, available plantation data from India suggest that the number of species in the understories de- creased after 35 yrs. It is unclear whether the apparent decline in species richness beyond 35 yrs in Indian plantations is due to natural factors or management activities intended to curtail natural successional processes in the plantation understory. Our proposal includes using the overstory plantation trees once the understory is fully developed so that a new and diverse forest of native species can develop in the previously degraded plan- tation site. Under this type of management, we don't expect a reduction in tree species diversity in the older stages of the for- est. Moreover, because the planted species are usually shade
intolerant, their regeneration is unlikely in the newly established native forest.
Similar data in Brown and Lugo (24), for secondary forests undergoing natural succession, suggest that plantations accu- mulate species as fast as secondary forests but secondary for- ests begin at higher levels of species richness (Fig. 3). This was surprising to us in light of the fact that most of the plantation data are for degraded sites while those in Brown and Lugo are for natural successions on abandoned agricultural sites; gener- ally, shifting cultivation. On severely degraded sites, planta- tions appear to serve as successional catalysts, accumulating species at markedly higher rates than would be the case in their absence (20, 21). Ecological characteristics of plantations that favor understory biodiversity are presented in Box 1.
There are difficulties and risks associated with the use of plantations to rehabilitate degraded lands. For example, research is needed on species selection to avoid failures and excessive expenses in site preparation and planting. If exotic species are used, there is a danger of the species escaping and invading natural areas. Proper species selection and adaptability trials minimize these risks. As with all management activities, cost is always a factor as is the need not to abandon treatments before they achieve the planned goal.
MANAGING CHANGES IN BIODIVERSITY Humans are changing the landscape and altering the ecological balance that prevailed prior to the onset of large-scale, intensive human activity. Species extinctions, habitat loss, and degradation of landscapes and ecosystems have understandably been viewed with alarm and have raised public consciousness of the need to
Management practices that facilitate natural successional processes and the development of species-rich understories would be a primary management goal. Photo: C. Folke.
Roil.~~~~~~~~~~~~~~~~~~~~~~~~ ... .. ......... . EcohglcMdwncterlstlnof$ntatlenatbatfaver~~~~~~~~~~~~~~~~~~~~~.... .. ... . fidsnE4ybIeG*vsrslty. oursspanhla?umevto~~~~~~~~~~~~~~~~~~~~~~~~~~~~~~~~~~.... ............. R la...i... ........ (.........27-3) C h ... ....g.u...o..ic..r.c...........e. Moderate fluctuations~~~~~~~~~~~~~~ in... unders............to.. iy. ...... te.e.ue.n
humidity.~~~~~~~~~~~~~~~~~~~~~~~~~~~~~~~~~~~~~~~~~~~~~~~~~~~~~~~~~~~~~~~~~~~.. . .. Provide more favorable light e~~~~~~~~~~~~~~~~~~~~~~~~~~~~~~~~~~~~~~~~~~~~~~ .........
Inres aalal si.ntiet.trug.itelal... decox.psido.. ..i.lpocse suha irgnfiainadmcrria ciiy Changes in Habitlitrnvc7sity~~~~~~~~~~~~~~~~~~~~~~~~~~~~~~~~~~~~~~~~~~~~~~~~~~~~~~~~~~~~ ... .. Increase habitat for seed..dispersal.agents.(birds, mamls9 etie) Inres stru.tu.al.ompl.xity.o.ecosystem
thereby increasing niche space forboth animal and~~~~~~~~~~~~~~~~~~~~~~~~~~~~~~~~~~~~~~~~~~~~.. ... ... plant apeciet~~~~~~~~~~..... . .
:::::..:.::::.::..:.....:.:::.::::.::".:": ":.,:..%::"::. . '..":.::.::...:.: .:.::....:...::.: --.:-:-::-::..::-::- "::.:::::..:...''...:::::::.....:.:::::::::!..:.::::::::::::::..: : :::":::: .:.:: .. .. - " "' - .. - ... -. ,:: .... :. :..... .- . .-- .. ... ....... - - ... ...: ....:.: :..::: .. ".::.:: -.::"..::.. ''"""'" ......- .. .... .. ... .... .. .. ... ... - ....: ..:..::.:::.::".: ..:::..:::.::.:.:..:..: .. . . .:: :: :... . .: :: : ,::----:-: : ..::-:.. - ..:-. ...-: :. :..:::. :. : .:.:-.:': 0 ..::: .: ::.:::: :::.: : :. .:- : .: : :. ...-- -- :-: :-. .... .. ... .. . ... ......-: -: :.. ..::- .: ........ ::. .,:.. ...:::: .0:.:.... .%: :. .I--: ::..: .:.: : .. - .. :...mmm:::0 :.I:-, -:...-:: .-. ...:::.- .. .:. : :...:--..:-:..:.:. ..-.- :-...............-.:-,,..- :.. - - - .:....:. ..----::.. . . . . .: ::-.-:: :::-:-: --:.. ::-..: .. ::-:-:... :: s:1. : :: :-... ..: ... ... :.:....... ....:::. ... - .: : -: : s '.:'. -, :: .:..:...: .:. . .................-: - .:::..--.. .:::... .. ............: .. .: ..:.:.......... . . . . . .:::- ...........:...., .... .... ..................... ... :. ... . ... ... ... .............:V.-- .. . ......:..... . .. ...:.:. . :.. ...:-.:....... ", :: .. .:.: . .. ... .. .. ::: :':.:::.: - - -..::.....: -:,:::.. -..:.:: .. . .. :...:-- -...... .....:.. ::.:::.:.:: - :.:..:. .::::... ....."..:.. .. -::::. ::.,ft ...::-.::...:..:.::.:.....:.:'':......:- . ........ :. --'--".:: ... ....... :..: .::-::- N......... .., . .. .::.:: ... :-: ...:.. .. -i
*-...,,-: ..... .. .. .. .. 1. . ..... .......- .:: . ....... ::...:: .. --:::":.:: .: .. .. .:. ::: "..:: N. N,:%:: :: ,-WIiii:! -!::i!!:!iii1i::%. ,,,,,, :: .......... .. ..":.::.... .:..::..:...::,::,::::,:.:,... --::- ... ...: ... ...... .... .. .. .. .:.. -:-:.:::x:" .::.. ...:..: N --...:. :... :-l-:---X%:-..-:: ::..: .:. -:..:: ...
:::,:.... .. .:..:.4..::,.:: . . ..... :..::.::- ."..:::.:::.:..... - . .: ::..:.-- " -::...:: ..:%.:..--. . : :::.: N ... ..... : .. .. .: ::::::: .- .... :...... ::: ::...: : -:.::::..:::.:. .:.. .... . ... ....'..::..::..: .:..::. .:N...:::.::: .. .:::...::::::....:":::.:::.:::... :..:; --:..-:--::I... .::... . ..:::.:::..::...:. . .. ....-.."....:..:: :. .. -... -':: ::,.:..:::.::,.:::...:..-:-.::.. ..:..::::: ::::..:..!...::::.::.:::.::..:::....:..:::.::..:::%.:.. :.. :... .. x: ....... .* .... ::: :...: ..... ::..,::...::. ..::,.:.. .:.. :: : m--,---o---,-.'...-.--:: .... .:: ... .. . ... .. :..::..: ....... - - ...::,::... .....X
4:.::: ::: . .. ... ....... .. ... . .:,:....::.::--:: .:. ::.:: .:: ..::::: N. ..i::.:::: :: ..
... .. .. :.::::4 N.N::: ..: ...... ... :...:.::" " - "" :::X . ... . .... .. .. .. .. N -::... .. ... .. .. .. ::: .: : .-::.--. .. -.:...
- ..:: .::. .:: ..: . ....:.:: .............. .. i::.-: ....... :.:: ::: .:% .: -. ... :".::.... -.- .. .. ..4...::..::...: -::- ::: N -...:. ::: N.,..:.:::...:. .... .::.::....%::....:. .. ... .. .. .... -:: ....: ... - -:..:..:.:::::.:: "::..::; ". .::
:.:::..: ...... ........:::.::". .: -.:.:.:::..::::.... .. .. ... : s :::: .... ... ".: ..
. .... .. ... - .:: .:...:...:: ::.-.. . ..:, :.:,:::. ....N ::: -:..:.:. .. ....... ...::.: -:::--:. --.-::..:: '. :::::.:!..... -::%....::.::. ... ..N::: .:..:.:. -.:::,.:." -:: .::N .. - -.. .., . .. ... :: .: ...:: :,::N...:::i: ::,.,.'':,..,
.: ::..-..%-- .. :. .. '. : -. ..... ..... . .. - .. ::.:::: N .:.:.. "..:..:: ... ...:::....
V... ... . ... ......... NN -. ...-.: :::..:... .::..::: .. ..::::.::.. -:.::..:: .::.:: ...... :..::.
.... % ...N.: ...N. N --N::...: -..: .: :.... .:. -:: ..:.:.. :.... .. ... ..N... .:... .. :. ...%... .. . .... :-::. .....
.. ... ..... .... ............. . .. . .. .. N.:"..:. :..N. ::..-. N. -:: . :.,, .. :.:. -. --::....:. ..... ..:'. .'.'.'- :-'. -'.-... %... . .. ....:: . . ..
.:. N. .: -. :
.. .:: .:. . :. ...:..: . :. ...- :: ..:.. .. -. , -.::....:% ...... .. .. ... .... .. ..... .... ........... ...::::.: :: :. ..%::.::- ...... ...:.
.:.... :. .. ....:...:. ....... ..
... .. .......... .. .... ..:. ::: .. -..:: --- .: .. -..: :- . ... . ... ... .. s::.-: .:.:.: :.%:: ::::::;...:::.::::.:... :::: ::: N..... - .:.:N........ .:...:: .... .. .. .... .. ...
.. .. %..... .. %...i
... . ..: I .. .. ..::- --- .... . .. ... .. ...... ...... .. ..::N.:::.: ...:.:- ..-. ..:.%::...:::.::..::. - ...:.:. . N...:::
N.... .. "..::.::: .:..,:%....%::...::-N. .. .... N. N ... .:...:: ..... .. ........ .. .:..:%::... .: %:::- .::. .. .1 -.::s4:--l. :.:::: i!:i.:,:i::;ii.ii:6,:i:::.:.::i.i::i4,,,: .... ... .. . ..
:::.:::.:.:.;-. .....::...::..::..::: ::: -::--. .. :.:.::.:;:. is .: ! .::is MN: "' ,::: .::%:...: ... . .. ......"...::..,::.:.:: ::::. .: ...:.:: ... ...... .. .. .. .:: .: .. ". -:::.--:: .... - :
....u:::;.ilhj .i?N .%,,:, i;im.. .1 ..A a.; ,.,""jl .. ...,, ".- ::.I.: Ii ............ .. .. .. ...:... .. .. .... ......"'.. ..:;i
.N N .:. ... . -.%:::"" :.m -A....*-..!..
...
:: .."-:.:!.: - ,f.!ii;!i::.iiii...".,l.".....iii;-::i :. 1. !.',A' ,:i:,:il;,ii:.%ii;:iiil::::i::ii,,:::: ..... .id ........ . .'""'"'':;Ma;;::..:..:::::::. .I 0:; :--.:::--:-.l-mm-mm:::c::: . m.-.-.mmom;.t I.5". -:::::::::::::-::.--.: .. ...::::i::::: .::f ....: :,---:- ... ::,: . ...... ... ..... .. -.. . m:.
.....:..:.%.- ..-:N::.!.:--.. - " :::. X%. :....:: :::. :I. .......... . .. '::7:.: ..: .:.::- N ., ".. .. N. ..:.::..::: ::r.. :..-47% -... ... ....::...:. . ...... I .. ..... .. ... .. ... ... .... ...... .:::.:::,:::: ..:
.... ... .. .. ... .::::... . :- .:: -.::..,.-- ... . :: ...".:..... ...... . ... .. .. .: - .. . ...; . .:::..:.%--. -...
I.1:. ... . .;:--M:c:.. ....%... .. :L -. .. %4....... ::::::: -;!l 7:::.. ::: -....... ::...::: .:: ...
mm:-. :!:::.: .N.-M ::.:-::V s :. :. . : V:"::::-::.-:::
....::7:::. ::.
:.: !::;:::: :;r!:.-.
;m ; = ;:: : - -:: ..X: - :::,...-- --
:.. ..: ;.,
.. !, !:::s:::I.:s:... ::::::.!:.-, .m .. .::4:::::
.;:::: ...
..::::: . ..:::::::%:: :? :. :.:.:::::::%:: : ::::..:: :... %:,;;X::%::.-.: :!:i::::: :::: ,::.:::::!.::::: :::!.:.: :: : : 1 :::
:.:m;..:. .:: :..:::.N- .. ::. : :- N....::::; ,; :: ::....::: .. .. .. .:. N...-... :....::N... .... .. .:::: .. .. - "..::...::.:: :: :;:..:--.:: :.::. .;... - .. ...... . ..:::.::..:.: " .'..... . .:: ... ... -.....::..... N - N. - - .. .. N. .: ..,:::%:::.:...::... .::-.%.:.:: .m
..: .. '.%-...:.. . -. .. :... .. : . -:. --.-.". ... :::..: ...-, N .. -.:. :...... ..:..:.. N..: ::. ,.- ... - N N .. -......: . ... .... .. ... . :.. .:::.: .. .%---.. .. . ...:.. : .. ... :.-:: -::.... :-- "... ::: N....... .. .. . ..
... . :... ... '. . ....% . -. .: ... ... N - : ... .::.... .. .% . :- .:.... .7 :. .."- :. .: ..........: 7.
.. . ....... .. - .; ..... .. .. . .. ... .. .:.. .%:....:: .:...% -...:: N. -.-.: ..:... ....:: N..-..
:":.. . .....:..... .....
.:: ... .. .. .. ..... .. . .......... ... .: : :N ..:. .::-....:. N... . ..:. ..... .N N...- :. .: ...... .:...: .: -::. .. . %.:: .:. : ::...... .. ..Y-N .:...". ..
..:...:::::,..,; : ..%:.:.... .. :: ::.:: - .. ...----...:. .:. ::..::-::: N. :.: ..: ...:: NN :. ..:. .. - .. ... .:% : :.. :: .: ....... ... ..N. ..:.-.. ... ...... .%:: .:.:-...... ::%..::. ...-.: .... ". "::.: -.::: ':::'....... .. ....... ... ...:: ::: ..::NN-..--..
.::..:.: ..... .:."..-- -::: N. .... ... .: . ...... .... . . .... :....4 %::. .:: ..... . ....: : :N ..... ...:. N. ::::"::..:. .: N. N. " -.. ..%.:.. .. :.....:.,::: .::...N : : % : : : ::! ::: .. .. ... ... .. .. ... .... ....: ... ... .: .. .... ... : : V., :.:....:-..:::. .: :!.:.:... N ,:::...:.:...... : :.t ::::: : :.. !s: : : :: ::. :: : ::.. ........I.. ... . .... . ... ...... : ::: ::%.... ...--:..:: ::: ..........:: 1-:-: :::.:.:.,:::-:::- .M. ...: - . :-: .: :.:-
: -- :.::"".
"4-....::. : N. :::- .. - .:..::. ::: ...:.. .:,. ..N: -: :. -:. ::.:. .::.'--:: : : : ::: .. :% :: :: :: :.::
: : : :
:::: :: : : !!N. :::::'M .. :: :
. .,: ; :::: :! :: N: : :.:: 1- : : .:.: !.::: .... .... .... :: : . ! : : : H : : :: : :: :::: : ::.! ::,:::: : N : : : % 1 ::;::::: : : :::::
: :.%.'. : .:!::
:i ..: .::;...... . m"I .. .... mX:--::. .: ..X:
:..': : : : : ... .. .:::.:::;: : :::::...::,:. : :- :.:::.%- .: :.
-::, ... ......."---:: .. - ... .N M:: ;.N:: ; :::N ::::--::: :::.. :... : :v::-.:::::..::: ,:: ":.,:..:.:.::.........
.. .....m..mN ;; ::::,:. : .: .-: ::--::i-- ::.: : - -,----- --.-...:.. . .: N .sr. :- ..:-.. :. .:.m
.. ::. ."I.. ...... . .:....: .
:.::.:: :::. :..::. , .::: ..: :: : .:: ...:.: :: ... . ....... .. -X: ...:: .:. -..... .:::.: :..::..: :: .: : i;, il, :.;i i.!:::,!::! 1 li:!iii il: ..:: .: :::: :: -:..:::.-::...::.. .. .:% ... : . .:.: :.::::::m .. :: ,.,z :s:. ;.,:::.:. .:::
............ I..:: --:::
..:.:.:: . ..%..:::::... ... :.. ... . .N ::% :... :.. - :..: . N.: .. .. . .. ... . .. ... ... .::,:. ! .::::: :: :.: ..:: ::..:: :x ::-. .. - ::..::4..::... '!
.. ..::::. ': I ..... . ..... .. ..":. .. ........... V:N... .. . ... .:.. ..... .. I.. .. . .. ...
....... : .. ... .... :..:. .: ':: .:: . ... ::..::. H. .. .:.:.:::: ... N :.. .: . ::::: :.. ... ...:N .: :: :: : : : N:. - :..::: N::.::-
.. .. N . : - -. .. ...... : :.. ....: - N:.. ..-. .. ... ...... .. N .:. N.-.-... .: ::: .:;,:::-:: .::. ..
.... ...... . -.. ...:.:.. :..-:. .- - .:.: .. . .. .:. . ... .... .....:..-- . .: ...
..:" - ". .: ..... .. .. :..:...... .. .. .: ..:. ... ::%:::: :..:.::...::::. :::..-.".:::::.:: :-- .: :,..::::,.:: '::::::: - -s: :- :.-..... :.: ..... .. .- -:: ,.. -.. :. . .. .. . . .. .......: .:: :..: ":.: :..::: - :.
.. ... ., . .."::.:. ::.N..-
- -:- ::: - .:: - ..:.
N .:. ..:. .N. ... :.. .. .:.: .. ....:.:........ .... ... ... . .. ..... : :................ -:::-: 7:.,..: - : ..%.. .: " :: , ",,,,:: -:.:% :..:: -".:.. ..
I:, :: ..
......... ..: .. ..::
:.-N. ... ... .. .. .. ... .......... % 4 ... ...: ....- .. . . ...
:......""'::VW,N1"N".:..::.:::.... *,...:::,:::::,,.... ..:-! i. - -
.. .:."""..... , ,- .. .... ..
. .... ... .
:..-- --- -::: . %:: .. ......
.N--::: :...4.::.:::....-." :::::-.-".:-..
.. -::. .:..:: . .......... .. ,,
----
....- ..4
.. .% ..%:: ..xvvN :.. .. ......%
.::::::.: . "::.:.: : ::;:::-.-..":.:. .:::::.:..:.!:::: :..:::,:::::::::::i .. ... ... '.. -.. -:N-
::.::...: ..... --.. :-:::::- . . .. .. .. ...A ... ... ... : 1 0 %.. - - ' ..
:6 ...-.........".M..... .:::.:::::::":: ,s!.:-!::::::4:1!.: ::: : ::::::.::.:::
ii::oi:,X.-.--t :i ...: W. I'll, '"" V O ....:::.x::..:-:.:%--:..:-..- "..::.:. '.. :'', """''' :: NO., - - : :i- I..U". I .. ...:. .... ...... !I:Fcol -, iim. I .. .- -, ... --c 4s:.: ..I .... . .... is ::::::::-R','---,*ll-. c;l----m------,.-".:,: -.::--.:---::4-xi:-!!i:R9F1...... . .. I ..
.. .. . I ..! ow.0 ....,. .. .. . .. ... ..... :::,::,:!-::.-::-:::.::,:::..::.::: :.: ......g"f ?.. .... . I.......
N.::::.: ........... .. . . ... ...... ... .: :::.::::.:.::::::%.::..: - .::
::--:'-':' .::;,,,l .: ..%..:,. -:::.::: ':: ::.:..:s-.sN:::-.-.::--.. .:.. i!T;R-'.::;: . ..---:N-:::%-:.....:::.. ,::,::: N.:::.. W:N , ''......XvMV.... ... :.::iiifiHi?j.!1s:: -::::" ...... "... -.:- '-: - ".%:
.....i, """' ...:. .. .: ........r.. ..
:.. . .. ..,::.:
...: .fi.....:.:.:...:::.::: -M I "'..", ........ ... ...... .i.I.
. ..'..".:::::: .... , '''
, "....... ...
.." ... W. ''.47 ........:::.::... -
....%7t-"'-O.' i6i, ... .. :. ..:...::.... :... ..:.::... .8.:" .... .. ... .. ....: . I ........ ,.. ..:..::::'--- -.: .. .. ...... ..:s .........I... ... ::..:: .:::.:: ... .. ..:.:........ n ..:........ ....:..:.:: .... .........: . .. ... ....:.. ... ......... - .. ....: ..... .---:::::-x.--.. ....... .. ... .. ... -4 ..::.::
.. .. .. ... .. ::.:::...: .. : -::.....:.: . .:::, ....... .... s....: ... ::.:::::::::.....;::.:,::4.:::::..
. -%:::.::..:... ...
%.. ... .:."i-ifi:.. . .... . .. .. ... .......... "......... :!:::::.::..:...:..... .%--..- ::::: , ".:-,%: :4:::::...: . ::
:..:: ... .. '::.... ..::. .."".:::.::: :1 '': .:.:::..::: ... :."::.: ..:
4::.,:.,:,.: :4.%:. . .. ..... . ... .. ... .-- .. .IN :::: .... ...:! :i::.:::
:--: ::::.:!::..:
:8. -N-.:::...-:...::::: .::!::: ...
:.:..::: :,: ::..:..:::
.:::: :: I..."::.:: ::::: , ,..:;.:
..
:: ..:.. -, :, .. ..::. ... -. ... ... ..:..:.:-.::,: : :.::....:::
.. ... ...... : I.. . .... ..:.:: .. . ..:.. .. . . ..... ..
:.. ...:::.:.:: .:.:7..:.-.. .%,.,. ...:.:. ... ....:. .:.:..... . .. ..... ............: ... . ...... .. ,:..:.
.. :... :::.:, ....: :,: .
....:...... .... , ... ..... . .': .::.... "..:.....:. ...:: %...: .... ...N...::::: ...::
.::- . .'....:..::: X. ... "",.:::7.- .:. N.- ..."'% "" " "
". .. ... .:, ...%..: . ....... .: .:. -----: ..4.:...V
:::... .%.:.::..: .. .. ........ :..::i:. ....... .....:::::. V: -::.. .:.:::... ...... - . -.. %.....:.
...:::::.:::!:::.::..-.... ........ ... .............:..:- .. .....'.... .......--..... ..%..:7:.. ..4.%..7: .....
- .: 4 .... ..... -.::-.:. . .....::.::.:..." . :::..!:.!.::% .. . N -...::: ........:....
........ -::.%.: 1:;:::i-,-::,is ::.: .:".:.:4
. .. .:. ..:: :::..: - - .:: :: --::--... -
::::.s:::X:-: : .. :. .: .::. . .: . .. .. ..:::: :. . . '..:::.::: .::: ....... :.- :,:::,:::." ::: .::..::. - ... ... .. ... . ...'... .... .. .::.:: ::..:... .. ::.::::%::::: :::: . .. ....... . .. .. ....I......... ....... . .. ,
..
..... ::::I:i;l::i,.::!::I'i:;;fi;;::... ::::: .. - . ::: ::X
"4...: S....."I.I.I...", :,...,:",:",''::.:
" '':
....
. .. ...
.:::.: :::::::....-". ..;........."."."'....'.%::.::.:. .....::::---::::-::.:::.:. ::.:
-::: -::..:::.:::..:.. . :::::.... ::: . m..:. :, -;!!.:-i,::::iii: :.:. .::.:...:::.:;:.:::! .. .::..:.
.::.:. ::-,::..::.. :.... . ..... :::::..... %":.:::.:::..m ... .. -::::: I.::.:.::;.!::::: :::::::.:.::::i.l;;.ii'li::::..::.::%.::%- ::::!;:::::::::::::.:!::::::::..:;:: :::%::::.
:::!:"::::::::. " " .::.:::::..::%: ".:. .::.:: - - " ... ....... .. ...-::.: . :: .! --:. ,.X. .:.%:.. ;;. f::::s:: ;::: .: .... .. . RFP" .. .. .m. :: :::'!%::::!::;:.:.: .....: ..... .:.. .::...:.:::.%: .::,.:::I .: ... .. ....::::4 ... .. . . ... .... .....V...:
. .... ... ... .. . ... .... :::::,:. .... .... .. ... .::.:..:-:
.. -s::...........::::::.. ...:..:::::..::.: .., ... .. %:::.:::-:::...: .:.::.. % .....
... . . .... . .. ....... : : .: --:: ::..: . ...... .. ..... :.:.
..:. .::..:::....::....: ....... .:. .:.:...:.:. .:::::: -..... -:::,::::: .. .. .. .. - .. .::..::-:::......:..:...:::..::...::.:..::..:::::. ...::..:::!:::.%.:.:.::::: : :.:..4:::::::
.. ::...: ... .. . ...::..:--. -.-X:..... : .::.:.:::::.:::.:.::: ':::: .........
":.:::.::. .... ... .::::::::::-:-- :::x-:-...:.:: : :::!::: .: ..:,::",." .. ...
::::::..::: -::.-- .:..:..., ...... .....::.. ....::.:. ... .:.::: .:...:. ... .... ..... ......... . .:::: .....:::.. ,.:, .:-:.....::-::...:!.: :. .:.:....:.:... -..- . ..... ... .:...: .. -:::: ...::.:. .::.::.-.. -... :..:,:: s:.:.:::::
.... .::..%..:. :.:.:.%-- .:. ...:.. . -. ....-..:::: ;:: ... ..
.:.:....
:::: ... . .. :::: ..... .. ... ...... ...:.... .:. ...... .... ...-....- .. .. ..... .. ..
.:..:...::. ..::..:. . ...::.: .:.:.:...:.. . ::: .. .. .. ... ..........:... ......
.......:N..:'', ..
'::-".-' ..:. ...:::. -..:....:... .::::. ...... .:. I:..........-.
..:.:.::..::..:.. ...-.:7... ....--..:.:.%..:: ... ... ... .:: .. ... :...::4:::.... % ...::..:.......
--.... -I.....: ...: .......... ....:: ':. ::: . :::,.::
::.,::. ------::..::-- -4 :..-..- .::...... :.........'..... - - .:: ....... ... ... ........... ... -.: .::. -::-.- .:% :. --... .. .... .:. .. ... .:::::
"I I, .::",. , "
-.:
.:... .-..:::.:::
- -:-::..::::--:::::::::.-:::: w:
%: I................, .:.,::.::::,::,::.,.::::-i.iii::iil::i:..::ii:.*,ii::ii:.,..,:: ... ........... . ....... . ..:: : ":: .::.. ...,:".%:::..:::.:::. ..:.:::,. ....
.: "... ..... . .. ... " -,:i:,::-Ap:,.,,:,ii::fi ..., . . -%VN-:::-:-- .... X-..X:.:::X:%-.:.--:.::.% ..: ::,......iU.:k., ..::.. :;. .. s:. . . . . .I. . . . . . . . . ...... :::::. . . . . ::":4so.. -.2:::.- :::As.....l.....::s::.:::
,q, .. .E..., I. ft ::; "
:::: : ,",., .::%I.ilk!,::.::.:Ii:;iii... --.:.:l .... N:. ... ... .. 11. ..... I. :W :.. ... .. ..::.:....,N-X::.:: ... . .. .....
:.. . .... ..... :. .. .., .1 -:: ..... .. ::: . ,.... .... ....
'"':,: i; :-':.::::i!-.. Ille.-:':::.%: ::::::!: U.... ..I I-.... I .;.. ::.:: llll--:- I.:... ..
108 AMBIO VOL. 22 NO. 2-3, MAY 1993

While we must curtail many of the senseless human activities that needlessly destroy the ecological balance of Earth, we must also turn our attention to positive actions that reverse the negative impacts of humans. Photo: G. Nycander.
preserve critical habitats and conserve Earth' s biological heritage. While we must curtail many of the senseless human activities that needlessly destroy the ecological balance of Earth, we must also turn our attention to positive actions that reverse the negative impacts of humans. With regards to biodiversity, it is clear that the models that we use to anticipate the future condition of the biota (Fig. 1) provide a wide range of scenarios that depend on the species-area relationship (Z value) at each location. Given the geographical variability of the Z value and the limitations of the approach, forecasting changes in biodiversity becomes highly problematic. Moreover, these models appear to overestimate the number of extinctions because they don't take into consideration ecological resiliency, habitat variability, nor the ability of humans to reverse trends in species losses through management.
We suggest the use of plantations as one possible mechanism to restore diverse ecosystems in degraded lands. There are other actions that can be used to restore or maintain biodiversity in managed landscapes (Box 2). However, our main point is that land management offers an opportunity for humans to redirect the changes in biodiversity and in some cases to reverse negative trends.
Figure 3. Relationship between number of tree and understory species and age of secondary forests. The relationship is y = 41.89 + 0.97 x (r2 = 0.26). Data were for 22 plots ranging in age from 1-31 yr in tropical wet to dry forest life zones resulting from abandonment of agriculture, mostly shifting cultivation. Only plots with areas of < 0.05 ha were selected to be more in line with the plantation data. All data are from Brown and Lugo (24).
~~~...L lr't 3: .*..
Z - ',t Q >?;,< t?-:fi1:tSiR .te *. i Y z. :rc!: 4 s .Ri2>,
I X i;
References and Notes 1. McArthur, R.H. and E.O. Wilson. 1967. The Theory ofIslandBiogeography. Monographs
in Population Biology 1. Princeton University Press, Princeton, New Jersey. 203 p.22. 2. Lovejoy, T.E. 1980. A projection of species extinctions. In: The global 2,000 Report to
the President. Barney, G.O. (ed). Council on Environmental Quality, Washington, D.C., p. 328-33 1.
3. Simberloff, D. 1986. Are we on the verge of a mass extinction in tropical rain forests? In: Dynamics of Extinctions. Elliot, D.K. (ed.). John Wiley and Sons, N.Y., p. 165-180.
4. Lugo, A. E. 1988a. Estimating reductions in the diversity of tropical forest species. In: Biodiversity. Wilson, E.O. and Peters, F.M. (eds). National Academy Press, Washington, DC, p. 58-70.
5. Lugo, A.E. 1988. The future of the forest ecosystem rehabilitation in the tropics. Environment 30, 16-20 and 41-45.
6. Nir, M.A. 1988. The survivors: orchids on a Puerto Rican coffe finca. Am. Orchid Soc. Bull. 57, 989-995.
7. Wunderle, J.M. and R.B. Waide. 1992. Distribution of Overwintering Nearctic Migrants in the Bahamtas and Greater Antilles. Report to the World Wildlife Fund. Institute of Tropical Forestry, USDA Forest Service, Rio Piedras, P.R.
8. Margalef, R. 1963. On certain unifying principles in ecology. Am. Nat. 97, 357-374. 9. Williamson, M. 1981. Island Populations. Oxford University Press, Oxford, England.
286 p. 10. Beard, J.S. 1949. The natural vegetation of the Windward and Leeward islands. Oxford
Forestry Memoirs No. 21. Clarendon Press, Oxford. 192 p. 11. Holdridge, L.R., W.C. Grenke, W.H. Hatheway, T. Liang and J.A. Tosi. 1971. Forest
Environments in Tropical Life Zones, a Pilot Study. Pergamon Press, N.Y. 747 p. 12. Brash, A.R. 1987. The history of avian extinction and forest conversion on Puerto Rico.
Biol. Conserv. 39, 97-111. 13. Bhaskar, V. and Dasappa. 1986. Ground flora in Eucalyptus plantations of different ages.
In: Eucalypts in India: Past, Present and Future. Proceedings of a Seminar held at Kerala Forest Research Institute, Peechi, India, p. 213-224.
14. Chaubey, O.P., R. Prasad and G.P. Mishra. 1988. Studies of teak plantation and mixed natural forests in Madhya Pradesh. J. Trop. For. 4, 22-35.
15. Lugo, A.E. 1992. Comparison of tropical tree plantations with secondary forests of similar age. Ecol. Monogr. 62, 1-41.
16. Lugo, A.E. 1993. Tree plantations for rehabilitating damaged forest lands in the tropics. In: Environmental Rehabilitation. Wali, M.K. (ed.). SPB Academic Publishing , The Hague, The Netherlands. (In Press).
17. Mathur, H.N. and P. Soni. 1983. Comparative analysis of undergrowth under Eucalyptus and sal in three different localities of Doon Valley. Indian For. 109, 882-890.
18. Mathur, H.N., N. Jain and S.S. Sajwan. 1980. Ground cover and undergrowth in Eucalyptus, brushwood and sal forest - an ecological assessment. Van Vigyan 18, 56-6 1.
19. Panden, P.K., A.P.S. Bisht and S.C. Sharma. 1988. Comparative vegetation analysis of some plantation ecosystems. Indian For. 114, 379-389.
20. Parrotta, J.A. 1992. The role of plantation forests in rehabilitating degraded tropical ecosystems. Agriculture, Ecosystems, and the Environment 41, 115-133.
21. Parrotta, J.A. 1993. Secondary forest regeneration on degraded tropical lands: the role of plantations as 'foster ecosystems'. In: Restoration of Tropical Forest Ecosystems. Lieth H. and Lohmann, M (eds). Kluwer Academic Publishers, Dortrecht, The Netherlands.
22. Soni, P., H.B. Vasistha and 0. Kumar. 1989. Biological diversity in surface mined areas after reclamation. Indian For. 1 15, 475-482.
23. Srivastava, V.K. 1986. Diversity and dominance in two man-made forests at Dehra Dun, India. Indian J. For. 9, 287-292.
24. Brown, S. and A.E. Lugo. 1990. Tropical secondary forests. J. Trop. Ecol. 6, 1-32. 25. Cruz, A. 1987. Avian community organization in a mahogany plantation on a neotropical
island. Caribbean J. Sci. 23, 286-296. 26. Cruz, A. 1988. Avian resource use in a Caribbean pine plantation. J. Wildl. Manage. 52,
274-279. 27. Lugo, A.E., E. Cuevas and M.J. Sdnchez. 1990a. Nutrients and mass in litter and top soil
of ten tropical tree plantations. Plant and Soil 125, 263-280. 28. Lugo, A.E., D. Wang and F.H. Bormann. 1990. A comparative analysis of biomass
production in five tropical tree species. For. Ecol. Manage. 31, 153-166. 29. Cuevas, E., S. Brown and A.E. Lugo. 1991. Above- and belowground organic matter
storage and production in a tropical pine plantation and a paired broadleaf secondary forest. Plant and Soil 135, 257-268.
30. Wang, D., F.H. Bormann, A.E. Lugo and R.D. Bowden. Comparison of nutrient-use efficiency and biomass production in five tropical tree taxa. For. Ecol. Manage. 46, 1-21.
Ariel E. Lugo is the director of the International Institute of Tropical Forestry (IITF). John A. Parrotta is a scientist in the (IITF). Their address: International Institute of Tropical Forestry, USDA Forest Service, Call Box 25000, Rio Piedras, Puerto Rico 00928-2500. Sandra Brown is professor at the University of Illinois. Her address: Department of Forestry, University of Illinois, W-503 Turner Hall, 1102 S. Goodwin, Urbana, IL 61801, USA. All of the authors are active in tropical forestry research in Latin America, the Caribbean, and Asia.
AMBIO VOL. 22 NO. 2-3, MAY 1993 109