los angeles county children and families first … first 5 la cafr - final.pdf · independent...
TRANSCRIPT
LOS ANGELES COUNTY CHILDREN AND FAMILIES
FIRST – PROPOSITION 10 COMMISSION (a Component Unit of the
County of Los Angeles, California)
COMPREHENSIVE ANNUAL FINANCIAL REPORT
For the Year Ended June 30, 2016


LOS ANGELES COUNTY CHILDREN AND FAMILIES
FIRST – PROPOSITION 10 COMMISSION (a Component Unit of the
County of Los Angeles, California)
COMPREHENSIVE ANNUAL FINANCIAL REPORT
For the Year Ended June 30, 2016
Raoul Ortega
Director of Finance


LOS ANGELES COUNTY CHILDREN AND FAMILIES FIRST – PROPOSITION 10 COMMISSION
FOR THE YEAR ENDED JUNE 30, 2016
Table of Contents
INTRODUCTION SECTION: Page(s) Letter of Transmittal .................................................................................................................................................. i Board of Commissioners .......................................................................................................................................... v Organizational Chart ............................................................................................................................................... vi GFOA Certificate of Achievement ......................................................................................................................... vii FINANCIAL SECTION: Independent Auditors’ Report ............................................................................................................................... 1-2 Management’s Discussion and Analysis (Required Supplementary Information) .............................................. 3-11 Basic Financial Statements:
Statement of Net Position and Governmental Fund Balance Sheet ................................................................. 12 Statement of Activities and Governmental Fund Revenues, Expenditures and Changes in Fund Balance ............................................................................................. 13 Notes to Basic Financial Statements ........................................................................................................... 14-28
Required Supplementary Information: Schedule of Revenues, Expenditures and Changes in Fund Balance –
Budget and Actual – General Fund ........................................................................................................... 29 Note for the Required Supplementary Information ......................................................................................... 30
Other Supplementary Information: Schedule of CARES Plus Funding ................................................................................................................... 31
STATISTICAL SECTION (Unaudited): Financial Trends Net Position by Component ............................................................................................................................. 33 Changes in Net Position ................................................................................................................................... 34 Fund Balances – General Fund ........................................................................................................................ 35 Changes in Fund Balances – General Fund ..................................................................................................... 36 Revenue Capacity First 5 California County Tax Revenue Projections for Fiscal Years 2015/2016 – 2019/2020 ....................... 37 Cigarette Taxes and Other Tobacco Products Surtax Revenue, 1959-60 to 2014-15 ...................................... 38 Demographic Information Demographic Data and Economic Statistics .................................................................................................... 39 Unemployment Rate ........................................................................................................................................ 40 Ten Largest Industries ...................................................................................................................................... 41 Operating Information Capital Assets Statistics ................................................................................................................................... 42 Authorized Positions by Function .................................................................................................................... 43 COMPLIANCE SECTION: Independent Auditors’ Report on Internal Control Over Financial Reporting and on Compliance and Other Matters Based on an Audit of Financial Statements Performed in Accordance with Government Auditing Standards ............................................................... 44-45 Independent Auditors’ Report on State Compliance ......................................................................................... 46-47


v
FIRST 5 LA
Commissioners Sheila James Kuehl, Los Angeles County Supervisor, Chair
Judy Abdo, Vice Chair Nancy Haruye Au Jane Boeckmann
Duane Dennis Cynthia A. Harding, M.P.H. Christopher Thompson, M.D.
Joseph Ybarra Jr., Ph.D. Marlene Zepeda, Ph.D.
Ex-Officio Commissioners
Philip L. Browning Patricia Curry
Karla Pleitéz Howell Deanne Tilton
Alternate Commissioners
William Arroyo, M.D. Linda Aragon
Dayton Gilleland Terry Ogawa
Sylvia S. Swilley, M.D. Brandon Nichols
Executive Director
Kim Belshé
Chief Operating Officer John A. Wagner
Department Chief
Teresa Nuno, Chief of Programs and Planning
Department Heads Peter Barth, Policy and Intergovernmental Affairs
Gala Collins, Human Resources Barbara DuBransky, Program Development Jennifer L. Eckhart, Contract Compliance
Tara Ficek, Grants Management Rafael González, Best Start Communities
Roozbeh Hamouni, Information Technology Armando Jimenez, Research and Evaluation
Stacy Lee, Office of Strategic Planning and Integration Raoul Ortega, Finance
Jennifer L. Pippard, Community Investments Gabriel Sanchez, Communications and Marketing

vi

vii

1
INDEPENDENT AUDITORS' REPORT Board of Commissioners Los Angeles County Children and Families First – Proposition 10 Commission Los Angeles, California Report on the Financial Statements We have audited the accompanying financial statements of the governmental activities and the general fund of the Los Angeles County Children and Families First – Proposition 10 Commission (Commission), a component unit of the County of Los Angeles, California, as of and for the year ended June 30, 2016, and the related notes to the financial statements, which collectively comprise the Commission’s basic financial statements as listed in the table of contents. Management’s Responsibility for the Financial Statements Management is responsible for the preparation and fair presentation of these financial statements in accordance with accounting principles generally accepted in the United States of America; this includes the design, implementation, and maintenance of internal control relevant to the preparation and fair presentation of financial statements that are free from material misstatement, whether due to fraud or error. Auditors' Responsibility Our responsibility is to express opinions on these financial statements based on our audit. We conducted our audit in accordance with auditing standards generally accepted in the United States of America and the standards applicable to financial audits contained in Government Auditing Standards, issued by the Comptroller General of the United States. Those standards require that we plan and perform the audit to obtain reasonable assurance about whether the financial statements are free from material misstatement. An audit involves performing procedures to obtain audit evidence about the amounts and disclosures in the financial statements. The procedures selected depend on the auditor’s judgment, including the assessment of the risks of material misstatement of the financial statements, whether due to fraud or error. In making those risk assessments, the auditor considers internal control relevant to the entity’s preparation and fair presentation of the financial statements in order to design audit procedures that are appropriate in the circumstances, but not for the purpose of expressing an opinion on the effectiveness of the entity’s internal control. Accordingly, we express no such opinion. An audit also includes evaluating the appropriateness of accounting policies used and the reasonableness of significant accounting estimates made by management, as well as evaluating the overall presentation of the financial statements. We believe that the audit evidence we have obtained is sufficient and appropriate to provide a basis for our audit opinions. Opinions In our opinion, the financial statements referred to above present fairly, in all material respects, the respective financial position of the governmental activities and the general fund of the Commission, as of June 30, 2016, and the respective changes in financial position thereof for the year then ended in accordance with accounting principles generally accepted in the United States of America.
10681 Foothill Blvd., Suite 300 Rancho Cucamonga, CA 91730 Tel: 909.466.4410 www.vtdcpa.com Fax: 909.466.4431
Vavrinek, Trine, Day & Co., LLPCertified Public Accountants
VALUE THE D IFFERENCE

2
Emphasis of Matter As described in Note 1 to the financial statements, the Commission adopted Governmental Accounting Standards Board (GASB) Statement No. 72, Fair Value Measurement and Application, effective July 1, 2015. Our opinion is not modified with respect to this matter. Other Matters Required Supplementary Information Accounting principles generally accepted in the United States of America require that management’s discussion and analysis and budgetary comparison information on pages 3 through 11 and 29 through 31 be presented to supplement the basic financial statements. Such information, although not a part of the basic financial statements, is required by the Governmental Accounting Standards Board who considers it to be an essential part of financial reporting for placing the basic financial statements in an appropriate operational, economic, or historical context. We have applied certain limited procedures to the required supplementary information in accordance with auditing standards generally accepted in the United States of America, which consisted of inquiries of management about the methods of preparing the information and comparing the information for consistency with management’s responses to our inquiries, the basic financial statements, and other knowledge we obtained during our audit of the basic financial statements. We do not express an opinion or provide any assurance on the information because the limited procedures do not provide us with sufficient evidence to express an opinion or provide any assurance. Other Information Our audit was conducted for the purpose of forming opinions on the financial statements that collectively comprise the Commission’s basic financial statements. The introductory section, schedule of CARES Plus funding, and statistical section, are presented for purposes of additional analysis and are not a required part of the basic financial statements. The schedule of CARES Plus funding is the responsibility of management and was derived from and relates directly to the underlying accounting and other records used to prepare the basic financial statements. Such information has been subjected to the auditing procedures applied in the audit of the basic financial statements and certain additional procedures, including comparing and reconciling such information directly to the underlying accounting and other records used to prepare the basic financial statements or to the basic financial statements themselves, and other additional procedures in accordance with auditing standards generally accepted in the United States of America. In our opinion, the schedule of CARES Plus funding is fairly stated in all material respects in relation to the basic financial statements as a whole. The introductory and statistical sections have not been subjected to the auditing procedures applied in the audit of the basic financial statements and, accordingly, we do not express an opinion or provide any assurance on them. Other Reporting Required by Government Auditing Standards In accordance with Government Auditing Standards, we have also issued our report dated October 14, 2016 on our consideration of the Commission’s internal control over financial reporting and on our tests of its compliance with certain provisions of laws, regulations, contracts, and grant agreements and other matters. The purpose of that report is to describe the scope of our testing of internal control over financial reporting and compliance and the results of that testing, and not to provide an opinion on internal control over financial reporting or on compliance. That report is an integral part of an audit performed in accordance with Government Auditing Standards in considering the Commission’s internal control over financial reporting and compliance. Rancho Cucamonga, California October 14, 2016
3
Los Angeles County Children and Families First – Proposition 10 Commission Management’s Discussion and Analysis
(Unaudited) This section of the Los Angeles County Children and Families First – Proposition 10 Commission (the “Commission”) comprehensive annual financial report presents management’s discussion and analysis of the Commission’s financial performance during the year ending June 30, 2016. This discussion and analysis is intended to be read in conjunction with the Commission’s basic financial statements and accompanying notes. Financial Highlights The Commission received a total of $93.7 million in revenues from First 5 California (the State),
reflecting a 6.03% decrease of $6.1 million from $99.8 million in FY 2014-15. Total program revenues for FY 2015-16 in the amount of $103.0 million includes tobacco taxes, as well as pass-through funds for programs such as the Child Signature Program, Medi-Cal Administrative Activities and the LA County Partnership for Families program funded through the Department of Children and Family Services.
Commission expenses totaled $190.3 million in FY 2015-16, representing a 4.86% decrease of $9.7
million from $200.0 million in FY 2014-15. The Commission’s liabilities decreased from $41.2 million in FY 2014-15 to $34.7 million in FY
2015-16, reflecting a total decrease of approximately $6.6 million, or 15.93%. The Commission’s total net position decreased from $555.4 million in FY 2014-15 to $473.1 million
in FY 2015-16, a decline of approximately $82.3 million, or 14.82%. Overview of the Financial Statements The comprehensive annual financial report consists of two parts, this management’s discussion and analysis and the basic financial statements, including: government-wide financial statements, fund financial statements, and notes to the basic financial statements. The Commission’s financial statements offer key, high-level financial information about its activities. Government-wide Financial Statements The government-wide financial statements are designed to provide readers with a broad overview of the Commission’s finances, in a manner similar to a private-sector business. These statements provide both long-term and short-term information about the Commission’s overall financial status. The Statement of Net Position includes information on all of the Commission’s assets and liabilities, with the difference between assets and liabilities reported as net position. Changes in net position may serve as a useful indicator of whether the financial position of the Commission is improving or deteriorating. The Statement of Activities presents information showing how the Commission’s net position changed during the fiscal year. All changes in net position are reported as soon as the underlying event giving rise to the change occurs, regardless of the timing of related cash flows.

4
Fund Financial Statements A fund is a grouping of related accounts that is used to maintain control over resources that have been segregated for specific activities or objectives. Fund accounting is used to ensure and demonstrate compliance with finance-related legal requirements. All of the Commission’s activities are accounted for in the general fund. Governmental fund financial statements focus on near-term inflows and outflows of spendable resources and on balances of spendable resources available at the end of the year. While a nine-member Board of Commissioners governs the Commission, the Commission was created by, and ultimately is, under the authority of the Los Angeles County Board of Supervisors, in accordance with California State Law, through its appointment of the Board of Commissioners and its ability to remove the Commissioners at will. Consequently, the County of Los Angeles Auditor-Controller’s Office has designated the Commission as a “discretely presented component unit” of the County of Los Angeles and includes a summary of the Commission’s basic financial statements in the County’s basic financial statements. Government-wide Financial Statements Analysis The following is a summary of the Commission’s assets, liabilities and net position comparing FY 2015-16 with FY 2014-15:
FY 2015-16 FY 2014-15
Percent Increase
(Decrease)
Increase (Decrease)
Assets:
Current and other assets
$496,180,753 $584,759,224 (15.15 %) ($88,578,471)
Capital assets
11,593,026 11,885,041 (2.46) (292,015)
Total assets
$507,773,779 $596,644,265 (14.90 %) ($88,870,486)
Liabilities:
Long-term liabilities
$552,741 $577,909 (4.36 %) ($25,168)
Other liabilities
34,115,242 40,659,573 (16.10) (6,544,331)
Total liabilities
$34,667,983 $41,237,482 (15.93 %) ($6,569,499)
Net Position:
Unrestricted
$461,512,770 $543,521,742 (15.09 %) ($82,008,972)
Net investment in capital assets
11,593,026 11,885,041 (2.46) (292,015)
Total net position
$473,105,796 $555,406,783 (14.82 %) ($82,300,987)
Total liabilities and net position
$507,773,779 $596,644,265 (14.90 %) ($88,870,486)

5
The Commission’s total assets of $507.8 million represent a decrease of $88.9 million, or a 14.90% decline, compared with the prior year. Of this total, the decrease in current and other assets is approximately $88.6 million. The key factor contributing to this reduction in total assets is that total expenses, including program expenses (such as provider grants and contractors), were higher than the total revenue by $82.3 million. The $292,015 decrease in capital assets resulted from continued depreciation of the Commission’s assets. The depreciation expense for FY 2015-16 was $316,567. Additional information on capital assets can be found in Note 3 of this report. Other liabilities in FY 2015-16 decreased by 16.10% over the prior year and are primarily due to a reduction in expenses which resulted in a decrease to Accounts Payable in the current year compared to the prior year in the amount of $6.54 million. The following is a summary of the Commission’s revenues, expenses and change in net position comparing FY 2015-16 with FY 2014-15:
FY 2015-16 FY 2014-15
Percent Increase
(Decrease)
Increase (Decrease)
Revenues: Program revenues Tobacco taxes $87,942,700 $89,475,135 (1.71 %) ($1,532,435)Other state commission program funds 5,796,252 10,283,414 (43.63) (4,487,162)Medi-cal administrative activities 159,549 80,799 97.46 78,750 Partnership for families funds 9,001,152 4,615,313 95.03 4,385,839 Other program revenue 115,000 - N/A 115,000
Total program revenues $103,014,653 $104,454,661 (1.38 %) ($1,440,008)
General revenues Investment income $3,759,751 $3,903,275 (3.68 %) ($143,524)Net Increase (decrease) in fmv of investments 1,064,007 2,152,879 (50.58) (1,088,872)Other general income 119,100 104,072 14.44 15,028
Total general revenues 4,942,858 6,160,226 (19.76 %) (1,217,368)
Total revenues $107,957,511 $110,614,887 (2.40 %) ($2,657,376)
Expenses: Provider grants and other allocations $159,337,913 $168,766,806 (5.59 %) ($9,428,893)Pass-through grants $13,519,735 $14,225,131 (4.96) (705,396)Salaries and benefits 14,357,480 13,423,832 6.96 933,648 Operating services 1,157,290 1,346,532 (14.05) (189,242)Consultant services 990,724 1,216,609 (18.57) (225,885)Professional services 323,336 404,560 (20.08) (81,224)Other expenses 255,453 264,892 (3.56) (9,439)Depreciation 316,567 322,346 (1.79) (5,779)
Total expenses $190,258,498 $199,970,708 (4.86%) ($9,712,210)
Change in net position: (82,300,987) (89,355,821) 7.90% 7,054,834
Net position – beginning 555,406,783 644,762,604 (13.86 %) (89,355,821)
Net position – ending $473,105,796 $555,406,783 (14.82 %) ($82,300,987)

6
Revenues The Commission received a total of $108.0 million in revenues for FY 2015-16, reflecting a decrease of $2.7 million, or 2.40% compared with the prior year’s total revenues of $110.6 million. The overall changes in revenue are due to the following.
Tobacco Tax Tobacco tax revenue decreased from $89.5 million in FY 2014-15 to $87.9 million in FY 2015-16, a reduction of $1.5 million, or 1.71%. This decrease is primarily due to declining sales of tobacco products, the decline in birth in Los Angeles County and increased administrative fees assessed by the State Board of Equalization for the collection of tobacco taxes. Other State Commission Program Funds Other State Commission program funds decreased from $10.3 million in FY 2014-15 to $5.8 million in FY 2015-16, a reduction of $4.5 million, or 43.63%. In FY 2015-16, the Commission recorded $358,134 in IMPACT funds, $5.0 million in Child Signature Program (CSP), $399,423 in CARES Plus funds, and $41,850 from First 5 California Surplus Money Investment Fund (SMIF). The decrease compared to prior year is primarily related to recording $4.9 million less in CSP funds in FY 2015-16. Medi-Cal Administrative Activities The Medi-Cal Administrative Activities (MAA) program increased from $80,799 in FY 2014-15 to $159,549 in FY 2015-16. The program, contracted through the County of Los Angeles, assists in the administration of the Medi-Cal program by improving the availability and accessibility of Medi-Cal services to eligible participants. This increase is related to the timing of when First 5 LA received reimbursement from the State for Quarter 1 FY 2013-14 activity reported in FY 2014-15. It is important to note that MAA reimbursements are based on activities that are reimbursed from 18 months prior to billing. Partnership for Families Funds The Commission recorded $9.0 million in revenue under the contract agreement with the Department of Children and Family Services (DCFS) to fund the Partnership for Families (PFF) program. While First 5 LA funding for PFF ended in December 2014, the program continued through funding from DCFS. First 5 LA agreed under contract to manage the program structure in order to allow DCFS additional time to continue with their formal procurement process and the eventual management of the program. Other Program Revenue The Commission recorded $115,000 in revenue under the contract agreement with the Center for the Study of Social Policy (CSSP). First 5 LA partnered with CSSP to launch Project Developmental Understanding and Legal Collaboration for Everyone (Project DULCE) in Los Angeles County. Project DULCE is a clinical intervention based on the Strengthening Families approach, which puts parent engagement as a foundation, and is designed to address infant/family risks and needs at the earliest possible stage and partner with families to build strengths and capacities that foster optimal child health and development starting at birth.
Investment Income The Commission earned $3.8 million of investment income in FY 2015-16, which was a decrease of roughly $143,524, or approximately 3.68%, compared with the $3.9 million earned in the prior year. Though the overall rate of return increased from the prior year, the overall decrease is attributed to declining idle cash balance available for investments.

7
Fair Market Value Market Adjustment First 5 LA separated the Fair Market Value adjustment under investment income from the Statement of Activities to more accurately reflect true interest earned. In FY 2015-16, the Fair Market Value adjustment is $1.1 million, compared to $2.2 million in FY 2014-15. Other Revenues The Commission generated other revenue primarily through a lease agreement it has with La Petite Academy. This revenue increased by $15,028 from $104,072 in FY 2014-15 to $119,100 in FY 2015-16.
Expenses The Commission expended approximately $190.3 million in FY 2015-16 compared with $200.0 million in FY 2014-15, a decrease of $9.7 million, or 4.86%. The $9.7 million net decrease in overall expenditures encompasses the following from FY 2015-16.
Provider Grants and Other Allocations The Commission experienced a decrease of $9.4 million, or 5.59%, expending approximately $159.3 million in FY 2015-16 compared to $168.8 million in FY 2014-15 for “Provider grants and other allocations”. The net decrease is a result of many initiatives ramping down or ending, even while some initiatives began to experience a ramp up of activities during FY 2015-16. The following details activity based on the Commission’s investment categories, reorganized per the new Strategic Plan, during the fiscal year:
2015-2020 Strategic Plan: Focusing for the Future: FY 2015-16 marks the first year to align with the new five-year Strategic Plan, represented in three components of implementation activity. Due to program implementation delays, roughly $45.8 million of this was expended in FY 2015-16, with 84% of expenditures being within the existing areas of Welcome Baby, Select Home Visiting and the capacity building investments in the Commission’s 14 Best Start Communities.
Legacy Investments: This category includes existing multi-year programs scheduled to conclude or be realigned with the 2015-2020 Strategic Plan during the new Strategic Plan term. FY 2015-16 reflected a $12.3 million reduction in programs that expired in FY 2014-15, including $5.3 million for the Partnership for Families investment, which continued on as a “pass through grant,” by way of the Department of Children and Family Services. There were also significant decreases in funding for several other programs identified within Legacy Investments.
Research and Evaluation: This includes current and past investments that align and contribute
to the 2015-2020 Strategic Plan and the commitment to learning. FY 2015-16 reflects the first year in the transition to the new Monitoring, Evaluation, and Learning (MEL) framework which intends to provide the structure for organizing First 5 LA’s Research and Evaluation activities. The reduction in FY 2015-16 costs is indicative of the realignment of funds among the Data Development and Integration and Program Evaluation initiatives, as well as the expiration of two initiatives, Research Partnerships and Results Dissemination, compared to FY 2014-15. Total expenditures in FY 2015-16 amounted to approximately $6.6 million, about $1.9 million less than the $8.5 million incurred in FY 2014-15.
Pass-through Grants For FY 2015-16, $13.5 million was recorded as “pass through grants” compared to $14.2 million in FY 2014-15, a reduction of $705,396 or 4.96%. Of the $13.5 million, $4.9 million was for the First 5 California Child Signature Program (CSP), $8.5 million for the Los Angeles County Department of Children and Family Services Partnership for Families (LAC-PFF) program and $99,392 for Medi-Cal Administrative Activities.
8
Salaries and Benefits Salaries and Benefits increased from FY 2014-15 by $933,648 or 6.96%. This is due to an increase in the number of authorized positions, fewer vacant positions than in FY 2014-15, a 10% increase to the Health benefits, as well as an ongoing increase in salary costs attributed to the implementation of the compensation philosophy by the Commission in November 2014. Operating Services Compared to the prior year, there was a 14.05% decrease in costs related to general operating services, a result of the underutilization of general operating costs throughout the organization such as Mileage and Parking, Mobile devices, Postage, Printing, Subscriptions and Publications, and Office Supplies. Additionally, although it was included in the budget, the FY 2015-16 Worker's Compensation Insurance fee was paid in advance at the end of FY 2014-15 which lead to an unforeseen cost in FY 2014-15 and a decrease in FY 2015-16.
Consultant Services Consultant services decreased by $225,885 or 18.57% compared with FY 2014-15. This variance is largely due to an overestimation of resources, delayed project/activity implementation (FE, SharePoint, R&E MEL framework), and services/supports that were identified to no longer be required in FY 2015-16. Furthermore, approximately $170,000 in costs incurred in FY 2014-15 associated with the Executive Coaching and the Compensation and Benefits study did not continue into FY 2015-16. Professional Services Professional services decreased from FY 2014-15 by $81,224 or 20.08%. Professional Development budgeted services were underutilized in FY 2015-16 by all departments save for Public Affairs (now Communications & Marketing), and Research and Evaluation (R&E). There were also fewer costs related to legal fees, membership dues, and Commission stipends, as well as to the fact that First 5 LA prepaid dues for the FY 2015-16 First 5 Association annual membership in FY 2014-15.
Analysis of the Governmental Fund Statements The activities are contained in the general fund of the Commission. The focus of the Commission’s governmental funds is to provide information on near-term inflows, outflows and balances of spendable resources. Such information is useful in assessing the Commission’s financing requirements. In particular, fund balance may serve as a useful measure of the Commission’s net resources, both committed and available for future operation needs. As of the end of FY 2015-16, the Commission’s general fund reported a total ending fund balance of $460 million, a decrease of $76.6 million (14.27%) in comparison with the prior fiscal year balance of $537 million. Total fund balance decreased due to an ongoing disparity between annual incoming revenue and the expenses that are required to advance the activities and strategies outlined in the 2015-2020 Strategic Plan, including the ongoing responsibility to multi-year commitments for specific initiatives. Budgetary Highlights Based on the information provided in the Schedule of Revenues, Expenditures and Changes in Fund Balance – Budget and Actual – General Fund, the following analysis is presented. Final Revenue Budget vs. Actual Revenue The information below provides a summary of the primary factors that caused the variance between revenue estimates and actual revenue.

9
Tobacco Taxes Actual tobacco tax revenue of $87.9 million was approximately 8.73% higher than the anticipated amount of $80.9 million. The original estimate was based on data from the State Board of Equalization dated June 2, 2015. On June 27, 2016, updated State projections estimated $88.4 million in revenue for FY 2015-16, roughly $497,118 or .56% above actual.
State Commission Program Funds State Commission Program Funds in the amount of $10.4 million were recorded in FY 2015-16 for IMPACT funds, Child Signature Program, CARES Plus and from the First 5 California Surplus Money Investment Fund (SMIF).
Investment Income Investment income of $3.8 million was earned in FY 2015-16. The monthly average return of 0.83% is higher than the 0.75% anticipated and included in the Long Term Financial Projection approved by the Commission in February 2016.
Original Expenditure Budget vs. Final Expenditure Budget In March 2016 the Commission approved an overall reduction of $11.5 million or 5.0% from the original approved $229.7 million FY 2015-16 Budget, the following provides a brief summary of the primary factors that contributed to the decrease in the final budgeted expenditures compared with the original budgeted expenditures.
Provider Grants and Other Allocations The overall Program Budget (Provider Grants and Other Allocations) was adjusted downward during the year by $11.5 million, or 5.50%. In April 2016 the Commission approved this mid-year budget revision reducing the Families: Welcome Baby/Select Home Visiting investment by $5.6 million, the Communities: Community Capacity Building investments by $893,000, Legacy Investments by $5.1 million and Research & Evaluation projects by roughly $334,000. The overall reduction is driven by a couple factors, including the termination of an existing Select Home Visiting contract and a Welcome Baby hospital contract that did not come to fruition as anticipated. In addition, slower than expected ramp up, actual contracts being executed for lower than the initial budget estimates and underutilization within some of the direct service programs influenced the overall reduction within this category. General Operating Expenditures Funds were adjusted downward by $55,600 at mid-year. This decrease of 3.50% includes a number of transfers both in and out and is primarily due to a net reduction in Telephones and Modems costs of $19,200 and a reduction in costs related to Hardware and Software Maintenance of $30,000. The reduction in costs for telephones and modems is due to a new contract executed with the provider that reduced cost by approximately thirty percent.
Consultant Services
Funds were adjusted upward at mid-year, resulting in a net increase of $44,955 or 2.59%. This is driven primarily by additional funds needed under Other Professional Fees related to provisions of evening security for the building that were not anticipated during the initial budget development in FY 2015-16. Travel and Meeting Funds were adjusted upward at mid-year by $14,250 to reflect revised projections based on expenditures through January 2015.

10
Final Expenditure Budget vs. Actual Expenditure Amounts The following provides a summary of the primary factors causing the significant variances in the actual expenditures compared with the final budgeted expenditures.
Provider Grants and Other Allocations The total Provider Grants and Other Allocations variance for FY 2015-16 is $38.1 million. The FY 2015-16 budget to actual variance is a result of new program designs and the overestimation of resources required to execute the programs. Additional contributing factors impacting the underutilization of Provider Grants and Other are as followed; prolonged program planning and development, delays in contract/vendor negotiations and initiatives ramping down or ending (even while some initiatives began to experience a ramp up of activities during initiatives ramping down or ending). Of that variance, the Legacy Investments represent $21.2 million, or 55.5%, 2015-2020 Strategic Plan Investments represent $16.2 million, or 42.5%, and Research & Evaluation Projects represents $774,752, or 2.03%.
Pass-through Grants The total expenditures related to pass-through grants were $13.5 million for FY 2015-16. Commission’s annual fiscal year budget is developed to include planned expenditures of Commission funds only; programs that are funded via pass-through grants in which the Commission acts as an intermediary are not included in the annual budget to accurately represent expenditures of Commission funded provider grants and other allocations. Salaries and Benefits Salary and benefit costs were lower than budgeted, with a variance of $2.0 million. This is due to a combination of regular employee turnover and vacant positions, as well as a conservative budgeting approach. Specifically, for FY 2015-16 vacant positions were budgeted at the mid-range of the salary guidelines and were also budgeted for a full 12 months. Workers Compensation Insurance Costs related to Workers Compensation Insurance were lower than budgeted, because costs for FY 2015-16 premiums were paid in FY 2014-15. In addition, a return premium from the insurance policy was received in September 2016, resulting in a negative expenditure figure for the fiscal year. Telephones & Modems FY 2015-16 expenditures in this area were wholly offset by a refund received during the year from the long-distance telephone company that actually exceeded costs for the fiscal year, resulting in a negative expenditure figure. Equipment Repairs and Maintenance Equipment Repairs and Maintenance were lower than budgeted, with a variance of $24,124, or 89%. This is due to fewer repairs and maintenance needs than originally anticipated for FY 2015-16. Hardware and Software Maintenance Hardware and Software Maintenance costs were higher than budgeted, with a variance of $58,216, or 26%. This was due to a large number of annual maintenance service costs for FY 2016-17 that were paid in June 2016. Professional Dues – First 5 Association Costs related to annual dues for the First 5 Association were lower than budgeted because dues for the FY 2015-16 annual First 5 Association membership were actually paid in FY 2014-15.

11
Professional Development Professional Development costs were lower than budgeted, with a variance of $146,622, or 72%. This is primarily due to the organization’s efforts to establish a comprehensive professional development approach, which resulted in some intended expenses temporarily being placed on hold. Staff Recruitment Costs for Staff Recruitment were higher than budgeted, with a variance of $115, or less than 1%. This is due to slightly higher costs for executive recruitment than originally anticipated. Program Events Costs for Program Events were lower than budgeted, with a variance of $36,238, or 91%, because anticipated policy and advocacy events did not take place as originally expected. Consultant Services The budget to actual variance of $787,731, or 44%, is primarily due to an overestimation of resources coupled with delayed project implementation, including Financial Edge NXT, SharePoint reengineering, and the Monitoring, Evaluation and Learning (MEL) framework.
The final budget for Operations remained the same at $20.8 million for FY 2015-16, while the Program Budget was decreased by $11.5 million due to reductions driven by slower than anticipated ramp up, actual contracts coming in lower than the original budget estimates and underutilization within some of the direct service programs. Other Potentially Significant Matters The State projects a continuing decrease of State Tax Allocations revenue. The projected annual revenue decrease is estimated to be 2.20% through FY 2016-17 based on the Department of Finance projections published June 27, 2016. In addition, the passage of SBx2-7 by Senator Ed Hernandez (D-West Covina) raises the tobacco purchasing age from 18 to 21. Though the true impacts of this law are unknown, the state’s Legislative Analyst’s Office (LAO) assumes the reduction in tobacco consumption will reduce Proposition 10 revenues by up to $24 million per year. The initial projections from both the Department of Finance and the Board of Equalization indicates an additional reduction of prop 10 tobacco tax revenue for Los Angeles County ranging from 2.33% up to 5.33%. Contacting the Commission’s Financial Management This financial report is designed to provide the public with an overview of the Commission’s financial operations and condition. If you have questions about this report or need additional information, please contact the Commission’s Director of Finance at (213) 482-7545 or 750 N. Alameda Street Suite 300, Los Angeles, California 90012.

LOS ANGELES COUNTY CHILDREN AND FAMILIES FIRST - PROPOSITION 10 COMMISSION
STATEMENT OF NET POSITION AND GOVERNMENTAL FUND BALANCE SHEET JUNE 30, 2016
See accompanying notes to the basic financial statements.
12
General Adjustments Statement of NetFund (Note 1) Position
Assets
Cash 8,027,828$ -$ 8,027,828$ Investments 432,469,922 - 432,469,922 State receivable 20,987,269 - 20,987,269 Investment income receivable 416,259 - 416,259 Advances to grantees 34,279,475 - 34,279,475 Capital assets: - - -
Not depreciated - 2,039,000 2,039,000 Depreciable capital assets (net) - 9,554,026 9,554,026
Total assets 496,180,753$ 11,593,026$ 507,773,779$
Liabilities
Accounts payable and accrued liabilities 34,098,762$ -$ 34,098,762$ Other liabilities - 16,480 16,480 Compensated absences: - -
Due within one year - 78,963 78,963 Due in more than one year - 473,778 473,778
Total liabilities 34,098,762 569,221 34,667,983
Deferred Inflows of Resources
Unavailable revenue - State Commission Program Funds 1,937,484 (1,937,484) - Unavailable revenue - Other 68,331 (68,331) -
Total deferred inflows of resources 2,005,815 (2,005,815) -
Fund balance/net position
Fund balance:Nonspendable 34,279,475 (34,279,475) - Committed 249,515,814 (249,515,814) - Assigned 114,665,689 (114,665,689) - Unassigned 61,615,198 (61,615,198) -
Total fund balance 460,076,176 (460,076,176) -
Net position:Net investment in capital assets - 11,593,026 11,593,026 Unrestricted - 461,512,770 461,512,770
Total net position - 473,105,796 473,105,796
Total liabilities, deferred inflows of resourcesand fund balances/net position 496,180,753$ 11,593,026$ 507,773,779$

LOS ANGELES COUNTY CHILDREN AND FAMILIES FIRST - PROPOSITION 10 COMMISSION
STATEMENT OF ACTIVITIES AND GOVERNMENTAL FUND REVENUES, EXPENDITURES AND CHANGES IN FUND BALANCE
FOR THE YEAR ENDED JUNE 30, 2016
See accompanying notes to the basic financial statements.
13
General Adjustments Statement ofFund (Note 1) Activities
Revenues
Program revenuesOperating grants and contributions:
Tobacco taxes 87,942,700$ -$ 87,942,700$ State Commission Program Funds 10,433,575 (4,637,323) 5,796,252 Medi-Cal Administrative Activities 159,549 - 159,549 Partnership for Families Funds 9,914,472 (913,320) 9,001,152Other program revenue 115,000 - 115,000
Total program revenues 108,565,296 (5,550,643) 103,014,653
General revenuesInvestment income 3,759,751 - 3,759,751Net increase in FMV of investments 1,064,007 - 1,064,007Other general income 50,769 68,331 119,100
Total general revenues 4,874,527 68,331 4,942,858
Total revenues 113,439,823 (5,482,312) 107,957,511
Expenditures/expenses
Provider grants and other allocations 159,337,913 - 159,337,913 Pass-through grants 13,519,735 - 13,519,735 Salaries and benefits 14,382,648 (25,168) 14,357,480 Operating services 1,157,290 - 1,157,290 Consultant services 990,724 - 990,724 Professional services 323,336 - 323,336 Other expenses 255,453 - 255,453 Capital outlay 24,552 (24,552) - Depreciation - 316,567 316,567
Total expenditures/expenses 189,991,651 266,847 190,258,498
Excess/(deficiency) of revenues over/(under) expenditures (76,551,828) - -
Change in Fund Balance (76,551,828) 76,551,828 -
Change in Net Position - (82,300,987) (82,300,987)
Fund balance/net positionBeginning of year 536,628,004 18,778,779 555,406,783 End of year 460,076,176$ 13,029,620$ 473,105,796$

LOS ANGELES COUNTY CHILDREN AND FAMILIES FIRST – PROPOSITION 10 COMMISSION
NOTES TO BASIC FINANCIAL STATEMENTS FOR THE YEAR ENDED JUNE 30, 2016
14
NOTE 1 – ORGANIZATION AND SUMMARY OF SIGNIFICANT ACCOUNTING POLICIES Reporting Entity With the passage of a ballot initiative in November 1998, California (the “State”) voters approved the establishment of the Los Angeles County Children and Families First – Proposition 10 Commission (the “Commission”), a component unit of Los Angeles County. A thirteen-member Board of Commissioners governs the Commission. The Commission was created by and ultimately is under the authority of the Los Angeles County Board of Supervisors, in accordance with California State Law, through its appointment of the Board of Commissioners and its ability to remove the commissioners at will. The Commission is a public entity legally separate and apart from the County. The initiative, Proposition 10, mandated an additional 50-cent-per-pack tax on cigarettes and a comparable increase in the tax of other tobacco products and required that the new funds be used on programs focused exclusively on early childhood development for children prenatal up to five years of age. Following the directive of Proposition 10 to fund programs at the community level, each of the State’s 58 counties created a Proposition 10 Commission as well as a trust fund to receive Proposition 10 revenues. In Los Angeles County, the Board of Supervisors passed an ordinance in December 1998 to establish the Los Angeles County Children and Families First – Proposition 10 Commission, and in May 1999 the Commission held its first meeting, elected officers and established a number of ad hoc committees to address organizational and planning issues. The Commissioners and others who were involved in the effort regarded Proposition 10 as an extraordinary and unprecedented opportunity to begin making a difference in the lives of pregnant women, young children and their families, and to do so at a point in their lives when it can make the most difference. In August 2002, the Commission introduced a new branding identity, First 5 LA, to signify the importance of the first five years of life. The Commission’s vision statement is that all children throughout Los Angeles’ diverse communities, “are born healthy and raised in a safe, loving and nurturing environment so that they grow up healthy in mind, body, and spirit, are eager to learn with opportunities to reach their full potential.” The Commission’s mission, in partnership with others, is to “strengthen families, communities, and systems of services and support so all children in LA County enter kindergarten ready to succeed in school and life.” Upon termination of the Commission, all assets of the Commission shall be returned to the State of California. The liabilities of the Commission shall not become liabilities of the County upon either termination of the Commission or the liquidation or disposition of the Commission’s remaining assets. Basis of Accounting and Measurement Focus Government-wide Financial Statements Government-wide financial statements consist of the statement of net position and the statement of activities. These statements are presented on an economic resources measurement focus. All economic resources and obligations of the reporting government are reported in the financial statements.

LOS ANGELES COUNTY CHILDREN AND FAMILIES FIRST - PROPOSITION 10 COMMISSION
NOTES TO BASIC FINANCIAL STATEMENTS FOR THE YEAR ENDED JUNE 30, 2016
15
NOTE 1 – ORGANIZATION AND SUMMARY OF SIGNIFICANT ACCOUNTING POLICIES (Continued) Government-wide Financial Statements (Continued) The government-wide financial statements are reported using the economic resources measurement focus and the accrual basis of accounting. With this measurement focus, all assets and liabilities associated with operation of the Commission’s fund are included on the statement of net position. The statement of activities presents a comparison of the direct expenses and program revenues for the Commission's governmental activities. Program revenues include grants and contributions restricted for the operational requirements of a particular program. Grants and similar items are recognized as revenue as soon as all eligibility requirements have been met. Program revenues include tobacco taxes, and state school matching funds. General revenues are all revenues that do not qualify as program revenues and include investment income and other income. Net position represent the resources that the Commission has available for use in providing services. Net position is composed of net investment in capital assets and unrestricted funds. At June 30, 2016, the Commission reported unrestricted net position of $461,512,770. Fund Financial Statements The fund financial statements consist of the balance sheet and the statement of revenues, expenditures and changes in fund balance of the Commission’s general fund. These statements are presented on a current-financial resources measurement focus. The fund financial statements focus on near-term inflows and outflows of spendable resources and on balances of spendable resources available at the end of the fiscal year. The statement of revenues, expenditures and changes in fund balance for the governmental fund generally presents increases (revenues) and decreases (expenditures) in net current resources. All operations of the Commission are accounted for in the general fund. The fund financial statements have been prepared on the modified accrual basis of accounting. Revenues are recognized in the accounting period in which they become both measurable and available to finance expenditures of the current period. Revenues are considered available if they are received within 60 days after year-end. Revenues susceptible to accrual include tax revenues, grants, and investment income. Expenditures are recognized in the accounting period in which the fund liability is incurred except for compensated absences which are recorded only when payment is due. Adjustments Between Fund Financial Statements and Government-Wide Financial Statements Capital Assets Capital assets are not considered to be financial resources and therefore, are not reported as an asset in the fund financial statements. Capital assets in the amount of $11,593,026 are capitalized and reported at cost, net of accumulated depreciation, in the government-wide financial statements. Capital assets purchased during the year in the amount of $24,552 are reported as expenditures on the fund financial statements and capitalized on the government-wide financial statements. Depreciation expense for the year ended June 30, 2016 amounted to $316,567 and is included in the government-wide financial statements.

LOS ANGELES COUNTY CHILDREN AND FAMILIES FIRST - PROPOSITION 10 COMMISSION
NOTES TO BASIC FINANCIAL STATEMENTS FOR THE YEAR ENDED JUNE 30, 2016
16
NOTE 1 – ORGANIZATION AND SUMMARY OF SIGNIFICANT ACCOUNTING POLICIES (Continued) Adjustments Between Fund Financial Statements and Government-Wide Financial Statements (Continued) Long-Term Liabilities As of June 30, 2016, the Commission estimated its liability for vested compensated absences to be $552,741. Compensated absence obligations are considered long-term in nature and are reported in the fund financial statements as expenditures in the period paid or when due and payable at year-end under the modified accrual basis of accounting. The compensated absences have been accrued in the government-wide financial statements and are included in long-term liabilities. The change in compensated absences during the year of $25,168 is reported in the statement of activities and does not require the use of current financial resources. For the year ended June 30, 2016, the Commission maintained a security deposit in the amount of $16,480 related to a facility use agreement with La Petite Academy for use of the first floor of the Commission’s building for the period of July 1, 2012 through June 30, 2020. Unavailable Revenue Under the modified accrual basis of accounting, revenue is recognized in the fund financial statements if it has been collected after year-end within the Commission’s established availability period of 60 days. All other accrued revenues due to the Commission are recognized as unavailable revenue at year-end in the fund financial statements. Governmental funds recognized unavailable revenue where receivables are not available to liquidate liabilities of the current period. As of June 30, 2016, the Commission has unavailable revenue of $2,005,815. The change in unavailable revenue during the year of $5,482,312 is reported in the statement of activities as this revenue was recognized in the prior year statement of activities. Net Position In the government-wide financial statements, net position represents the difference between assets less liabilities and is classified into two components.
Net investment in capital assets – This balance reflects the net position of the Commission that are invested in capital assets. This amount is generally not accessible for other purposes.
Unrestricted net position – This balance represents the net amount of the assets and liabilities that are available for general use.
Fund Balance Fund balance classifications comprise a hierarchy based primarily on the extent to which a government is bound to observe constraints imposed upon the use of the resources reported in governmental funds. The Commission established the following classifications and definitions of fund balance for the year ended June 30, 2016:
a. Nonspendable Portion of net resources that cannot be spent because they are not in an expendable form (e.g. Advances to Grantees) or the portion of net resources that cannot be spent because they must be maintained intact (e.g. revolving fund or the principal of an endowment).

LOS ANGELES COUNTY CHILDREN AND FAMILIES FIRST - PROPOSITION 10 COMMISSION
NOTES TO BASIC FINANCIAL STATEMENTS FOR THE YEAR ENDED JUNE 30, 2016
17
NOTE 1 – ORGANIZATION AND SUMMARY OF SIGNIFICANT ACCOUNTING POLICIES (Continued) Adjustments Between Fund Financial Statements and Government-Wide Financial Statements (Continued) Fund Balance (Continued)
b. Restricted (externally enforceable limitations on use)
Amounts constrained to specific purposes by their providers (such as creditors, grantors, contributors, or laws and regulations of other governments: e.g. funds advanced by First 5 CA under specific agreements for services such as matching funds for specific initiatives. Amounts constrained by limitations imposed by law through constitutional provisions or enabling legislation (e.g. funds legally restricted by County, state, or federal legislature, or a government’s charter or constitution; or amounts collected from non-spendable items such as long term portion of loan outstanding if those amounts are subject to legal constraint).
c. Committed (self-imposed limitations in place prior to end of the period)
Amounts constrained by limitations imposed at the highest level of decision making authority that requires the same formal action at the same level to remove or modify. The formal action required by the Board of Commissioners for funds to be committed is action by way of resolution allocating funding for a specific program or initiative.
d. Assigned (limitation resulting from intended use)
Amounts or limitations that are constrained by the Commission’s intent to be used for a specific purpose (the purpose of the assignment must be narrower than the general fund itself) and are not either restricted or committed. Adoption of a Strategic Plan or Long Term Financial Plan with general spending parameters would be examples of the Commission’s intent and would constitute an assignment. Accordingly, modification to the Commission’s intent would not require formal action. Further, the Commission may designate a body/committee or an official who can specify such purposes. However as of June 30, 2016, the Commission had not made such a designation.
e. Unassigned (residual net resources)
Resources in the fund balance that cannot be reported in any other classification including a minimum fund balance reserve based on 25% of the operating and programmatic budget. It also includes the negative residual fund balance that cannot be eliminated by offsetting assigned fund balance amounts.
When both restricted and unrestricted resources are available for use, it is the Commission’s policy to use restricted resources first and then unrestricted resources as needed. The spending priority of fund balance is restricted, committed, assigned, and then unassigned.
LOS ANGELES COUNTY CHILDREN AND FAMILIES FIRST - PROPOSITION 10 COMMISSION
NOTES TO BASIC FINANCIAL STATEMENTS FOR THE YEAR ENDED JUNE 30, 2016
18
NOTE 1 – ORGANIZATION AND SUMMARY OF SIGNIFICANT ACCOUNTING POLICIES (Continued) Effect of New Governmental Accounting Standards Board (GASB) Pronouncements Effective This Fiscal Year GASB Statement No. 72 – In February 2015, GASB issued Statement No. 72, Fair Value Measurement and Application. This Statement addresses accounting and financial reporting issues related to fair value measurements. The definition of fair value is the price that would be received to sell an asset or paid to transfer a liability in an orderly transaction between market participants at the measurement date. This Statement provides guidance for determining a fair value measurement for financial reporting purposes. This Statement also provides guidance for applying fair value to certain investments and disclosures related to all fair value measurements. This statement is effective for periods beginning after June 15, 2015. The Commission implemented this statement effective July 1, 2015. GASB Statement No. 73 – In June 2015, GASB issued Statement No. 73, Accounting and Financial Reporting for Pensions and Related Assets That Are Not within the Scope of GASB Statement 68, and Amendments to Certain Provisions of GASB Statements 67 and 68. The objective of this Statement is to improve the usefulness of information about pensions included in the general purpose external financial reports of state and local governments for making decisions and assessing accountability. This Statement establishes requirements for defined benefit pensions that are not within the scope of Statement No. 68, Accounting and Financial Reporting for Pensions, as well as for the assets accumulated for purposes of providing those pensions. In addition, it establishes requirements for defined contribution pensions that are not within the scope of Statement 68. It also amends certain provisions of Statement No. 67, Financial Reporting for Pension Plans, and Statement 68 for pension plans and pensions that are within their respective scopes. This statement is effective in two phases for periods beginning after June 15, 2015 and June 15, 2016. The Commission has determined that the requirements of this statement effective in the current year do not have a material impact on the financial statements. The Commission has not determined the effect on the financial statements for the requirements effective in fiscal year 2017. GASB Statement No. 76 – In June 2015, GASB issued Statement No. 76, The Hierarchy of Generally Accepted Accounting Principles for State and Local Governments. The objective of this Statement is to identify—in the context of the current governmental financial reporting environment—the hierarchy of generally accepted accounting principles (GAAP). This statement is effective for periods beginning after June 15, 2015. The Commission implemented this statement effective July 1, 2015. The Commission has determined that this statement does not have a material impact on the financial statements. GASB Statement No. 79 – In December 2015, GASB issued Statement No. 79, Certain External Investment Pools and Pool Participants. The Statement addresses accounting and financial reporting for certain external investment pools and pool participants. The Statement establishes criteria for an external investment pool to qualify for making the election to measure all of its investments at amortized cost for financial reporting purposes. The Statement establishes additional note disclosure requirements for qualifying external investment pools that require measurement of their investments at amortized cost for financial reporting purposes and for governments that participate in those pools. Both the qualifying external investment pools and their participants are required to disclose information about any limitations or restrictions on participant withdrawals. The Statement is effective for the periods beginning after June 15, 2015. The Commission has determined that this statement does not have a material impact on the financial statements.

LOS ANGELES COUNTY CHILDREN AND FAMILIES FIRST - PROPOSITION 10 COMMISSION
NOTES TO BASIC FINANCIAL STATEMENTS FOR THE YEAR ENDED JUNE 30, 2016
19
NOTE 1 – ORGANIZATION AND SUMMARY OF SIGNIFICANT ACCOUNTING POLICIES (Continued) Effect of New Governmental Accounting Standards Board (GASB) Pronouncements (Continued) Effective in Future Fiscal Years GASB Statement No. 74 – In June 2015, GASB issued Statement No. 74, Financial Reporting for Postemployment Benefit Plans Other Than Pension Plans. The objective of this Statement is to improve the usefulness of information about postemployment benefits other than pensions (other postemployment benefits or OPEB) included in the general purpose external financial reports of state and local governmental OPEB plans for making decisions and assessing accountability. This statement is effective for periods beginning after June 15, 2016. The Commission has not determined the effect on the financial statements. GASB Statement No. 75 – In June 2015, GASB issued Statement No. 75, Accounting and Financial Reporting for Postemployment Benefits Other Than Pensions. The primary objective of this Statement is to improve accounting and financial reporting by state and local governments for postemployment benefits other than pensions (other postemployment benefits or OPEB). It also improves information provided by state and local governmental employers about financial support for OPEB that is provided by other entities. This statement is effective for periods beginning after June 15, 2017. The Commission has not determined the effect on the financial statements. GASB Statement No. 77 – In August 2015, GASB issued Statement No. 77, Tax Abatement Disclosures. This Statement requires governments that enter into tax abatement agreements to disclose certain information about the agreements. The requirements of this Statement are effective for reporting periods beginning after December 15, 2015. The Commission has not determined the effect on the financial statements. GASB Statement No. 78 – In December 2015, GASB issued Statement No 78, Pensions Provided through Certain Multiple-Employer Defined Benefit Pension Plans. The Statement amends the scope and applicability of GASB Statement No. 68 to exclude certain types of cost-sharing multiple-employer plans. The Statement is effective for the periods beginning after December 15, 2015. The Commission has not determined the effect on the financial statements. GASB Statement No. 80 – In January 2016, GASB issued Statement No. 80, Blending Requirements for Certain Component Units – An Amendment of GASB Statement No. 14. The objective of the Statement is to improve financial reporting by clarifying the financial statement presentation requirements for certain component units. This Statement amends the blending requirements established in paragraph 53 of Statement No. 14, The Financial Reporting Entity, as amended. The additional criterion requires blending of a component unit incorporated as a not-for-profit corporation in which the primary government is the sole corporate member. The Statement is effective for the reporting periods beginning after June 15, 2016. The Commission has not determined the effect of the statement.
LOS ANGELES COUNTY CHILDREN AND FAMILIES FIRST - PROPOSITION 10 COMMISSION
NOTES TO BASIC FINANCIAL STATEMENTS FOR THE YEAR ENDED JUNE 30, 2016
20
NOTE 1 – ORGANIZATION AND SUMMARY OF SIGNIFICANT ACCOUNTING POLICIES (Continued) Effect of New Governmental Accounting Standards Board (GASB) Pronouncements (Continued) Effective in Future Fiscal Years (Continued) GASB Statement No. 81 – In March 2016, GASB issued Statement No. 81, Irrevocable Split–Interest Agreements. The objective of the Statement is to improve financial reporting for irrevocable split-interest agreements by providing recognition and measurement guidance for situations in which a government is a beneficiary of the agreement. The Statement requires that a government that receives resources pursuant to an irrevocable split-interest agreement recognize assets, liabilities, and deferred inflows of resources at the inception of the agreement. Furthermore, the Statement requires that a government recognize assets representing its beneficial interests in irrevocable split-interest agreements that are administered by a third party, if the government controls the present service capacity of the beneficial interests. The Statement requires that a government recognize revenue when the resources become applicable to the reporting period. The Statement is effective for the reporting periods beginning after December 15, 2016. The Commission has not determined the effect of the statement. GASB Statement No. 82 – In March 2016, GASB issued Statement No. 82, Pension Issues – An Amendment of GASB Statements No. 67, No. 68, and No. 73. The objective of the Statement is to address certain issues that have been raised with respect to Statements No. 67, Financial Reporting for Pension Plans, No. 68, Accounting and Financial Reporting for Pensions, and No. 73, Accounting and Financial Reporting for Pensions and Related Assets That Are Not within the Scope of GASB Statement 68, and Amendments to Certain Provisions of GASB Statements 67 and 68. Specifically, the Statement addresses issues regarding (1) the presentation of payroll-related measures in required supplementary information, (2) the selection of assumptions and the treatment of deviations from the guidance in an Actuarial Standard of Practice for financial reporting purposes, and (3) the classification of payments made by employers to satisfy employee (plan member) contribution requirements. The Statement is effective for the reporting periods beginning after June 15, 2016. The Commission has not determined the effect of the statement. Investments
The Commission participates in the common investment pool of Los Angeles County. Investments are reported at fair value which is the amount at which financial instruments could be exchanged in a current transaction between willing parties. The Commission categorizes the fair value measurements of its investments based on the hierarchy established by generally accepted accounting principles. The fair value hierarchy, which has three levels, is based on the valuation inputs used to measure an asset’s fair value: Level 1 inputs are quoted prices in active markets for identical assets; Level 2 inputs are significant other observable inputs; Level 3 inputs are significant unobservable inputs. The Commission does not have any investments that are measured using Level 3 inputs. The Los Angeles County Treasurer is responsible for establishing and consistently applying a policy for identifying those events that might affect fair value measurements.

LOS ANGELES COUNTY CHILDREN AND FAMILIES FIRST - PROPOSITION 10 COMMISSION
NOTES TO BASIC FINANCIAL STATEMENTS FOR THE YEAR ENDED JUNE 30, 2016
21
NOTE 1 – ORGANIZATION AND SUMMARY OF SIGNIFICANT ACCOUNTING POLICIES (Continued) Advances to Grantees The Commission may provide advances to grantees/contractors that are repayable by the end of the fiscal year unless otherwise stipulated by contract or agreement. The Commission provided three advances to grantees for the fiscal year ended June 30, 2016. The largest of the advances is provided to Los Angeles Universal Preschool which provides quality preschool education and early childhood programs regardless of their families’ income. Advances to Grantees:
Los Angeles Universal Preschool 25,320,585$ Los Angeles Health Care Plan 8,254,590 University of California - Los Angeles Dental Home Project 704,300
Total Advances to Grantees 34,279,475$
Capital Assets Capital assets are composed of buildings, building improvements, computer software and accessories, office equipment and furniture and fixtures and are recorded at cost. Donated capital assets are recorded at acquisition value at the date of donation. The Commission capitalizes assets with a cost in excess of $5,000 and special projects with a useful life greater than one year. The Commission depreciates capital assets using a straight-line method over the estimated useful life of fifty years for buildings, four years for computers and five years for office equipment and furniture and fixtures. Building improvements are depreciated over the remaining useful life of the building. Deferred Inflows of Resources Deferred inflows of resources represent an acquisition of fund balance that applies to a future period and will not be recognized as an inflow of resources (revenue) until that time. The Commission has one type of deferred inflow, unavailable revenue, which occurs only under the modified accrual basis of accounting. Accordingly, the item is reported only in the governmental fund balance sheet. This amount is deferred and recognized as an inflow of resources in the period that the amounts become available.
Use of Estimates The preparation of financial statements in conformity with accounting principles generally accepted in the United States requires management to make estimates and assumptions that affect the amounts reported in the financial statements and accompanying notes. Actual results could differ from those estimates.

LOS ANGELES COUNTY CHILDREN AND FAMILIES FIRST - PROPOSITION 10 COMMISSION
NOTES TO BASIC FINANCIAL STATEMENTS FOR THE YEAR ENDED JUNE 30, 2016
22
NOTE 2 – CASH AND INVESTMENTS Total cash and investments at fair value, as of June 30, 2016 are as follows: Cash:
Cash on hand 150$ Cash in bank 8,027,678
Total Cash 8,027,828
Investments with County Treasurer:Pooled cash and investments 432,469,922
Total investments with County Treasurer 432,469,922
Total Cash and Investments 440,497,750$
Cash in Bank The California Government Code requires California banks and savings and loan associations to secure the Commission's deposits by pledging government securities as collateral. The market value of pledged securities must equal 110% of an agency's deposits. California law also allows financial institutions to secure an agency's deposits by pledging first trust deed mortgage notes having a value of 150% of an agency's total deposits and collateral is considered to be held in the name of the Commission. At June 30, 2016, cash held by financial institutions of $8,425,312 was entirely insured and collateralized as described above. The book balance at June 30, 2016 was $8,027,678. Pooled Cash and Investments Investments with the Los Angeles County Treasurer at June 30, 2016 are stated at fair value. The fair value of pooled investments is determined annually and is based on current market prices. The fair value of each participant’s position in the pool is the same as the value of the pool shares. The method used to determine the value of participants’ equity withdrawn is based on the book value of the participants’ percentage participation at the date of such withdrawals. As of June 30, 2016, the Commission’s percentage of participation is 1.64. The Los Angeles County Treasury is sponsored and administered by the County of Los Angeles and oversight is conducted by the County Treasury Oversight Committee. At June 30, 2016, the weighted average maturity for the County pool approximated 608 days and the County pool is not rated. For further information regarding the Los Angeles County Investment Pool, refer to the County of Los Angeles Comprehensive Annual Financial Report. Fair Value Measurements The Commission categorizes its fair value measurements within the fair value hierarchy established by generally accepted accounting principles. The hierarchy is based on the valuation inputs used to measure the fair value of the asset. Level 1 inputs are quoted prices in active markets for identical assets, Level 2 inputs are significant other observable inputs; Level 3 inputs are significant unobservable inputs. As of June 30, 2016, the Commission held no individual investments. All funds are invested in the Los Angeles County Investment Pool.
LOS ANGELES COUNTY CHILDREN AND FAMILIES FIRST - PROPOSITION 10 COMMISSION
NOTES TO BASIC FINANCIAL STATEMENTS FOR THE YEAR ENDED JUNE 30, 2016
23
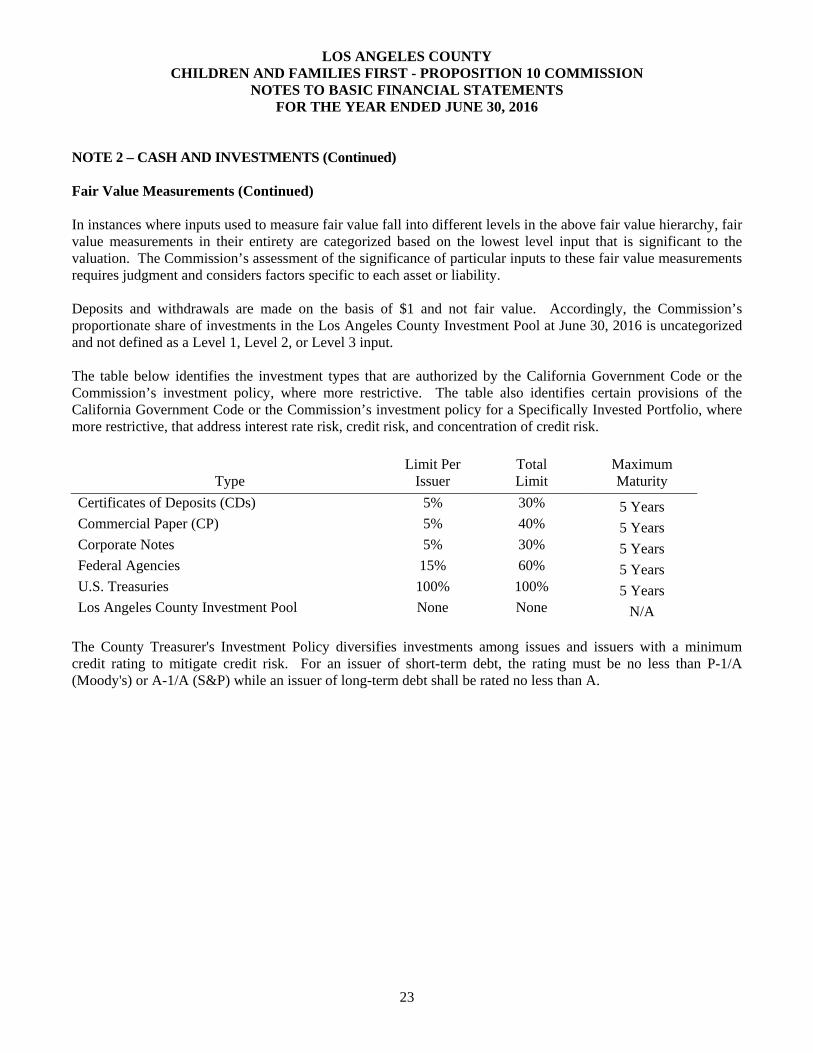
NOTE 2 – CASH AND INVESTMENTS (Continued) Fair Value Measurements (Continued) In instances where inputs used to measure fair value fall into different levels in the above fair value hierarchy, fair value measurements in their entirety are categorized based on the lowest level input that is significant to the valuation. The Commission’s assessment of the significance of particular inputs to these fair value measurements requires judgment and considers factors specific to each asset or liability. Deposits and withdrawals are made on the basis of $1 and not fair value. Accordingly, the Commission’s proportionate share of investments in the Los Angeles County Investment Pool at June 30, 2016 is uncategorized and not defined as a Level 1, Level 2, or Level 3 input. The table below identifies the investment types that are authorized by the California Government Code or the Commission’s investment policy, where more restrictive. The table also identifies certain provisions of the California Government Code or the Commission’s investment policy for a Specifically Invested Portfolio, where more restrictive, that address interest rate risk, credit risk, and concentration of credit risk.
Type
Limit Per Issuer
Total Limit
Maximum Maturity
Certificates of Deposits (CDs) 5% 30% 5 Years Commercial Paper (CP) 5% 40% 5 Years Corporate Notes 5% 30% 5 Years Federal Agencies 15% 60% 5 Years U.S. Treasuries 100% 100% 5 Years Los Angeles County Investment Pool None None N/A
The County Treasurer's Investment Policy diversifies investments among issues and issuers with a minimum credit rating to mitigate credit risk. For an issuer of short-term debt, the rating must be no less than P-1/A (Moody's) or A-1/A (S&P) while an issuer of long-term debt shall be rated no less than A.

LOS ANGELES COUNTY CHILDREN AND FAMILIES FIRST - PROPOSITION 10 COMMISSION
NOTES TO BASIC FINANCIAL STATEMENTS FOR THE YEAR ENDED JUNE 30, 2016
24
NOTE 3 – CAPITAL ASSETS
Balance BalanceJuly 1, 2015 Increases Decreases June 30, 2016
Capital assets, not depreciated:Land 2,039,000$ -$ -$ 2,039,000$
Capital assets, depreciable:Building and improvements 12,076,512 - - 12,076,512 Computer software and accessories 1,755,170 24,552 - 1,779,722 Office equipment 331,035 - - 331,035 Furniture and fixtures 627,670 - - 627,670
Total Depreciable Capital Assets 14,790,387 24,552 - 14,814,939
Less accumulated depreciation:Building and improvements (2,435,216) (242,680) - (2,677,896) Computer software and accessories (1,614,776) (43,353) - (1,658,129) Office equipment (266,685) (30,534) - (297,219) Furniture and fixtures (627,669) - - (627,669)
Total Accumulated Depreciation (4,944,346) (316,567) - (5,260,913)
Total Capital Assets, Depreciable (Net) 9,846,041 - - 9,554,026
Capital Assets, Net 11,885,041$ (292,015)$ -$ 11,593,026$
NOTE 4 – CHANGES IN COMPENSATED ABSENCES Compensated absences liability activities for the year ended June 30, 2016 is as follows:
Balance Balance Due WithinJuly 1, 2015 Increases Decreases June 30, 2016 One Year
Compensated absences 577,909$ 623,361$ (648,529)$ 552,741$ 78,963$

LOS ANGELES COUNTY CHILDREN AND FAMILIES FIRST - PROPOSITION 10 COMMISSION
NOTES TO BASIC FINANCIAL STATEMENTS FOR THE YEAR ENDED JUNE 30, 2016
25
NOTE 5 – FUND BALANCE Fund balance is classified using a hierarchy based primarily on the extent to which a government is bound to observe constraints imposed upon the use of the resources reported in governmental funds. Fund balance at June 30, 2016 consists of the following:
INITIATIVE/PROGRAM ALLOCATIONNONSPENDABLE
Advances: LA Care Health Plan 8,254,590$ LAUP 25,320,585 UCLA Dental Home Project 704,300 TOTAL 34,279,475$
COMMITTED At-Risk Fathers Investment 598,500$ Baby Friendly Hospitals/Family Place Libraries 24,133,679 Black Infant Health 5,714,561 Children's Dental Care 20,342,895 Children's Vision Care 1,582,789 Communications & Marketing 5,345,000 Communications - Conference Funding 300,000 Communities 18,883,000 Data Development & Integration 861,000 Data Partnership with Funders 2,353,121 Early Care & Education Systems 24,199,000 Early Identification & Intervention - Autism & Other Developmental Delays 701,073 Families 38,081,000 Healthy Food Access 1,764,514 Health Related Systems 2,421,000 Information Resource and Referral 1,260,000 LAUP 12,233,753 Little by Little/One Step Ahead 21,412,981 Parent-Child Interaction Therapy 12,529,944 Reducing Childhood Obesity 6,034,967 Policy Advocacy Fund 1,263,000 Policy Agenda/Advocacy 2,442,000 Program Evaluation 4,707,000 Resource Mobilization - ECE 800,000 Resource Mobilization - Funder Partnerships 75,000 Resource Mobilization - Health 326,000 Resource Mobilization - Organizational Capacity Building 125,000 Resource Mobilization - Project Development 250,000 Universal Assessment of Newborns 34,783,040 Workforce Development 555,000 Workforce Development - ECE Workforce Consortium 3,436,997 TOTAL $ 249,515,814

LOS ANGELES COUNTY CHILDREN AND FAMILIES FIRST - PROPOSITION 10 COMMISSION
NOTES TO BASIC FINANCIAL STATEMENTS FOR THE YEAR ENDED JUNE 30, 2016
26
NOTE 5 – FUND BALANCE (Continued)
ASSIGNEDStrategic Plan 114,665,689$ TOTAL 114,665,689$
UNASSIGNED Unassigned 61,615,198$ TOTAL 61,615,198$
Total Fund Balance 460,076,176$
The minimum fund balance reserve of $40,380,040 is included as part of unassigned fund balance. NOTE 6 – PROGRAM EVALUATION In accordance with the Standards and Procedures for Audits of California Counties Participating in the California Children and Families Program, issued by the California State Controller, the Commission is required to disclose the amounts expended during the fiscal year on program evaluation. Program evaluation costs pertain to those activities undertaken to support the collection, production, analysis and presentation of evaluation information for Commission management, Commissioners and other interested parties. The Commission spent $6,413,876 on program evaluation during the year ended June 30, 2016. NOTE 7 – DEFERRED COMPENSATION PLANS All regular and limited-term employees of the Commission participate in the 403(b) Savings and Investment Plan, a defined contribution plan administered by The Standard. Benefit provisions under the plan are established by the California Government Code Section 31694(a) and other applicable statutes. The 403(b) Savings and Investment Plan provides for service retirement, death, and disability benefits to plan members. The plan can be amended by executive management of the Commission. Regular and limited-term employees are eligible to receive both an elective and a non-elective contribution based on years of completed service with the organization. The elective contribution requires employee participation in order to receive the employer match, and is between 1% and 3% depending on the employee’s contribution and the years of service the employee has completed with the organization: 1% for less than one year, 2% after one year and 3% for after two years or more of completed service. The Commission also makes a separate, non-elective contribution into the retirement plan regardless of employee participation. This non-elective employer contribution is between 3% and 7.5% based on years of completed service with the organization: 3% for less than 5 years, 4.5% for 5 to 9 years, 6% for 10 to 14 years, and 7.5% after 15 years or more of completed service. Employer contributions are not 100% vested until an employee has completed three years of service with the organization, with a graded vesting schedule for employees who complete at least one year of service. The Commission contributed a total of $704,691 which comprised of $286,038 in elective contribution and $418,653 in non-elective contribution for the fiscal year ended June 30, 2016.

LOS ANGELES COUNTY CHILDREN AND FAMILIES FIRST - PROPOSITION 10 COMMISSION
NOTES TO BASIC FINANCIAL STATEMENTS FOR THE YEAR ENDED JUNE 30, 2016
27
NOTE 8 – UNAVAILABLE REVENUE The general fund reports unavailable revenue on the governmental fund balance sheet in connection with resources that have been earned, but are not yet available to finance expenditures of the current fiscal period. This type of deferred inflow of resources occurs only under the modified accrual basis of accounting. Accordingly, unavailable revenue is reported only in the general fund balance sheet. At the end of the current fiscal year, the components of unavailable revenue resulting from funds not received within the 60-day period of availability were as follows: Unavailable Revenue:
Child Signature Program 1,368,755$ CARES Plus Program 323,756 IMPACT Program 244,973 Other 68,331
Total Unavailable Revenue 2,005,815$
NOTE 9 – RISK MANAGEMENT The Commission is exposed to various risks of loss related to general liability, property liability, health benefits, workers’ compensation and auto. These risks are addressed through commercial insurance policies. The Commission’s property and liability insurance is provided by insurance companies that are “Non-Admitted” insurance companies in the State of California. If such a company becomes insolvent, the California Insurance Guarantee Association will not settle unpaid claims. No claims or suits are pending against the Commission arising out of proposed claim settlements covered by insurance. No settlements exceeded insurance coverage during the last three years. NOTE 10 – COMMITMENTS AND CONTINGENCIES Operating Lease The Commission leases equipment from a third party which expires in July 2019 and is non-cancelable. The future minimum rental payments due under the lease are as follows:
For Year EndingJune 30, Annual
2017 58,744$ 2018 18,522 2019 18,522 2020 1,544 Total 97,332$
The Commission recognized $91,206 in lease expense for the year ended June 30, 2016.

LOS ANGELES COUNTY CHILDREN AND FAMILIES FIRST - PROPOSITION 10 COMMISSION
NOTES TO BASIC FINANCIAL STATEMENTS FOR THE YEAR ENDED JUNE 30, 2016
28
NOTE 10 – COMMITMENTS AND CONTINGENCIES (Continued) Future Funding The Commission has entered into future funding commitments with various entities, which are contingent on State funding. NOTE 11 – RELATED PARTY TRANSACTIONS The Commission incurred expenses totaling $61,343 for County of Los Angeles services provided during the year ended June 30, 2016. The Commission paid $139,141,543 of provider grants, operating services, consultant services, and professional services to organizations which are represented by 10 members of the Board of Commissioners. NOTE 12 – FIRST 5 CALIFORNIA CARES PLUS PROGRAM CARES Plus is designed to improve the quality of early learning programs by focusing on increasing the quality, effectiveness, and retention of early educators. As a statewide professional development program, its main objectives are to improve both the quality of early learning programs, and ultimately, learning and developmental outcomes for young children. The Commission claimed $399,423 in CARES Plus Phase II reimbursable expenses for the period ended June 30, 2016. Phase II funds have a four-to-one Commission match to each dollar of First 5 funding. NOTE 13 – CHILD SIGNATURE PROGRAM The Child Signature Program is designed to prepare at-risk children for kindergarten by increasing opportunities for children to advance into elementary school with a focus on language, literacy, early math skills, and social and emotional development. As a statewide program, the Child Signature Program works to invest in high quality preschool programs that enhance the quality of care and education that children receive. The Commission claimed $4,996,844 in Child Signature Program reimbursable expenses for the period ended June 30, 2016.

REQUIRED SUPPLEMENTARY INFORMATION LOS ANGELES COUNTY
CHILDREN AND FAMILIES FIRST - PROPOSITION 10 COMMISSION SCHEDULE OF REVENUES, EXPENDITURES, AND
CHANGES IN FUND BALANCE – BUDGET AND ACTUAL – GENERAL FUND FOR THE YEAR ENDED JUNE 30, 2016
See accompanying note to required supplementary information.
29
VarianceOriginal Final PositiveBudget Budget Actual (Negative)
RevenuesTobacco taxes 80,883,996$ 80,883,996$ 87,942,700$ 7,058,704$ State Commission Program Funds - - 10,433,575 10,433,575 Medi-Cal Administrative Activities - - 159,549 159,549 Partnership for Families Funds - - 9,914,472 9,914,472 Other program revenue - - 115,000 115,000 Investment income 3,539,485 3,539,485 3,759,751 220,266 Net increase (decrease) in FMV of investments - - 1,064,007 1,064,007 Other general income 154,253 154,253 50,769 (103,484)
Total revenues 84,577,734 84,577,734 113,439,823 28,862,089
ExpendituresProgram Costs
Provider grants and other allocations 208,922,000 197,460,000 159,337,913 38,122,087 Pass-through grants - - 13,519,735 (13,519,735)
Total Program Costs 208,922,000 197,460,000 172,857,648 24,602,352
Operations & AdministrationPersonnel related expenditures
Salaries and wages 12,387,038 12,387,038 11,184,136 1,202,902 Fringe Benefits 3,980,943 3,980,943 3,198,512 782,431
Total Personnel Related Expenditures 16,367,981 16,367,981 14,382,648 1,985,333 General Operating Expenditures
ADP Payroll Charges 31,000 31,000 30,842 158 Workers' Compensation Insurance 100,000 100,000 (6,690) 106,690 Utilities 155,000 165,000 148,221 16,779 Corporate Insurance 76,000 76,000 67,775 8,225 Mileage and Parking 61,850 65,850 53,729 12,121 Telephones and Modems 65,000 45,800 (4,227) 50,027 Cell Phones and Mobile Devices 52,250 43,350 37,658 5,692 Outside Printing 19,200 21,700 15,991 5,709 Other Supplies 12,150 12,150 8,270 3,880 Postage and Delivery 13,300 13,500 12,295 1,205 Educational Supplies 5,300 5,300 902 4,398 Office Supplies 83,980 79,780 71,251 8,529 Subscriptions and Publications 10,060 9,860 5,368 4,492 Equipment Rental 118,200 118,200 99,838 18,362 Building Repairs and Maintenance 180,000 180,000 179,056 944 Equipment Repairs and Maintenance 32,000 27,000 2,876 24,124 Offsite Storage 23,700 23,700 15,463 8,237 Hardware and Software Maintenance 258,000 228,000 286,216 (58,216) Miscellaneous Service Charges 27,000 27,000 17,567 9,433 Miscellaneous/Contingency 75,000 70,200 53,175 17,025 Capital Outlay 120,000 120,000 13,464 106,536 Human Resources Related Costs 68,000 68,000 48,250 19,750
Total General Operating Expenditures 1,586,990 1,531,390 1,157,290 374,100 Professional Services
Audit 70,000 70,000 65,675 4,325 Legal 175,000 175,000 116,614 58,386 Professional Dues 82,100 86,350 37,709 48,641 Professional Dues - First 5 Association 50,000 50,000 - 50,000 Professional Development 210,800 202,945 56,323 146,622 Staff Recruitment 25,000 25,000 25,115 (115) Commission Stipends 34,000 34,000 21,900 12,100
Total Professional Services 646,900 643,295 323,336 319,959 Consultant Services
Consultant Fees 1,491,000 1,488,705 724,009 764,696 Other Professional Fees 237,500 276,950 255,115 21,835 External Reviewers 5,000 12,800 11,600 1,200
Total Consultant Services 1,733,500 1,778,455 990,724 787,731 Travel and Meetings
Airfare 86,242 95,242 54,183 41,059 Program Events 40,000 40,000 3,762 36,238 Lodging 84,876 95,276 50,232 45,044 Conference Registration 89,485 101,665 78,456 23,209 Local Meetings 115,900 94,320 43,705 50,615 Per Diem 42,488 46,738 25,115 21,623
Total Travel and Meetings 458,991 473,241 255,453 217,788 Capital Improvements - - 24,552 (24,552)
Total Operating Expenditures 20,794,362 20,794,362 17,134,003 3,660,359
Total Program Costs and Operating Expenditures 229,716,362 218,254,362 189,991,651 28,262,711
Excess (deficiency) of revenues over (under) expenditures (145,138,628)$ (133,676,628)$ (76,551,828)$ 57,124,800$
Fund balance - Beginning of year 536,628,004
Fund balance - End of year 460,076,176$
LOS ANGELES COUNTY CHILDREN AND FAMILIES FIRST - PROPOSITION 10 COMMISSION
NOTE FOR THE REQUIRED SUPPLEMENTARY INFORMATION FOR THE YEAR ENDED JUNE 30, 2016
30
NOTE 1 – BUDGET ADOPTION
The Commission adopts a budget annually in accordance with generally accepted accounting principles based on estimates of revenue and anticipated expenditures. The Board of Commissioners has given the Executive Director authority to make budget adjustments between line items in the Commission’s annual budget for Operating and Administrative costs in an amount not to exceed $25,000. Any budget adjustment between line items in excess of $25,000 requires approval of the Board of Commissioners. The accompanying Schedule of Revenues, Expenditures, and Changes in Fund Balance – Budget and Actual – General Fund includes the budgeted expenditures for the year, along with management’s estimate of revenues for the year. The legal level of budgetary control is at the total fund level. The total budget for FY 2015-16 was $218.3 million, which included $197.5 million for Program costs and $20.8 million for Operating and Administrative costs. In FY 2015-16, $13.5 million was recorded as “pass through grants”, which includes $8.5 million for the Los Angeles County Department of Children and Family Services Partnership for Families (LAC-PFF) program, $4.9 million for the First 5 California Child Signature Program (CSP), and $99,391 for Medi-Cal Administrative Activities. The Commission does not establish a budget for pass-through grants.

OTHER SUPPLEMENTARY INFORMATION
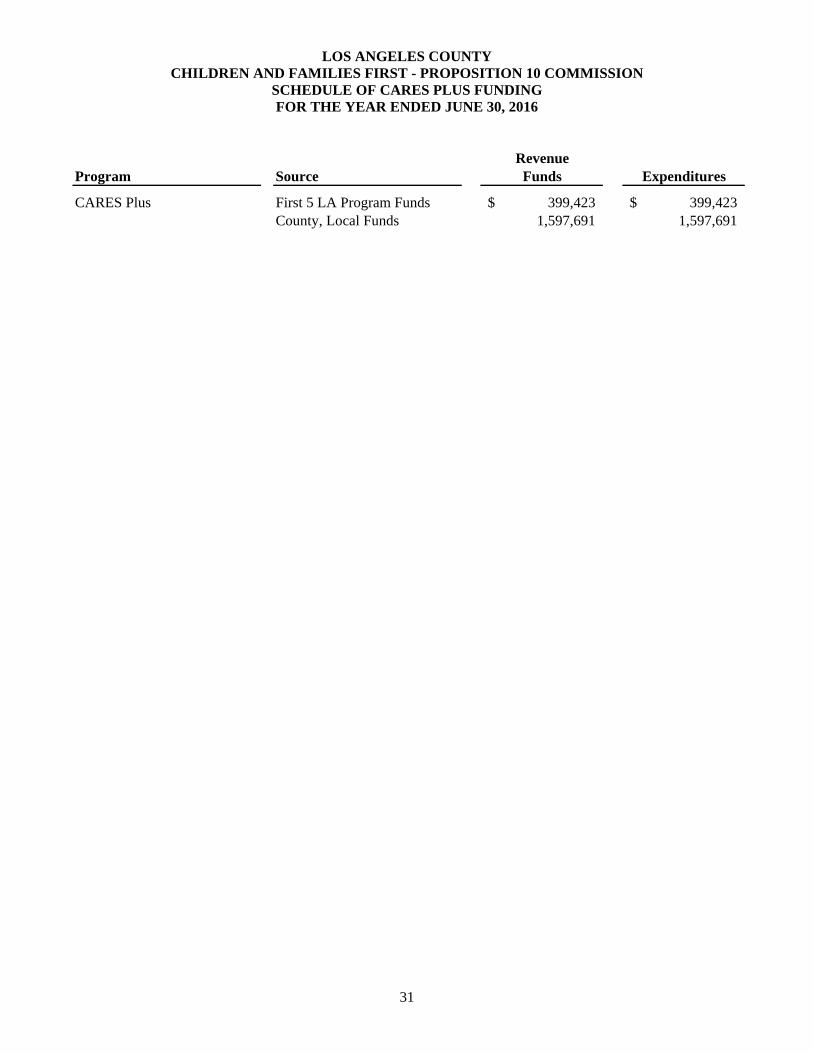
LOS ANGELES COUNTY CHILDREN AND FAMILIES FIRST - PROPOSITION 10 COMMISSION
SCHEDULE OF CARES PLUS FUNDING FOR THE YEAR ENDED JUNE 30, 2016
31
RevenueProgram Source Funds Expenditures
CARES Plus First 5 LA Program Funds 399,423$ 399,423$ County, Local Funds 1,597,691 1,597,691

LOS ANGELES COUNTY CHILDREN AND FAMILIES FIRST – PROPOSITION 10 COMMISSION
STATISTICAL SECTION (UNAUDITIED)
32
The information in this section is not covered by the Independent Auditor's Report, but it is presented as supplemental data for the benefit of the readers of the comprehensive annual financial report. The objectives of statistical section information are to provide financial statement users with additional information to understand and assess the Commission's economic condition.
Pages Financial Trends These schedules contain trend information to help the reader understand how the Commission's financial performance and well-being have changed over time. 33-36 Revenue Capacity These schedules contain trend information to help the reader assess the Commission's most significant revenue base. 37-38 Demographic Information These schedules offer economic and demographic indicators to help the reader Understand how the information in the Commission's financial report relates to the services the Commission provides and the activities it performs. 39-40 Operating Information This schedule contains infrastructure data to help the reader understand how the information in the Commission's financial report relates to the services the Commission performs. 41-43 Sources: Unless otherwise noted, the information in these schedules is derived from the comprehensive annual financial reports for the relevant years.

LOS ANGELES COUNTY CHILDREN AND FAMILIES FIRST – PROPOSITION 10 COMMISSION
NET POSITION BY COMPONENT LAST TEN FISCAL YEARS
33
2016 2015 2014 2013 2012 2011 2010* 2009 2008 2007Restricted -$ -$ -$ -$ -$ -$ -$ 881,019,859$ 885,944,312$ 846,935,336$ Unrestricted 461,512,770 543,521,742 632,680,166 723,252,516 829,030,048 434,206,491 859,235,104 - - - Net investment in capital assets 11,593,026 11,885,041 12,082,438 12,355,226 12,777,760 13,114,194 13,405,843 13,873,311 13,847,697 13,551,567 Total net position 473,105,796$ 555,406,783$ 644,762,604$ 735,607,742$ 841,807,808$ 447,320,685$ 872,640,947$ 894,893,170$ 899,792,009$ 860,486,903$
* The Commission presented net position as unrestricted beginning with 2010.
Fiscal Year

LOS ANGELES COUNTY CHILDREN AND FAMILIES FIRST – PROPOSITION 10 COMMISSION
CHANGES IN NET POSITION LAST TEN FISCAL YEARS
34
2016 2015 2014 2013 2012 2011 2010 2009 2008 2007Revenues
Tobacco taxes 87,942,700$ 89,475,135$ 90,280,307$ 94,112,590$ 100,187,619$ 100,269,182$ 102,504,928$ 114,925,729$ 122,655,958$ 125,602,050$ State School Readiness - - - - - 28,465,232 19,011,847 15,445,577 15,098,348 11,563,470 State Commission Program Funds 5,796,252 10,283,414 18,009,907 2,749,082 8,098,412 7,933,188 7,162,800 6,438,881 5,673,958 2,300,312 Medi-Cal Administrative Activities 159,549 80,799 232,408 316,369 483,325 507,869 740,794 925,511 - - Partnership for Families Fund* 9,001,152 4,615,313 - - - - - - - - Other program revenue 115,000 - - - - - - - - - Investment income 3,759,751 3,903,275 6,368,593 (3,402,141) 915,935 12,004,422 16,094,660 28,102,852 34,996,079 42,823,178 Net increase (decrease) in FMV of investments 1,064,007 2,152,879 - - - - - - - - Other revenues 119,100 104,072 100,320 98,880 9,048 290,093 465,061 453,762 467,302 290,768
Total revenues: 107,957,511$ 110,614,887$ 114,991,535$ 93,874,779$ 109,694,339$ 149,469,986$ 145,980,090$ 166,292,312$ 178,891,645$ 182,579,778$
ExpensesProvider grants and other allocations 159,337,913$ 168,766,806$ 189,910,283$ 185,753,622$ 124,709,026$ 133,261,213$ 157,019,407$ 160,239,867$ 130,894,482$ 129,614,460$ Pass-through grants 13,519,735 14,225,131 N/A N/A N/A N/A N/A N/A N/A N/AAB 99 N/A N/A N/A N/A (424,388,705) 424,388,705 N/A N/A N/A N/AFirst 5 California (SRI) N/A N/A N/A N/A 1,137,220 2,506,120 N/A N/A N/A N/ASalaries and benefits 14,357,480 13,423,832 12,682,373 11,583,915 11,153,057 10,685,423 8,818,136 8,161,291 6,638,952 5,841,908 Operating services 1,157,290 1,346,532 1,207,259 1,159,609 1,138,850 1,324,708 832,164 1,090,947 693,968 855,192 Consultant services 990,724 1,216,609 956,488 549,676 331,046 1,523,221 677,379 653,301 415,736 415,822 Professional services 323,336 404,560 543,038 426,726 540,606 398,819 208,008 400,036 276,610 204,353 Other expenses 255,453 264,892 183,974 149,116 114,384 116,223 80,355 69,045 90,880 85,332 Depreciation 316,567 322,346 353,258 452,182 471,732 585,814 596,868 576,664 575,911 471,698
Total expenses: 190,258,498$ 199,970,708$ 205,836,673$ 200,074,846$ (284,792,784)$ 574,790,246$ 168,232,317$ 171,191,151$ 139,586,539$ 137,488,765$
Change in net position (82,300,987)$ (89,355,821)$ (90,845,138)$ (106,200,066)$ 394,487,123$ (425,320,260)$ (22,252,227)$ (4,898,839)$ 39,305,106$ 45,091,013$
* Beginning January 2015, the Partnership for Families initiative is being funded by the LA County Department of Children and Family Services (DCFS), with First 5 LA acting as a pass-through entity and receiving reimbursement from DCFS.
Fiscal Year

LOS ANGELES COUNTY CHILDREN AND FAMILIES FIRST – PROPOSITION 10 COMMISSION
FUND BALANCES – GENERAL FUND LAST TEN FISCAL YEARS*
35
2016* 2015* 2014* 2013* 2012* 2011* 2010 2009 2008 2007Fund Balance
Nonspendable 34,279,475$ 39,411,636$ 37,578,099$ 27,022,268$ 19,960,620$ -$ Committed 249,515,814 340,879,636 451,133,640 561,003,855 631,710,435 632,471,832 Assigned 114,665,689 78,113,279 57,716,899 64,902,466 153,086,390 - Unassigned 61,615,198 78,223,453 79,494,722 70,816,380 16,691,138 (205,716,806)
Total Fund Balance 460,076,176$ 536,628,004$ 625,923,360$ 723,744,969$ 821,448,583$ 426,755,026$
ReservedReserved for encumbrances 129,094,692$ 341,203,752$ 504,505,166$ 639,223,219$ Reserved for obligations 189,699,943 45,820,595 52,670,634 13,125,130 Reserved for First 5 California 19,004,928 30,050,843 52,161,039 31,794,550
Total Reserved 337,799,563$ 417,075,190$ 609,336,839$ 684,142,899$
UnreservedDesignated 249,875,172$ 284,028,356$ 272,696,682$ 162,356,525$ Unreserved 271,842,909 174,167,089 - -
Total Fund Balance 859,517,644$ 875,270,635$ 882,033,521$ 846,499,424$
* Fund balance presentation changed in fiscal year 2010-2011 due to the implementation of GASB 54.
Fiscal Year

LOS ANGELES COUNTY CHILDREN AND FAMILIES FIRST – PROPOSITION 10 COMMISSION
CHANGES IN FUND BALANCES – GENERAL FUND LAST TEN FISCAL YEARS
36
2016 2015 2014 2013 2012 2011 2010 2009 2008 2007Revenues
Tobacco taxes 87,942,700$ 89,475,135$ 90,280,307$ 94,112,590$ 100,187,619$ 100,269,182$ 102,504,928$ 114,925,729$ 122,655,958$ 127,012,312$ State School Readiness - - - - - 39,242,565 19,011,847 15,445,577 15,098,348 13,534,763 State Commission Program Funds 10,433,575 11,050,327 10,668,187 10,741,413 7,960,036 95,713 2,441,868 4,633,722 2,198,287 1,480,228 Medi-Cal Administrative Activities 159,549 80,799 232,408 316,369 483,325 507,869 740,794 925,511 - - Partnership for Families Funds* 9,914,472 3,701,993 - - - - - - - - Other program revenue 115,000 - - - - - - - - - Investment income 3,759,751 3,903,275 6,368,593 (3,402,141) 915,935 12,004,422 16,094,660 28,102,852 34,996,079 42,823,178 Net increase (decrease) in FMV of investments 1,064,007 2,152,879 - - - - - - - - Other income 50,769 104,072 100,320 98,880 9,048 290,093 427,960 415,048 428,588 252,054
Total revenues: 113,439,823$ 110,468,480$ 107,649,815$ 101,867,110$ 109,555,963$ 152,409,844$ 141,222,057$ 164,448,439$ 175,377,260$ 185,102,535$
Expenditures:Provider grants and other allocations 159,337,913$ 168,766,806$ 189,910,283$ 185,753,622$ 124,709,026$ 133,261,213$ 157,019,407$ 160,239,867$ 130,894,482$ 129,614,460$ Pass-through grants 13,519,735 14,225,131 N/A N/A N/A N/A N/A N/A N/A N/AAB 99 N/A N/A N/A N/A (424,388,705) 424,388,705 N/A N/A N/A N/AFirst 5 California (SRI) N/A N/A N/A N/A 1,137,220 2,506,120 N/A N/A N/A N/ASalaries and benefits 14,382,648 13,414,357 12,589,911 11,502,328 11,144,681 10,619,053 8,774,370 8,155,851 6,599,446 5,831,492 Operating services 1,157,290 1,346,532 1,207,258 1,159,609 1,138,850 1,324,708 832,164 1,090,947 693,968 855,192 Consultant services 990,724 1,216,609 956,488 549,676 331,046 1,523,221 677,379 653,301 415,736 415,822 Professional services 323,336 404,560 543,038 426,726 540,606 398,819 208,008 400,036 276,610 204,353 Other expenses 255,453 264,892 183,974 149,116 114,384 116,223 80,355 69,045 90,880 85,332 Capital outlay 24,552 124,949 80,471 29,648 135,298 294,166 123,599 602,278 872,041 228,605
Total expenditures: 189,991,651$ 199,763,836$ 205,471,423$ 199,570,724$ (285,137,594)$ 574,432,228$ 167,715,282$ 171,211,325$ 139,843,163$ 137,235,256$
Excess (deficiency) of revenues over (under) expenditures (76,551,828)$ (89,295,356)$ (97,821,608)$ (97,703,614)$ 394,693,557$ (422,022,384)$ (26,493,225)$ (6,762,886)$ 35,534,097$ 47,867,279$
* Beginning January 2015, the Partnership for Families initiative is being funded by the LA County Department of Children and Family Services (DCFS), with First 5 LA acting as a pass-through entity and receiving reimbursement from DCFS.
Fiscal Year

LOS ANGELES COUNTY CHILDREN AND FAMILIES FIRST – PROPOSITION 10 COMMISSION FIRST 5 CALIFORNIA COUNTY TAX REVENUE PROJECTIONS FOR
FY 2015/2016 - FY 2019/2020
37
2013Actual Births
2013Actual
Birthrate
2015-2016Tax Revenue
Received
2014Actual Births
2014Actual
Birthrate
2016-2017Tax Revenue
Projection
2015Projected
Births
2015Projected Birthrate
2017-2018Tax Revenue
Projection
2016Projected
Births
2016Projected Birthrate
2018-2019Tax Revenue
Projection
2017Projected
Births
2017Projected Birthrate
2019-2020Tax Revenue
Projection
127,194 25.727% 87,942,700$ 130,150 25.867% 87,017,941$ 128,210 25.423% 82,746,658$ 128,355 25.271% 79,673,821$ 128,355 25.119% 76,826,944$
Source: "First 5 California County Tax Revenue Projections for FY 2015-16 through 2019-20"(Updated 9/8/16 Utilizing DOF June Revise 2016 Tobacco Tax Projections and DOF Birth Projections for California State and Counties 1970-2023)

LOS ANGELES COUNTY CHILDREN AND FAMILIES FIRST – PROPOSITION 10 COMMISSION CIGARETTE TAXES AND OTHER TOBACCO PRODUCTS SURTAX REVENUE, 1959-60 TO 2014-15
(In thousands of dollars)
38
Cigarette taxOther tobacco products
surtaxFiscal Revenue a/ f1 Distributors' 2 Gross 3 Refunds ef OTP f5 Rate Ref6
2014-15 $748,022,000 $6,413,000 $754,434,000 $837,000 $86,949,000 28.95%2013-14 751,513,000 6,443,000 757,956,000 600,000 86,424,000 29.82%2012-13 782,115,000 6,705,000 788,820,000 498,000 82,548,000 30.68%2011-12 820,322,000 7,032,000 827,355,000 1,017,000 80,424,000 31.73%2010-11 828,831,000 7,105,000 835,937,000 1,308,000 77,016,000 33.02%2009-10 838,709,000 7,187,000 845,896,000 1,583,000 84,617,000 41.11%2008-09 912,724,000 7,819,000 920,543,000 626,000 85,506,000 45.13%2007-08 955,030,000 8,185,000 963,215,000 727,000 85,929,000 45.13%2006-07 998,723,000 8,558,000 1,007,281,000 1,330,000 79,946,000 46.76%2005-06 1,026,497,000 8,795,000 1,035,293,000 1,707,000 67,348,000 46.76%2004-05 1,024,272,000 8,778,000 1,033,051,000 1,653,000 58,441,000 46.76%2003-04 1,021,366,000 8,755,000 1,030,121,000 4,721,000 44,166,000 46.76%2002-03 1,031,772,000 8,845,000 1,040,617,000 13,248,000 40,996,000 48.89%2001-02 1,067,004,000 9,146,000 1,076,150,000 10,774,000 50,037,000 52.65% d/
2000-01 1,110,692,000 9,503,000 1,120,195,000 8,741,000 52,834,000 54.89%1999-00 1,166,880,000 9,980,000 1,176,859,000 9,413,000 66,884,000 66.50%1998-99 841,911,000 e/ 7,206,000 849,117,000 6,808,000 42,137,000 f/ 61.53% f/
1997-98 612,066,000 5,244,000 617,309,000 5,448,000 39,617,000 29.37%1996-97 629,579,000 5,394,000 634,973,000 5,060,000 41,590,000 30.38%1995-96 639,030,000 5,469,000 644,499,000 6,193,000 32,788,000 31.20%1994-95 656,923,000 5,628,000 662,551,000 11,159,000 28,460,000 31.20%1993-94 647,993,000 g/ 5,553,000 653,546,000 8,353,000 19,773,000 23.03%1992-93 667,479,000 5,715,000 673,195,000 9,138,000 21,480,000 26.82%1991-92 711,275,000 6,086,000 717,362,000 7,791,000 22,016,000 29.35%1990-91 729,612,000 6,242,000 735,854,000 7,904,000 24,064,000 34.17%1989-90 770,042,000 h/ 6,581,000 776,623,000 11,615,000 24,956,000 h/ 37.47%1988-89 499,712,000 h/ 4,273,000 503,984,000 4,968,000 9,994,000 h/ 41.67%1987-88 254,869,000 2,180,000 257,049,000 2,970,0001986-87 257,337,000 2,202,000 259,539,000 2,661,0001985-86 260,960,000 2,231,000 263,190,000 2,834,0001984-85 265,070,000 2,267,000 267,337,000 2,390,0001983-84 265,265,000 2,267,000 267,532,000 2,756,0001982-83 273,748,000 2,336,000 276,084,000 2,060,0001981-82 278,667,000 2,383,000 281,050,000 1,843,0001980-81 280,087,000 2,395,000 282,482,000 1,567,0001979-80 272,119,000 2,327,000 274,446,000 1,645,0001978-79 270,658,000 2,315,000 272,973,000 1,408,0001977-78 275,042,000 2,352,000 277,394,000 1,239,0001976-77 270,502,000 2,315,000 272,817,000 832,0001975-76 269,852,000 2,309,000 272,161,000 927,0001974-75 264,182,000 2,262,000 266,444,000 745,0001973-74 259,738,000 2,222,000 261,960,000 632,0001972-73 253,089,000 2,167,000 255,256,000 626,0001971-72 248,398,000 2,127,000 250,525,000 677,0001970-71 240,372,000 2,058,000 242,430,000 552,0001969-70 237,220,000 2,032,000 239,253,000 455,0001968-69 238,836,000 2,046,000 240,882,000 492,0001967-68 208,125,000 i/ 1,862,000 209,987,000 328,0001966-67 75,659,000 1,543,000 77,202,000 129,0001965-66 74,880,000 1,528,000 76,407,000 88,0001964-65 74,487,000 1,520,000 76,007,000 61,0001963-64 71,530,000 1,459,000 72,989,000 71,0001962-63 70,829,000 1,445,000 72,274,000 79,0001961-62 68,203,000 1,390,000 69,593,000 47,0001960-61 66,051,000 j/ 1,675,000 k/ 67,726,000 76,0001959-60 61,791,000 l/ 767,000 l/ 62,558,000 67,000
a. Net of refunds for tax indicia on cigarettes that become unfit for use (See Refunds).
b. A discount of .85 percent of gross value of tax indicia is granted to distributors for affixing the stamps. From July 1, 1960, until August 1, 1967, the discount rate was 2 percent.c. Includes sales of indicia purchased on credit. Effective July 16, 1961, distributors have been able to purchase tax indicia on credit. d. From July 1, 2001, through September 9, 2001, the surtax rate on smokeless tobacco ranged from 131 percent for moist snuff to 490 percent for chewing tobacco.
Effective September 10, 2001, the surtax rate on smokeless tobacco was lowered to 52.65 percent.e. Effective January 1, 1999, the overall tax rate on cigarettes was increased from 37 cents to 87 cents per pack under voter-approved Proposition 10. The additional 50-cent-per-
pack tax was imposed to raise funds for early childhood development programs. Excludes $87,978,766 in 1998-99 from the floor stocks taxes for both cigarettes and other tobacco products levied on January 1, 1999.
f. From July 1, 1998, through December 31, 1998, the surtax rate was 26.17 percent for other tobacco products. Effective January 1, 1999, the new surtax imposed under Proposition 10 raised the combined surtax rate to 61.53 percent for other tobacco products. The new surtax is equivalent (in terms of the wholesale costs of other tobacco products) to a 50-cent-per-pack tax on cigarettes.
g. Effective January 1, 1994, the overall tax rate on cigarettes was increased from 35 cents to 37 cents per pack. The additional 2-cent-per-pack tax was imposed to raise funds for breast cancer research and education.
h. Effective January 1, 1989, an additional 25-cent-per-pack surtax was imposed on cigarettes and a new 41.67 percent surtax was imposed on other tobacco products. Excludes $57,927,856 in 1988-89 and $595,000 in 1989-90 from the floor stocks tax levied on January 1, 1989.
i. Effective August 1, 1967, the tax rate was increased from 3 cents to 7 cents per pack. On October 1, 1967, the rate was further increased to 10 cents per pack, with the stipulation that 30 percent of the tax be allocated to cities and counties. Includes $6,515,209 from the 4-cent-per-pack floor stocks tax levied on August 1, 1967; and $4,889,485 from the 3-cent-per-pack floor stocks tax imposed October 1, 1967.
j. Refunds made for distributors' discounts in the 1960-61 fiscal year on purchases made in the 1959-60 fiscal year have been deducted. These refunds amounted to $324,000.
k. Effective July 1, 1960, a discount was allowed at the time tax indicia were purchased.
l. Includes $2,673,048 from the 3-cent-per-pack floor stocks tax imposed July 1, 1959; and also includes the amount of distributors' discounts which were refunded after purchase of indicia. During July and August of 1959, the tax was collected by invoice and no discount was allowed on these collections of $8,123,700, nor on the $2,673,048 tax on floor stocks.

LOS ANGELES COUNTY CHILDREN AND FAMILIES FIRST – PROPOSITION 10 COMMISSION
DEMOGRAPHIC DATA AND ECONOMIC STATISTICS 2006-2015
39
Demographic Data2006** 2007** 2008** 2009*** 2010 (1) 2011 (1) 2012 (1) 2013 (1) 2014 (1) 2015 (1)
Total Population 10,216,702 10,252,245 10,341,412 10,449,155 9,824,194 9,862,211 9,945,864 10,010,961 10,082,664 10,147,070
White 2,903,508 2,856,544 2,822,775 2,938,369 2,743,456 2,719,057 2,721,500 2,709,464 2,693,506 2,677,368Black 876,209 862,622 853,032 882,167 826,260 828,970 830,607 831,808 833,267 834,505American Indian 25,584 25,056 24,588 30,808 19,509 19,619 19,652 19,629 19,658 19,654Asian 1,360,995 1,387,824 1,423,826 1,378,338 1,327,692 1,332,691 1,342,581 1,357,306 1,373,175 1,387,891Native Hawaiian & Other Pacific Islander 27,544 27,773 28,137 29,001 23,191 23,103 23,277 23,433 23,579 23,721Hispanic or Latino 4,807,354 4,864,925 4,944,987 5,008,069 4,702,784 4,753,038 4,818,170 4,874,755 4,940,756 5,001,012Other n/a n/a n/a n/a n/a n/a n/a n/a n/a n/aMulti-race 215,509 227,501 244,067 182,403 181,302 185,733 190,077 194,566 198,723 202,919
Female 5,123,747 5,151,888 5,195,931 5,266,592 4,980,734 4,998,722 5,039,635 5,071,249 5,105,963 5,137,391 Male 5,092,955 5,100,357 5,145,481 5,182,563 4,843,460 4,863,489 4,906,229 4,939,712 4,976,701 5,009,679
Under 5 years 742,159 728,334 731,216 716,228 644,882 645,529 645,026 644,356 658,930 664,168 5-9 years 760,560 732,624 735,376 744,818 631,973 625,415 632,530 637,383 638,471 641,563 10-14 years 902,600 852,918 802,998 769,538 674,968 658,984 648,192 638,396 631,525 625,574 15-19 years 820,767 885,245 926,946 870,100 749,322 732,741 716,854 700,066 683,907 670,120 20-24 years 647,886 690,477 712,834 725,816 751,717 755,888 758,178 759,628 757,233 748,352 25-29 years 580,169 621,590 647,647 677,682 758,633 762,396 756,706 754,773 755,997 757,871 30-39 years 1,417,302 1,352,485 1,307,857 1,420,833 1,429,814 1,429,718 1,441,415 1,454,389 1,466,136 1,477,437 40-49 years 1,604,965 1,582,764 1,578,500 1,592,529 1,421,700 1,418,870 1,423,408 1,416,725 1,408,130 1,403,932 50-59 years 1,234,103 1,259,906 1,295,706 1,315,677 1,229,799 1,253,379 1,281,390 1,303,781 1,321,414 1,331,973 60-69 years 722,021 754,663 794,316 827,207 784,117 817,011 856,522 891,983 930,186 971,603 70-79 years 459,992 459,524 465,714 466,110 439,892 447,281 462,564 479,911 497,179 515,304 80+ years 324,179 331,715 342,302 322,617 307,377 314,999 323,079 329,570 333,556 339,173
Source:* US Census Bureau, 2000 Census, SF1** State of California, Department of Finance, E-3 Race / Ethnic Population Estimates with Age and Sex Detail, 2000–2008. Sacramento, CA, June 2010.*** State of California, Department of Finance, Race/Ethnic Population with Age and Sex Detail, 2000–2050. Sacramento, CA, July 2007. (data are projections calculated between census surveys)(1) State of California, Department of Finance, Population Projections for California and Its Counties 2010-2060. Sacramento, CA, January 2013. (These data supersede the previously used data source.)
Economic Data2006 2007 2008 2009 2010 2011 2012 2013 2014 2015
LA County Personal Income 384,722,373 398,281,877 410,482,294 395,372,354 404,473,004 425,673,042 455,788,782 466,098,988 499,767,889 N/ALA County Per Capita Personal Income 39,508 41,058 42,165 40,396 41,163 43,062 45,800 46,506 49,400 N/A
California Personal Income 1,499,308,841 1,564,289,335 1,596,229,973 1,537,094,676 1,578,553,439 1,685,635,498 1,805,193,769 1,856,614,186 1,944,369,223 2,061,337,141 California Per Capita Personal Income 41,623 43,152 43,608 41,587 42,282 44,749 47,505 48,434 50,109 52,651
United States Personal Income 11,376,405,000 11,990,104,000 12,429,234,000 12,080,223,000 12,417,659,000 13,189,935,000 13,873,161,000 14,151,427,000 14,708,582,165 15,324,108,725 United States Per Capita Personal Income 38,127 39,804 40,873 39,379 40,144 42,332 44,200 44,765 46,129 47,669
Source:Bureau of Economic Analysis: http://www.bea.gov/iTable/iTable.cfm?reqid=70&step=1&isuri=1&acrdn=4 (Tables SA1-3 and CA1-3)Personal income data are shown in thousands of dollars; per capita income data are shown in dollars.2015 economic data is not yet available for Los Angeles County

LOS ANGELES COUNTY CHILDREN AND FAMILIES FIRST – PROPOSITION 10 COMMISSION
UNEMPLOYMENT RATE 2000 – 2015
40
Area 2015 2014 2013 2012 2011 2010 2009 2008 2007 2006 2005 2004 2003 2002 2001 2000United States 5.3% 6.2% 7.4% 8.1% 8.9% 9.6% 9.3% 5.8% 4.6% 4.6% 5.1% 5.5% 6.0% 5.8% 4.7% 4.0%California 6.2% 7.5% 8.9% 10.4% 11.8% 12.4% 11.3% 7.2% 5.4% 4.9% 5.4% 6.2% 6.8% 6.7% 5.4% 4.9%Los Angeles County 6.7% 8.3% 9.9% 10.9% 12.3% 12.6% 11.6% 7.5% 5.1% 4.8% 5.4% 6.5% 7.0% 6.8% 5.7% 5.4%
Source:Bureau of Labor Statistics (http://www.bls.gov/; annual averages)

LOS ANGELES COUNTY CHILDREN AND FAMILIES FIRST – PROPOSITION 10 COMMISSION
TEN LARGEST INDUSTRIES (1) 2015 AND 2006
41
Number of Percentage Number of PercentageIndustry Employees Rank of Total Employees Rank of Total
Trade, Transportation & Utilities 814,700 1 17.34% 807,000 1 17.72%Educational & Health Services 763,100 2 16.24% 575,800 4 12.64%Professional & Business Services 623,000 3 13.26% 601,300 3 13.20%Government 574,400 4 12.23% 598,000 2 13.13%Leisure & Hospitality 487,600 5 10.38% 394,100 6 8.65%Manufacturing 362,800 6 7.72% 467,600 5 10.27%Financial Activities 211,100 7 4.49% 247,300 7 5.43%Information 190,900 8 4.06% 209,100 8 4.59%Other Services 155,900 9 3.32% 147,100 10 3.23%Construction 128,200 10 2.73% 159,300 9 3.50%
Sub-total Ten Largest Industries 4,311,700 91.79% 4,206,600 92.35%
All Other Industries 385,900 8.22% 348,500 7.65%
Total Industries 4,697,600 100.00% 4,555,100 100.00%
Note:(1) Employment by industry is presented because employment data for individual employers was unavailable.
Source:County of Los Angeles Comprehensive Annual Financial Report for the year ended June 30, 2015:http://ceo.lacounty.gov/pdf/portal/CAFR%202014%20.pdf
June 30, 2015 June 30, 2006

LOS ANGELES COUNTY CHILDREN AND FAMILIES FIRST – PROPOSITION 10 COMMISSION
CAPITAL ASSETS STATISTICS
42
Capital Assets (Land, Building, Furniture & Equipment) are used by the Commission for general operating and administrative function. The Commission has only one (1) centrally located building supported by other capital assets.
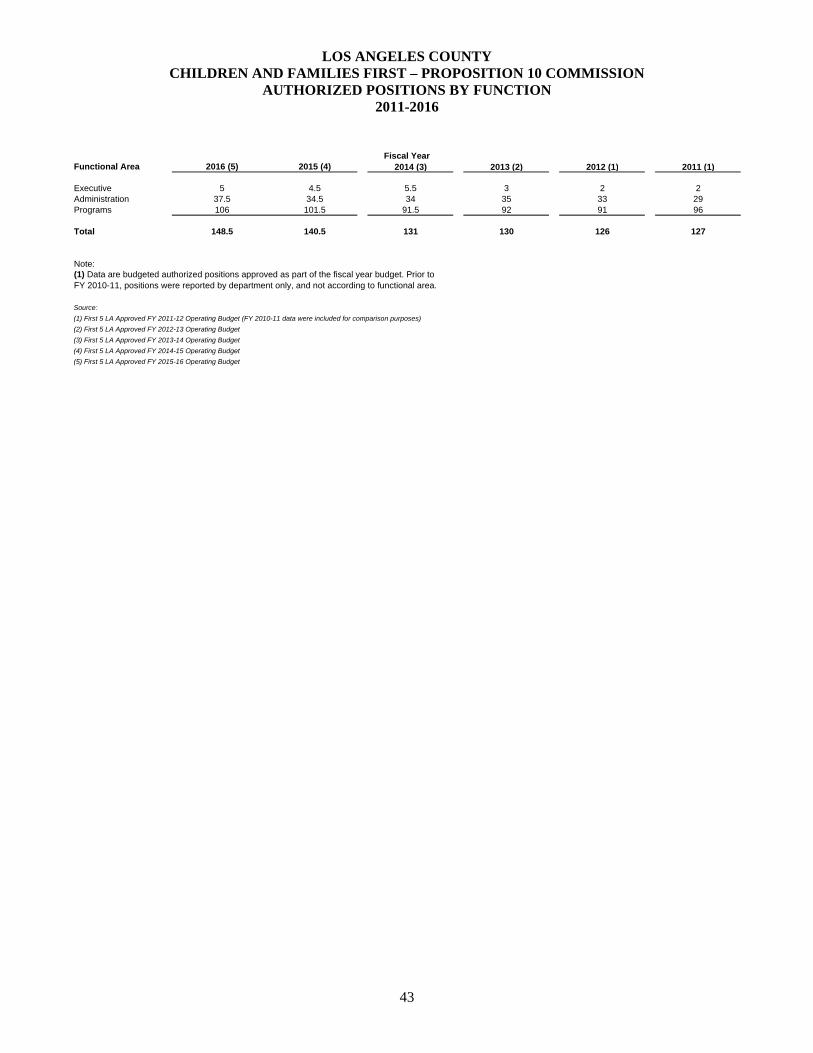
LOS ANGELES COUNTY CHILDREN AND FAMILIES FIRST – PROPOSITION 10 COMMISSION
AUTHORIZED POSITIONS BY FUNCTION 2011-2016
43
Functional Area 2016 (5) 2015 (4) 2014 (3) 2013 (2) 2012 (1) 2011 (1)
Executive 5 4.5 5.5 3 2 2Administration 37.5 34.5 34 35 33 29Programs 106 101.5 91.5 92 91 96
Total 148.5 140.5 131 130 126 127
Note:(1) Data are budgeted authorized positions approved as part of the fiscal year budget. Prior toFY 2010-11, positions were reported by department only, and not according to functional area.
Source:(1) First 5 LA Approved FY 2011-12 Operating Budget (FY 2010-11 data were included for comparison purposes)(2) First 5 LA Approved FY 2012-13 Operating Budget(3) First 5 LA Approved FY 2013-14 Operating Budget(4) First 5 LA Approved FY 2014-15 Operating Budget(5) First 5 LA Approved FY 2015-16 Operating Budget
Fiscal Year

44
INDEPENDENT AUDITORS' REPORT ON INTERNAL CONTROL OVER FINANCIAL REPORTING AND ON COMPLIANCE AND OTHER MATTERS BASED ON AN AUDIT OF
FINANCIAL STATEMENTS PERFORMED IN ACCORDANCE WITH GOVERNMENT AUDITING STANDARDS
Board of Commissioners Los Angeles County Children and Families First – Proposition 10 Commission Los Angeles, California We have audited, in accordance with the auditing standards generally accepted in the United States of America and the standards applicable to financial audits contained in Government Auditing Standards issued by the Comptroller General of the United States, the financial statements of the governmental activities and the general fund of the Los Angeles County Children and Families First – Proposition 10 Commission (Commission), a component unit of the County of Los Angeles, California, as of and for the year ended June 30, 2016, and the related notes to the financial statements, which collectively comprise the Commission’s basic financial statements, and have issued our report thereon dated October 14, 2016. Our report included an emphasis-of-matter regarding the Commission’s adoption of Governmental Accounting Standards Board (GASB) Statement No. 72, Fair Value Measurement and Application, effective July 1, 2015. Internal Control Over Financial Reporting In planning and performing our audit of the financial statements, we considered the Commission’s internal control over financial reporting (internal control) to determine the audit procedures that are appropriate in the circumstances for the purpose of expressing our opinions on the financial statements, but not for the purpose of expressing an opinion on the effectiveness of the Commission’s internal control. Accordingly, we do not express an opinion on the effectiveness of the Commission’s internal control. A deficiency in internal control exists when the design or operation of a control does not allow management or employees, in the normal course of performing their assigned functions, to prevent, or detect and correct, misstatements on a timely basis. A material weakness is a deficiency, or a combination of deficiencies, in internal control, such that there is a reasonable possibility that a material misstatement of the entity’s financial statements will not be prevented, or detected and corrected on a timely basis. A significant deficiency is a deficiency, or a combination of deficiencies, in internal control that is less severe than a material weakness, yet important enough to merit attention by those charged with governance. Our consideration of internal control was for the limited purpose described in the first paragraph of this section and was not designed to identify all deficiencies in internal control that might be material weaknesses or, significant deficiencies. Given these limitations, during our audit we did not identify any deficiencies in internal control that we consider to be material weaknesses. However, material weaknesses may exist that have not been identified.
10681 Foothill Blvd., Suite 300 Rancho Cucamonga, CA 91730 Tel: 909.466.4410 www.vtdcpa.com Fax: 909.466.4431
Vavrinek, Trine, Day & Co., LLPCertified Public Accountants
VALUE THE D IFFERENCE

45
Compliance and Other Matters As part of obtaining reasonable assurance about whether the Commission’s financial statements are free from material misstatement, we performed tests of its compliance with certain provisions of laws, regulations, contracts, and grant agreements, noncompliance with which could have a direct and material effect on the determination of financial statement amounts. However, providing an opinion on compliance with those provisions was not an objective of our audit, and accordingly, we do not express such an opinion. The results of our tests disclosed no instances of noncompliance or other matters that are required to be reported under Government Auditing Standards. Purpose of this Report The purpose of this report is solely to describe the scope of our testing of internal control and compliance and the results of that testing, and not to provide an opinion on the effectiveness of the entity’s internal control or on compliance. This report is an integral part of an audit performed in accordance with Government Auditing Standards in considering the entity’s internal control and compliance. Accordingly, this communication is not suitable for any other purpose.
Rancho Cucamonga, California October 14, 2016

46
INDEPENDENT AUDITORS’ REPORT ON STATE COMPLIANCE
Board of Commissioners Los Angeles County Children and Families First – Proposition 10 Commission Los Angeles, California Compliance We have audited the Los Angeles County Children and Families First – Proposition 10 Commission’s (Commission), a component unit of the County of Los Angeles, California, compliance with the requirements specified in the State of California’s Standards and Procedures for Audits of Local Entities Administering the California Children and Families Act, issued by the State Controller’s Office, applicable to the Commission’s statutory requirements identified below for the year ended June 30, 2016. Management’s Responsibility Management is responsible for compliance with the requirements of the laws and regulations applicable to the California Children and Families Act. Auditors' Responsibility Our responsibility is to express an opinion on the Commission’s compliance with the requirements referred to above based on our audit. We conducted our audit of compliance in accordance with auditing standards generally accepted in the United States of America, the standards applicable to financial audits contained in Government Auditing Standards issued by the Comptroller General of the United States, and the State of California’s Standards and Procedures for Audits of Local Entities Administering the California Children and Families Act, issued by the State Controller’s Office. Those standards and the State of California’s Standards and Procedures for Audits of Local Entities Administering the California Children and Families Act require that we plan and perform the audit to obtain reasonable assurance about whether noncompliance with the requirements referred to above that could have a direct and material effect on the statutory requirements listed below. An audit includes examining, on a test basis, evidence about the Commission’s compliance with those requirements and performing such other procedures as we considered necessary in the circumstances.
10681 Foothill Blvd., Suite 300 Rancho Cucamonga, CA 91730 Tel: 909.466.4410 www.vtdcpa.com Fax: 909.466.4431
Vavrinek, Trine, Day & Co., LLPCertified Public Accountants
VALUE THE D IFFERENCE
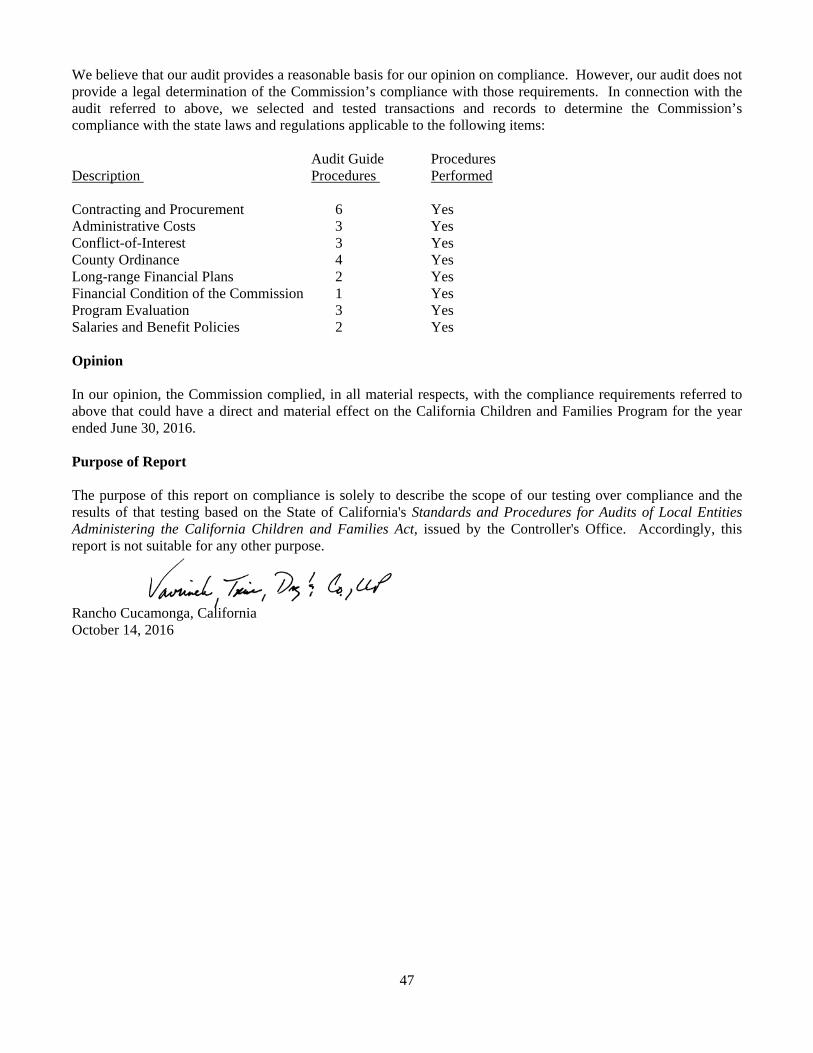
47
We believe that our audit provides a reasonable basis for our opinion on compliance. However, our audit does not provide a legal determination of the Commission’s compliance with those requirements. In connection with the audit referred to above, we selected and tested transactions and records to determine the Commission’s compliance with the state laws and regulations applicable to the following items:
Audit Guide Procedures Description Procedures Performed Contracting and Procurement 6 Yes Administrative Costs 3 Yes Conflict-of-Interest 3 Yes County Ordinance 4 Yes Long-range Financial Plans 2 Yes Financial Condition of the Commission 1 Yes Program Evaluation 3 Yes Salaries and Benefit Policies 2 Yes Opinion In our opinion, the Commission complied, in all material respects, with the compliance requirements referred to above that could have a direct and material effect on the California Children and Families Program for the year ended June 30, 2016. Purpose of Report The purpose of this report on compliance is solely to describe the scope of our testing over compliance and the results of that testing based on the State of California's Standards and Procedures for Audits of Local Entities Administering the California Children and Families Act, issued by the Controller's Office. Accordingly, this report is not suitable for any other purpose.
Rancho Cucamonga, California October 14, 2016