lorren pettit - clinical and financial benefits of it...
TRANSCRIPT

Replace text box with chapter logo (on all master slides)
October 24, 2014
Clinical and Financial Benefits of IT Implementation

Who Is HIMSS Analytics ?
• A subsidiary of HIMSS
• We collect data on what information systems are deployed in healthcare systems in the U.S., Canada on a census basis
– On a sample basis in Europe, the Middle East and AsiaPac
• From this data, we populate the EMR Adoption Models (EMRAM)
• EMRAM = the acute care model that reflects increased sophistication in deployment and use of healthcare IT

Why Do We Do It?
• Thought leadership
– Quality, Safety, Efficiency improvements
• To inform government policy
– Numerous countries and regions use HIMSS Analytics to gather data for their policy formulation
• To reflect the market
– Where is the market heading
• To “drive the market”

The Burning Question
• Is the EMR an effective tool?
− In theory…
o Yes
o Governmental incentives
− In practice…
o Mixed results
o Limited research

STAGE 7 STUDIESCLINICAL PERFORMANCE

Source: HIMSS Analytics
Representation of TJC Top Performing Hospitals BY Number of Quality Metrics Excelling In, within each EMRAM Stage
1.9%4.8%
10.1% 8.1%4.2%
6.5% 7.9% 9.7%0.4%
1.7%
6.2% 10.0%
6.4%6.4%
12.8%
30.1%
0.0%
5.0%
10.0%
15.0%
20.0%
25.0%
30.0%
35.0%
40.0%
45.0%
50.0%
0 1 2 3 4 5 6 7
All
ho
sp
itals
wit
hin
each
EM
RA
M S
tag
e
EMRAM Stage
3 or less 4 or more
2.3%6.5%
16.3%18.1%
10.6%
12.9%
20.7%
39.8%

38.9
45.5 44.645.9 45.9
42.7
49.0
64.3
30.0
35.0
40.0
45.0
50.0
55.0
60.0
65.0
70.0
Stage 0 Stage 1 Stage 2 Stage 3 Stage 4 Stage 5 Stage 6 Stage 7
AV
G C
lin
ical S
co
re
EMR Adoption Model Stage
Tipping Point
Tipping Point
Value Based Purchasing (VBP) Clinical Scores
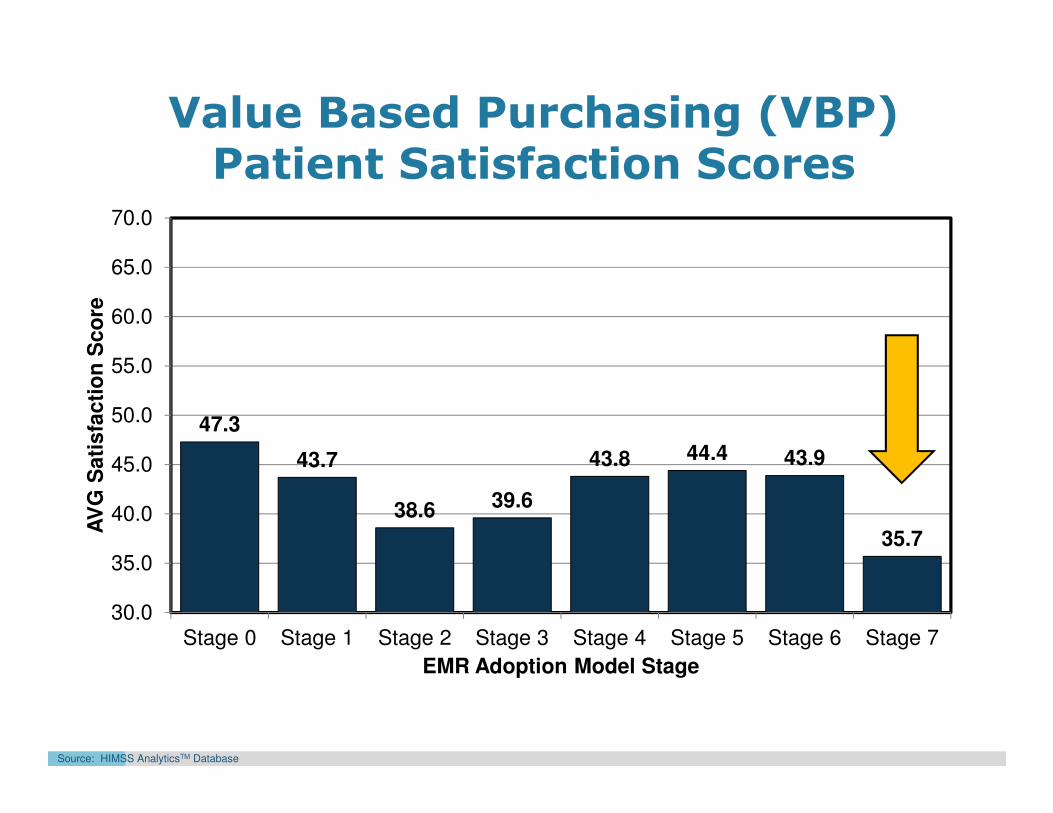
47.3
43.7
38.6 39.6
43.8 44.4 43.9
35.7
30.0
35.0
40.0
45.0
50.0
55.0
60.0
65.0
70.0
Stage 0 Stage 1 Stage 2 Stage 3 Stage 4 Stage 5 Stage 6 Stage 7
AV
G S
ati
sfa
cti
on
Sc
ore
EMR Adoption Model Stage
Source: HIMSS AnalyticsTM Database
Value Based Purchasing (VBP) Patient Satisfaction Scores

WHAT: Our Approach
• Leverage two of the largest, most robust data sets to explore effectiveness of the EMR.
Research Questions
− Is there a relationship between EMR capabilities and hospital clinical performance?
− What aspect of performance (actual rate, predicted rate, or z-score) is related most strongly to advanced EMR capabilities?
− Are there certain clinical areas where this relationship is stronger / weaker?
− What additional variables, if any are related to advanced EMR capabilities?
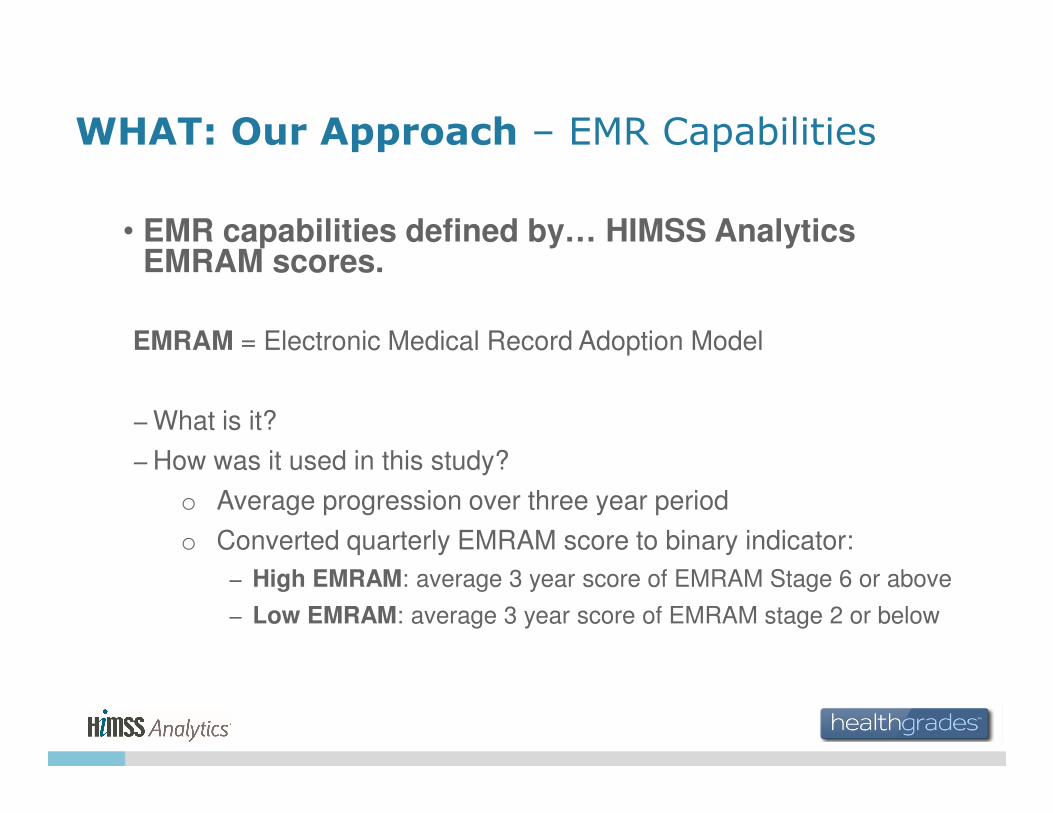
WHAT: Our Approach – EMR Capabilities
• EMR capabilities defined by… HIMSS Analytics EMRAM scores.
EMRAM = Electronic Medical Record Adoption Model
− What is it?
− How was it used in this study?
o Average progression over three year period
o Converted quarterly EMRAM score to binary indicator:
− High EMRAM: average 3 year score of EMRAM Stage 6 or above
− Low EMRAM: average 3 year score of EMRAM stage 2 or below
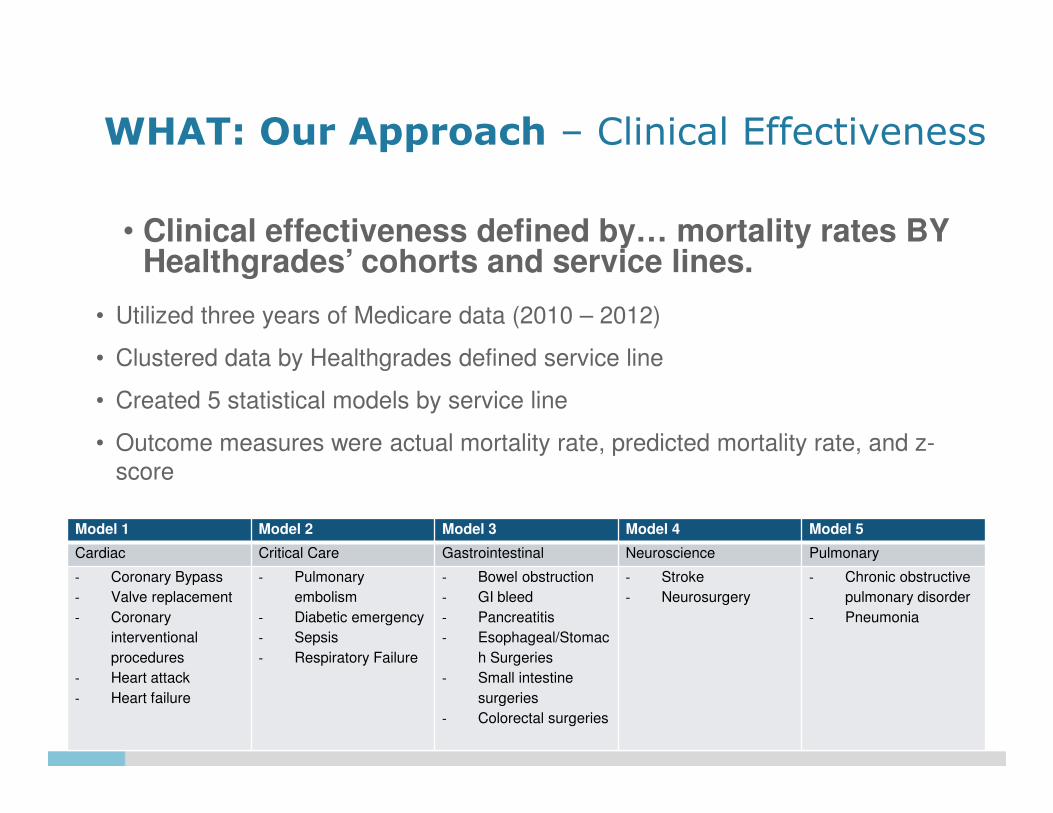
WHAT: Our Approach – Clinical Effectiveness
• Clinical effectiveness defined by… mortality rates BY Healthgrades’ cohorts and service lines.
• Utilized three years of Medicare data (2010 – 2012)
• Clustered data by Healthgrades defined service line
• Created 5 statistical models by service line
• Outcome measures were actual mortality rate, predicted mortality rate, and z-
score
Model 1 Model 2 Model 3 Model 4 Model 5
Cardiac Critical Care Gastrointestinal Neuroscience Pulmonary
- Coronary Bypass
- Valve replacement
- Coronary
interventional
procedures
- Heart attack
- Heart failure
- Pulmonary
embolism
- Diabetic emergency
- Sepsis
- Respiratory Failure
- Bowel obstruction
- GI bleed
- Pancreatitis
- Esophageal/Stomac
h Surgeries
- Small intestine
surgeries
- Colorectal surgeries
- Stroke
- Neurosurgery
- Chronic obstructive
pulmonary disorder
- Pneumonia

WHAT: The Findings – Question #1
• Is there a relationship between EMRAM and hospital clinical performance?
• Yes, there is a relationship between EMRAM scores and hospital performance.
• All five service line models resulted in statistically significant fits.
• There is some variation in the nature of this relationship by service line and cohort.

WHAT: The Findings – Question #2
• What aspect of performance (actual, predicted, or score) is related most strongly to EMRAM?
• On average higher EMRAM scores are associate with increases in the predicted rate as well the z-score.
– This suggests that increased EMRAM scores are related to increases in documentation and coding capture.
• There tends to be a limited relationship between increased EMRAM scores and the actual mortality rate.

WHAT: The Findings – Question #3
• Are there certain clinical areas as defined by Healthgrades cohorts, where this relationship is stronger / weaker?
– Yes, there are cohorts within each service line where performance is related to EMRAM
• Findings scenarios
– No difference on any measure (4/19)
– Decreased actual rate (3/19)
– Increased predicted rate and z-score (7/19)
– Increased z-score only (3/19)
– Other (2/19)
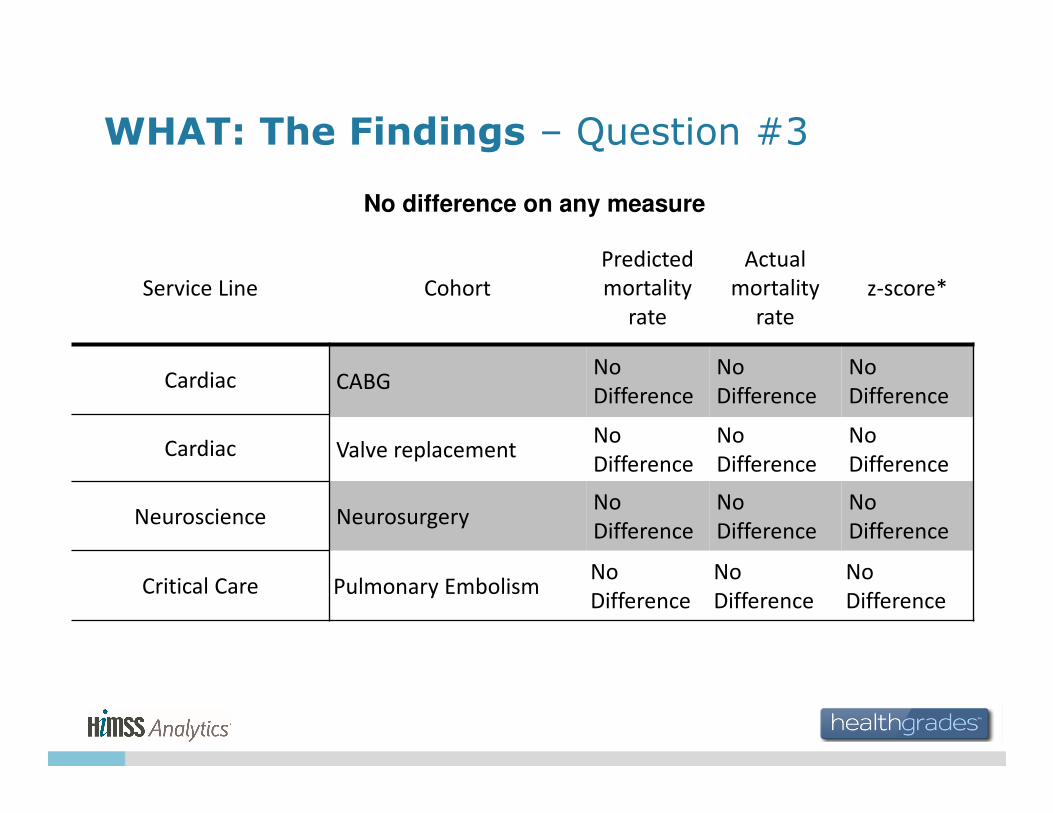
WHAT: The Findings – Question #3
No difference on any measure
Service Line Cohort
Predicted
mortality
rate
Actual
mortality
rate
z-score*
Cardiac CABGNo
Difference
No
Difference
No
Difference
Cardiac Valve replacementNo
Difference
No
Difference
No
Difference
Neuroscience NeurosurgeryNo
Difference
No
Difference
No
Difference
Critical Care Pulmonary EmbolismNo
Difference
No
Difference
No
Difference
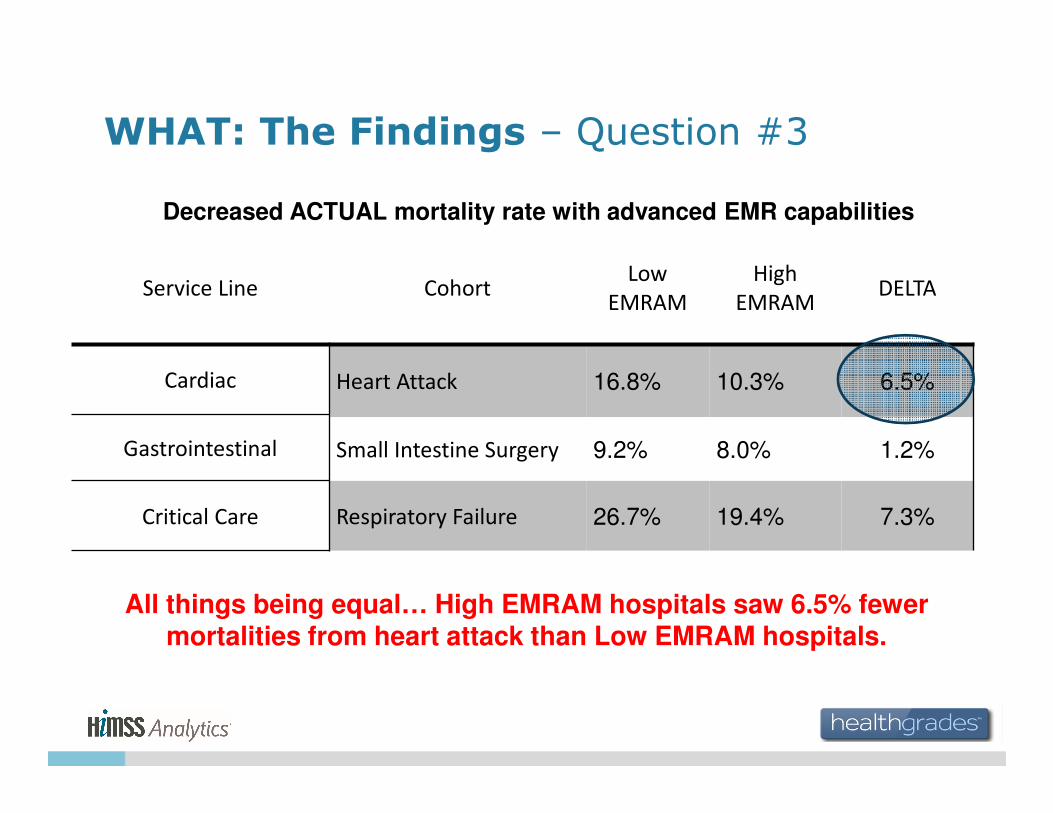
WHAT: The Findings – Question #3
Decreased ACTUAL mortality rate with advanced EMR capabilities
Service Line CohortLow
EMRAM
High
EMRAMDELTA
Cardiac Heart Attack 16.8% 10.3% 6.5%
Gastrointestinal Small Intestine Surgery 9.2% 8.0% 1.2%
Critical Care Respiratory Failure 26.7% 19.4% 7.3%
All things being equal… High EMRAM hospitals saw 6.5% fewer mortalities from heart attack than Low EMRAM hospitals.

WHAT: The Findings – Question #3
Increased PREDICTED mortality rate with advanced EMR capabilities†
Service Line CohortLow
EMRAM
High
EMRAMDELTA
Cardiac PCI 3.1% 3.9% 0.8%
Cardiac Heart Failure 2.6% 4.7% 2.1%
Pulmonary Pneumonia 3.4% 4.4% 1.0%
Neuroscience Stroke 4.7% 5.5% 0.8%
Gastrointestinal Bowel Surgery 2.0% 2.4% 0.4%
Gastrointestinal Pancreatitis 1.7% 2.1% 0.4%
Gastrointestinal Colorectal Surgery 4.1% 4.9% 0.8%
† and increased z-score
Capture of prediction of the risk of mortality from Heart Failure in High EMRAM hospitals improved 44.7% compared to Lower EMRAM
hospitals.
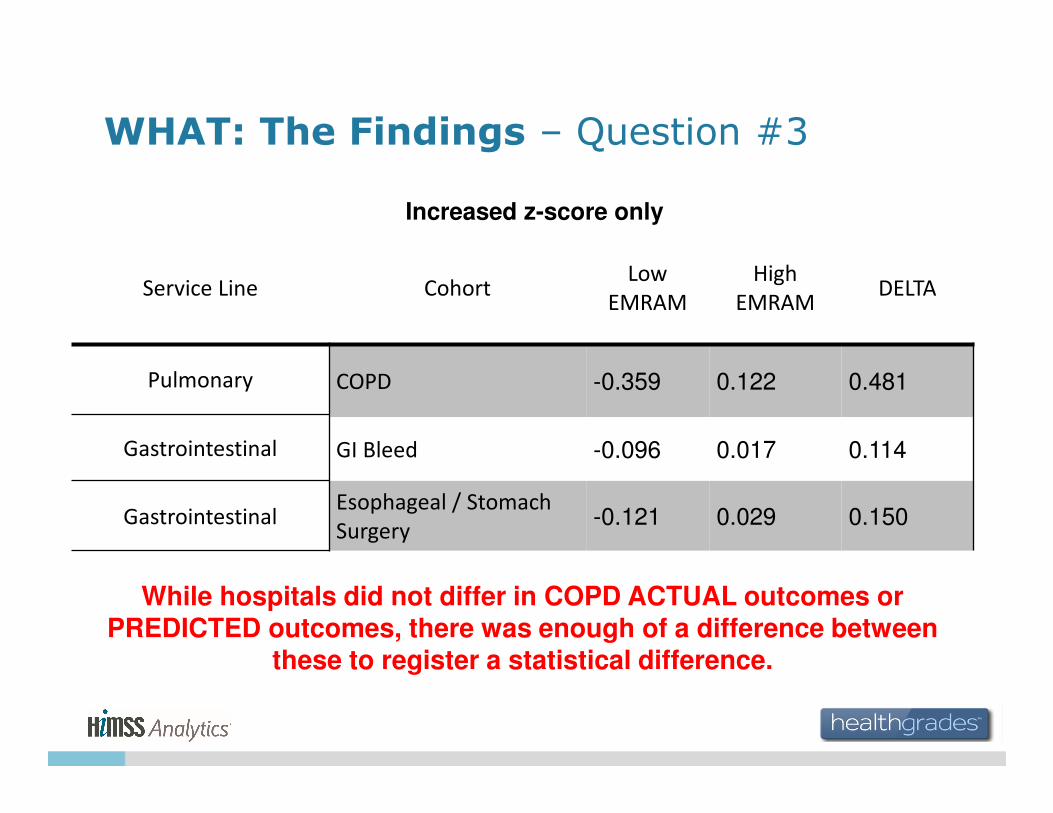
WHAT: The Findings – Question #3
Increased z-score only
Service Line CohortLow
EMRAM
High
EMRAMDELTA
Pulmonary COPD -0.359 0.122 0.481
Gastrointestinal GI Bleed -0.096 0.017 0.114
GastrointestinalEsophageal / Stomach
Surgery-0.121 0.029 0.150
While hospitals did not differ in COPD ACTUAL outcomes or PREDICTED outcomes, there was enough of a difference between
these to register a statistical difference.

WHAT: The Findings – Question #3
Other Outcomes
Service Line Cohort
Predicted
mortality
rate
Actual
mortality
rate
z-score*
Critical Care Diabetic Emergency DecreaseNo
Difference
No
Difference
Critical Care Sepsis Increase Increase Increase
Diabetic Emergencies show a 1.1% point difference in predicted rates (lower for high EMRAM) but no difference in actual rates or in the z-
score.

WHAT: The Findings – Question #3
Other Outcomes
Service Line Cohort
Predicted
mortality
rate
Actual
mortality
rate
z-score*
Critical Care Diabetic Emergency DecreaseNo
Difference
No
Difference
Critical Care Sepsis Increase Increase Increase
Sepsis resulted in a 3% point difference in actual rates (higher for high EMRAM) with a 5% point reduction in prediction of the risk of
mortality from Sepsis in High EMRAM hospitals.
The result was net better performance for high EMRAM hospitals as measured by statistical improvement in z-score
WHAT: The Findings – Question #4
• What additional variables, if any are related to EMRAM?
• For all models cohort volume, teaching status, and hospital location had a statistically significant relationship with the EMRAM score.
• In general major teaching facilities were more likely to have high EMRAM scores.
• Additional urban facilities were also more likely to have high EMRAM scores.
• Volume was statistically significantly related to EMRAM, but the odds ratio for this relationship was never greater than 1.012. This suggests that while significant the relationship with volume was minor.

SO WHAT: The Implications
• Is the EMR an effective clinical tool?
− In practice… generally YES
• Findings encourage…
• EMR adoption
• EMR refinements

STAGE 7 STUDIESFINANCIAL PERFORMANCE

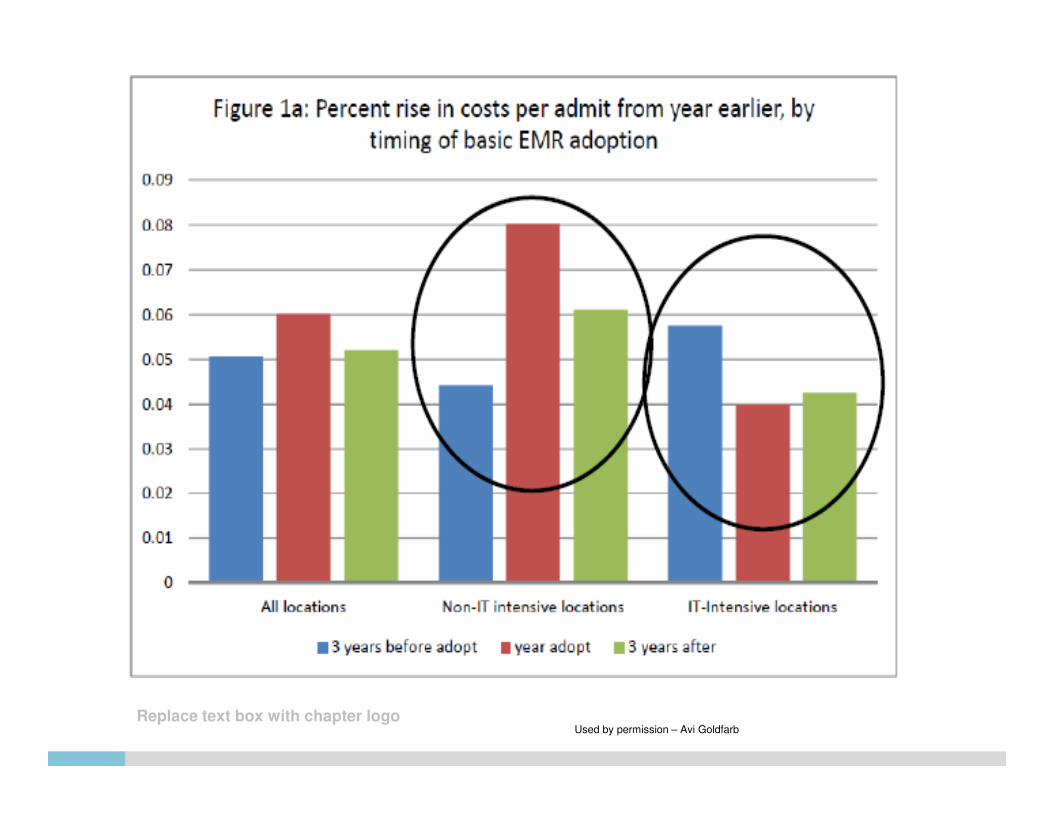
What We Found in Researching
• Hospitals that implemented EMR between 1996 and 2009 did NOT generally see a reduction in operating expense, EXCEPT:
– Cost rise immediately during and following implementation and then fall back to previous levels
• However:
– Hospitals in locations with IT intensive industry found cost reductions after three years
– Hospitals in other locations found costs increased
– The initial cost increases was smaller for those in IT intensive locations
The Trillion Dollar Conundrum: Complementarities and Health Information Technology (NBER Working Paper No
Used by permission – Avi Goldfarb

Replace text box with chapter logoUsed by permission – Avi Goldfarb
Replace text box with chapter logoUsed by permission – Avi Goldfarb
Efficiencies Adjusted for
• Case Mix Index
• Quality scores
• Readmission rate
• Labor input
• etc. ….

Hospital Cost Efficiencies BY EMRAM Stage
Early DRAFTNot for
Distribution
Used by permission – Eric Ford

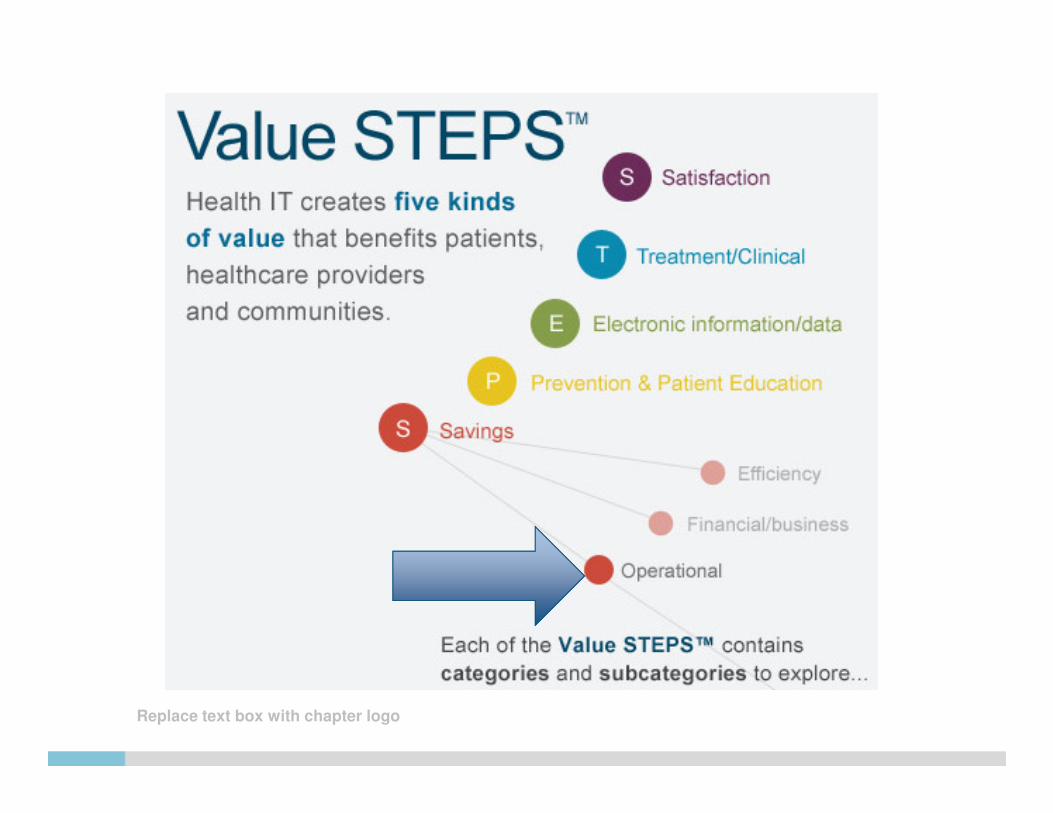
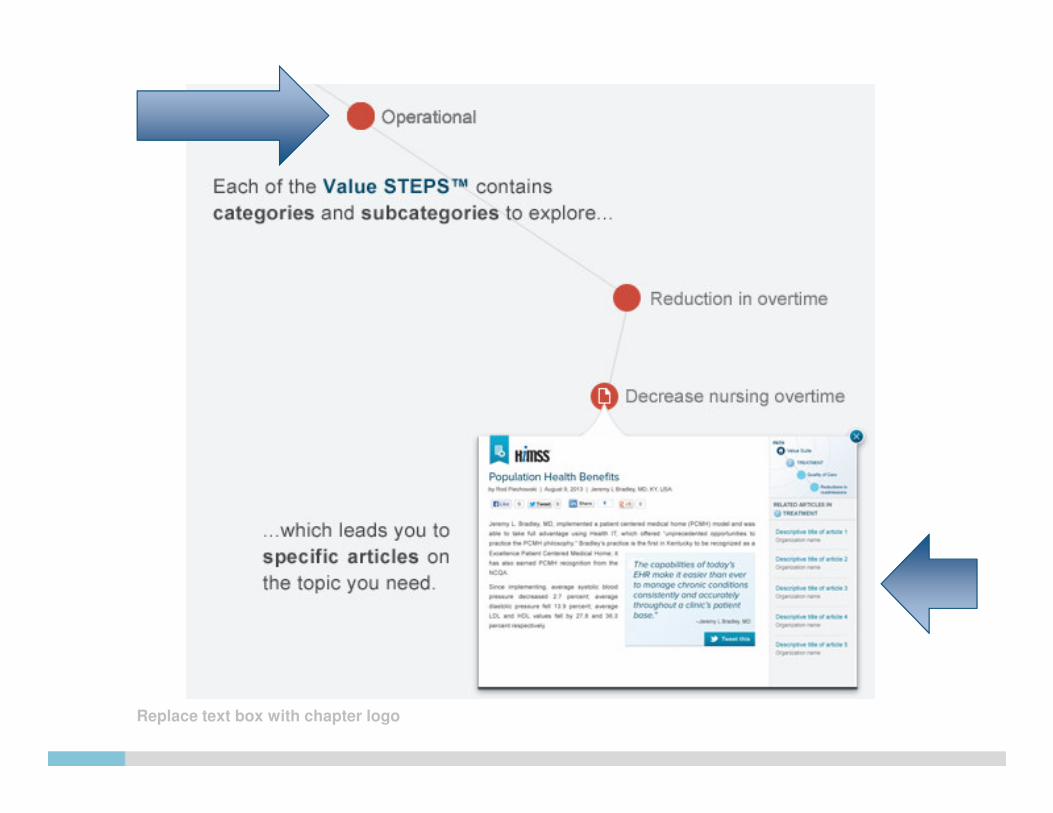
ACCESSING EVIDENCE

www.himss.org/ResourceLibrary/ValueSuite.aspx#/steps-app
The HIMSS Health IT Value Suite
Replace text box with chapter logo
Replace text box with chapter logo

Replace text box with chapter logo

Replace text box with chapter logo
SATISFACTION
Satisfaction
Provider Satisfaction• Improved Communication with staff
• Overall increased provider satisfaction
• Improved quality of life
• Improved communication with other providers
Patient Satisfaction• Increased in overall patient satisfaction and/or survey score
• Increased use of patient portal
Staff Satisfaction• Increased staff morale/job satisfaction
• Overall improved internal communication
Other Satisfaction• Other Satisfaction Benefits

Replace text box with chapter logo
TREATMENT/CLINICALTreatment/Clinical
Efficiencies• Increased efficiency in scheduling patients
• Other efficiencies
• Increased use of e-prescribing (Orders and refills)
• Improved accessibility of lab/x-ray reports
• Overall increased efficiencies
• Decreased redundancy in testing (labs/x-ray)
• Real time/remote access to health records
• Increased time for patient interaction
Quality of Care
Safety
Other Treatment/Clinical

Replace text box with chapter logo
TREATMENT/CLINICAL (cont’d)Treatment/Clinical
Efficiencies
Quality of Care• Reduction in hospital acquired infections
• Other quality of care benefits
• Decreased response time to patient requests
• Overall improved quality of care
• Reduction in readmissions
• Increased information sharing between providers
• Improved continuity of care
• Reduction in hospital acquired pneumonia
• Improved management of diabetes
• Other Treatment/Clinical benefits
Safety
Other Treatment/Clinical

Replace text box with chapter logo
TREATMENT/CLINICAL (cont’d)Treatment/Clinical
Efficiencies
Quality of Care
Safety• Improved clinical documentation
• Improved use of clinical alerts
• Reduction in medical errors
• Other safety benefits
• Overall improved patient safety
• Reduction in medication related errors
Other Treatment/Clinical

Replace text box with chapter logo
ELECTRONIC INFORMATION/DATA
Electronic Information/Data
Data Sharing and Reporting• Improved quality measures reporting
• Improved claims management
• Other Data Sharing & Reporting
• Overall increased data sharing/improved data recording
• Increased clinical trends tracking
• Increased population health reporting
• Improved security of patient records.
Evidence Based Medicine• Improved access to data for research
• Increased # of patients tracked/included in data warehouse
• Improvement in medical education

Replace text box with chapter logo
PREVENTION & PATIENT EDUCATION
Prevention/Patient Education
Patient Education• Improvement in disease surveillance
• Overall improvements in prevention
• Increased immunizations
• Increased cancer screenings
• Increased disease tracking
• Longitudinal patient tracking
• Longitudinal patient analysis
• Other Prevention benefits
Prevention• Improved patient engagement
• Increase in distribution of patient educational
• Improved patient compliance
• Overall improved patient education
• Increased patient awareness of disease symptoms
• Other Patient Education benefits

Replace text box with chapter logo
SAVINGS
Savings
Efficiency Savings• Reduction in transcription costs
• Improved workflow/practice efficiency
• Reduced patient wait times
• Reduction in emergency department admissions
• Overall increased efficiency
• Other efficiency savings
Financial/Business• Increased coding accuracy
• Increased patient revenue
• Reduction in days in accounts receivable
• Other Financial / Business benefits
• Reduction in length of inpatient stay
• Overall improved financial results
Operational Savings• Improved use of space
• Other operations savings
• Improve inventory control
• Reduction in FTEs or employee hours
• Improved business recovery planning (e.g. disaster preparedness)
• Reduction in overtime

Replace text box with chapter logo
SAVINGS
-1.52%
-0.58%
0.77%
1.79%1.47%
2.55%2.20%
4.91%
-0.9%
1.2%
3.3%
1.6%
2.4%
3.7%3.1%
9.4%
-4%
-2%
0%
2%
4%
6%
8%
10%
Stage 0 Stage 1 Stage 2 Stage 3 Stage 4 Stage 5 Stage 6 Stage 7
Avera
ge O
pera
tin
g M
arg
in
In 2011 2012
Financial Performance (Profitability)
How to use the HIMSS Health ITValue Suite
• Visit the website: www.himss.org/ValueSuite
• Review the continuing website development
– HIMSS Health IT Value STEPS™ description
– Examples and tools for providers
• Share provider and patient stories
– “Share your story” Link
• Primary contacts
– Pat Wise, Vice President, HIS, for HIMSS at [email protected] (to request information from the Value Suite)
– Rod Piechowski, Sr. Director, HIS at [email protected]
.

Thank You
Lorren Pettit, MS, MBAVice President, Market ResearchHIMSS Analytics
Email [email protected]