lookingforwardenglish
TRANSCRIPT

cenidet
V O L . 1 3 S U M M E R 2 0 0 6


Editorial Dear Colleagues, The Computer Society with approximately 100,000 members, is the leader organization for the professionals in computer sciences. It was founded in 1946, being the biggest of the societies organized by the IEEE. The Computer Society foments international communication, cooperation and exchange of information. It is dedicated to the promotion of the computer theory, practice and application to the data processing technology. "Looking Forward" is the student written and for The Computer Society students magazine. After a great effort, we finally present the number 13 edition of the "Looking Forward" electronic magazine. Before continuing we want to appreciate the help of the members of the Computer Student Chapter of the CENIDET, who are very honored of being elects to produce this edition.
The articles contained in this magazine embrace diverse topics, all related with the Master degree and Doctorate degree thesis projects being developed at the Computer Sciences Department. Particularly, in the following lines of investigation: Software Engineering, Distributed Systems and Artificial Intelligence. We appreciate the cooperation of M.S. Andrea Magadán Salazar for coordinating all their members. This edition has been possible thanks to the help of Prof. Ken Christensen, we acknowledge his support and trust to the Computer Student Chapter of the CENIDET. We know that participating in this kind of projects exalts the prestige of our institution and our country. We hope in a future this magazine can be added to the IEEExplore as part of the literature of the Computer Society. Long life Looking Forward!!! Jonathan Villanueva Tavira [email protected]
Director Ken Christensen,
Associate Profesor, Department of Computer Science
and Engineering , University of South Florida
Editor in Chief
M.C Andrea Magadán Salazar Vicepresidenta del Capítulo de Computación Sección Morelos.
Editors
Jonathan Villanueva Tavira Rocio Vargas Arroyo
Jorge A. Saldaña García
Collaborators
Edgar Colorado Soto Erika M. Nieto Ariza
Francisco Cervantes Álvarez Hilda Solano Lira
Jorge A. Saldaña García Juan C. Olivares Rojas Luis E. Morán López
Maricela C. Bravo Contreras Michelle Arandine Barrón Vivanco
Osslan O. Vergara Villegas Rafael I. Ponce Medellín
Rocío Vargas Arroyo Salvador Cervantes Álvarez
Vianey G. Cruz Sánchez
Student Branch Chapter CENIDET
The Center offers the possibility to carry out investigation works in agreement with other institutions like the Institute of Electric Investigations and the Center of Investigation in Energy; besides, there are agreements with important universities and foreign institutes. CENIDET has the departments of Electronic, Mechanics, Mechatronic and Computer Sciences, headquarters of the Computer Student Chapter of the IEEE.
The National Center of Research and Technological Development, CENIDET, is located in Cuernavaca, Morelos, city that has been transformed into headquarters of several scientific institutions, each dedicated to research and education, allowing a profitable exchange among them. Cuernavaca benefits from its proximity to the Mexico city, since the researching professors and the students can easily move to participate or to attend events, to exchange information, to consult libraries, to receive consultantships and,in general, to be related with all the activities that propitiate and enlarge the knowledge and the creativity. The Center, naturally, participates of this valuable synergy. The CENIDET offers its postgraduate programs, for related graduate people that are interested in getting ready for the applied investigation and the technological development.
Welcome to CENIDET
Computer Sciences Department

Web Page Retrieval Using an Ontology that is Populated by Automatic Text Classification
21.
Summary
1. Editorial. 2. Welcome to CENIDET.
Web Page Classification: a Semantic Análisis. 7.
Digital Image Processing in Wavelet Domain. 13.
Evaluation of tools for business process in three levels of abstraction.
27. Image Segmentation Script Language.
GAP: A Tool to Solve the Problem of the Web Contents Visualization in Pocket PC Devices.
17. 31.

Summary
Methodology for the generation of 3D models. 41.
Neuro-Symbolic Hybrid Systems. 35.
Vanishing points detection using Thales's theorem. 45.
Segmentation by color to characterize human gait. 55.
An Ontology-based Translator for Communicating Negotiation Agents over Internet.
49.
59. Description of two Statistical Models Applied To The Extraction Of Facial Features: Integral projections And Active Shape Model.
63. Authors.


7
Web Page Classification: a Semantic Analysis
Rocío Vargas Arroyo, Azucena Montes Rendón
Centro Nacional de Investigación y Desarrollo Tecnológico
{rvargas04c,amr}@cenidet.edu.mx
Abstract
In this paper, a semantic analysis for Web page
classification is presented. A set of Web pages,
resulting from a simple query to a Web browser, is
categorized by disambiguating the meaning of the term
used for the search. The disambiguation process
begins with the isolation of some outstanding
paragraphs; linguistic markers are used to accomplish
this task. The search term is located within the
paragraphs and the Contextual Exploration Method is
used to identify words that lead to the discovery of
relationships within an Ontology. Finally, the
discovered relationships are used for assigning the
web page to a category.
1. Introduction
Natural Language Processing is a challenging task
of Artificial Intelligence, because dealing with
language is not a simple task. With the immeasurable
growing of the Web, the problem of getting the proper
and desired information has grown too. Several
research groups have got significant and slightly
sufficient results, but not good enough to solve the
general needs. These obtained results are sensitive to
the ambiguity problem caused, mainly, by the used
techniques thus most of the developed projects [1-9]
are based on statistical methods and ignore linguistic
techniques.
In this work our main intention is the creation of a
classification tool. This tool will be able to classify a
set of HTML web pages written in Spanish. Linguistic
markers, Ontology and Contextual Exploration Method
[10] are integrated to accomplish the task.
2. Linguistic markers
In order to emphasize certain ideas contained in a
text, the author uses discourse markers. These markers
are linguistic units that set the order of the discourse.
Martín Zorraquino and Portolés [11] define these
markers as:
“Unidades lingüísticas invariables que no ejercen
una función sintáctica en el marco de la predicación
oracional – son pues, elementos marginales – y poseen
un cometido coincidente en el discurso: el de guiar, de
acuerdo con sus propiedades morfosintácticas,
semánticas y pragmáticas, las inferencias que se
realizan en la comunicación” [11].
Prada [12] extracted, from Martín Zorraquino and
Portolés [11] extensive analysis of these markers, five
categories (see table1).
Table1. Discourse markers
Category Sub-category
Comentadores
Ordenadores
Marcadores
estructuradores de la
información Disgresores
Aditivos
Consecutivos Marcadores
conectivos Contraargumentativos
Explicativos
De rectificación
De distanciamiento Reformuladores
Recapitulativos
De refuerzo argumentativo Operadores
argumentativos De concreción
De modalidad epistémica
De modalidad deóntica
Enfocadotes de la
alteridad
Marcadores
conversacionales
Metadiscursivos
Each type of marker has especial use in Spanish
discourse, but for this project, the attention is focused
on recapitulative markers because they introduce a
recapitulation or conclusion of what was said, they
concentrate a general view of the text intention and let
the reader, reach the final thought of the author.

8
Examples of these recapitulative markers are: En
suma, en conclusión, en definitiva, en fin, al fin y al
cabo, resumiendo, finalmente among others.
3. Contextual Exploration Method
The Contextual Exploration Method (CEM) [10]
was developed by LaLIC team of the Paris-Sorbonne
University and directed by Jean Pierre Desclés. This
method provides a frame for the identification of
semantic information in a text and a set of mechanisms
that help in the resolution of semantic indeterminations
or ambiguity cases. It also assumes that the texts
include linguistic units that help in the task of sense
construction.
Is required, by the method, the description of
indices and indicators. Indicators are linguistic units
associated to a set of contextual exploration rules.
When an indicator is located within the text a rule is
triggered; the context of the indicator is explored in
order to identify indices or words that lead to the real
meaning of the indicators. Indicators, indices and rules
integrate the linguistic knowledge base.
4. Ontology interaction
For this project, a Spanish version of EuroWordNet
[13] is used. EuroWordNet is a lexical-semantical
ontology of many languages such as Spanish, Dutch,
Italian, Frech, German and Czech. It follows the
WordNet model but integrates some improvements as
better expressivity of the knowledge base; adds new
relationship definitions and transcategorial
relationships.
The version used in this project was transformed
into a database and accessed through SQL queries.
The result of the queries leads to the construction of
context exploration rules.
Figure 1. Graphical result of a query to the Ontology. Search term capa.
5. Semantic analyzer
The process begins with a query to a well known
and widely used web browser. Simple search terms are
used (simple terms are more sensitive to ambiguity
problem) and a set of hyperlinks is retrieved. This set
is filtered to get only HTML pages written in Spanish.
Once the hyperlinks are extracted, each page is loaded
and its content is analyzed to get the most important
paragraphs; this paragraph selection is made by
locating linguistic markers within the text. The search
term is located within the isolated paragraphs the left
and right context are evaluated in order to get
surrounding indices that lead to the discovery of
relationships within an ontology. The extracted
relationships allow the association of the HTML web
page to a category.
The full process is graphically represented in figure
2.
Figure 2. HTML web page classification scheme.
5.1. Web browser query and hyperlink
extraction
The classification process begins with a query to a
web browser. The search term is a simple term, a
single word. The web browser returns a set of
hyperlinks linked to web pages where the search term
is contained.
Hyperlinks are extracted and its associated page is
analyzed later.
Several query strings where analyzed in order to
simplify the query to the web browser. Language and
file format is specified. Example:

9
http://www.google.com.mx/search?num=<number of
resulting links>&as_epq=<search term>&lr=
<language> &as_filetype=html
Two sets of hyperlinks are extracted, the first set
corresponds to the direct link to the web page, the
second, corresponds to the cache version of the page.
See figure 3.
Figure 3. Simple interface for hyperlink extraction.
5.2. Localization of linguistic markers and
paragraph selection
Each web page is loaded and its body content and
some other representative information as metadata are
extracted. See figure 4.
Figure 4. Simple interface for web page content
extraction.
Some linguistic markers, mostly recapitulative
markers, are located within the body of the page.
Paragraphs where these markers are present are
selected for a more extensive analysis. Consider the
next text segment and the search term “capa”:
“…El segundo sistema permite una elección mas
amplia del copulador y del revelador, pero implica
mayores dificultades en el tratamiento. El revelador
que tiene el copulador debe actuar en la capa
correcta, y esto se logra controlando la velocidad de
difusión o aplicando exposiciones controladas. El
método de la difusión controlada es anticuado. El
método de exposición selectiva utiliza una película de
varias capas que tiene la siguiente construcción: sobre
la base se aplica la emulsión sensible al rojo y encima
una emulsión sensible al verde; sobre esta, una capa
de gelatina que contiene un colorante filtro amarillo, y
finalmente sobre la capa filtro se aplica una capa de
emulsión sensible al azul…” [14]
From this text segment, a representative paragraph is
extracted:
“El método de exposición selectiva utiliza una película
de varias capas que tiene la siguiente construcción:
sobre la base se aplica la emulsión sensible al rojo y
encima una emulsión sensible al verde; sobre esta, una
capa de gelatina que contiene un colorante filtro
amarillo, y finalmente sobre la capa filtro se aplica
una capa de emulsión sensible al azul”. [14]
5.3. Search term localization and context
exploration
Once the paragraphs are selected, the search term is
located within each paragraph an its left and right
context are explored looking for key terms that lead to
the discovery of a relationship within an ontology.
The Contextual Exploration Method [10] is applied
and indicators, indices and rules are defined.
The indicators sets are composed by the search term
and its synonyms, the set of indices is populated by a
query to an Ontology and the rules are dynamically
created. Example:
Indicators = {capa, mano, baño}
Indices = {pintura, emulsión, impermeabilizante,
esmalte, barniz, …}
Rule:
If In the context of the I1 set appears any
indice belonging to set I2
Then
Assing the “Cubrimiento aplicado a una
superficie” meaning to the search term in the
selected statement
End if
“El método de exposición selectiva utiliza una
película de varias capas que tiene la siguiente
construcción: sobre la base se aplica la emulsión
sensible al rojo y encima una emulsión sensible al
verde; sobre esta, una capa de gelatina que contiene
un colorante filtro amarillo, y finalmente sobre la
capa filtro se aplica una capa de emulsión sensible al
azul” .

10
5.4. Relationships extraction and final
categorization
For the final categorization, a set of categories must
be defined. A first approach for solving this task is to
extract a group or relationships, from the ontology,
where the search term and the given sense are involved.
Example:
Figure 5. Homonym relationships of the search term
capa.
All nodes presented in figure 5 are homonyms of the
term capa, each node has a different meaning. Nodes 0
means “Acción y efecto de cubrir la superficie de un
cuerpo con un material” and node 3 means
“Cubrimiento aplicado a una superficie”. These
relationships where discovered in the Ontology, but
these are not sufficient for creating a category, so
second level relationships must be discovered.
Figure 6. Second level relationships of the search term capa.
In figure 6, the hyponym relationships (for nodes 0
and 3) of the term capa are shown. Here is where
indice terms appear and let us create the categories for
the classification.
Therefore, a first set of categories names might be
formed by first level relationships and its meaning.
Here is where a big problem arises, the ontology data is
not complete, some of its meanings are missing.
6. Conclusions
The easiest way to get information from the web is
trough web browsers and directories; however, the
obtained results not always are sufficient enough
because the search techniques do not care about the
semantic content of the pages. So is necessary the
implementation of a tool able to make a proper
classification of the web pages according the real
meaning of the query.
With a tool like this, the search process made by the
user will be improved cause documents out of the
interest might be discriminated and as a consequence,
the number of pages to visit and the time inverted in
exploring not relevant ones will be diminished.
Moreover, the introduction of linguistic techniques
to classification methods might improve the way web
spiders indexes the information.
7. References [1] A. Gulli and P. Ferragina, “The anatomy of a hierarchical
clustering engine for web-page, news and book snippets”,
Fourth IEEE International Conference on Data Mining,
ICDM’04, Brighton, UK, 2004.
[2] A. Gulli, “SnakeT”, http:// www.snaket.com, Pisa
University, Italy.
[3] Vivísimo, Inc., “How the Vivísimo clustering engine
works, http://www.vivisimo.com , 2003.
[4] Vivísimo, Inc.,”Clusty”, http://www.clusty.com , 2005.
[5] A. Téllez-Valero, M. Montes-y-Gómez and L. Villaseñor-
Pineda, “Aplicando la clasificación de texto en la extracción
de información”, Encuentro Internacional de Ciencias
de la Computación, ENC, Colima, México, September 2004.
[6] J. M. Gómez, E. Puertas, G. Carrero, M. de Buenaga,
“Categorización de texto sensible al coste para filtrado en
Internet”, Procesamiento del Lenguaje Natural, SEPLN,
Magazine nº 31, September 2003.
[7] L. Golub, Automated subject classification of textual Web
pages, for browsing, Thesis for the degree of Licenciate in
Philosophy, Lund University, Switzerland, August 2005.
[8] F. Sebastiani, “Machine learning in automated text
categorization”, ACM computing surveys, 2002.
[9] F. Sebastiani, “Text categorization”, in Zanasi A., Text
Mining and its Applications, WIT Press, Southampton, UK,
2005.

11
[10] J. P. Desclés, E. Cartier, A. Jackiewicz and J. L. Minel,
“Textual Processing and Contextual Exploration Method”,
Context 97, Rio de Janeiro, February 1997.
[11] Martín Zorraquino, Mª Antonia y José Portolés Lázaro.
Los marcadores del discurso. Bosque y Demonte. Vol. 3.
4051-4213.
[12] J. Prada, G. Moncecchi, “Reconocimiento eficiente de
marcadores del discurso en español”, VIII Simposio
Internacional de Comunicación Social, Santiago de Cuba,
Cuba, January 2003.
[13] Amsterdam University, “EuroWordNet: Building a
multilingual database with wordnets for several European
languages”, March 2006,
http://www.illc.uva.nl/EuroWordNet/
[14] “Fotografía / Fotografía en colores”, March 2006,
http://www.punksunidos.com.ar/punksunidas/fotografia/foto
grafia6.html


13
Digital Image Processing in Wavelet Domain
Osslan Osiris Vergara Villegas and Raúl Pinto Elías
Centro Nacional de Investigación y DesarrolloTecnológico (cenidet)
Interior Internado Palmira S/N, Col. Palmira. C.P. 62490.
Cuernavaca Morelos México.
{osslan, rpinto}@cenidet.edu.mx
Abstract
In this paper we present some explanation about
digital image processing in the wavelet domain. First
an image is transformed using a Discrete Wavelet
Transform (DWT), then several mathematical
operations are applied in order to observe some
features presented in the image. The transformation
can reveal some features that are not clear or difficult
to detect in the original domain. We obtain wavelet
directionality and edge detection, image smoothing,
scale changing, image denoising and compression, and
finally, feature extraction in wavelet domain.
1. Introduction
Wavelet transform was used in geophysics in early
1980s for the analysis of seismic signals [1]. A wavelet
transform decomposes a signal f into its components on
different scales or frequency bands. This is made by a
convolution process on f using the translated and
dilated wavelet ψ (wavelet mother). Based on the
selection of ψ, the transformed function allows, for
example, the extraction of the discontinuities or edges
in f, performing a pattern recognition task or storing a
compressed version of f.
Wavelets are signals which are local in time and
generally have an irregular shape. A signal can be
decomposed into many shifted and scaled
representations of the original mother wavelet [2].
Wavelets have the advantage of being able to
separate the fine details in a signal, very small wavelets
can be used to isolate very fine details in a signal, while
very large wavelets can identify coarse details. In
addition, there are many different wavelets to choose
from. One particular wavelet may generate a more
sparse representation of a signal than another, so
different kinds of wavelets must be examined to see
which is most suited for the application you need in
digital image processing for example image
compression or denoising, pattern recognition, etc.
2. Multiresolution Analysis
Multiresoltion analysis is concerned with the study
of signals or processes represented at different
resolutions and developing an efficient mechanism to
change from to one resolution to another [3]. The
discrete Wavelet Transform (DWT) is a mathematical
tool for the analysis and synthesis of signals that can be
used when digital images need to be viewed or
processed at multiple resolutions.
The localization of signal characteristics in spatial
(or time) and frequency domains can be accomplished
very efficiently using wavelets. This allows us to
simultaneously determine sharp transitions in the
spectrum of the signal and in the position (or time) of
their occurrence.
The principle behind the use of wavelets for
decomposing an image is to use a wavelet function Ψ to
represent the higher frequencies corresponding to the
detailed parts of the image, and a scaling function Φ to
represent the lower frequencies corresponding to
smooth parts of the image. Figure 1 shows the process
to decompose an image using filters to obtain the
subband decomposition.
Figure 1. Subband decomposition of an image.

14
Multiresolution analysis plays an important role in
the perception and decision mechanism of human
beings.
3. Wavelet Directionality and Edge
Detection
With the wavelet transform we can obtain some
information (details) about the directionality and the
edges presented in an image. In this section we use the
image shown in figure 2 to explain how to obtain
directionality and edge detection.
Figure 2. Image “Star” for edge and
directionality analysis.
The first thing to do is to transform the original
image using some DWT, for this example we
decompose the image only one level using the symlet 4.
Figure 3 shows the resulting image from wavelet
transform.
Figure 3. “Star” after wavelet decomposition.
From figure 3 we can see that the horizontal edge of
the original image is presented in the horizontal detail
coefficient matrix of the upper-right quadrant.
Similarly the vertical edge is shown in the vertical
detail coefficients of the lower-left quadrant. Finally
you can see that the diagonal borders are shown in the
diagonal detail coefficients of the lower-right quadrant.
From the wavelet subband image we can combine
the edge information into a single image. The only
thing that we need to do is changing to zero all the
approximation coefficients (upper-left quadrant), and
then compute de Inverse Discrete Wavelet Transform
(IDWT). The resulting edge image is shown in figure
4.
Figure 4. “Star” edge resulting image.
We can use a similar procedure to isolate the
vertical or horizontal edges. It is important to remark
that the information of diagonal edges is always
preserved although we cut the diagonal coefficients.
4. Image Smoothing or Blurring
Wavelets can be used as a tool for blurring or
smoothing images. For this example we use the image
shown in figure 5.
Figure 5. “Tools” image.
In order to smoothing, we need to compute the
wavelet transform in more than one decomposition
level; for example we use the Symlet 4 with four
decomposition levels as shown in figure 6.
Figure 6. Four decomposition level of “Tools”.
Converting to zero one detail level allows us to
obtain increasingly smoothed versions of the original
image.

15
For example if you zeroed the first three details
level, we can obtain an image as the one shown in
figure 7a). If we change to zero all levels (four) we can
obtain an increase of blurring in the image as shown in
figure 7b.
Figure 7. “Tools” images. a) Result of zeroing
first three levels, b) result of zeroing all levels.
5. Change the Scale
Changing the scale of an image implies a
mathematical operation called interpolation. With the
DWT we can downscale an image with a factor of 2n or
upscale an image with a factor of 2n. This process is
made by removing or adding subbands in the wavelet
domain.
This scale changing provides an application to
progressive reconstruction of the image. Lets suppose
that we need to send an image to two users in different
sites and those users need different resolution images.
The image can be reconstructed with gradually
higher resolution approximations of the final high
resolution image, and we can send the adequate image
for each user at an exact subband reconstruction.
Figure 8 shows an upscaling example of the camman
image.
Figure 8. Upscaled Camman image. a) Original
image, b) Incise a doubled image, c) Incise b
doubled image.
Performing of the upscaling or downscaling process
is better than the same process made by interpolation.
6. Image Denoising
Image denoising is the process of separating the
noise out of the image components from a single
observation of a degraded image. The image can be
corrupted with noise because of either data acquisition
process or naturally occurring phenomena.
The simplest technique for denoising is wavelet
thresholding (shrinkage). We use as input a noise signal
like the image that we shown in figure 9a. We perform
the wavelet transform using for example four
multiresolution levels, and then we use a denoising
method called soft thresholding through all subbands.
The technique sets coefficients with values under
the threshold (T) to 0, then substracts T from the non-
zero coefficients. After soft thresholding, we compute
the inverse wavelet transform. Figure 9b shows the
image obtained from the denoising process.
Figure 9. “Goldhill” image. a) Gaussian noise
image, b) denoised image
The main problem in denoising is the selection of
the best value of T for thresholding.
7. Image Compression
One of the main popular applications of wavelets is
image compression. Data compression goal is to reduce
the volume of necessary data to represent a certain
information amount. One of the advantages obtained
with the use of DWT is that the image is decorrelated,
thus the image can be easily compressed.
Some of the wavelet coefficients obtained from
DWT correspond to details in the data set. If there are
few details, they might be omitted without substantially
affecting the main features of the data set.
The first step is to transform the original image into
the wavelet domain using the DWT, one of the
important decisions is what family of wavelet to use
and what multiresolution level to apply. The selection
of a wavelet family depends a lot on the subsequent use
of the image, but it is necessary to take into account
some wavelet properties as orthogonality, number of

16
vanishing moments, compact support, symmetry, etc.
By the other hand, the multiresoltion level can not be
larger than Log2(N).
The quantization stage is made after the process of
DWT; here, we can use two different strategies. One is
to set all high frequency sub-band coefficients that are
under a particular threshold to zero. The other is to
change to zero, for example, the coefficients behind the
matrix diagonal or some decomposition level.
There are two highly used techniques for
quantization: the Embedded zerotree wavelet coder
(EZW) and the Set Partitioning in Hierachical trees
(SPIHT) which are very efficient for several
applications.
The final stage corresponds to the entropy coder
which is a lossless stage. Figure 10 shows the lena
image and from left to right different images obtained
from compression process at different quality and
storage space.
Figure 10. “Lena” image at different quality
and storage space.
8. Image Feature Extraction
Image classification is maybe the most important
application when using digital images. In order to
perform it, a feature vector is used to describe an
image.
The statistical properties of the wavelet coefficient
characterize an image, which can be used to lead us to
the better image classification. Some measures
obtained from wavelet coefficients are:
Norm-2 energy:
∑=
=N
k
kCN
E1
2
21
1 (1)
Norm-1 energy:
∑=
=N
k
kCN
E1
12
1 (2)
Standard deviation:
∑=
−=N
k
kCN
E1
2
23 )(1
µ (3)
Average residual:
∑=
−=N
k
kCE1
2
4 )( µ (4)
Entropy:
∑=
−=N
k
kk CCN
E1
22
25 log1
(5)
Where
∑=
=N
k
kCN 1
2
1µ (6)
µ is the mean and N the size of the image.
9. Conclusions
In this paper we show some applications of the
wavelet transform for digital image processing, with
the goal of demonstrating that an image can be
manipulated even in the wavelet domain.
Research in wavelets keeps looking for some more
complex families fitting with a particular application,
for example, trying to describe an important feature of
the image known as image geometry.
10. References [1] Morlet, J., G. Arens, E. Fourgeau, and D. Giard, “Wave
propogation and sampling theory part 1: Complex signal and
scattering in multilayered media”, Geophysics, Vol. 47, No.
2, pp. 203 -221, February 1982.
[2] Maryhelen S., “Image compression using wavelets”,
Thesis proposal, Department of electrical and computer
engineering, University of New Brunswick, Canada, 1997.
[3] Mallat, S., “A theory for multiresolution signal
decomposition: The wavelet representation”, IEEE
Transactions on Pattern Analysis and Machine Intelligence
(PAMI), Vol. 11, No. 7, pp. 674 – 693, July 1989.
[4] Gonzalez Rafael C., Woods Richard E. and Eddins
Steven L., Digital image processing using Matlab,
Pearson Prentice Hall, 2004.

17
GAP: A Tool to Solve the Problem of the Web Contents Visualization in
Pocket PC Devices.
J. Carlos Olivares R., J. Gabriel González S., Azucena Montes R., Víctor J. Sosa S. e I. Rafael
Ponce M.
Centro Nacional de Investigación y Desarrollo Tecnológico(cenidet)
Cuernavaca, Morelos, México
{jcolivares04c, gabriel, amr, vjsosa, rafaxzero4c}@cenidet.edu.mx
Abstract
This tool intends to fill the existing ‘GAP’ in the
Web sites visualization in mobile devices, such as
Pocket PC. In order to guarantee that the users can
correctly visualize the Web resources, two things are
needed: a mechanism for controlling disconnections,
and allowing visualization of Web content despite of
the device connection state (hoarding), and a
mechanism that can adapt the Web content to the
specific mobile device features (transcoding). GAP is a
tool that integrates these two mechanisms and allows
improving of the user’s navigation experience in the
Mobile Web.
Keywords: Pocket PC, Visualization, Web Resources,
Hoarding, Transcoding.
1. Introduction
Mobile devices are each time closer in time,
according with [1]: "By 2009, more than a half of the
microprocessors made in the world will be intended for
mobile devices." "The software that will really make
mobile devices useful isn’t developed yet." These
statistics reflect that the use of mobile devices is
increasing due to their tiny size and that its power of
processing and versatility is growing day by day.
The problem of Web resources visualization in
mobile devices is the fact that the great majority of
Web sites in Internet have not been designed for this
type of devices. The mobile devices have limited
resources like small screens, little memory, low
processing speeds, etc; in comparison with traditional
computers equipment.
On other hand, the Web and the protocol that
manages it: HTTP are connection oriented (they are
based on TCP) what causes the transaction to fail if
the user, by any reason, becomes disconnected from
the network . In this case, it might not be possible to
visualize the Web resources in the mobile client.
Disconnections are frequent in this type of devices,
mainly because of their main advantage: mobility.
In this work a system which development is in
progress is described. It focuses in attacking the
problem of Web resources visualization on mobile
devices. The main characteristic of this work is that
great part of the system is executed in this kind of
devices, in comparison to the great majority of the
existing solutions that are executed in traditional
platforms.
2. Alternatives of solution
In order to solve this problem several alternatives
are presented: to design a new protocol, to modify and
existed protocol or to implement intermediary services
that solve the problem.
2.1 New protocols
In this scheme is possible to mention the WAP
protocol and the WML language, they work in an
analogous way as HTTP-HTML in the traditional Web.
The problem strives in that WAP only works with
mobile equipment and this would bring the same
fragmentation that today has the Web (special pages
for all class of devices). In addition, WAP was
originally designed for devices with limited resources
capacities (monochrome screens, lower bandwidth, etc)
which is actually solving day by bay through
bandwidth wireless connection (WCDMA, UTMS,
802.11g, WiMax, etc) and with more and more
powerful equipment.
The best solution would be to create a new protocol.
The problem is that this one must be totally compatible
with the existing ones, because if not, it would let
unusable thousands of existing resources (it would be
necessary to modify as much Web servers as Web
clients).
2.2 Modification of protocols
Within this alternative exits the case of having a
new request scheme of Web resources. This new

18
scheme receives the name of Push, whereas traditional
scheme receives the name of Pull [2].
The Pull scheme receives the name of “over
demand’. Under this scheme, the client (user) is who
visualizes a resource in an explicit way. In our case, if
a user wants to see the page of cenidet, must write in
the Web browser the next URL:
http://www.cenidet.edu.mx/.
The Push scheme also receives the name of
'subscription-notification'. In this scheme, the user
subscribes itself to a service and when some event of
interest happens a notification is sent for alerting the
user about the event.
Generally these two schemes do not live on isolated
way. Hybrid schemes (Pull&Push) have been applied
in diverse existing services, so is the case of the
reception of SMS/MMS messages, where the send of
messages is Pull and the reception is Push, since it
notifies to users about the existence of new messages.
Another service that has made famous devices like
the Blackberry to become successful is the Push-mail
[3]. This service comes to solve the problem of email
visualization in mobile environments. Under the
traditional scheme of the electronic mail, for consulting
the email, a user must be connected all the time to
receive it. This originates great costs if the network
connection generates costs per time. With this new
scheme, the user is not connected to the mail server.
When a new mail in the server is received, it notifies
the client of the existence of the new mail and sends it
to the mobile client.
For this type of schemes, protocols like HTTPU
(HTTP over UDP) or HTTPMU (HTTP over multicast
UDP) have been proposed, and basically works similar
to the HTTP but using datagrams, which are not in an
oriented connection way. With these protocols are
possible to offer a better quality in the mobile Web [4].
2.3 Intermediary services
This is the more extended solution to solve the
problem of Web resources visualization and many
other problems present on Web, like the case of
firewalls that solve some of the Web security problems
like the access control, or proxies’ caches that tries to
reduce the access latency to the information.
The scheme of intermediaries is widely used
because it doesn’t need to modify neither the clients
nor the servers; in fact, the client and server processes
do not notice the existence of these intermediary
services. These services are in charge of the hard work
and are transparent to the users.
The tool that is described in this article, works
under the scheme of intermediary services.
3. Proposal of solution
The hoarding process solves the problem of Web
resources visualization without concerning the state of
the connection of the mobile device. For this, it
becomes necessary that the user has already stored, in
local way, in his device the resources that he o she will
use.
As can be observed, the amount of resources to
occupy can be immense, whereas the capacity of
storage of the devices is limited. In order to give
solution against this new problem is necessary to have
an effective way to know the resources that a user
could use. With hoarding is possible to reduce this,
through algorithms of association rules applied on Web
logs, is determined the optimal set of resources that
will be replicated to the mobile clients [5].
A mechanism which tries to solve the adaptation
problem of Web resources to the displaying capacities
on mobile devices is transcoding. It consists of
transformation of resources, distilling and processing
of all those characteristics that are not available in the
device is needed. The used mechanism of transcoding
uses HTML to a subgroup of HTML transformer,
using XML.
The system is based on client-server architecture
with an intermediate tier on the server side as on the
client side. The system is shown in Figure 1.
Figure 1. General architecture proposed.
The general system has been denominated GASWT
(Gestor de Acaparamiento de Sitios Web
Transcodificados: Hoarding Manager of Transcoding
Web Sites). The intermediary in the client side is
denominated GAP (Gestor de Acaparamiento para
Pocket PC: Hoarding Manager for Pocket PC),
whereas the server side is denominated GAT (Gestor
de Acaparamiento y Transcodificación, Hoarding
Manager and Transcoding). The GAT is composed by
MA (Mecanismo Acaparador: Hoarding Mechanism)
and by MT (Mecanismo Transformador: Transcoding

19
Mechanism). The communication between the
processes is made through a HTTP request-response
scheme.
As much the MA as TM are taken from other
projects that together with this one, comprise the
Moviware project [6], whose main function is to offer
a set of services to mobile clients that have frequent
disconnections.
The general operation of the system is described in
the next lines. The user introduces an URL from the
Web browser (which has been previously configured to
redirect his exit towards the GAP). The GAP receives
the request and determines if it is in the local cache of
the device, if found, the hoarded resource is sends to
the Web browser.
When the resource is not hoarded, the system
validates the connection existence in order to obtain
the resource on line. If for some reason the resource
cannot be shown, (because it doesn’t exist or has
detected an error in the connection) the system notifies
the user by sending an error message.
On the other hand, if the Web resource is not
hoarded and a pattern of the site in the local device
doesn’t exist, the MA sends the Web resources if a
pattern for this site exists. If the pattern exists but the
hoarded resources in the MA aren’t present, it obtains
them by requesting them to MT and soon compresses
the resources in zip format to optimize the process.
Once the MA has sent the hoarded Web site, the
mobile device must decompress the Web site and
update its list of patterns. This process happens in
transparent way, in a way that the user never notices.
MT is responsible of collecting documents and if
they are HTML, it transforms them if the configuration
parameters indicate that. The transcoding is made on
line, because the process is slowed down if the
document is too large.
The actions that the user can make on the system
consist in visualizing Web sites on line, visualizing
Web sites on disconnection mode, visualizing error
messages, visualization of the requests states and
finally, set up the system.
The GAP is basically conformed of three main
modules which are: Observer, GAL (Gestor de
Acaparamiento Local: Local Hoarding Manager) and
GDL (Gestor de Desconexión Local: Manager of Local
Disconnection).
The Observer is responsible of processing each
request and to give back the result to the navigator.
The GAL is responsible of the manipulation and
control of the cache in the device. The users decide
which resources are susceptible of hoarding, as well as
limiting the storage space.
The GDL is responsible of determining the state of
the connection. The control of the disconnections has
been used drilling the network during three seconds.
Observing the quality of the results, a threshold of 30%
of accepted connections determines if the client is
connected (if the threshold is surpassed or equaled) or
is on disconnection mode (if it is below the threshold)
[7].
For the implementation of this tool, we used .NET
Compact Framework 1.0 with C # language, because it
is the best option to program in Pocket PC platform
[8].
The modifications of the MA and MT are being
made in Java so that it is language in which these
modules are programmed.
4. Results
The tool described in the present document has been
proven in diverse equipment like Pocket PC 2000
(Compaq iPAQ H3630), Pocket PC 2002 (HP Jornada
5500), Pocket PC 2003 (HP rx3115), emulators of
Windows CE, desktop PC (Compaq Presario with
Pentium 4 1.4 Ghz. processor, 512 Mb of RAM
memory).
The first test scenario consisted of acceding to the
Web resources in on line mode. We obtained
satisfactory results (see Figure 2).
In the number two test scenario, the GAP was
executed without being connected to the network.
Additionally we had a pattern of a hoarded Web site
(http://www.cenidet.edu.mx/) and resources. In this
case not existing images in the original site were used,
because it was possible to verify that the hoarded
resources are correctly displayed.
The number three test scenario (see Figure 3),
demonstrates that it is possible to transcoding the
resources in the device as well as showing them in a
local way if they are hoarded and without transcoding.
It is Also possible to execute the GAP in other
platforms like Smartphones (SmartGAP) and a desktop
PC (WinGAP). GAP, WinGAP and SmartGAP are the
same program but with different name, to differentiate
the platforms in which they’re running.
5 Conclusions
With the presented tool is being demonstrated that it
is possible to execute complex services in Pocket PC
devices, so is the case of an intermediary service that it
allows to visualize Web resources when it exists or not
a network connection.
At this time we have verified in an isolated way
most of the functions of the system (it lacks the
methods of decompression of the hoarded site), it

20
would be necessary the respective integration of
components and testing to the system in its totality.
Figure 2. Case of test 1: Visualization of Web
resources with network connection.
Figure 3. Visualization of Web sites in
disconnection mode with hoarded Web resources
and without transcoding.
Figure 4. Case of test 3: Visualization of Web sites
in connection mode, with hoarded and transcoding
resources.
The expected benefits at the conclusion of this
investigation work are: 1) Visualization of Web sites
without mattering if the devices are connected or not.
2) Reduction of latency in the access to the
information, if the resource is hoarded locally. 3)
Energy Saving by the fact to work in disconnection
mode. 4) Saving money if the user decides not to
connect to a network that receives the service and
generates expenses by the access time. 5) Facility of
administration of Web sites when not having different
versions to each device.
6. Acknowledgments
We want to give thanks to Rocío Vargas Arroyo for
her contribution in correct this paper.
7. References [1] SG magazine, http://www.softwareguru.com.mx [visited
march 2006]
[2] Purushottam Kuikarni, et al., “Handling Client Mobility
and Intermittent Connectivity in Mobile Web Accesses”,
Department of Computer Science, University of
Massachussets.
[3] Blackberry’s push technology,
http://www.blackberry.com/products/software/integrations/p
ush_email.shtml [visited march 2006].
[4] UPnP Forum, http://www.upnp.org/, [visited march
2006]
[5] David Valenzuela, “Mecanismos para predicción de
acaparamiento de datos en sistemas clientes/servidor
móviles”, masther thesis, cenidet, august 2002.
[6] Gabriel González. “Plataforma middleware reflexiva para
aplicaciones de cómputo móvil en Internet (Movirware)”,
cenidet.
[7] J. Carlos Olivares, et al, “Control de desconexiones en la
visualización de páginas Web en dispositivos móviles
Windows CE”, for appear in XVI CIECE’06, april 5,6 and 7
2006, Cd. Obregón, Sonora, México.
[8] Gabriel González, Azucena Montes, J. Carlos Olivares,
“Comparativa y evaluación de las herramientas de
programación para desarrollar aplicaciones en plataforma
Pocket PC”. VI CICC’05, Colima, Colima, México,
september 2005.

21
Evaluation of tools for business process in three levels of abstraction
Erika M. Nieto Ariza1, Javier Ortiz Hernández
1, Guillermo Rodríguez Ortiz
2
1Centro Nacional de Investigación y Desarrollo Tecnológico
Interior internado Palmira s/n, Cuernavaca, Morelos, 62490 México {erika, ortiz}@cenidet.edu.mx,
2Instituto de Investigaciones Eléctricas
Reforma 113. Palmira, Cuernavaca, Morelos, 62490 México [email protected]
Abstract
Organizations are increasingly choosing the use of
the web to provide their services to their clients.
Services are the systemization of the business
processes in the organization. Due to the great number
of existing modeling methods and the increasing use of
internet, it is necessary to identify the information that
modeling methods allow to specify. In this paper, a set
of concepts is proposed to evaluate modeling methods
for business modeling using three levels of abstraction
–organizational, integration and web.
1. Introduction
Organizations should decide how the technology
systems support business and how increasingly these
information systems become an integral part of the
business processes [1, 2]. Models are commonly used
to flexibly represent complex systems and to observe
the performance of a business process when a
technology system is integrated [3, 4, 5]. A business
model is an abstraction of how a business performs, it
provides a simplified view of the business structure
which acts as the basis for communication,
improvement, or innovation, and defines the
information systems requirements that are necessary to
support the business. A model has to capture the
domain without reference to a particular system
implementation or technology. One of the problems
with modeling the early representations of business
processes, conceptual views of information systems
and Web interactions is the great number of techniques
to model and specify these models, and, additionally,
since each one has its own elements, this makes it
complex and laborious to compare and select the
appropriate technique to model a system in an specific
level of representation.
Three modeling levels of abstraction are proposed
which integrate a set of concepts to build early web
application models: a) Organizational, it describes how
the organization works and the business process that is
going to be systematized with a web information
system; b) Integration, it describes the role of the
software system and its integration with a particular
organizational environment; c) Web, it describes the
semantics of a web application [5,6]. The basis of our
contribution is in the identification and classification of
a set of concepts which are used to know what to model
at each level of abstraction and, to have a modeling
method evaluation framework to distinguish the
capabilities of each method in order to model at the
three levels of abstraction.
There are some methods and methodologies to
evaluate business process modeling; however, they do
not evaluate capabilities but rather the functionality of
the application or the modeling methods. Rosemman
proposes ontology to evaluate organizational modeling
grammars identifying their strength and weaknesses
[7]. Luis Olsina [8] and Devanshu Dhyani [9], propose
a methodology to evaluate the characteristics of a web
application in operational phases.
The structure of this paper is as follows: in section 2
the modeling concepts that comprise our approach are
briefly presented, in section 3 the modeling concepts
are enhanced with a set of aspects found to be useful in
building models and a method evaluation methodology
is presented, in section 4 the results of the evaluation
are shown, in section 5 the conclusions about the
benefits of the methodology are discussed, finally the
references are presented.
2. Modeling concepts
A business process model can be viewed at many
levels of abstraction, and complementary model views
can be combined to give a more intelligible, accurate

22
view of a system to develop than a single model alone
[3]. This approach establishes three levels of
abstraction and each one includes certain modeling
concepts of features as shown in table 1. At each of
these levels, concepts are properties or characteristics
that structurally describe types of requirements in a
specific level of abstraction; they define the key
elements in a business process. Concepts in each level
of abstraction were selected based on the analysis of
several techniques and methods for business process
modeling at the three levels.
Table 1: Modeling concepts at each level of abstraction
Organizationa
l level
Integration
level
Web level
Business process Pure navigation
--- Navigation page - Relationship
User profile (Rol) User profile (Rol)
Actor
Actor
Class (object) ---
Resource Artifact
Artifact Artifact
Goal Goal --- Goal
Task Function Service Service
Activity Event
Event ---
Business rule Constraint Precondition and postcondition
---
Quality
No functional requirement
No functional requirement
---
The organizational modeling concepts are as
follows.
- Actor. It describes an entity that has a specific goal in
the business process.
- Resource. It describes an informational or physical
entity that is transferred between actors.
- Goal. It describes a business process desired state that
an organization imposes to itself.
- Task. It describes a series of activities oriented to
reach a goal.
- Activity. It describes a set of actions to carry out one
task.
- Quality. It describes the desired characteristics in the
business process.
- Business rule. It describes the actions and criteria that
govern the execution of the business process.
The integration modeling concepts are as follows.
- Actor. It describes an entity that interacts with the
information system and that might play different roles.
- Artifact. It describes an entity that is transferred
between an actor and the information system.
- Goal. It describes the information system purpose,
limitations and responsibilities.
- Function. It describes a service that must be provided
by the information system.
- Event. It describes a change in the business process in
one specific moment of time.
- Constraint. It describes a condition for a service
execution supplied by the information system.
- Non functional. It describes the desired quality
features or constraints for the information system.
The Web modeling concepts are as follows.
- Navigation relationship. It describes a global vision of
the Web application according to a user profile.
- User profile. It describes the user unique use of the
Web application.
- Class. It describes an object type to model the entities
that integrate the application.
- Artifact. It describes an abstract object to be
transferred between the Web application and a user.
- Goal. It describes the purpose of the Web application.
- Service. It describes an activity or an action that the
web application has.
- Event. It describes the trigger of an activity or action
that might be carried out to obtain a result or artifact.
- Pre and pos condition. It describes the performance of
an event execution.
- Non functional requirement. It describes the desired
quality features or constraints for the Web application.
Each concept used for business process modeling is
related to each other.
3. The concepts and the evaluation of
methods approach
The last section introduced a set of modeling
concepts used to model business processes and systems
at different levels of abstraction. Here the concepts are
enhanced with aspects that make them more powerful
to model a particular view. These aspects are also used
as scales to evaluate modeling methods. These aspects
are capabilities sorted by the concepts presented before
and a scale is defined for each concept using the
capabilities related to the concept. Also, a desired
capability mentioned in the literature may be used in
the definition of a scale.
Following a well-known approach from the
economics and management disciplines, to each aspect
a scale between 0 and 5 is assigned which is going to
be used to evaluate one of the modeling capabilities. As
in the statistics methods, the concepts in this paper are
qualitative variable with a nominal scale [10]. The
evaluation scale is obtained by first taking a list of the
capabilities of one method, and then a list of
capabilities from a second method, from a third, until
all selected methods are analyzed. The concepts
evaluation scales facilitate the comparison of different
modeling methods capabilities (see Tables 2, 3 and 4).
The order assigned to the scales is intuitive and
relatively arbitrary; however, it can be changed easily.

23
Then each one information method is evaluated for all
the aspects in each level of abstraction.
Table 2: Aspects and evaluation scales for the
organizational level of abstraction
Table 3: Aspects and evaluation scales for the integration
level of abstraction
The evaluation consists in assign a value to each
concept of the method. For example, the concept non
functional requirement at the web level; if the method
has the non functional requirement concept; the method
should have 1 point. If the method in the non functional
requirement concept says who proposes it and to what
is applied, the method should have 2. If the method has
the concept of non functional requirement, who
proposes it and to what is applied, and also, the kind of
requirement, the method should have 3 points. If the
method has the concept of non functional requirement,
who proposes it and to what is applied, the type of the
requirement, and also, the measure to verify
compliance; the method should have 4 points. The
method should have 5 points if it has the concept of
non functional requirement, who proposes it, to what is
applied, the type of the requirement, the measure to
verify compliance and what happens if it is not
fulfilled.
Table 4: Aspects and evaluation scales for the Web level
of abstraction
3.1. Evaluation methods
The evaluators have to evaluate the three levels of
abstraction for all concepts. For each modeling method
and for each aspect ai, a corresponding evaluation ei is
obtained. The results are displayed in a table for easy
comparison and a total score is obtained for each
method and for each level of abstraction as Σei. A
method that scores better than other, possibly has more
capabilities to model requirements at the corresponding
level of abstraction than the first.
4. Results of the methods evaluations
As an exercise, the following methods i*, Tropos,
EKD, BPM-UML, OO-Method/OOWS, OOWS [5, 7,
4, 8, 9, 11, and 12] were evaluated using the scales
presented (tables 5, 6 and 7). The methods evaluated at
each level are not the same since some methods do not
offer the modeling concepts for the level where they
are not shown.
Table 5: Organizational level evaluation of the methods
Organizational
level
Max.
Value
I* Tropos EKD BPM-
UML
Actor 5 5 5 5 5
Resource 5 5 5 2 5
Goal 5 1 3 4 3
Task 5 2 4 3 2
Activity 5 0 2 0 4
Business rule 5 2 0 5 4
Quality 5 3 4 4 4
Total 35 18 23 23 27
Scale
Concept
1 2 3 4 5
Actor Actor --- Role Type Responsibility
Resource Resource Type Actor using it
--- Actor supplying it
Goal Goal Priority Problem Opportunity
Verification
Task Task Who requests
Who executes
Hierarchy Associated Goal.
Activity Activity Tasks supported
Hierarchy How is activated
When is concluded
Business rule Business rule
Associated concept
Origin Type Hierarchy
Quality Quality Associated concept
--- Origin Measure
Scale
Concept
1 2 3 4 5
Actor Actor --- Role Type Responsibility
Artifact Artifact Actor or function supplying
--- Actor or function requiring
Artifact state
Goal Goal Who establish it, Associated to a function
Assigned priority
Measure, Failure cause
Opportunity to solve a problem
Function Function Who starts it
Who uses it Hierarchy The product
Event Event Who fires it, What is the start state,
What is produced, Hierarchy
Who receives the product, Owner function
Final state
Constraint Constraint Type Who defines it
To who or what applies
Who or what enforces it
Non functional requirement
Constraint Who proposes it, To what is applied.
Type of requirement.
Measure to verify compliance.
What happens if not fulfilled.
Scale
Concept
1 2 3 4 5
Navigation page - Relationship
Navigation page
Nav. page - Relationship
User Profile Navigation help
Access constraints
User profile (Role)
User profile Role Role changes allowed
Services per user
Business process state
Class (object)
Class (object)
Attributes Relationships Methods Type of relationships
Artifact Artifact --- Type Supplier User
Goal Who defines it
Associated service,
Priority Measure Failure cause, Opportunity to solve it
Service Related events
Hierarchy, Requesting User
Executing agent, Result.
Result final user
Owner page
Event Event Service owner, Hierarchy,
Implementing class
Who requests
Shared or not
Pre and post condition
Post condition
Pre condition
--- --- Associated event
Non functional requirement
Non functional requirement
Who proposes it, To what is applied.
Type of requirement.
Measure to verify compliance.
What happens if not fulfilled.

24
Table 6: Integration level evaluation of the methods
Integration
level
Max.
Value
I* Tropos EKD BPM-
UML
OO-
Method
Actor 5 5 5 5 5 1
Artifact 5 5 5 4 5 4
Goal 5 1 3 4 3 1
Function 5 2 2 5 5 2
Event 5 0 1 0 4 3
Constrain 5 2 0 5 4 5
No functional 5 3 4 4 4 0
Total 35 17 20 27 30 16
Table 7 (a): Web level evaluation of the methods (business
process)
Nivel web Max.
Value
Tropos OO-Method /
OOWS
OOWS
User profile 5 3 4 4
Class 5 0 5 5
Artifact 5 4 4 4
Service 5 3 3 3
Event 5 1 3 2
Precondition and
post condition
5 2 5 3
No functional 5 3 0 0
Total 35 16 24 21
Table 7 (b): Web level evaluation of the methods (pure
navigation)
Nivel web Max.
Value
Tropos OO-Method /
OOWS
OOWS
Navegational page –
relationship
5 1 5 5
User profile 5 3 4 4
Goal 5 3 0 0
Artifact 5 4 4 4
Service 5 3 3 3
Total 25 14 16 16
At organizational level, BPM-UML obtains good
scores for this level of abstraction, and i* has the
lowest score. The methods were evaluated with respect
to the parameters defined for the approach presented
here. During the evaluation of methods, their own
characteristics are shown, for example, the quality
aspects of a business process are modeled as qualitative
goals using BPM-UML. At integration level, the result
shows the capacities of each method, for example,
BPM-UML obtains good scores for this level, but OO-
Method has the lowest score.
5. Conclusions
There are many proposals to model the
organizational, integration and web requirements and
each one has its own elements. Some use the same
concepts but the names are different, which makes it
complex and laborious to compare the methods. The
approach presented here unifies the various
terminologies, increases the knowledge about modeling
concepts, and proposes an evaluation approach for the
methods modeling capabilities and techniques. This
helps to select the method that is more appropriate to
the needs of a problem domain. The approach has been
used to evaluate e-learning systems [13]. Additionally,
it has been applied in the development of various case
of studies to evaluate virtual reality methods and to
clearly appreciate the concepts that the methods allow
to model.
6. References [1] James Pasley,: “How BPEKL and SOA are changing web
services development”, IEEE Internet Computing. May –
June 2005.
[2] Peter F. Green, Michael Rosemann y Marta Indulska,:
“Ontological Evaluation of Enterprise systems
Interoperability Using ebXML”, IEEE Transactions on
Knowledge and Data Engineering, Vol 17, No. 5, IEEE
Computer Society, may 2005.
[3] Mersevy T. and Fenstermacher K.,: “Transforming
software development: and MDA road map”, IEEE
Computer Society, September 2005.
[4] H. E. Eriksson and M. Penker, Bussiness process
modeling with UML, Chichester, UK, Wiley Editorial, 2000.
[5] E. Yu,: Modelling Strategic Relation for Process
Reengineering, Universidad de Toronto, Canada, 1995.
Thesis submitted for the degree of Doctor of Philosophy.
[6] A. Ginige and S. Murugesan,: “Web Engineering: An
Introduction” IEEE Multimedia, pp 1-5, Jan-Mar 2001.
[7] Peter F. Green, Michael Rosemann y Marta Indulska,
“Ontological Evaluation of Enterprise systems
Interoperability Using ebXML”, IEEE Transactions on
Knowledge and Data Engineering, Vol 17, No. 5, IEEE
Computer Society, may 2005.
[8] Olsina, Luis A., Metodología cuantitativa para la
evaluación y comparación de la calidad de sitios web. Tesis
doctoral. Facultad de Ciencias Exactas, Universidad
Nacional de La Plata, noviembre de 1999.
[9] Devanshu Dhyani, Wee Keong Ng, and Sourav S.
Bhowmick,: A survey of web metrics, ACM computer
survey, Vol 34, No. 4. December 2002, pp. 469-503.
[10] William L. Carloson and Betty Thorne, Applied
Statistical Methods for business, Economics, and the Social
Sciences. Prentice Hall, 1997.
[11] Bubenko J., Brash D. y Stirna J.: EKD User Guide,
Royal Institute of technology (KTH) and Stockholm
University, Stockholm, Sweden, Dept. of Computer and
Systems Sciences, 1998.
[12] E. Insfrán, O.Pastor and R. Wieringa: “Requirements
Engineering-Based conceptual Modelling”, Requirements
Engineering Springer-Verlang, vol. 2, pp. 7:61-72, 2002. [13] Eduardo Islas P., Eric Zabre B. y Miguel Pérez R.: “Evaluación
de herramientas de software y hardware para el desarrollo de
aplicaciones de realidad virtual”,
http://www.iie.org.mx/boletin022004/tenden2.pdf (2005).


27
Image Segmentation Script Language
Francisco Cervantes Álvarez, Raúl Pinto Elías Centro Nacional de Investigación y Desarrollo Tecnológico (cenidet)
Interior Internado Palmira s/n, Cuernavaca, Morelos, México.
{cervantes04c, rpinto}@cenidet.edu.mx
Abstract
In this article we propose the use of a script
language to the image segmentation stage in artificial
vision. Here the proposed language, the system
architecture to interpret scripts and the general
structure of the programs that integrate the operator
library are describing. Finally, some tests and results
of the use of proposed script language are shown.
1. Introduction In this paper we propose the use of a script language
for image segmentation. Nowadays, the use of script languages in the graphic programming is increasing, because these allow testing the ideas on an easy way [1]. Also, script languages easily allow the code reuse [2]. However, in the artificial vision area few works focused on digital image processing by script languages exist, an example is shown in [3], where the user make a script with graphic objects, then they execute the script to process a given image. An example of a commercial script language is MATLAB [4]. The proposed script language, allow proving ideas
of image segmentation on an easy way and the user do not need to know how the segmentation algorithms makes the process. Also, the language allows the code reuse by the operator library (the operators are independent to each other) and the implementation of a script interpreter. The library above mentioned allows that the language can grow of a modular way and without need to modify the existent code. This paper is structured of the following way. In the
second section the basic elements of the proposed script language are described. The third section shows the basic structure that should have the library operators. In the fourth section the general scheme of the script language interpreter is described. Finally, in the fifth section some tests and results are shown.
Lastly the conclusions are shown and some future works are commented.
2. Basic elements of script language The language is composed of the definition of the
following data types: Entero, Real, Cadena,
ImagenGris, Mascara and Contorno. Also the basic arithmetic operations are defined (addition, subtraction, multiplication and division). The language have the following basic structures:
• Declaration. • Assignment. • Operator Call.
The corresponding syntax to above structures are the following. Declaration:
data_type (variable_name) (, variable_name)*
Assignment: variable_name = variable_nameX
variable_name = arithmetic_expression
variable_name = operator_name (arguments)
Operator Call:
operator_name (arguments)
The syntax above mentioned provides a general
structure, now all depends on the registered operators in the operator library. This structure is named language core. The script language interpreter is very important because it let recognizes new operators. This way of language definition, where only the structures are established but the elements language are not defined, give the advantage of adding new elements or commands in a dynamic way, without modifying the core code. However, each operator is independent to each other. The single restriction to add an operator to the library is following a basic structure specification. This restriction must be followed in order to let the core and the operators interact.

28
3. Operator basic structure An operator can be used as a part of the library, if
the operator has a general structure like the structure shown in figure 1; it can be used as a part of the library.
Core l ibraries for data type manager
(numbers, strings, images and
templates).
Request of arguments (fi le paths
where are the content of the
parameters).
Operator body (PDI algorithm).
Return the result (the resul t is save in
the last argument by a file).
Figure 1 Operator general structure
In the figure 1, the structure that should have the
operators is shown. Some structure elements can be ignored, for example, in the header only those only those required core libraries must be included. An operator can return a value, but this condition is not absolutely necessary, for example, the operator for showing an image only displays the image in the screen and it does not need returning anything to the core. By default is necessary that the operators receive at least one argument. In order to interact the core and operators must be
used the defined data types which are in the core. Also, the parameters that an operator need for its execution have to be received by the file path specification. In these files is the content of the operator parameters. Finally, also, is necessary to save the output data in a file which is specified by the last parameter that is received by one operator. Below, an example of an operator to extract the negative of an image is shown. #include "CImagGris.h" AnsiString CharToAnsiString(char *arreglo); int main(int argc, char* argv[]) { if ( argc < 3 ) exit ( ERR_NUM_PARAM ) ; char * a_entrada = argv [ 1 ]; char * a_salida = argv [ 2 ]; AnsiString entrada,salida;
CImagGris Imagen; entrada=CharToAnsiString(a_entrada);
salida=CharToAnsiString(a_salida); if(Imagen.leerArchivo(entrada)==false) exit(ERR_IMAG_EN); int x,y,h,w; Byte pixel; h=Imagen.Alto(); w=Imagen.Ancho(); for(x=0;x<w;x++) {for(y=0;y<h;y++) { pixel=Imagen.getPixel(x,y); Imagen.setPixel(x,y,255-pixel); } } if(Imagen.escribirArchivo(salida)==false) exit(ERR_NO_MEMO); exit ( BIEN ) ; }
Right now the interpreter core can only support
images in BMP format of 24 bits.
4. General scheme of script interpreter The general structure has been shown. Now, the
general scheme of the script interpreter is presented. In the figure 2, each component of the interpreter and the relationship between operators are shown.
Figure 2 Script interpreter general scheme
By this structure the system first explore the operator library to generate the structure of each operator (syntax, semantic), later it analyze the input script and execute the operators.
5. Test and results Several tests have been done to show the advantages
that provide the script language use on image segmentation. For example, the user can to use this language without a direct interaction with the algorithms. The first test consists of showing how to make a
new operator that convert an image to binary image. To
Operador library
Interpreter
Process module
Memory module
Data types
Interpreter core
Script
Result

29
create an operator is necessary to have a Builder C++ compiler. In the figure 3 the operator code is shown.
Figure 3 Operator to convert an image to binary image.
Can be saw in the above figure that making a new
operator is very easy, only is necessary to follow the general structure that has been specified. Now, only the user has to generate the executable file by the compilation of the source code. In this moment the new operator has been created and must be registered in the library. The second test consists of registering the new operator. For this the Métodos option of Herramientas menu is used. In the figure 4 the menu is shown.
Figure 4 Script interpreter interface
When the user click in this menu the registration
screen is displayed, here the new operator have to be registered, this is shown in the figure 5. Now, the user has to indicate the executable file path and to assign an alias. The alias is used by interpreter language, later the input and output parameters of the operator are specified.
Figure 5 Screen to operator register
Once the operator is registered; this one can be used as a part of the language, in the figure 6 show the above mentioned process. Here, a script to convert images to binary images is made, and also show the initial and final image.
With these tests the advantages of the script
language are shown. By the capability of registering new operators provide an open language to increase based on the needs of the user. Nowadays the language has 25 segmentation operators and 5 image description operators. In the test 3 is shown how the operators BinarizarImagen and VerImagenGris interact one to the other. These operators can be saved to be later reused. Finally the manager of the library is simple because the interface provides screens to modify, remove and to add operators to the library.
6. Conclusions With this paper we can conclude that the use of
script language to image segmentation is practical. In this work we can saw that the segmentation algorithm functionality can be absent-minded by using scripts, then the user do not need to know the algorithms. Finally, we can say that the script languages might be used in others stages of the artificial vision. The operator library used by the interpreter is built
for growing in a modular way. The library grows with each operator that is registered.
#include "CBMP24.h" #include "CNumero.h" int main(int argc, char* argv[]) { if ( argc < 4 ) exit ( ERR_NUM_PARAM ) ; char * a_imag = argv [ 1 ]; char * a_umbral = argv [ 2 ];
char * a_salida = argv [ 3 ]; int valorUmbral; AnsiString imag,umbral,salida; CIMAGEN_BMP24 Imagen; CNumeroMemoria UmbralBinario; imag=CharToAnsiString(a_imag); umbral=CharToAnsiString(a_umbral); salida=CharToAnsiString(a_salida); if(Imagen.leerArchivo(imag,GRIS)==false) exit(ERR_IMG_EN);
if(UmbralBinario.leerArchivo(umbral)==false) exit(ERR_UMB_EN); valorUmbral=(int)UmbralBinario.Valor(); int x,y,h,w; Byte pixel; h=Imagen.Alto(); w=Imagen.Ancho(); for(x=0;x<w;x++) { for(y=0;y<h;y++) { pixel=Imagen.getPixelGrey(x,y);
if(pixel>=(Byte)valorUmbral) Imagen.setPixelGrey(x,y,255); else Imagen.setPixelGrey(x,y,0);
} } if(Imagen.escribirArchivo(salida)==false) exit(ERR_NO_MEMO); exit ( BIEN ) ; }
Figure 6 Script to convert an image to binary image

30
7. References [1] M. Villar, “Guía de lenguajes de script para prototipazo rápido”, http://www.codepixel.com/tutoriales/prototipado/, 2006. [2] K. Muehler, “Adaptive script based animations for medical education and intervention planning”, Department of Simulation and Graphics, University of Magdeburg, Germany. [3] “Sistema interactivo para la enseñanza de la visión artificial”, Depto. de Sistemas Inteligentes Aplicados, Escuela Universitaria de Informática, Universidad Politécnica de Madrid, 2006. [4] “MathLab”, http://www.mathworks.com/, 2006.
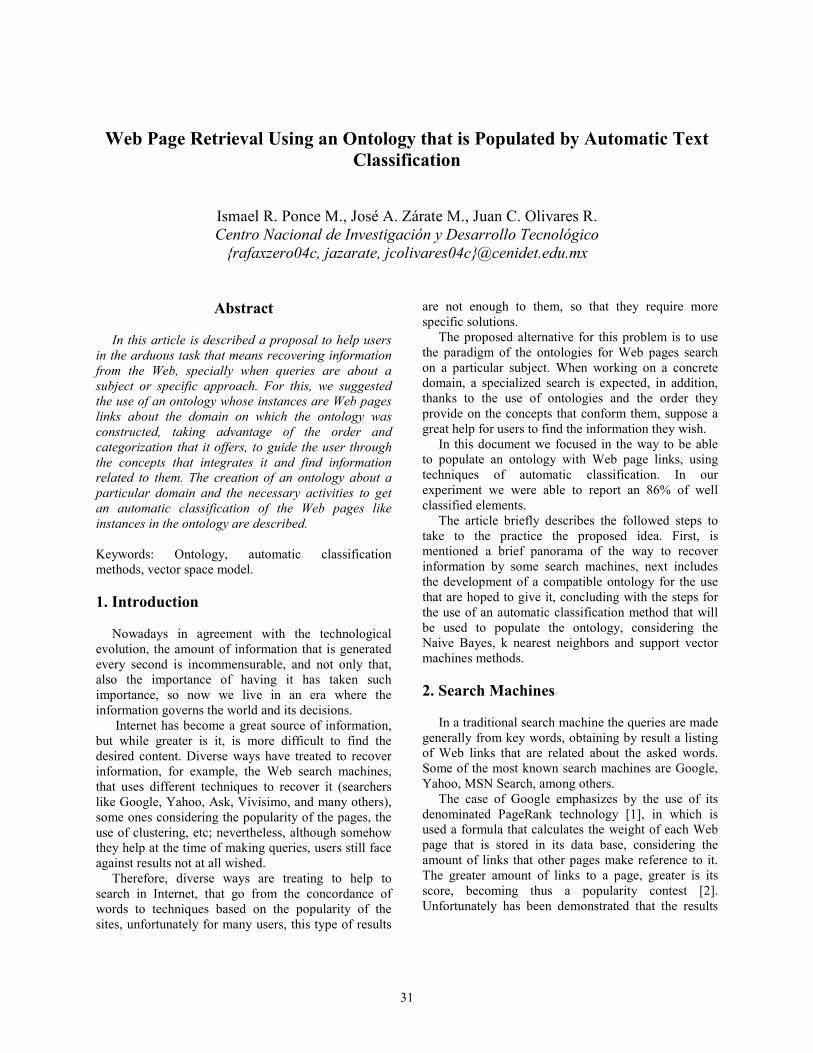
31
Web Page Retrieval Using an Ontology that is Populated by Automatic Text
Classification
Ismael R. Ponce M., José A. Zárate M., Juan C. Olivares R.
Centro Nacional de Investigación y Desarrollo Tecnológico
{rafaxzero04c, jazarate, jcolivares04c}@cenidet.edu.mx
Abstract
In this article is described a proposal to help users
in the arduous task that means recovering information
from the Web, specially when queries are about a
subject or specific approach. For this, we suggested
the use of an ontology whose instances are Web pages
links about the domain on which the ontology was
constructed, taking advantage of the order and
categorization that it offers, to guide the user through
the concepts that integrates it and find information
related to them. The creation of an ontology about a
particular domain and the necessary activities to get
an automatic classification of the Web pages like
instances in the ontology are described.
Keywords: Ontology, automatic classification
methods, vector space model.
1. Introduction
Nowadays in agreement with the technological
evolution, the amount of information that is generated
every second is incommensurable, and not only that,
also the importance of having it has taken such
importance, so now we live in an era where the
information governs the world and its decisions.
Internet has become a great source of information,
but while greater is it, is more difficult to find the
desired content. Diverse ways have treated to recover
information, for example, the Web search machines,
that uses different techniques to recover it (searchers
like Google, Yahoo, Ask, Vivisimo, and many others),
some ones considering the popularity of the pages, the
use of clustering, etc; nevertheless, although somehow
they help at the time of making queries, users still face
against results not at all wished.
Therefore, diverse ways are treating to help to
search in Internet, that go from the concordance of
words to techniques based on the popularity of the
sites, unfortunately for many users, this type of results
are not enough to them, so that they require more
specific solutions.
The proposed alternative for this problem is to use
the paradigm of the ontologies for Web pages search
on a particular subject. When working on a concrete
domain, a specialized search is expected, in addition,
thanks to the use of ontologies and the order they
provide on the concepts that conform them, suppose a
great help for users to find the information they wish.
In this document we focused in the way to be able
to populate an ontology with Web page links, using
techniques of automatic classification. In our
experiment we were able to report an 86% of well
classified elements.
The article briefly describes the followed steps to
take to the practice the proposed idea. First, is
mentioned a brief panorama of the way to recover
information by some search machines, next includes
the development of a compatible ontology for the use
that are hoped to give it, concluding with the steps for
the use of an automatic classification method that will
be used to populate the ontology, considering the
Naive Bayes, k nearest neighbors and support vector
machines methods.
2. Search Machines
In a traditional search machine the queries are made
generally from key words, obtaining by result a listing
of Web links that are related about the asked words.
Some of the most known search machines are Google,
Yahoo, MSN Search, among others.
The case of Google emphasizes by the use of its
denominated PageRank technology [1], in which is
used a formula that calculates the weight of each Web
page that is stored in its data base, considering the
amount of links that other pages make reference to it.
The greater amount of links to a page, greater is its
score, becoming thus a popularity contest [2].
Unfortunately has been demonstrated that the results
32
can be manipulated by the well-known Google
bombing [3].
Another way to recover information is through Web
directories, which consist of a manual organization and
classification of Web pages, by subjects or categories.
One of the most representative directories is the Open
Directory Project [4], in which a set of voluntary
publishers are the ones who are in charge to list the
Web links inside an ontology, where the links are
grouped by similar subjects in categories. The
disadvantage that can be appreciated is that it requires
too much human intervention to be able to register the
links of the pages.
A special type of search machines are those that
incorporate clustering; the clustering consists of
partitioning a set of similar objects in subgroups,
where the elements that conforms each subgroup, share
common characteristics. This type of search machine
gives back the results that find for a query
accommodated in groups; examples of this are
Clusty.com and Vivisimo.com.
Finally, we found specialized search machines,
which are centered in recovering links of technical and
scientific documents. For example Citeseer, that is a
search machine of documents focused on the
computation, and that uses the bibliographical
references to consider the importance of the documents
that are queried.
Although these and other techniques have been
developed to recover information from the Web, this
area still has much to offer, reason why new
alternatives to help the user are continued looking for,
as is our case.
3. Phase of Ontology Development
Gruber [5] defines an ontology like the explicit
specification of a conceptualization, which means to
identify the concepts that integrate a domain and the
interrelations which exist among them, in a formal
representation, in a way it could be possible to share
and to reuse it.
The standard language established by the W3C to
make this type of formalizations is the OWL (Web
Ontology Language). The use of this standard in
addition to the advantages that allows its reusability by
others, is that to many tools related to the ontology
design and use, are become developed to support it,
like editors, reasoners, etc.
We developed an ontology, considering such points,
along following the proposed methodology by Uschold
and King [5]. The domain on which the ontology was
developed, was the natural language processing (NLP).
In order to develop it, we used the ontology publisher
Protégé 3.1.1, the Protégé-OWL 2.1 plug-in, along
with the OWL Wizards plug-in, in addition to the
FaCT++ 0.99.6 and RacerPro 1.9.0 reasoners, used to
verify the ontology consistency.
The classes are made up of concepts related to the
NLP area, including some ones like investigators,
schools, tools and application areas, mainly.
4. Supervised Learning for Automatic Text
Classification
Once developed the ontology, it continues the phase
to populate it with instances. Given the coarseness of
pages that exist in the Web, a manual classification of
these in the classes established in the ontology would
be an expensive task, and also this is already done in
great measure in the Web directories. Therefore a way
to be able to automate this process was looked for,
recurring to the supervised learning, in which by means
of statistical and mathematical techniques, an
automatic text classification can be done.
This approach is centered in having a document
training set, previously classified, that will be used to
learn to classify new documents. For it, is necessary to
transform the initial state of the documents to a
representation that can be used by a learning algorithm
for the classification.
For test aims we only worked with HTML pages.
Next are mentioned the necessary steps for make this
process. The used training collection consisted of 1624
documents, previously classified in 26 classes taken
from the developed ontology, in addition to a
denominated null class, in which are classified the non
wished documents for the ontology domain. The 26
considered classes are only a representative sample of
the existing classes in the ontology and were taken
only for test aims.
4.1. Document Preprocessing
All the elements (more precisely the words) that
appear in documents are not useful for their
classification, this is, there are words that by
themselves do not say anything about the document’s
content in which they are, and therefore, they can be
eliminated; among this elements are included the
punctuation marks and the HTML labels; also appear
words of very frequent use, words that appear in a
great amount of documents, which causes that their
discriminatory power is very low; these type of words
are known like stopwords, examples of them are the
articles, pronouns, prepositions, conjunctions, among
others.
33
In order to define the stopwords to eliminate, we
recurred to lists available in DOCUM [6], in SMART
[7] and in the Institut interfacultaire d'informatique of
the University of Neuchatel [8], as well as other words
identified during the process of tests.
Because being working on a specific domain,
certain control exists on the terms that belong to it,
reason why was suggested a matching between
different terms that refers about a same concept,
turning them into a single representation, in other
words, if for a concept is possible to be called in
different forms, we considered to unify them and
consider them under a unique form, inside the
classification process. For this, we follow like starting
point the concepts that integrate the ontology.
Finally, many words have the same lexical root; a
basic process of stemming based on Porter’s Algorithm
was followed [9], with which was looked for to reduce
words to their stem.
All the previously steps mentioned above, have like
aim to diminish the size of the training document
collection to make it more manageable, eliminating the
irrelevant parts to continue the automatic classification
process. In our exercise, in average we get to reduce
until a 70% the original size of document collection.
4.2. Vector Space Model
The vector space model (VSM) was proposed by
Salton in 1975 [11]. The basic idea behind this model
is to make a matrix that represents the documents and
the words contained in them, assigning a weight to
each word. Each vector that conforms the matrix
represents a document and the distribution of the words
that appears in it. It is a matrix of m x n, where m
represents documents and n represents the registered
words.
There exist different types of weighting for words in
the VSM; we considered in our tests boolean weighting
(weight of a word is 0 if it not appears in the document,
and 1 if it appears), weighed by frequency of
appearance (the weight of the term depends on the
amount of occurrences the word has in the document)
and finally tf-idf weighed (that is calculated
considering the average of the term frequency against
its inverse document frequency [11]).
4.3. Dimensionality Reduction in the VSM
All the words that integrate the training collection
cannot be considered in the VSM, since the dimension
that it would have would be enormous. Different
techniques to reduce the dimensionality exist, like the
documental frequency, which considers a minimum
value of appearances that must have each word within
the total of documents, to discriminate those words
whose appearance is very small and to leave those that
present a greater documentary frequency.
Another technique that was considered was the
information gain (IG), which calculates the difference
in the entropy of the system against the entropy of each
word. This difference, measured in bits, indicates how
relevant and with how many information contributes a
word in the whole collection, like determining factor to
carry out the classification.
The amount of total words that conforms the
training collection already processed is of 2552196
words, being between these only 125891 different
words. As it is possible to be appreciated, the amount
of different words is too huge to be handled in the
VSM, reason why only were considered those words
that passed a documental frequency with a greater or
equal value to 15, passing this a total of 8966 words,
which represents a 7.12% of the original total words;
nevertheless, it still is a very huge amount, reason why
the IG was applied on these words.
The calculated entropy of the total collection were
of 3.97; the considered words were whose who had an
IG equal or superior to 0.1, being in 527 different
words, a 0.42% of the original size. The words (already
stemmed and standardized) that greater IG presented,
were: nlp (0.552), natural_language (0.479),
knowledge (0.424) and data_min (0.335).
4.4. Automatic Classification Algorithms
Once obtained the VSM representation of the
training document collection, a method for automatic
classification can be applied to classify new elements.
The automatic classification methods we considered
were the Naive Bayes, k-nearest neighbors (kNN) and
support vector machines (SVM), thus to make a series
of tests to find the method that better results gives,
considering in addition the weightings mentioned in
section 4.2. WEKA was used to carry out the tests; the
results shown in Table 1 correspond with the use of the
10 fold cross validation, showing the percentage of
well classified elements.
Tabla 1. Percentage of well classified elements.
booleano tf tf-idf
NaiveBayes 62.7463 55.8498 81.2192
kNN 84.5443 85.0369 84.4212
SVM 86.2685 66.7488 82.0813
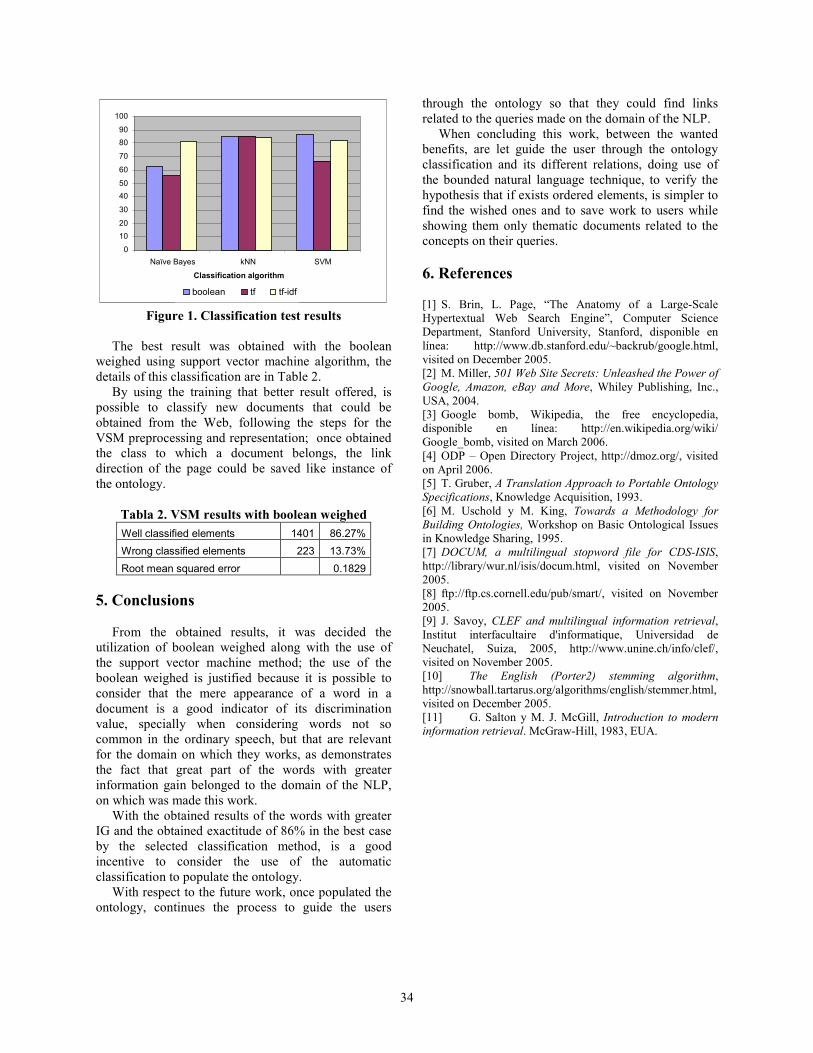
34
Figure 1. Classification test results
The best result was obtained with the boolean
weighed using support vector machine algorithm, the
details of this classification are in Table 2.
By using the training that better result offered, is
possible to classify new documents that could be
obtained from the Web, following the steps for the
VSM preprocessing and representation; once obtained
the class to which a document belongs, the link
direction of the page could be saved like instance of
the ontology.
Tabla 2. VSM results with boolean weighed
Well classified elements 1401 86.27%
Wrong classified elements 223 13.73%
Root mean squared error 0.1829
5. Conclusions
From the obtained results, it was decided the
utilization of boolean weighed along with the use of
the support vector machine method; the use of the
boolean weighed is justified because it is possible to
consider that the mere appearance of a word in a
document is a good indicator of its discrimination
value, specially when considering words not so
common in the ordinary speech, but that are relevant
for the domain on which they works, as demonstrates
the fact that great part of the words with greater
information gain belonged to the domain of the NLP,
on which was made this work.
With the obtained results of the words with greater
IG and the obtained exactitude of 86% in the best case
by the selected classification method, is a good
incentive to consider the use of the automatic
classification to populate the ontology.
With respect to the future work, once populated the
ontology, continues the process to guide the users
through the ontology so that they could find links
related to the queries made on the domain of the NLP.
When concluding this work, between the wanted
benefits, are let guide the user through the ontology
classification and its different relations, doing use of
the bounded natural language technique, to verify the
hypothesis that if exists ordered elements, is simpler to
find the wished ones and to save work to users while
showing them only thematic documents related to the
concepts on their queries.
6. References [1] S. Brin, L. Page, “The Anatomy of a Large-Scale Hypertextual Web Search Engine”, Computer Science
Department, Stanford University, Stanford, disponible en
línea: http://www.db.stanford.edu/~backrub/google.html,
visited on December 2005.
[2] M. Miller, 501 Web Site Secrets: Unleashed the Power of
Google, Amazon, eBay and More, Whiley Publishing, Inc.,
USA, 2004.
[3] Google bomb, Wikipedia, the free encyclopedia, disponible en línea: http://en.wikipedia.org/wiki/
Google_bomb, visited on March 2006.
[4] ODP – Open Directory Project, http://dmoz.org/, visited on April 2006.
[5] T. Gruber, A Translation Approach to Portable Ontology
Specifications, Knowledge Acquisition, 1993.
[6] M. Uschold y M. King, Towards a Methodology for
Building Ontologies, Workshop on Basic Ontological Issues
in Knowledge Sharing, 1995.
[7] DOCUM, a multilingual stopword file for CDS-ISIS,
http://library/wur.nl/isis/docum.html, visited on November
2005.
[8] ftp://ftp.cs.cornell.edu/pub/smart/, visited on November 2005.
[9] J. Savoy, CLEF and multilingual information retrieval,
Institut interfacultaire d'informatique, Universidad de
Neuchatel, Suiza, 2005, http://www.unine.ch/info/clef/,
visited on November 2005.
[10] The English (Porter2) stemming algorithm,
http://snowball.tartarus.org/algorithms/english/stemmer.html,
visited on December 2005.
[11] G. Salton y M. J. McGill, Introduction to modern
information retrieval. McGraw-Hill, 1983, EUA.
0 10 20 30 40 50 60 70 80 90 100
Naïve Bayes kNN SVM Classification algorithm
boolean tf tf-idf

35
Neuro-Symbolic Hybrid Systems
Vianey Guadalupe Cruz Sánchez, Gerardo Reyes Salgado, Osslan Osiris Vergara Villegas
Centro Nacional de Investigación y Desarrollo tecnológico (cenidet)
Interior Internado Palmira S/N, Col. Palmira. C.P. 62490.
Cuernavaca Morelos México.
{vianey,osslan}@cenidet.edu.mx
Resumen
Actually, the Hybrid Systems (HS) approach is very
used to solve problems where different knowledge
representations are involve in one system. This
integration has the advantage to compensate the
weakness of one or another system complementing
their strengths. The Neuro-Symbolic Hybrid Systems
(NSHS) arise of the HS as an approach that offer the
possibility to implement robust systems where the
connectionist and symbolic nature are present in their
environment. The reason of the NSHS study is to
implement them in the artificial vision system process,
such that we can propose different strategies of
solution among different representations type involve
in this process, for that the Hybrid Systems
development cycle and the NSHS classification criteria
have a very important role in the definition of these
strategy.
1. Introduction
In last decade, it was very common working with
only one knowledge representation type. Even, there
had been one competition to demonstrate the
representation used was better than other that solved
the same problem. However, with the past of time the
researchers observed the weakness of each
representation and the complementary properties that
existed among those, the scientific community decided
to prove their capacities integrate them in one system
(Hybrid), in this integration better results were obtained
than the results obtained using an individual way.
The hybrid approach is inspired in the natural
mechanism, where: according to [1], we are
processing’s machine of hybrid information, our
actions are government by means of the combination of
the genetic information and the information acquired
by means of the learning. Due to this combination we
have the possibility of use different processing’s
method in complex and changing environments
successfully.
Under this natural scheme, the hybrid systems have
arisen as a new way to give solution to complex
problems where are necessary several knowledge
representations to use the information coming of the
environment, this environment determine the strategy’s
that should be used to increment the knowledge and
develop systems more robust [2].
However, the design and development of these
systems is difficult due to the big number of pieces or
components that are involve and the different
interactions among them [3].
The tendency is the study and construction of
hybrid systems whose strategy of solution may be the
best to solve the problem. In this paper we present a
study of the process that involve the desing and
development of a hybrid system as well as the criteria
for the clasification of one particular type of hybrid
system (HS) the Neuro-Symbolic Hybrid System
(NSHS), this has been used in applications such as: the
object recognition.
2. Design and development of a hybrid
system
In [1] propose Hybrid Systems development cycle,
in which present the process for the construction of this
system. The importance of this model are the bases on
which one NSHS may support its design.
2.1 Hybrid System development cycle
A structured approach like [1] can reduce the
development time and cost of a HS. The stages for the
construction of inteligent hybrid systems are: problem
analysis, matching, selection of the hybrid category,

36
implementation, validation and maintenance (see figure
1).
Figure 1. Hybrid system development cycle.
a) Problem analysis.
This stage involves the following steps:
1. Identify any sub-task existent in the problem.
Identificar cualquier sub-tarea existente en el problema.
2. Identify the properties of the problem. If the
problem has sub-task, this involve identify properties
of them.
b) Matching property.
Involve the matching among the properties of the
available techniques with the requirements of the
identified task.
c) Hybrid category selection.
In this phase we select the hybrid system type
required to solve the problem. This phase use the
results of the previous stages of problems analysis and
the matching property.
d) Implementation.
In this stage the developer will be in the position of
select the programming’s tool and the environment
necesary to implement the hybrid system.
e) Validation.
This phase is used to prove and verify the
performance of the individual components of the
application and the whole hybrid system.
f) Maintenance.
The performance of the hybrid system should be
periodically valued and refine it as it is necesary. The
maintenance is very important for adaptatives systems,
(i. e, neural networks).
3. Neuro Symbolic Hybrid Systems
The NSHS are systems formed by two or more types
of knowledge representations, one in connectionist way
and other in symbolic way. Both representations have
one group of qualities, these integrated in one system is
extremely powerful to solve complex problems.
Artificial neural networks are a type of connectionist
knowledge representation inspired in the functionality
of the biological neuron. This representation type has
been used for its learning capability and generalization
of knowledge, it being one very powerful tool to solve
complex problems of pattern recognition.
For other hand, one symbolic representation in
format of logical rules is based in the capability that the
human has to express the knowledge in natural way.
The last thing is very powerful to insert the knowledge
of a human expert to one system, as well as explain the
problem. This representation type has been used widely
in areas such as: pattern recognition, natural language
processing, robotics, computer vision and expert
systems.
Both types of knowledge representations are
combined in one system to suppress the disadvantages
of one or another representation and take advantage of
their integration.
The integration of the NSHS and its future
application in the design of an artificial vision process,
is very important know the criteria used for the NSHS’s
classification, due to this classification is obtained a
wide view of the different behaviours that may has one
NSHS.

37
4. NSHS Classification
In order to classify the NSHS are considered many
criteria [4]. Next, we explain shortly each one.
Tabla 1. Criteria to classify NSHS.
a) Integration type
Neuro-symbolic integration can be classified in
mainly three groups, according to the “hybridation
type” of the approach used.
• Unified approach. Attempt integrate the symbolic
systems properties into connectionist systems and vice
versa.
•Semi hybrid approach. This approach is used to
achieve translations. For example, the compilation of a
rules base in a net (knowledge insertion) and the
explicitation of rules starting from a net (knowledge
extraction).
•Hybrid approach. In this approach type may exist
many symbolic and connectionist modules integrated to
each other.
b) Couple grade
Define the interaction force between two modules.
The classification of different grades is carry out
through a progressive level that go since a extreme to
another. This classification consists of three levels:
• Weak couple. In this architecture type, the
different modules are connected by a simple relation of
input/output, and the communications are
unidirectional.
• Medium couple. In this category, the interactions
among modules are more flexibles, due those are
bidirectional; It doesn’t treat simply of input/output
relationship but rather each one the modules can
influence on the operation of the another.
• Strong couple. In these systems the knowledge
and data are not only transferred, also are shared
among modules through internal structures in common.
c) Integration mode
Represent the reason why the neural module and
symbolic module are configured in relation of one to
other and the full system.
•Chain. Two modules operate in sequence. One is
the main processor and it is assisted by another module,
acting like pre or post processor. The relationship
among modules is input/output.
•Sub-treatment. In this integration mode, one
module is subordinate of another to achieve some
function. The main module decides in what moment
call it and how use its output.
•Meta-treatment. One module solves the problem
and the other play a meta-level role such as carry the
control or improving results.
•Co-treatment. Both modules are the same in the
problem solution process. For example: one module
solves one specific problem and other module solves
the rest of the problem.
d) Knowledges tranference
The knowledge’s transference may be classified
according to the direction of the interchange.
•From symbolic to connectionist. The symbolic
knowledge is transferred since one symbolic module
and it is integrated to one connectionist module(S
→C).
• From connectionist to symbolic. The knowledge
acquired by learning in connectionist net may be
explained in symbolic rules way (S→C).
•Bilateral transfer. The knowledge can be
transferred in both senses: symbolic and connectionist
(S↔C). Usually include compilation mechanism and
rules extraction starting from the nets.

38
5. Applications
One of the applications of NSHS is in the artificial
vision systems, which to solve task of objects
recognition has used mainly two knowledge
representation types: one quantitative (numerical) and
another qualitative (symbolic) [5]. Previously these
approaches had used in independent way, however, due
to the knowledge’s attributes the NSHS has been
implemented mainly into the stage of recognition.
Some problems in pattern recognition solved with
the implementation of the NSHS are: the geographical
zones recognition [6], the medical images analysis [6]
and quality control problems [7].
The capabilities of the ANN’s to learn through
examples and generalize the knowledge, have been
used in conjunction with the symbolic rules, that allow
insert the knowledge of the human expert into system
and/or explain the knowledge in a natural way
obtained since the numeric approach. Thanks to this
conjunction numeric/symbolic, the pattern recognition
tasks have been solved with more robust systems.
Nevertheless, the studies achieves until the moment
of the NSHS, open the doors toward others path, in
which not only we can implement the NSHS in the
pattern recognition stage, but rather we can explore
the knowledge base of the artificial vision system, to
implement this approach in all and each stages of its
process.
6. Conclusions
The NSHS approach has raised like a necessity to
integrate two or more knowledge representation types
of symbolic and/or connectionist nature.
This synergy between one symbolic representation
and one connectionist representation has allowed
exploit the advantages that each approach gives one
with respect to another to develop robust systems.
The interest of the NSHS study is to propose the
implementation of this approach in object recognition
tasks in all and each one of the artificial vision systems
stages. For this, is necessary select the knowledge
representation type appropriate to the problem, as well
as, define the integration strategies between the
symbolic/connectionist systems.
7. References [1] Goonatilake S., Intelligent Hybrid Systems, Univertity
College London, UK, 1995.
[2] Floriana E., Donato M., “Machine Learning in computer
vision”, Universita di Informática, Bari, Italy, 2001.
[3] Zhang Z., Zhan C., “Agent-Based Hybrid Intelligent
Systems”, 2004.
[4] Towell G., “Symbolic knowledge and neural networks:
insertion, refinement and extraction”, Ph.D. Thesis,
University of Wisconsin-Madison - Computer. Science Dept,
1991.
[5] Peccardi M., Cucchiara R., “Exploiting Symbolic
Learning in Visual Inspection”, Dipartimento di Ingegneria,
University of Ferrara. Ferrara, Italy, 1997.
[6] Roli F., “A Hybrid System for Two-Dimensional Image
Recognition”. Depatment of Electrical and Electronic
engineering, University of Cagliari, Italy, 1996.
[7] Cruz Sánchez Vianey Gpe., Sistema híbrido neuro-
simbólico para refinar el conocimiento en un SVA, Tesis de
maestría, Cenidet, 2004.


41
Methodology for the generation of 3D models
Salvador Cervantes Álvarez, Raúl Pinto Elías Centro Nacional de Investigación y Desarrollo Tecnológico
{scervantes04c, rpinto}@cenidet.edu.mx
Abstract
The three-dimensional models allow to analyze and to interpret information of objects that would be difficult to observe through two-dimensional images. In this work a methodology for the reconstruction and visualization of 3D models is proposed, which are generated from 2D images. The segmentation process is performed using “snakes” with gradient vector flow (GVF), and the acquisition of the 3D model is carried out with an interpolation method (triangular meshes) or surfaces approach (Bezier, B-Splines, NURBS, etc.).
1. Introduction The 3D reconstruction of objects from a set of 2D images has increased their use in the medical and industrial applications. In the case of the medicine area one of these applications is in the analysis and biomedical image processing obtained by different images acquisition teams; according to the utilized means for the acquisition of images, the images can be classified in: ultrasound images, tomography, magnetic resonance, etc. To leave of the analysis and processing of the biomedical images a virtual reconstruction of body parts can be generated, this reconstruction is useful to improve the diagnoses and to help in the realization of preoperative planning.
One of the main problems in the digital image analisys and processing is the segmentation process, which consists on the extraction of the contours of the present objects in an image where the complication of this process is the fact that the segmentation approaches vary of a problem to other, due to the nature of the problem. In the case of the reconstructions 3D from biomedical images 2D, the image analysis and processing gets complicated because one doesn't have to analyze a single image, but rather it is required to analyze a group of images.
In the initial stages of this work a methodology was designed for the generation 3D models from a group of 2D images, to each one of the images a segmentation process is applied with “snakes” of GVF to obtain the contours of the objects, later an interpolation or approach among the points of the contours obtained in adjacent images to generate the three-dimensional pattern will be carried out and lastly the pattern will be stored in a file for his manipulation and visualization in an environment of virtual reality.
2. Proposed methodology In this section the methods considered are described. These methods are used for the reconstruction of the 3D pattern from a group of images 2D. The set of supporting images to verify that the methodology correctly works is the tomography image databases that they are shown in the figure (1a) and it figures (1b).
Figure 1. (a) TC of the cadaver head. (b) TC of the Stanford Rabbit terracotta. Next each one of the steps of the methodology proposed for the obtaining of the 3D pattern are described. 2.1. Pre-processing A Gaussian filter or a medium filter is applied to each one of the images to reduce the noise that can exist in them trying not to affect the information of the borders.
(a) (b)

42
2.2. Segmentation The segmentation is the process for which is extracted of the image certain underlying information as borders or regions. The method of those is used is the “snakes” with GVF for finding the contours of the objects in the images.
Next the parametric “snakes” are explained for later explain the “snakes” with GVF. 2.2.1. Parametric “snakes” [3, 7]. They consist on assigning a functional energy to each possible contour; so that the detected contour it corresponds to the functional minimum. By a contour c = c(s) the functional energy consists of the sum of the following three terms: Where the integral is taken along the contour c. Econt and Ecurv represent the internal energy of the “snake” where Econt establishes the continuity among the checkpoints of the “snake” and it is the first derived, while Ecurv establishes the bend and it is the second derived. Eimg represents the external energy that attracts the checkpoints of the “snake” toward the nearest contour, this energy is negative and it is determined calculating the gradient or map of border of the image, in this work it is calculated using the Sobel operator. The parameters α, β and γ determine the influence of the corresponding energy terms, and they can vary along c.
The parametric “snakes” present the following problems:
• The checkpoints of the “snake” are settled
down manually and if these are placed far from the borders they don't converge toward the local minimum.
• The “snake” doesn't converge toward the
concave parts of the contours.
The use of the GVF solves both problems since the checkpoints can settle down far from the contour of the object and they will converge toward the local minimum and toward the concave parts of the contours.
2.2.2. “Snakes” with GVF [2]. To use the GVF, the “snake” that minimizes the energy it should satisfy the Euler equation which one can see like a balance equation: x//(s) represents the second derived and x////(s) represents the fourth derived. To solve (2) x is treated as function of time as well as of s.
-Eimg is replaced for the GVF represented by v[x, y]
Where v(x, y) can be defined as [u(x, y), v(x, y)] that minimizes the functional energy
The parameter µ is placed according to the quantity of noise that exists in the image; while more noise µ increases. The GVF can be opposing solving the following equations of Euler
Where ∇2 represent the Laplacian operator. The equations 6a and 6b can be resolved trying u and v like functions of time and solving
They can be rewritten in the following way:
Where
E = ∫ (α(s)Econt + β(s)Ecurv + γ(s)Eimag)ds (1)
αx//(s) - βx////(s) - Eimag = 0 (2)
xt(s,t) = αx//(s,t) - βx////(s,t) - Eimag (3)
xt(s,t) = αx//(s,t) - βx////(s,t) + v (4)
E = ∫∫µ(ux2 + uy
2 + vx2 + vy
2)+|∇f|2|v-∇f|2dxdy (5)
µ∇2u – (u - fx)(fx2 + fy
2) = 0 (6a)
µ∇2u – (u - fx)(fx2 + fy
2) = 0 (6b)
ut(x,y,t) = µ∇2u(x,y,t) – [(u(x,y,t) - fx(x,y))][(fx(x,y)2 + fy(x,y)2)] = 0 (7a)
vt(x,y,t) = µ∇2u(x,y,t) – [(u(x,y,t) - fy(x,y))][(fx(x,y)2 + fy(x,y)2)] = 0 (7b)
ut(x,y,t) = µ∇2u(x,y,t) – b(x,y)u(x,y,t) + c1(x,y) (8a) vt(x,y,t) = µ∇2v(x,y,t) – b(x,y)v(x,y,t) + c2(x,y) (8a)
b(x,y) = fx(x,y)2 + fy(x,y)
2
c1(x,y) = b(x,y)fx(x,y)

43
fx and fy can be calculated using any gradient
operator. For the iterative calculate the index i, j and n correspond to x, y and t, respectively, while ∆x and ∆y correspond to the spaces among pixels and ∆t represents the increment in the iterations. The partial derivatives can be calculated as next it is indicated:
Substituting these approaches in (8a) and (8b) the iterative solution of the GVF is obtained:
Where
r should be to stay ≤ to 1/4 and ∆t should be small.
The establishment of the initial contour of the “snake” with GVF even continues being made manually by what is based in [1] where a method is indicated for the automatic initialization of the “snakes.” The steps of the method are described next:
� A net of checkpoints settles down in the whole image where the distance among the points debit side to be smaller to the distance between two objects.
� The GVF is used so that the points of the net
are attracted toward the contours of the objects.
� A clustering approach is used to generate groups of points.
� The convex hull is used in each one of the groups of points to generate the initial contours of the “snakes.”
� The “snakes” with GVF are used to find the
contours of the images.
2.3. Obtaining of the 3D model An approach or an interpolation will be carried out in the contour points obtained by means of the “snakes” with GVF. The determination on which of the two methods to use for the generation of the models depends of the quantity of noise that exists in the image, if a lot of noise exists, an approach it will be used and if there is little noise an interpolation will be carried out.
3. Summary With the application of the “snakes” with GVF and using the method for the automatic initialization explained in the section 2.2.2 a robust automatic segmentation will be obtained for the obtaining of the contours in the images, after that which is carried out the obtaining of the 3D pattern using a method of obtaining of 3D models. 4. References [1] Cheng-Hung Chuang and Wen-Nung Lie, “Automatic snake contours for the segmentation of multiple objects”, Dept. of Electrical Engineering, National Chung Cheng University, Taiwan, 2001, pp. 389-392. [2] Chenyang Xu and Jerry L. Prince, “Snakes, Shapes, and Gradient Vector Flow”, IEEE Transactions on Image Processing, Marzo 1998, pp. 359-369. [3] C. R. González, “Tratamiento digital de imágenes”, Addison-Wesley, 1996. [4] Donna J. Williams and Mubarak Shah, “A Fast Algorithm for Active Contours”, 1990, pp. 592-595. [5] Gonzalo Pajares and Jesús M. de la Cruz, “Visión por Computador (Imágenes digitales y aplicaciones)”, Alfaomega, 2002. [6] Juan D. Osorio, Flavio. A. Prieto and Gustavo A. Osorio, “Revisión sobre Modelado de Superficies Complejas”, Medellín, Julio, 2004, pp. 69-76. [7]M. Kass, A. Witkin and Terzopoulos, “Snakes: Active contour Models”, International Journal of Computer Vision 1, 1988, pp. 321-331.
c2(x,y) = b(x,y)fy(x,y)
ut = 1 (ui,jn+1 – ui,j
n) ∆t
vt = 1 (vi,jn+1 – vi,j
n) ∆t
∇2u = 1 (ui+1,j ui,j+1 + ui-1,j + ui,j-1 – 4ui,j) ∆x∆y
∇2v = 1 (vi+1,j vi,j+1 + vi-1,j + vi,j-1 – 4vi,j) ∆x∆y
ui,jn+1 = (1 – bi,j∆t)ui,j
n + r(ui+1,jn + ui,j+1
n + ui-1,jn +ui,j-1
n - 4ui,j
n) + ci,j1∆t (9a)
vi,jn+1 = (1 – bi,j∆t)vi,j
n + r(vi+1,jn + vi,j+1
n + vi-1,jn +vi,j-1
n – 4vi,j
n) + ci,j2∆t (9b)
r = µ∆t (10) ∆x∆y
∆t ≤ ∆x∆y (11) 4µ


45
Figure 1. Perspective projection
Vanishing point
Projection plane
Vanishing points detection using Thales's theorem
Edgar Colorado Soto, Andrea Magadán Salazar
Artificial Vision Group, Department of Computational Sciences
CENIDET
[email protected], [email protected]
Abstract
A method for the obtaining of the vanishing point in
images that they present perspective projection is
shown. The method of Thales's circle (TCM) is utilized,
which is based on Thales's theorem; This technical
supposes some advantages in relation to another one
largely utilized, like the based in spherical geometry
[1], [5], [6], since a priori information on the focal
length of the camera is not needed. The method
assumes than the straight lines that come to a point
toward the vanishing point, right now have been
extracted adequately from the image. Several test cases
with images of the inside of a building that present
certain regularity in his structure are presented in
order to try the efficacy of the method.
1. Introduction
The vanishing points detection in images has taken
importance in various tasks of artificial vision such as:
camera calibration, images rectification and the
navigation of autonomous vehicles, etc. Several
approaches exist to detect vanishing points, one of the
most used is the proposed by [1], which raises the use
of a Gaussian sphere, others more they use a bayesian
model [4]. In our case the method of the Thales's circle
(TCM) due to his simplicity and robustness in
comparison with the mentioned techniques was used.
The present work is divided in three parts, first the
Canny's algorithm [7] is applied to the image to extract
the edges that compose it; the second step consists in
straight lines detection with certain tilt angle by means
of Hough transform [7]. Finally TCM method is
applied to calculate the vanishing point, on the basis of
the straight lines extracted in the previous processes.
2. Perspective projection
The perspective projection is used to represent 3D
objects in a 2D projection plane, in such a way that the
parallel lines of the object that not be parallel to the
projection plane, project in convergent lines. The point
where the projected lines come to a point, names him
vanishing point (see figure 1). On the basis of this we
can classify the perspective projections with one, two
and three vanishing points.
3. Straight lines detection
Once the edges are extracted by means of the
Canny's algorithm, the Hough transform is used to find
the straight lines that are present at the image. The
Hough transform involves finding the pixels of
coordinates (xi, yi) that can belong to a straight line
using the equation 1:
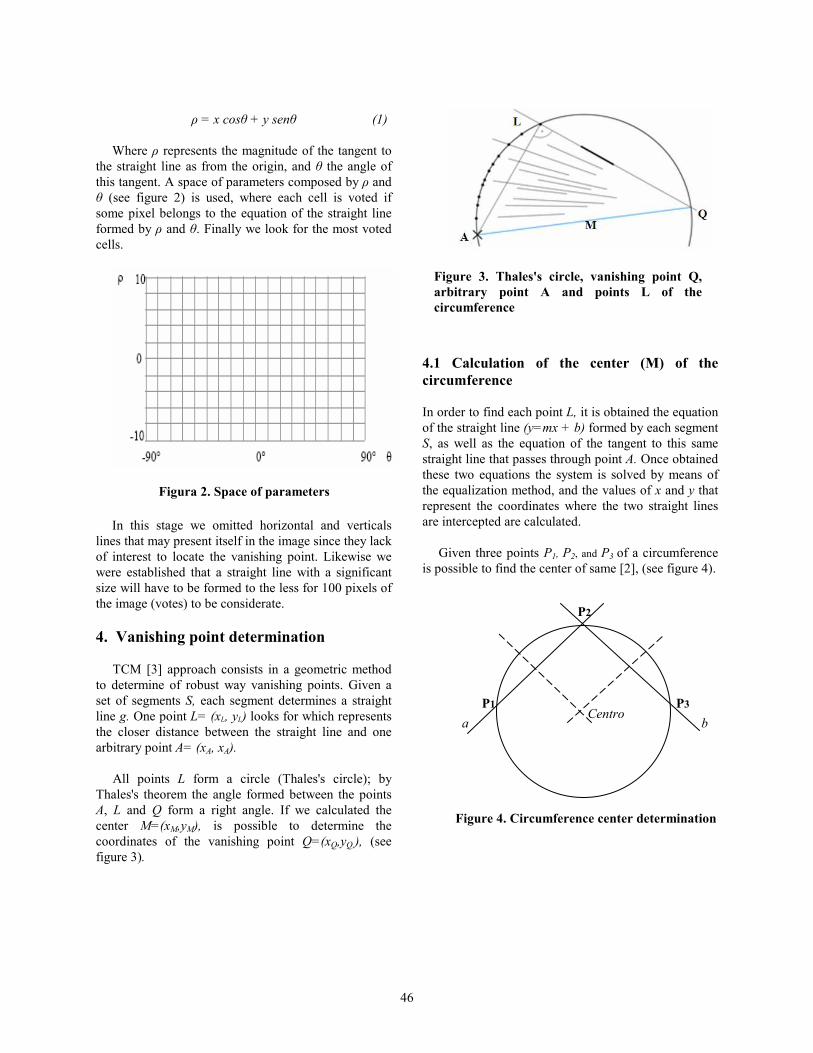
46
Figura 2. Space of parameters
ρ = x cosθ + y senθ (1)
Where ρ represents the magnitude of the tangent to
the straight line as from the origin, and θ the angle of
this tangent. A space of parameters composed by ρ and
θ (see figure 2) is used, where each cell is voted if
some pixel belongs to the equation of the straight line
formed by ρ and θ. Finally we look for the most voted
cells.
In this stage we omitted horizontal and verticals
lines that may present itself in the image since they lack
of interest to locate the vanishing point. Likewise we
were established that a straight line with a significant
size will have to be formed to the less for 100 pixels of
the image (votes) to be considerate.
4. Vanishing point determination
TCM [3] approach consists in a geometric method
to determine of robust way vanishing points. Given a
set of segments S, each segment determines a straight
line g. One point L= (xL, yL) looks for which represents
the closer distance between the straight line and one
arbitrary point A= (xA, xA).
All points L form a circle (Thales's circle); by
Thales's theorem the angle formed between the points
A, L and Q form a right angle. If we calculated the
center M=(xM,yM), is possible to determine the
coordinates of the vanishing point Q=(xQ,yQ,), (see
figure 3).
4.1 Calculation of the center (M) of the
circumference
In order to find each point L, it is obtained the equation
of the straight line (y=mx + b) formed by each segment
S, as well as the equation of the tangent to this same
straight line that passes through point A. Once obtained
these two equations the system is solved by means of
the equalization method, and the values of x and y that
represent the coordinates where the two straight lines
are intercepted are calculated.
Given three points P1, P2, and P3 of a circumference
is possible to find the center of same [2], (see figure 4).
Figure 4. Circumference center determination
Centro
P2
P3 P1
a b
Figure 3. Thales's circle, vanishing point Q,
arbitrary point A and points L of the
circumference

47
(3)
Figure 5. Original images
Figure 7. Application of Hough
transform and detection of the
vanishing point
VP = (699.22, 183.36)
VP = (547.61, 233.21)
Figure 6. Images segmented with Canny
The equations of the perpendicular bisectors of the
straight lines PıP2, and P2P3 are given by:
.
Where ma and mb represent the slope of the two
straight lines respectively. The coordinated x of the
point of intersection (center of the circumference) of
the perpendicular bisectors is calculates with the
equation:
.
The value of the coordinate y is obtained
substituting x in anyone of the equations of the
perpendicular bisectors.
4.2 Calculation of the vanishing point (Q)
The vanishing point is calculated utilizing the
coordinates of the center.
5. Experiments
The test cases come from scenes in surroundings of
interiors. It is important to obtain images with good
illumination, to guarantee the effectiveness of the
detection of edges and lines. Images in gray scale are
used.
xQ = 2xM - xA,
yQ = 2yM - yA.
(2)
48
6. Conclusions
In the present work algorithms for the edges extraction,
straight line detection, as well as a geometric method to
find the vanishing point in images with perspective
projection was implemented. The utilized approach
(TCM) is simple and robust, in comparison with other
works, likewise it has the advantage of not requiring a
priori information on the images acquisition. However,
it is important emphasize that the success of this
algorithm, depends to a large extent on the previous
processes (images acquisition, edges segmentation and
location of straight lines), therefore is important to
count on images taken in suitable conditions, as well as
to count on effective algorithms of segmentation.
6. References [1] Barnard, S., “Interpreting perspective images”, Artificial
Intelligence, 1983.
[2] Bourke, P., “Equation of a Circle from 3 Points”, 1990.
[3] Brauer-Burchardt, C., and Voss, K., “Robust Vanishing
Point Determination in Noisy Images”, Friedrich Schiller
University Jena, Jena, Alemania, 2000.
[4] Coughlan J., and Yuille A., “Compass direction from a
single image by bayesian inference”, In Proc of the
International Conference on Computer Vision, 1999.
[5] Lutton, E. Maitre H., and Lopez-Krahe, J., “Contribution
to the Determination of Vanishing Points Using Hough
Transform”, IEEE transactions on pattern analysis and
machine intelligence, 1994.
[6] McLean, G.F., and Kotturi, D., “Vanishing point
detection by line clustering”, IEEE Trans. on Pattern
Analysis and Machine Intelligence, 1995.
[7] Pajares, J. Visión por computador imágenes digitales y
aplicaciones, Alfaomega, 2002.

49
An Ontology-based Translator for Communicating Negotiation Agents
over Internet
Maricela Claudia Bravo Contreras
Centro Nacional de Investigación y Desarrollo Tecnológico
Abstract
Traditional negotiation systems have been
implemented using agent architectures, where agents
exchange messages generated by each system, based
on particular language definitions implicitly encoded,
giving different syntax and semantics to their
messages. In this paper we address the problem of
language interoperability between negotiation agents
during message exchanging over the Internet. Our
proposal incorporates an ontology-based translator
architecture, which is executed only when a
misunderstanding occurs. We implemented a service
oriented architecture for executing negotiations over
the Internet and conducted experiments incorporating
different semantics to negotiation messages. The
results of the tests show that the proposed solution
improves communications between heterogeneous
negotiation agents.
1. Introduction
Negotiation plays a fundamental role in electronic
commerce activities, allowing participants to interact
and take decisions for mutual benefit. Traditional
negotiations have been implemented in small and
medium-sized multi-agent systems (MAS), where
negotiation agents use a particular communication
language to reach a deal. Recently there has been a
growing interest in conducting negotiations over the
Internet, and constructing large-scale agent
communities based on emergent Web service
architectures. The challenge of integrating and
deploying multiple negotiation agents in open and
dynamic environments is to achieve effective
communications.
The language used by agents to exchange messages
is defined as agent communication language (ACL). An
ACL allows an agent to share information and
knowledge with other agents, or request the execution
of a task. KQML [1] was the first standardized ACL
from the ARPA knowledge project. KQML consists of
a set of communication primitives aiming to support
interaction between agents. KQML includes many
performatives of speech acts. Another ACL [2]
standard comes from the Foundation for Intelligent
Physical Agents (FIPA) initiative. FIPA ACL is also
based on speech act theory, and the messages generated
are considered as communicative acts.
The objective of using a standard ACL is to achieve
effective communication without misunderstandings,
but this is not always true. Because, standards specify
the semantics of communicative acts, but the software
implementation is not explicitly defined, leaving
developers to follow their own criteria. Furthermore,
standard ACL specifications consider the incorporation
of privately developed communicative acts.
In this paper we address the problem of language
interoperability between negotiation agents during the
exchange of messages. This problem occurs when
messages generated by each agent have different syntax
and/or meaning not based on explicit semantics, but on
particular definitions implicitly encoded.
To solve the problem, we have selected a translation
approach based on the incorporation of a shared
ontology. We implemented the ontology using a
language to explicitly describe negotiation messages in
a machine interpretable form. The ontology represents
the shared vocabulary that the translator uses during
execution of negotiation processes for solving
misunderstandings.
The rest of the document is organized as follows. In
section 2, we present the translator architecture. In
section 3, we describe the design and implementation
of the ontology. In section 4, the general architecture of
the prototype for executing negotiation processes is
presented. In section 5, we describe the results of
experiments. Finally in section 6, we present
conclusions.

50
2. Translator Architecture
We designed the translator architecture analyzing
two possibilities. In figure 1, two architectural designs
are shown. The architecture identified by letter a, was
presented by Uschold [3] and Grüninger [4]. This
architecture was proposed to integrate different
software tools, using an ontology as an interlingua to
support translation between different languages. We
consider that this is a good solution when systems use
totally different languages, because all communications
are conducted through the translator. The second
architecture identified by letter b is our proposal. We
designed this architecture considering that agents
involved in a negotiation process may be using similar
ACL, and not all messages generated will cause
misunderstanding. Communications in our architecture
are executed through an independent message
transport, and only when agents need translation, the
translator is invoked, reducing the number of
translations.
3. Design of the Ontology
Ontologies have been studied in various research
communities, such as knowledge engineering, natural
language processing, information systems integration
and knowledge management. Ontologies are a good
solution for facilitating shared understanding between
negotiation agents.
The principal objective in designing the ontology
was to serve as an interlingua between agents during
exchange of negotiation messages. According to Müller
[6], negotiation messages are divided into three groups:
initiators, if they initiate a negotiation, reactors, if they
react on a given statement and completers, when they
complete a negotiation. We selected this classification
to allow the incorporation of new negotiation
primitives from the local agent ACL.
Figure 1. Comparison between two translator
architectures
Figure 2 shows the general structure of our
ontology.
Figure 2. General structure of the ontology
Shared Ontology
Language
Parameters Primitives
Initiators Reactors Completers
Protocols
- Propose
- Arrange
- Request
- Initiate
- Start
- …
- Answer
- Send
- Reply
- Counteroffer
- Refuse
- …
- Confirm
- Accept
- Reject
- End
- Agree
- …
Agent
A
Translator
Shared
Ontology
Agent
B
Software A
Ontology
Translator
Translator
Software
B
(a)
(b)
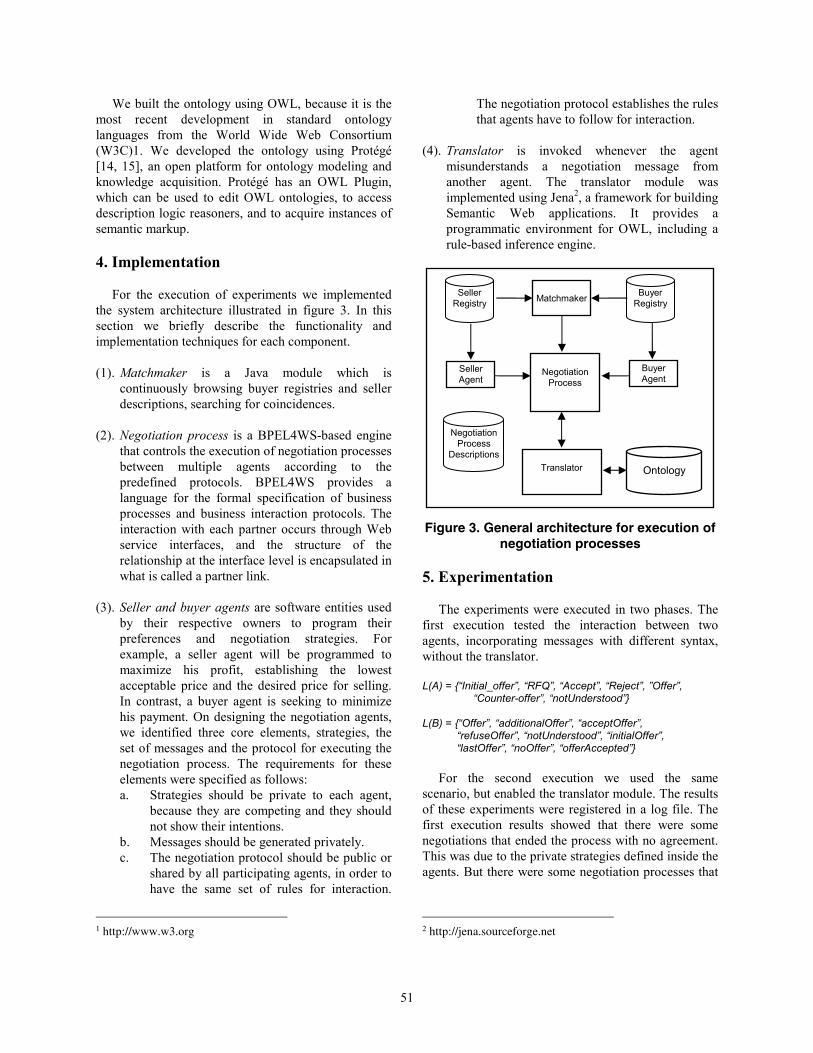
51
We built the ontology using OWL, because it is the
most recent development in standard ontology
languages from the World Wide Web Consortium
(W3C)1. We developed the ontology using Protégé
[14, 15], an open platform for ontology modeling and
knowledge acquisition. Protégé has an OWL Plugin,
which can be used to edit OWL ontologies, to access
description logic reasoners, and to acquire instances of
semantic markup.
4. Implementation
For the execution of experiments we implemented
the system architecture illustrated in figure 3. In this
section we briefly describe the functionality and
implementation techniques for each component.
(1). Matchmaker is a Java module which is
continuously browsing buyer registries and seller
descriptions, searching for coincidences.
(2). Negotiation process is a BPEL4WS-based engine
that controls the execution of negotiation processes
between multiple agents according to the
predefined protocols. BPEL4WS provides a
language for the formal specification of business
processes and business interaction protocols. The
interaction with each partner occurs through Web
service interfaces, and the structure of the
relationship at the interface level is encapsulated in
what is called a partner link.
(3). Seller and buyer agents are software entities used
by their respective owners to program their
preferences and negotiation strategies. For
example, a seller agent will be programmed to
maximize his profit, establishing the lowest
acceptable price and the desired price for selling.
In contrast, a buyer agent is seeking to minimize
his payment. On designing the negotiation agents,
we identified three core elements, strategies, the
set of messages and the protocol for executing the
negotiation process. The requirements for these
elements were specified as follows:
a. Strategies should be private to each agent,
because they are competing and they should
not show their intentions.
b. Messages should be generated privately.
c. The negotiation protocol should be public or
shared by all participating agents, in order to
have the same set of rules for interaction.
1 http://www.w3.org
The negotiation protocol establishes the rules
that agents have to follow for interaction.
(4). Translator is invoked whenever the agent
misunderstands a negotiation message from
another agent. The translator module was
implemented using Jena2, a framework for building
Semantic Web applications. It provides a
programmatic environment for OWL, including a
rule-based inference engine.
Figure 3. General architecture for execution of
negotiation processes
5. Experimentation
The experiments were executed in two phases. The
first execution tested the interaction between two
agents, incorporating messages with different syntax,
without the translator.
L(A) = {“Initial_offer”, “RFQ”, “Accept”, “Reject”, ”Offer”,
“Counter-offer”, “notUnderstood”}
L(B) = {“Offer”, “additionalOffer”, “acceptOffer”, “refuseOffer”, “notUnderstood”, “initialOffer”, “lastOffer”, “noOffer”, “offerAccepted”}
For the second execution we used the same
scenario, but enabled the translator module. The results
of these experiments were registered in a log file. The
first execution results showed that there were some
negotiations that ended the process with no agreement.
This was due to the private strategies defined inside the
agents. But there were some negotiation processes that
2 http://jena.sourceforge.net
Ontology
Negotiation Process
Translator
Matchmaker Seller
Registry Buyer
Registry
Seller
Agent
Buyer
Agent
Negotiation Process
Descriptions

52
ended due to lack of understanding of negotiation
messages.
The second phase results showed a reduction in the
number of negotiations finished by lack of
understanding, which does not mean that the
incorporation of a translator module will ensure an
agreement; but at least, the negotiation process will
continue executing. Figure 4 shows a comparison for
the two phases executed.
0
2
4
6
8
10
12
Fi r st P hase Second P hase
accept ed
no of f er
not under st ood
Figure 4. Graphical comparison of execution
of experiments
6. Conclusions
In this paper we presented a solution for the
problem of language interoperability between
negotiation agents, by incorporating a translator
architecture, which is executed only when a
misunderstanding occurs. This translator is based on a
shared ontology, where negotiation messages are
explicitly described in a machine interpretable form.
We evaluated the ontology in the target application,
and described the system architecture into which the
negotiation processes are executed.
We implemented the system for executing
negotiation processes using service-oriented
technologies, improving interoperability between
agents at run time, in contrast to most of the existing
work on negotiation, which is based on distributed
agent technology.
We believe that language interoperability between
negotiation agents is an important issue that can be
solved by incorporating a shared ontology. The
experimental tests showed that the proposed
architecture improves the continuity of the execution of
negotiation processes, resulting in more agreements.
7. References [1] T. Finning, R. Fritzon, and R. McEntire: KQML as an
agent communication language, in Proceedings of the
3rd International Conference on Information and
Knowledge Management, November 1994.
[2] FIPA Communicative Acts, http://www.fipa.org.
[3] Uschold, M. and King M., Towards a Methodology for
Building Ontologies, Workshop on Basic Ontological
Issues in Knowledge Sharing, 1995.
[4] Grüninger, M. and Fox, M., The Role of Competency
Questions in Enterprise Engineering, IFIP WG 5.7
Workshop on Benchmarking. Theory and Practice,
Trondheim, Norway, 1994.
[5] Fernández, M., Gómez-Pérez, A., and Juristo, N.,
METHONTOLOGY: From Onthological Art towards
Ontological Engineering, Proceedings of AAAI Spring
Symposium Series, AAAI Press, Menlo Park, Calif., pp.
33-40, 1997.
[6] Müller, H. J., Negotiation Principles, Foundations of
Distributed Artificial Intelligence, in G.M.P. O´Hare,
and N.R. Jennings, New York: John Wiley & Sons.
[7] Stanley Y. W. Su, Chunbo Huang, Joachim Hammer,
Yihua Huang, Haifei Li, Liu Wang, Youzhong Liu,
Charnyote Pluempitiwiriyawej, Minsoo Lee and
Herman Lam, An Internet-Based Negotiation Server For
E-Commerce, the VLDB Journal, Vol. 10, No. 1, pp.
72-90, 2001.
[8] Anthony Chavez, Pattie Maes, Kasbah: An Agent
Marketplace for Buying and Selling Goods,
Proceedings of the First International Conference on
the Practical Application of Intelligent Agents and
Multi-Agent Technology, London, UK, April 1996.
[9] Dignum, Jan Dietz, Communication Modeling – The
language/Action Perspective, Proceedings of the Second
International Workshop on Communication Modeling,
Computer Science Reports, Eindhoven University of
Technology, 1997.
[10] J. Gennari, M. Musen, R. Fergerson, W. Grosso, M.
Crubézy, H. Eriksson, N. Noy, and S. Tu: The evolution
of Protégé-2000: An environment for knowledge-based
systems development, International Journal of Human-
Computer Studies, 58(1): 89-123, 2003.
[11] H. Knublauch: An AI tool for the real world:
Knowledge modeling with Protégé, JavaWorld, June
20, 2003.
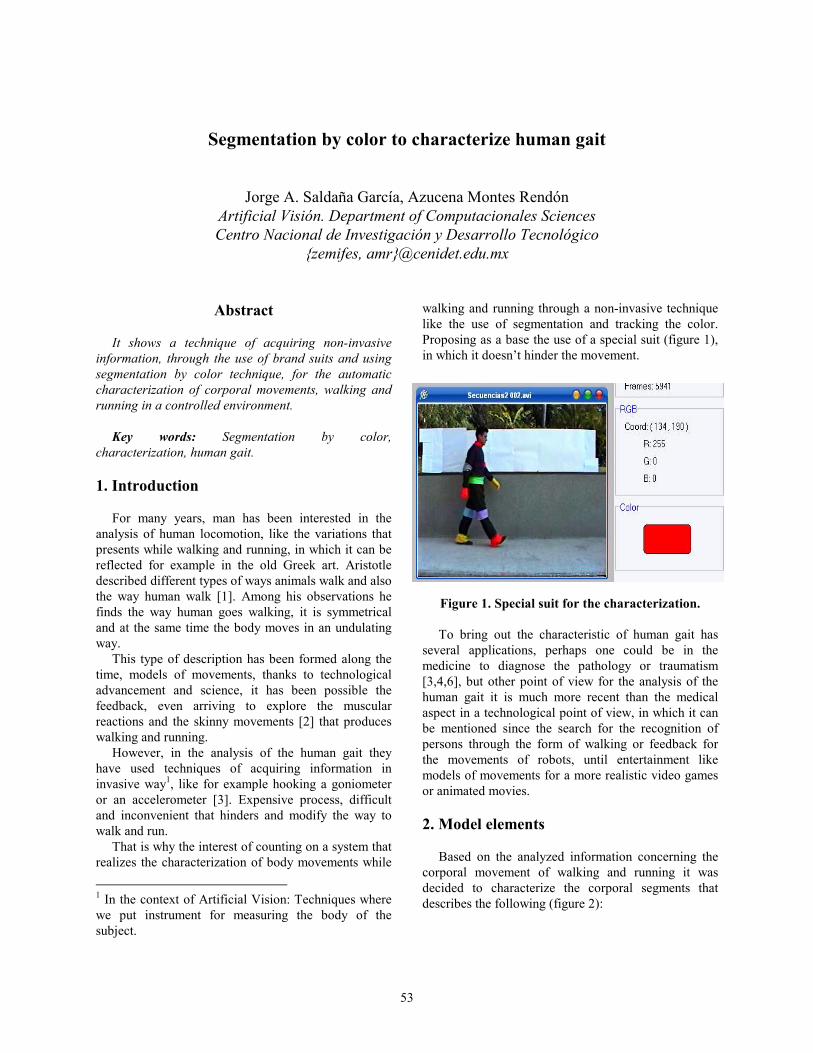
53
Segmentation by color to characterize human gait
Jorge A. Saldaña García, Azucena Montes Rendón
Artificial Visión. Department of Computacionales Sciences
Centro Nacional de Investigación y Desarrollo Tecnológico
{zemifes, amr}@cenidet.edu.mx
Abstract
It shows a technique of acquiring non-invasive
information, through the use of brand suits and using
segmentation by color technique, for the automatic
characterization of corporal movements, walking and
running in a controlled environment.
Key words: Segmentation by color,
characterization, human gait.
1. Introduction
For many years, man has been interested in the
analysis of human locomotion, like the variations that
presents while walking and running, in which it can be
reflected for example in the old Greek art. Aristotle
described different types of ways animals walk and also
the way human walk [1]. Among his observations he
finds the way human goes walking, it is symmetrical
and at the same time the body moves in an undulating
way.
This type of description has been formed along the
time, models of movements, thanks to technological
advancement and science, it has been possible the
feedback, even arriving to explore the muscular
reactions and the skinny movements [2] that produces
walking and running.
However, in the analysis of the human gait they
have used techniques of acquiring information in
invasive way1, like for example hooking a goniometer
or an accelerometer [3]. Expensive process, difficult
and inconvenient that hinders and modify the way to
walk and run.
That is why the interest of counting on a system that
realizes the characterization of body movements while
1 In the context of Artificial Vision: Techniques where
we put instrument for measuring the body of the
subject.
walking and running through a non-invasive technique
like the use of segmentation and tracking the color.
Proposing as a base the use of a special suit (figure 1),
in which it doesn’t hinder the movement.
Figure 1. Special suit for the characterization.
To bring out the characteristic of human gait has
several applications, perhaps one could be in the
medicine to diagnose the pathology or traumatism
[3,4,6], but other point of view for the analysis of the
human gait it is much more recent than the medical
aspect in a technological point of view, in which it can
be mentioned since the search for the recognition of
persons through the form of walking or feedback for
the movements of robots, until entertainment like
models of movements for a more realistic video games
or animated movies.
2. Model elements
Based on the analyzed information concerning the
corporal movement of walking and running it was
decided to characterize the corporal segments that
describes the following (figure 2):

54
Figure 2. Segments of corporal interest.
* Hands and feet: It is necessary to consider hands
and feet as indispensable segments for analysis,
Normally, walking the hands move rhythmically in
opposite position as the movement of feet and that
walking is the result of the series of steps [5,7].
* Elbows and knees: These elements are considered
because the cinematic of running is differentiated of
walking in which the movement of the articulations
increases considerably [1].
* Torso: Few works consider this element in the
analysis of the movements mentioned, however, the
normal human walk has been decreed like a series of
alternate movement, rhythmic, of the extremities and
the torso in which determines a movement forwards the
center of gravity. Besides, it has been seen that when
we increase the velocity of steps the torso inclines
forwards so as to maintain the balance [7].
3. General scheme of the system
In figure 3 it shows the general stages of the system in
which the marked color green and orange are the steps
that are developing.
The purpose of the system is characterizes two actions
of the human body: walk and run, and at the same time
obtain the positional patterns of the parts of body
(model) in realizing them. Once the data are obtained,
the characterizations will be validated trough its
recognition and put in graphics to verify its
representation.
Actually, the prototype has been developed the
stages for extractions of images from a video format
AVI, segmentation using the combination of the tree
bands of format RGB and the tracking (of colors) based
on the coordinates of centroids, the segmented regions
like the first trial of characterizations.
3.1 Acquisition
The acquisition is one with only a video-camera
(domestic), Sony Handycam CCD-FX520, with the
lateral view of the body of the subject, using marks in
the use of a especial suit.
Although the fundamental part for the acquisition is
the use of suit, that is designed in a way that permits a
normal movement of the subject and at the same time
facilitate the segmentation, it is very important to keep
in mind the problems caused by the illuminations..
The problem in this case, is that if you don’t use any
artificial lighting, it’s difficult to capture the color of
the marks in the suit with the same tonality, due to the
movements of the parts of the body that generates
shades in the marks, in which tonality change along the
sequences. To counteract this, we have looked for a
way to control this factor doing the acquisitions in a
place where the illumination generates the least
quantity of shades possible.
3.2 Digitalization
The digitalization is also an important stage to get
good results in later stages.
Figure 3. General stages of the system.

55
A good digitalization permits for example reduce
the time for preprocessing.
In this system the stages are taken care for trying to
adjust the bright and contrast in a way that those colors
in suit marks is not dark or is not confused with another
color.
3.3 Segmentation and tracking
Having work with different parts of the body: feet,
knees, back, elbow, hands; we have searched for a
method of segmentation that facilitate the tracking
stage, that is to say, that allows to know since the first
step, based on the color of the mark, that has been
found for example the right hand of the subject and that
tracking could be realized. For each part, in accordance
with the mark color, it should be different for each
corporal segment.
The object of this work is specifically the
characterization and the generation of model. We have
opted to use this method of segmentation and not
something more complicated that implies a use of a
lesser marks in which obviously it requires also a
higher level of processing.
As we analyze 9 segments of the body, it is
necessary to count 10 colors for the marks (the back is
taken out from the waist to the neck), in which it makes
difficult to easily differentiate one from the other.
Assuming that the primary additives colors are red
(R), green (G) and blue (B), it is taken into
consideration we could have only 3 possible marks but,
mixing these colors we could get the rest (Figure 4).
Figure 4. Primary additives colors.
Even though for one optimal segmentation, it would
be necessary to have combination of two colors in
which it could give RG, RB y GB, three more colors.
In total it is possible to use six different colors. The
color black is not used because it is the color of the suit
and the color white is probably encounter at the
bottom. The solution is to repeat colors in the 4 missing
marks and in the algorithm of the segmentation,
dividing the image according to the coordinates to
avoid counting the repeated colors like one region.
Resides, it used range for each group (RGB),in
which it allows to assure that we find the majority
number possible of pixels for each mark. For example
the mark color green is compared:
pixelActual en R<10 && pixelActual en G>200 &&
pixelActual en B<10
For the yellow mark is compared:
pixelActual en R>200 && pixelActual en G>200 &&
pixelActual en B<10
So according to the case, a range is assigned for
each color utilized.
In practice, favorable results have been gotten in
segmentation (figure 5) but the major problem has been
like we mentioned previously, the lack of good
illumination, in which it is difficult to control without
artificial illumination.
Figure 5. Segmentation and grafication of
centroids for hands, feet and neck.
3.4 Characterization
The stage of characterization is found in the final
phase of testing. Basically, it works in the following
way.
Once that each one of regions of the image has
been segmented (body segments), is calculated the
centroid of each one is using:
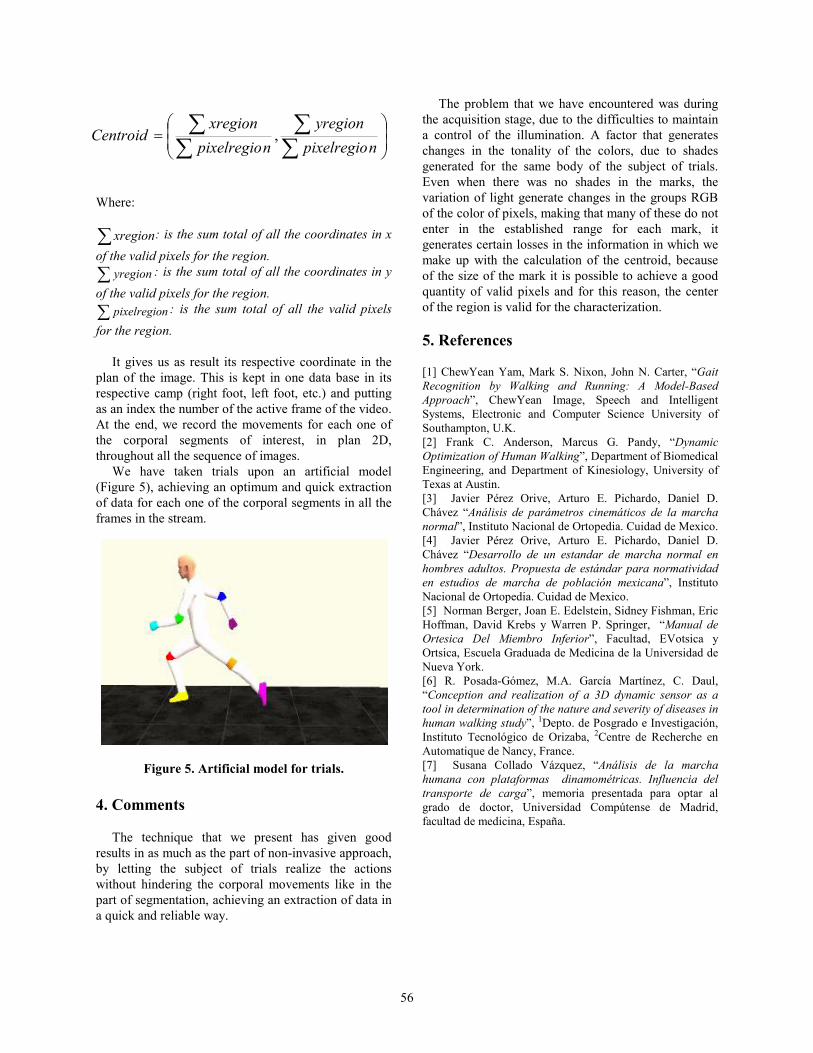
56
Where:
∑ xregion: is the sum total of all the coordinates in x
of the valid pixels for the region.
∑ yregion : is the sum total of all the coordinates in y
of the valid pixels for the region.
∑ npixelregio : is the sum total of all the valid pixels
for the region.
It gives us as result its respective coordinate in the
plan of the image. This is kept in one data base in its
respective camp (right foot, left foot, etc.) and putting
as an index the number of the active frame of the video.
At the end, we record the movements for each one of
the corporal segments of interest, in plan 2D,
throughout all the sequence of images.
We have taken trials upon an artificial model
(Figure 5), achieving an optimum and quick extraction
of data for each one of the corporal segments in all the
frames in the stream.
Figure 5. Artificial model for trials.
4. Comments
The technique that we present has given good
results in as much as the part of non-invasive approach,
by letting the subject of trials realize the actions
without hindering the corporal movements like in the
part of segmentation, achieving an extraction of data in
a quick and reliable way.
The problem that we have encountered was during
the acquisition stage, due to the difficulties to maintain
a control of the illumination. A factor that generates
changes in the tonality of the colors, due to shades
generated for the same body of the subject of trials.
Even when there was no shades in the marks, the
variation of light generate changes in the groups RGB
of the color of pixels, making that many of these do not
enter in the established range for each mark, it
generates certain losses in the information in which we
make up with the calculation of the centroid, because
of the size of the mark it is possible to achieve a good
quantity of valid pixels and for this reason, the center
of the region is valid for the characterization.
5. References [1] ChewYean Yam, Mark S. Nixon, John N. Carter, “Gait
Recognition by Walking and Running: A Model-Based
Approach”, ChewYean Image, Speech and Intelligent
Systems, Electronic and Computer Science University of
Southampton, U.K.
[2] Frank C. Anderson, Marcus G. Pandy, “Dynamic
Optimization of Human Walking”, Department of Biomedical
Engineering, and Department of Kinesiology, University of
Texas at Austin.
[3] Javier Pérez Orive, Arturo E. Pichardo, Daniel D.
Chávez “Análisis de parámetros cinemáticos de la marcha
normal”, Instituto Nacional de Ortopedia. Cuidad de Mexico.
[4] Javier Pérez Orive, Arturo E. Pichardo, Daniel D.
Chávez “Desarrollo de un estandar de marcha normal en
hombres adultos. Propuesta de estándar para normatividad
en estudios de marcha de población mexicana”, Instituto
Nacional de Ortopedia. Cuidad de Mexico.
[5] Norman Berger, Joan E. Edelstein, Sidney Fishman, Eric
Hoffman, David Krebs y Warren P. Springer, “Manual de
Ortesica Del Miembro Inferior”, Facultad, EVotsica y
Ortsica, Escuela Graduada de Medicina de la Universidad de
Nueva York.
[6] R. Posada-Gómez, M.A. García Martínez, C. Daul,
“Conception and realization of a 3D dynamic sensor as a
tool in determination of the nature and severity of diseases in
human walking study”, 1Depto. de Posgrado e Investigación,
Instituto Tecnológico de Orizaba, 2Centre de Recherche en
Automatique de Nancy, France.
[7] Susana Collado Vázquez, “Análisis de la marcha
humana con plataformas dinamométricas. Influencia del
transporte de carga”, memoria presentada para optar al
grado de doctor, Universidad Compútense de Madrid,
facultad de medicina, España.
=
∑∑
∑∑
npixelregio
yregion
npixelregio
xregionCentroid ,


59
Description of two Statistical Models Applied To The Extraction Of Facial
Features: Integral projections And Active Shape Model Luis E. Morán L. and Raul Pinto Elías
[email protected], [email protected]
Abstract
The task of face detection or facial features in
digital images, it is the first step of the systems that
obtain information of these elements for their
application in different environments, such as the
biometry or the animation of virtual characters, among
others. In this document two methods are described
they are used for the localization of faces or of features
facial; the model of active shape and integral
projections, both methods are based on the creation of
a statistical model, which represents the form of the
face or facial feature that one wants to locate. In both
methods he/she leaves of a group of images of the
same size, which is used to create the pattern that
represents to the element that we want to locate. Both
algorithms will be described in this document.
1. Introduction
The face detection or its features in digital images,
is the main process in systems that use these
components to obtain information about the person or
the movements of the person.
There are several approaches focused at this task,
many of them use information about the shape or the
appearance of the face or facial features at locating.
Pixel's color information is a very used technique, in
the way to locate areas with skin tone [1], this
technique is more robust if in these regions we validate
the presence of a human face, this task is carried out
with the localization of eyes and nose [1], verifying the
elliptic shape of the area [2] or using any statistical
model of the face or facial feature [3].
Active Shape Model and Integral Projections Model
are described in this paper; just the way to obtain these
models is explained in this document.
The structure of this paper is the following. In the
section 2, the method of integral projections is
explained and how to obtain a statistical model from a
set of images, in this case the images contains just
faces. How to create a model of any object with Active
Shape Model, is described in the section 3. Finally
some relevant conclusions are present in the section 4.
1. Integral Projections Models
Let R(i) be a region inside of a grayscale image
i(x,y), the vertical and horizontal integral projections of
this region are given by
∑=
=N
y
iHR yxiiRx
xP1
)( ),()(
1)( (1)
where { })(),(,/)( iRyxyyiRx ∈∀=
∑=
=N
x
iVR yxiiRy
yP1
)( ),()(
1)( (2)
where { })(),(,/)( iRyxxxiRy ∈∀=
Then the integral projections give a marginal
distribution of the gray values along one direction
vertical or horizontal.
Let i(x,y) be a normalized image to values [0,1], the
reconstruction of the image is given by :
)(),(,),(ˆ )()( iRyxPPyxi iVRiHR ∈∀•= (3)
The reconstruction may be used to compare the
similarity with the original image, that indicate the
accuracy of the representation. [4].
Figure 1. Vertical and horizontal projections of R(i), where
R(i), is a face.

60
2.2. Model of Face
The better model of face is generated by one vertical
projection and two horizontal projections [5]. A good
model is given by a good alignment of the areas of
projections.
To model a face is necessary to have one vertical
projection that contain the total area of the face and
two horizontal projections one for the eyebrows and
eyes, and other for the nose and mouth.
A training set of images that contain only faces is
used to generate the model, previously to the
projections these images are equalized.
The face model consist in the mean M(j) and the
variance V(j) from the training set, for all the
projections. The final model is given by :
• { } RfVM FaceVFaceV →max,, ....1:,
• { } ROVM OjosHOjosH →max,, ....1:,
• { } RBVM BocaHBocaH →max,, ....1:,
3. Active Shape Model (ASM)
Other name for this model is Point Distribution
Model (PDM) [6], this model consist in a manually
labeled training set that describe a reduced space of
possible shapes of the object.
3.1. Suitable Landmarks
Points at clear corners of the object boundaries, T
junctions between boundaries and others points easy to
locate are good choices for landmarks. However these
landmarks are rarely enough for the description of the
object [6], then is necessary to add more landmarks
equally spaced between the first landmarks.
The connectivity between the landmarks is
established for a better shape representation. This allow
us to determine the direction of the boundary at given
point. All the points are in a vector in a correct
sequence.
T
nn yxyxX ),,.....,,( 00= (4)
3.2 Aligning the Training Set
To obtain a statistical description of the shape and
variation of the object, we start with a training set, each
element of the training set has a quantity of points,
these points are aligned to obtain a convenient rotation,
scale and translation for each mode, so that the sum of
distances of each shape to the mean is minimized
∑ −=2
xxD [6].
Figure 4. A good distribution of the landmarks, in
points at clear corners of the object boundaries, T
junctions between boundaries and others points easy
to locate
Figure 2. The image is equalized, then vertical and
horizontal projections are obtained, a vertical
projection for the total area and two horizontal
projections for the upper and lower areas of the face.
Figure 3. Mean and variance of the vertical and
horizontal projections of the face from a set of 50
images.

61
3.3. Building the Model
Suppose that there is a set s of points xi aligned in
common coordinate frame. These vectors form a
distribution in the 2n dimensional space. If is possible
to model this distribution then is possible to generate
new examples, similar at the training set. Then is
possible to check new shapes or objects and decide if
these examples are admissible.
To manipulate in a easy way these data, it's better to
reduce the dimension of them. An effective approach is
to apply Principal Components Analysis (PCA).
If PCA is applied to the data, then is possible to
approximate any of the training set, x using :
Pbxx +≈ (5)
Where ( )tpppP .....21= contains t eigenvectos
of the covariance matrix and b is a t dimensional vector
given by :
)( xxPb T −= (6)
The vector b defines a set of parameters of a
deformable model. By varying the elements of b we
can vary the shape, using (5). The variance of the ith
parameter, bi, across the training set is given by. By
applying limits of iλ3± to the parameter bi, we
ensure that the shape generated is similar to those in the
original training set.
The eigenvectors, P, define a coordinate frame,
aligned with de cloud of the original shape vectors. The
vector b, defines points in this rotated frame.
4. Conclusion
In this paper are described two approaches, they are
focused at face detection or facial features detection,
both approaches use the statistical science to create a
model. Now with these models is possible to detect a
face or a facial feature in a image, just is necessary to
have a function of alignment that align the signal of the
model and the signal of the image. Both approaches
implement a similarity measure to decide if there is a
face or not. The main parameters in both approaches
are scale, rotation and translation. The conclusion is
that both are good options for face detection or facial
features detection. However the model based in integral
projections has a best speed, this is possible because
just use the distribution of gray values of the pixels.
References
[1] P. Peer, F. Solina, An Automatic Human Face
Detection Method, Computer Vision Winter Workshop,
Ed. N. Brändle, pp. 122-130, Rastenfeld, Austria,
February 1999.
[2] Vladimir Vezhnevets, Stanislav Soldatov, Anna
Degtiareva, In Kyu Park, Automatic Extraction Of
Frontal Facial Features, Proc. Sixth Asian Conference
on Computer Vision (ACCV04), vol. 2, pp. 1020-1025.
Figure 6. Obtained results with AAMLab, it’s part
of AAM-API, library that was created in C++ .
Figure 6. Mean shape of aligned points from
training set.
Figure 5. Aligned points of the training set

62
[3] Matthews, I.; Cootes, T.F.; Bangham, J.A.; Cox, S.;
Harvey, R, Extraction of visual features for lipreading,
IEEE Transactions on Pattern Analysis and Machine
Intelligence, Volume 24, Issue 2, Feb. 2002
Page(s):198 – 213.
[4] Ginés García Mateos, Alberto Ruiz García, Pedro
Enrique Lopez-de-Teruel: Face Detection Using
Integral Projection Models, in the Lecture Notes in
Computer Science 2396, pp. 644—653.
[5] Ginés García Mateos: Refining Face Tracking with
Integral Projections, in the Lecture Notes in Computer
Science 2688, pp. 360--368, Springer,
[6] T.F. Cootes and C.J. Taylor. “Statistical Models of
Appearance for Computer Vision”. University of
Manchester, Draft Technical Report.
www.isbe.man.ac.uk/~bim/Models/app_models.pdf
[7] J. Nahed, MP. Jolly and GZ. Yang, "Robust Active
Shape Models," Medical Image Understanding and
Analysis, Bristol, UK, 2005.
[8] M. B. Stegmann, The AAM-API, Informatics and
Mathematical Modelling, Technical University of
Denmark, DTU, 2003


Rocío Vargas Arroyo. Was born in Lázaro Cárdenas, Michoacán in 1981. Computer Sistems Engineer by Instituto Tecnológico de Lázaro Cárdenas. Since august 2004 is a member of the Artificial Intelligence group of Centro Nacional de Investigación y Desarrollo Tecnológico , with an special interest on Natural Language Processing. These days Works on the development of the "Semantic analyzer for Web page classification" that will lead to the Master on Science degree.
Osslan Osiris Vergara Villegas. Received the B. S degree in Computer systems engineering from Zacatepec Technological Institute (Morelos) in 2000 specialized in networks and distributed systems, later he obtain the M. S. degree in computer science by the National Center of Research and Technological Development (Cenidet Cuernavaca Morelos) in 2003 specialized in knowledge based systems. Actually professor Osslan is working with its Ph. D. studies in computer science at cenidet in the area of artificial intellegence. His current research interest includes Pattern recognition, digital image processing, artificial vision and image compression.
Juan Carlos Olivares Rojas. Is Engineer in Computers Systems by the Instituto Tecnológico de Morelia in 2004. At the moment, he concludes his studies of Master in Sciences in Computer Science at the Centro Nacional de Investigación y Desarrollo Tecnológico (cenidet) at the Laboratory of Distributed Systems, making the thesis: "Hoarding Manager of Transcoding Web Sites for Pocket PC Platform ". His areas of interest are the mobile computing, the pervasive computing and embedded systems, the wireless networks and databases.
Erika Myriam Nieto Ariza. Academic qualifications: Bachelor degree in Computer, Universidad Au-tónoma of Estado de Morelos (UAEM). Master´s degree studies, Centro Nacional de Investigación y Desarrollo Tecnológico (CENIDET). research area: software engineering. Ph. D. student, Centro Nacional de Investigación y Desarrollo Tecnológico (CENIDET). Research area: software engineering. Interest area: requirement engineering, business process models, business process techniques.

Salvador Cervantes Alvarez. Origin place Jiquilpan, Michoacán, he obtained the title of engineer in computational systems in the Instituto Tecnlógico de Jiquilpan in the year of 2004. At the moment he studies the master in sciences in sciences of the computation with the artificial intelligence specialty in the Centro Nacional de Investigación y Desarrollo Tecnológico. Their interest areas are: computer vision, 3D modeling, neuronal networks.
José Francisco Cervantes Alvarez. Origin place Jiquilpan, Michoacán, he obtained the title of engineer in computational systems in the Instituto Tecnlógico de Jiquilpan in the year of 2003. At the moment he studies the master in sciences in sciences of the computation with the artificial intelligence specialty in the Centro Nacional de Investigación y Desarrollo Tecnológico. Their interest areas are: computer vision, knowledge engineering, neuronal networks, pattern recognition.
Vianey Guadalupe Cruz Sánchez. Received the B. S degree in informatic science from Cerro Azul Tecnologic Institute (Veracruz) in 2000 specialized in systems, later she obtain the M. S. degree in computer science by the National Center of Research and Technological Development (Cenidet Cuernavaca Morelos) in 2004 specialized in hybrid systems. Actually professor Vianey is working with its Ph. D. studies in computer science at cenidet in the area of artificial intellegence. His current research interest includes neuro-symbolic hybrid systems, neural-networks, artificial vision and knowledge representation.
Ismael Rafael Ponce Medellín. Studied Computational Systems Engineering, in the Instituto Tecnológico de San Luis Potosí. Actually he attends the Science Master in Sciences of the Computation, in Distributed Systems specialty, in the Centro Na-cional de Investigación y Desarrollo Tecnológico (cenidet). His areas of interest are ontologies, semantic Web and data bases.

Jorge Alfredo Saldaña García. He was born in 1979 in Morelos, México. He took the studies for Engineer in Computational Systems in the period of 1998-2003 at ITZ (Instituto Tecnológico de Zacatepec). He obtained the grade in 2004, when he defends her monograph “Design of a scheme of regulation with a diffuse controller for a level process”. Nowadays he studies the Mastery in Sciences in Sciences of the Computation, at the CENIDET (Centro Nacional de Investigación y Desarrollo Tecnológico), in the specialty in Artificial Intelligence. His interest areas are: Vision Artificial, Fuzzy Logic, 3D modeling.
Edgar Colorado Soto. Was born in 1981 in Veracruz, Mexico. He obtained the Bachelor's Degree in information technology by the Instituto Tecnologico de Orizaba in 2004. At the moment he studies the Masters in Sciences in Sciences of the Computation, in the Centro Nacional de Investigación y Desarrollo Tecnológico (CENIDET), in the specialty of Artificial intelligence. His areas of interest are: Artificial Vision, Digital Processing of Images, Patterns Recognition, Artificial Intelligence, Data bases, Web Applications.
Luis E. Morán L. Received his B.S. degree in 1996, and the M.S. degree in 2002, both in computationals systems engineering from the University of Colima. Actually he is coursing the Ph.D in the National Center of Investigation and technologic development, his work is about of visual speech recognition. His research interests include, artificial vision, pattern recognition and biometrics.
Maricela Claudia Bravo Contreras. Received her MSc degree in Computer Science, from the National Centre of Research and Technological Development in 2003. She is currently studying the third grade of the doctoral program in Computer Science in the same centre. Her main research area is design of ontologies oriented to solve communication aspects in distributed agent environments.

Ken Christensen. Ken Christensen received his PhD in Electrical and Computer Engineering from North Carolina State University in 1991 under the supervision of Arne Nilsson. Before joining USF in 1995, Ken was an Advisory Engineer at IBM in the Research Triangle Park. In 1998 and 1999 he was a NASA summer faculty fellow at Kennedy Space Center. Ken received an NSF CAREER award in 1999. In spring 2004 he was a visitor in the Department of Communication Systems at Lund University (Sweden). He is the Coordinator for the IEEE Computer Society student magazine Looking.Forward.
Jonathan Villanueva Tavira. Was born in 1981 in Cuervaca, Morelos. He obtained the Bachelor's Degree in Cibernetics by the Universidad del Sol . At the moment he studies the Masters in Sciences in Sciences of the Computation, in the Centro Nacional de Investigación y Desarrollo Tecnológico (CENIDET), in the specialty of Artificial intelligence. His areas of interest are: Robotics , Neural Networks , Hybrid Neuro Symbolic-Systems.
Andrea Magadán Salazar. Andrea Magadán Salazar received the M. S. degree in computer science with speciality in Artificial Intelligence by the National Center of Research and Technological Development, of Cuernavaca Morelos in 1999. Actually she is research–professor of the same center. Her main research interest includes Pattern recognition, artificial vision, visual inspection and speech recognition.

www.cenidet.edu.mx