looking for balance in the canadian housing and mortgage...
TRANSCRIPT

Looking for Balance in the Canadian Housing and Mortgage Markets
June 2016
Table of Contents
Page 1.0 Introduction and Summary 2 Introduction 2 Housing Markets in Canada 3 A Scan Across the Provinces’ Resale Housing Markets 3 Are Foreign Investors Buying More Canadian Homes? 3 Is There a “Housing Bubble” in Canada? 4 Does the Government Need to Intervene Again? 5 About Mortgage Professionals Canada 6 About the Author 6 Disclaimer 6 2.0 Housing Markets in Canada 7 3.0 A Scan Across the Provinces’ Resale Housing Markets 11 Newfoundland and Labrador 12 Prince Edward Island 13 Nova Scotia 14 New Brunswick 15 Quebec 16 Ontario 17 Manitoba 18 Saskatchewan 19 Alberta 20 British Columbia 21 4.0 Are Foreign Investors Buying More Canadian Homes? 22 5.0 Is There a “Housing Bubble” in Canada? 27 6.0 Does the Government Need to Intervene Again? 35

Mortgage Professionals Canada June 2016 “Looking for Balance” Page 1
1.0 Introduction and Summary Introduction Since the fall of 2005, Mortgage Professionals Canada (and its predecessor organizations) has published semi-annual reviews of the housing and mortgage markets in Canada. Prior editions of the reports were largely based on consumer surveys, allowing us to create original data on consumer choices in the housing and mortgage markets. In those reports we also provided our views on evolving conditions in the housing market and the implications for the mortgage market. The reports commented on government policies that affect mortgage lending and, therefore, will affect housing activity and the broader economy. In particular, we have been very critical of a change that was made to mortgage insurance criteria as of July 2012 (the elimination of mortgage insurance for mortgages with amortization periods exceeding 25 years). At this time, we are hearing calls for more changes to “macro-prudential regulation”. The proponents want to make mortgage finance more difficult to obtain. That will result in reduced housing activity and, thereby, slow the growth rate for mortgage indebtedness. Given the importance of housing activity to the national economy (especially since investment in energy projects is no longer a driver of growth), we are hopeful that any changes will be based on a careful consideration of the tradeoff between caution in the mortgage market versus overall economic growth. That hope provided the title for this report. We are encouraged by the federal Finance Minister’s statement: “We're making sure that we have a deep dive into the information to ensure that any considerations we have for change are evidence-based”. This report is our “deep dive into the information”, and we sincerely hope to advance the conversations by providing our interpretations of key evidence. Mortgage Professionals Canada looks forward to further discussions with the government and other interested parties. Major sections of this report are:
• Introduction and Summary • Housing Markets in Canada • A Scan Across the Provinces’ Resale Housing Markets • Are Foreigners Buying More Canadian Homes? • Is There a “Housing Bubble” in Canada? • Does the Government Need to Intervene Again?
In addition to this report, Mortgage Professionals Canada has recently published a report on “The Next Generation of Homebuyers”, which examined opinions, expectations and characteristics of Canadians who expect to become homeowners in future.

Mortgage Professionals Canada June 2016 “Looking for Balance” Page 2
Housing Markets in Canada In the post-recession period, housing activity has generally been less robust than prior to the recession. This is consistent with the changed state of the Canadian economy: the share of Canadian adults who have jobs is lower now than before the recession. But, exceptionally low mortgage interest rates have been a positive force, resulting in relatively strong housing activity. Most recently, further drops in mortgage rates to a new all-time low have caused housing resales to surge: sales have reached a new all-time high. On a proportional basis (comparing sales to the population) the trend is now close to pre-recession level (despite the weaker employment situation and confirming the power of low interest rates). For a long time, housing markets have been under-suppled in Canada (as evidenced by sales-to-new-listings ratios that exceed their thresholds for “balance”). The result has been a long period of rapid price growth. During the post-recession period, the degrees of under-supply have been less severe than pre-recession and, therefore, the rates of price increase were reduced (although still quite high). The recent surge in sales has, once again, sparked a very high sales-to-new-listings ratio, and the rate of price growth has accelerated. The recent strength of the housing indicators is largely centred in two major market areas: Vancouver and Toronto, and their surrounding areas. A Scan Across the Provinces’ Resale Housing Markets In this section, each of the 10 provinces is profiled via six charts and very brief commentary. Are Foreign Investors Buying More Canadian Homes? We do not have good data on purchases of Canadian homes by foreign investors. But, in Vancouver, there is a great volume of anecdotal information that is convincing: activity by foreign investors is distorting the housing market. Observers are now starting to question if a similar effect is developing in Toronto. In this section of the report, some indirect evidence is developed via comparison of data on price increases from the Teranet/National Bank House Price Index versus data on average selling prices from the Canadian Real Estate Association (CREA). The analysis concludes that in Vancouver and Toronto, activity is shifting into the upper reaches of the housing spectrum. This is consistent with increased buying by affluent foreign investors, although it is not conclusive proof. In the nine other market areas covered by the Teranet data, similar effects are not present.

Mortgage Professionals Canada June 2016 “Looking for Balance” Page 3
Given the available data, it may be impossible to measure buying by foreign investors with any reasonable accuracy, and it would be even more difficult to measure the consequences. Meanwhile, the housing market distortions will continue. In the absence of conclusive information, we need to move ahead. There is need for a good discussion on what, if anything, should be done. We need research on best practices internationally. If it is agreed that action is necessary, then action needs to be taken. Any policies that are implemented will generate administrative data that can support better research on the dimensions of the issue and its consequences. Is There a “Housing Bubble” in Canada? Since at least 2008, there have been repeated bursts of commentary that there is a housing bubble in Canada. Those comments have generally assumed that rapid growth in house prices (or a rising ratio of house prices versus incomes or of house prices versus rents) is sufficient evidence of a bubble. To the contrary, these supposedly strong indicators are not definitive proof. They may actually represent healthy outcomes within existing conditions. Proof of a bubble requires two findings:
1. There are expectations of price growth that are self-fulfilling – that the expectations of growth lead to increased (and excessive) activity in the market, which drives the price growth
2. Prices diverge significantly from what should be expected based on economic fundamentals
On the first condition, the author’s statistical research into Canadian housing markets suggests that growth of house prices has very little influence on market activity and, therefore, there is no evidence of a “speculative mindset”. There is evidence of a moderate effect in British Columbia, but even in BC the effect is nowhere near as strong as occurred in the US during its bubble period. On the second condition, the critical economic fundamental is that very low interest rates have created “affordability space” in which house prices could rise. The amounts of actual increase in local markets have varied, depending on local conditions. The key finding here is that, in the 11 major market areas that are included in the Teranet/National Bank House Price Index, none have fully consumed the affordability space that has resulted from low interest rates. As such, we can conclude that the rapid rises of housing prices are consistent with economic fundamentals. Another way to interpret the data (which is hopefully clearly evident in the charts shown in this section) is that housing affordability is currently very favourable almost everywhere in Canada. This is resulting in strong housing activity and supporting the broader economy. This support is increasingly valuable, given that investment in energy projects is no longer a driver of growth.
Mortgage Professionals Canada June 2016 “Looking for Balance” Page 4
This report concludes that housing bubbles do not exist in Canada. These findings explain why the countless predictions of doom have not been proven correct. That said, the economic fundamentals can change. In particular, a non-trivial and sustained rise in mortgage interest rates (or a sharp economic downturn) could put current prices offside and lead to price reductions. There is risk in the policy arena. Changes in mortgage lender or insurer policies that reduce access to mortgages would result in a significant change in fundamental conditions, leading to an unnecessary drop in housing demand and housing prices, causing consequent economic damage. Assessment of risks in the housing and mortgage markets should give considerable attention to the outlooks for interest rates and the employment situation. Someone who holds strong expectations about adverse changes for the fundamentals could see very substantial risks. On the other hand, someone who does not expect adverse changes for the fundamentals should see limited risks in the housing and mortgage markets. Does the Government Need to Intervene Again? There are widespread calls for further tightening of mortgage lending conditions in Canada to address what is considered excessive risk. By making it more difficult to obtain mortgages, the policy changes would reduce housing activity and, thereby, slow the growth rate for indebtedness. Based on available data, we don’t see any evidence of a widespread increase in risk taking by borrowers or lenders.
• Data from the Canadian Bankers Association shows a very low rate of mortgage arrears, just 0.28% or one per 354 mortgages
• Our survey data continues to show that Canadians are highly motivated to pay off their mortgages as quickly as possible
• At current very low interest rates, regular mortgage payments result in accelerated pay down of mortgage principals. At a current typical interest rate of 2.5%, 2.9% of the principal is repaid in the first year
• Our review of housing market data convinces us that changes in housing prices are fully respective of interest rates (this is illustrated in the section on bubbles) and borrowers’ ability to pay. As a result, rising housing prices do not automatically equate to increased risk
If there is any evidence of increased risk-taking, it would be found in the files of the companies that make the mortgage loans. It would be greatly in the public interest for them to share their data. For example, does their data show any adverse changes in Gross Debt Service Ratios and Total Debt Service Ratios? In particular, a few senior executives in the financial services sector claim to see increased risk and are calling for tighter lending criteria. We would be interested in seeing the supporting data.

Mortgage Professionals Canada June 2016 “Looking for Balance” Page 5
The greatest opportunity for productive information sharing is among the vast files within the mortgage insurance business of government agency Canada Mortgage and Housing Corporation (CMHC). Sharing of CMHC data would support better research and decision-making inside and outside of government. Housing has been a key economic leader throughout the post-recession period. Now that investment in energy projects is no longer sharing the load, a healthy housing sector is even more essential. It would be tragic to unnecessarily impair this key economic driver. From our perspective, the greatest risk to the housing market (and consequently to the broader economy) is not reckless consumers or lenders – it is needless policy changes. About Mortgage Professionals Canada Mortgage Professionals Canada (formerly CAAMP) is Canada’s national mortgage broker channel association representing more than 11,000 members from coast to coast. We recognize that Canadians need and deserve more. We believe in competition as it produces better options and demands ever-improving service and products. We believe in choice as it benefits Canadians and delivers an environment of opportunity. We believe in professionalism as it demonstrates commitment, trust and excellence. The mortgage broker channel is a critical and valuable profession. It creates possibility, fuels the economy and provides Canadians with choice when making among the most important financial decisions of their lives. About the Author This report has been prepared for Mortgage Professionals Canada by Will Dunning, Chief Economist. He has specialized in the analysis and forecasting of housing markets since 1982. In addition to acting as Chief Economist for Mortgage Professionals Canada, he operates an economic analysis consulting firm, Will Dunning Inc. Disclaimer This report has been compiled using data and sources that are believed to be reliable. Mortgage Professionals Canada, Bond Brand Loyalty, Will Dunning and Will Dunning Inc accept no responsibility for any data or conclusions contained herein. The opinions and conclusions in this report are those of the author and do not necessarily reflect those of Mortgage Professionals Canada or Bond Brand Loyalty.

Mortgage Professionals Canada June 2016 “Looking for Balance” Page 6
2.0 Housing Markets in Canada A combination of extremely low mortgage interest rates and moderate rates of job creation is currently very stimulative for housing activity in Canada. As is illustrated in the chart to the right, mortgage interest rates are exceptionally low in Canada. The chart shows the author’s estimates of typical market rates for major lenders. Most discussion in Canada of mortgages and housing affordability relies on Bank of Canada data for “posted” rates. The current posted rate for 5-year fixed-rate mortgages is 4.64%, versus the 2.5% rate shown in this chart. The gap between posted versus actual rates has gotten increasingly large over time, and that change has implications for the reliability of any analysis that uses posted rates. Job creation has slowed in Canada to a moderate rate. During the past three years, estimated job growth has averaged 0.7% per year. This is slower than the 1.1% growth rate for the adult population. In consequence, the percentage of the adult population that is employed (the “employment rate”) has slid during the past three years. In the resale housing market, the positive effects of very low interest rates are outweighing the negative effects of weakened job creation: as is illustrated, resale activity is now at a record level, just slightly ahead of the prior record seen before the recession of 2008/09. During normal times in the past, job creation has been the predominant driver of housing activity: market activity is currently stronger than we might expect, based on the employment

Mortgage Professionals Canada June 2016 “Looking for Balance” Page 7
situation alone. But, record-low interest rates make this an unusual time, in which interest rates have greater influence. There is uncertainty about how market outcomes might evolve, given this mix of a very strong positive factor and the slightly weak factor of slower job creation (of course, there is always uncertainty about the future). We should expect that resale housing activity will trend upwards over time. The stock of existing housing is growing and, therefore, there are more dwellings that could potentially be sold. There are also more people who could potentially buy. This chart responds to that, by showing the rate of sales per adult. The sales rate is currently quite high, although not as high as the prior peak in 2007. This is appropriate, as employment conditions are not as strong as pre-recession (based on the employment rate). While sales have surged, supply has not kept up (the flow of “new listings” into the resale market is actually a bit lower than previously). The result of strong demand and flat supply means that the “sales-to-new-listings ratio” has increased. While the ratio is not higher than was seen during most of the 2000s, it is at a level that shows “a sellers’ market” (for all of Canada, the threshold for a “balanced market” appears to be just over 50%). The imbalance between supply and demand is resulting in rapid price growth for Canada as a whole (although there are significant differences across the regions of Canada, as will be shown later). During the past five years, the average resale price in Canada (as reported by CREA) has increased by an average of 6.4% per year.

Mortgage Professionals Canada June 2016 “Looking for Balance” Page 8
House price growth in Canada has been very strong for a long time. Price growth had been slightly slower in the post-recession period than pre-recession, but the rate of increase has now accelerated. Regional differences are explored later, and it will be seen that the recent acceleration is largely centred in two major market areas – Vancouver and Toronto. In most regions, price growth remains slower than before the recession. Housing starts in Canada are quite variable from month-to-month, but the trend has been relatively flat for the past six years. Starts activity is weaker than before the recession, which is appropriate, given that the employment situation is less robust than pre-recession. While housing starts have been relatively stable for some time, the composition of activity has shifted. Previously, low-rise construction (single-detached, semi-detached and townhomes) predominated. During the past 12 months, low-rise activity has accounted for 49% of starts in urban areas of Canada, lower than the 51% for condominiums. Yet, potential homebuyers in Canada show a strong preference for low-rise options. The spring 2016 survey by Mortgage Professionals Canada found that among potential homebuyers, just 18% picture themselves owning a condominium. The 58% who hope to buy a single-detached home and the 21% who hope for a semi-detached or row home are facing increasing challenges, especially in Toronto and Vancouver. Expectations about types of future homes are fairly consistent across the country (the share looking for condominiums is below the national average in the Atlantic provinces and Saskatchewan, and close to the national average elsewhere).

Mortgage Professionals Canada June 2016 “Looking for Balance” Page 9
Table 1
Expectations About Housing Forms for Future Homebuyers
Province Single-Detached
Semi-Detached or Townhome Condominiums Other Total
Newfoundland and Labrador 60% 33% 7% 0% 100%
Prince Edward Island 50% 0% 0% 50% 100% Nova Scotia 62% 17% 14% 7% 100% New Brunswick 80% 10% 10% 0% 100% Quebec 63% 17% 17% 3% 100% Ontario 56% 23% 19% 2% 100% Manitoba 65% 4% 26% 4% 100% Saskatchewan 68% 23% 9% 0% 100% Alberta 59% 17% 22% 3% 100% British Columbia 50% 26% 22% 2% 100% Total 58% 21% 18% 3% 100% Source: survey by Bond Brand Loyalty for Mortgage Professionals Canada, spring 2016; analysis by the Author. Evolving housing activity has brought changes in the rate at which mortgage credit is growing. During the five years before the recession, high volumes of housing construction, on top of robust resale market activity and rapid growth of house prices, resulted in very fast mortgage credit – an average of 10.6% per year. Growth slowed after the recession, but was still rapid. More recently, growth rate picked up, due to strong resale market activity. But growth remains far below the pre-recession figures.

Mortgage Professionals Canada June 2016 “Looking for Balance” Page 10
3.0 A Scan Across the Provinces’ Resale Housing Markets In this section, trends are briefly reviewed for each of the 10 provinces. Six charts are shown for each province, profiling the evolving employment situations (using the “employment-to-population ratio”, also known as the “employment rate”). For each province, five charts examine conditions in resale housing markets. Since the data can be volatile from month-to-month, trend lines have been added (the smooth red lines). In these discussions, reference is sometimes made to “data artifacts” in the employment data. Statistics Canada’s Labour Force Survey is based on a sample survey and has a “margin of error” – in other words, the data is sometimes wrong. Due to the design of the survey, any non-representative estimates tend to persist in the data for about six months. As such, the published data can give misleading pictures of one of the fundamental conditions that drives housing markets. In some cases, this analyst examines the employment data and decides that it should be used cautiously.

Mortgage Professionals Canada June 2016 “Looking for Balance” Page 11
In Newfoundland and Labrador, employment conditions have weakened, although the employment rate is still higher than before 2010 (the dip seen during the past winter may have been a “data artifact”, as the most recent data shows a return to about 54%). Resale activity is close to the prior peak, as low interest rates have offset the effect of the weaker economy. The sales-to-new-listings ratio is below the balanced market threshold (estimated at 42%). The average resale price is flat to slightly declining: the last four data points show larger reductions, but it is too soon to call this a trend, as it may have resulted from a change in composition (more sales in lower price ranges).

Mortgage Professionals Canada June 2016 “Looking for Balance” Page 12
For Prince Edward Island the highly volatile data makes it especially difficult to identify trends for any of these indicators. Employment conditions had appeared to be favourable. The recent sharp drop for the employment rate has characteristics of a “data artifact” (and a corresponding rebound might be reported in the coming months). The sales trend is exceptionally strong. Recent activity in part makes up for the slowdown that followed the July 2012 elimination of 30-year amortization for insured mortgages. It isn’t possible to estimate a balanced market threshold for PEI. That said, weaker sales after the recession of 2008-09, and again after mid-2012, resulted in a moderation of price growth (with the trend now in the area of 3-4%).

Mortgage Professionals Canada June 2016 “Looking for Balance” Page 13
The Nova Scotia economy has clearly weakened due to some major layoffs. The housing market shows the consequences. In this context, recent exceptionally low mortgage interest rates have provided only a small boost and the sales rate trend is now about 15% below prior levels. The sales-to-new-listings ratio has recently been close to the balanced market threshold (which is estimated at 44%). Correspondingly, the price trend flattened. The recent slight improvement in resale market conditions appears to have resulted in a small rise in prices.

Mortgage Professionals Canada June 2016 “Looking for Balance” Page 14
In New Brunswick, the employment data shows weakening during the past seven years, although the sharp movements in recent data leaves us with considerable uncertainty about the true state of affairs. The resale market data show the consequences of weaker employment. Recent very low interest rates have provided a modest boost to activity, and the sales rate (sales per adult) is about 10% below the prior peak. For New Brunswick, the balanced market sales-to-new-listings ratio is estimated at 43%. Since the policy change in July 2012, the actual ratio has been at or below that threshold, resulting in a flat average resale price.

Mortgage Professionals Canada June 2016 “Looking for Balance” Page 15
In Quebec the employment rate has trended slightly downwards during the past half-decade, at about the rate we might expect due to the aging of the population (more people moving into retirement). Resale activity (in terms of sales, and even more so in terms of the rate of sales per adult) has been considerably below the level seen prior to the recession and the 2012 policy change. The current very low mortgage interest rates have resulted in some recovery. Even so, the trend of the sales rate is still one-tenth below the peak level. The balanced market sales-to-new-listings ratio for the province is estimated at 39%. The actual rate has fallen but remains above that threshold. Consequently, price growth continues, but at a low rate.

Mortgage Professionals Canada June 2016 “Looking for Balance” Page 16
The Ontario economy was harshly affected by the recession of 2008-09. A brief recovery was interrupted, and since then the employment rate has trended downwards. In the resale market, the trend for units sold was flat for most of the post-recession period, which meant that the trend slid for sales per adult. During the past two years, low interest rates have driven strong growth in sales. The balanced market sales-to-new-listings ratio is estimated at 50%. With the ratio consistently above that threshold, the average resale price has increased rapidly. For the past year, the ratio has exceeded 60% and price growth has accelerated. The imbalance can be mainly attributed to a decade-long shortage of new housing construction in the Toronto-centred region.

Mortgage Professionals Canada June 2016 “Looking for Balance” Page 17
In Manitoba, employment conditions peaked in early 2008, and since then there has been progressive weakening. The highly volatile data makes interpretation difficult, but it appears that weakening was gradual until about the start of 2013 and sharper since then. With the weaker economic environment, resale activity on a per adult basis had weakened. Still, low interest rates have recently stimulated increased activity. The balanced market sales-to-new-listings ratio is estimated at 58%. Previously, a very high actual ratio resulted in very rapid price growth. The ratio is now below the threshold and price growth is currently minimal.

Mortgage Professionals Canada June 2016 “Looking for Balance” Page 18
The volatile employment data for Saskatchewan makes it difficult to draw a conclusion about the trend: the drop seen for the last six months could be a “data artifact”, in which case the “true” employment rate might be almost flat. Yet, the housing market data provides a strong suggestion of economic weakness. For the sales rate (per adult) the trend is down by about 15% from a few years earlier. With the volatile data for the sales-to-new-listings ratio and for price growth, it is impossible to estimate a balanced market threshold. Yet, the market is now clearly over-supplied, with the average house price flat or falling.

Mortgage Professionals Canada June 2016 “Looking for Balance” Page 19
The Alberta economy was weakening during 2013, and this has been aggravated by the subsequent plunge in the price of oil. (But, the further large drop during April and May has characteristics of a “data artifact”.) In addition, population growth has slowed sharply (by about a third and possibly more). Housing demand has been greatly reduced. Sales activity in numbers of units remains mid-range, but the province sees rapid population growth and, on a per adult basis, housing market activity has fallen sharply. The balanced market sales-to-new-listings ratio is estimated at 56%. During the past nine months, the actual ratio averaged 46.5%, and this appears to be resulting in a small amount of price reduction (an annualized rate of about 1% per year, which is what the statistical analysis would predict).
Mortgage Professionals Canada June 2016 “Looking for Balance” Page 20
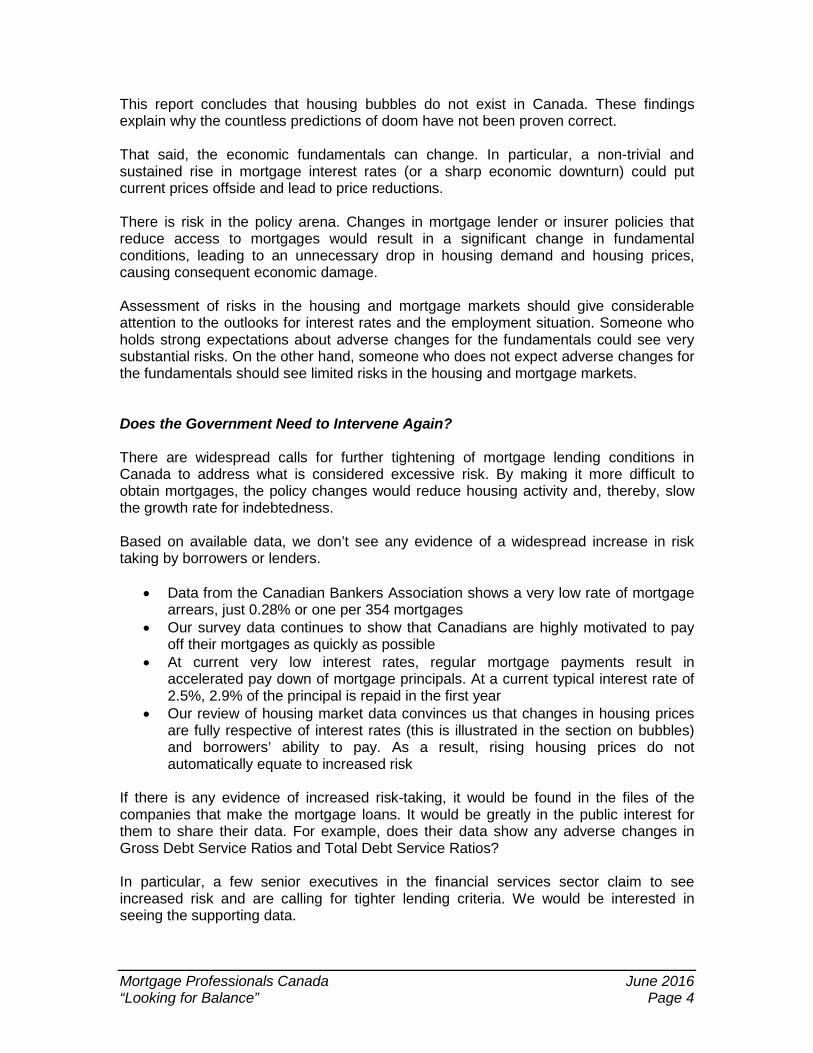
For British Columbia the employment data shows a small amount of recovery during recent months. In addition, the rate of population growth has increased during the past year (by about a quarter and possibly more). Resale housing market indicators show overheating. This may be partly catchup following a weak period during 2010 to 2013. The balanced market sales-to-new-listings ratio is estimated at 47%. During 2010 to 2013, the ratio was close to the threshold, resulting in a period of slower price growth. More recently, the stratospheric ratio is associated with stratospheric price growth. Prolonged rapid growth of the provincial average price has originated in inadequate amounts of new low-rise construction in the Vancouver-centred region. Deficient supply has been compounded by increased offshore buying.

Mortgage Professionals Canada June 2016 “Looking for Balance” Page 21
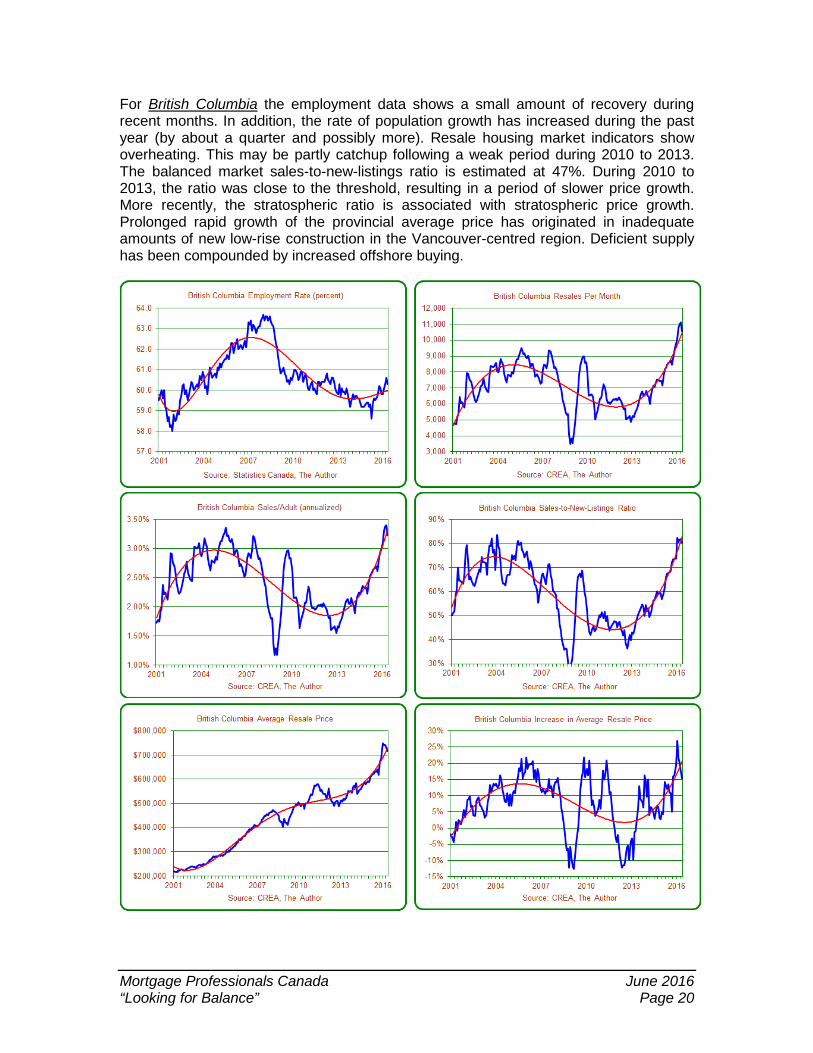
4.0 Are Foreign Investors Buying More Canadian Homes? There is widespread agreement that foreign investors are very active in the Vancouver housing market, to the extent that prices are rising even more rapidly than they might (based on the prolonged supply shortage). More recently, observers are beginning to ask if the Toronto housing market is also experiencing added heat from foreign buying (again, on top of prolonged shortages). Since we don’t have data that measures the extent of foreign buying in Canada, we also, therefore, don’t know to what extent that activity is distorting volumes or contributing to price rises. On several occasions CMHC has attempted to estimate the extent of foreign buying in segments of Canadian housing markets. And, more recently, the government has asked Statistics Canada to try its hand. It is possible that no reliable estimates can be developed on foreign buying within a timeframe that would allow for effective policy responses. Yet, there is sufficient anecdotal evidence: we should accept that foreign buying is very substantial in Vancouver and that the Vancouver housing market is being severely distorted in consequence. In Toronto, we do not have the same amount of anecdotal evidence, but the recent great strength in the market and an acceleration of price growth have led to suggestions that a similar set of effects may now be developing. This section utilizes data from 11 major market areas in Canada (covered by the Teranet/National Bank House Price Index). The attempt here is to create some evidence that might be attributable to changing activity by foreign buyers. The 11 charts compare growth rates in two data sets of house prices: the average prices reported by CREA versus the price changes shown by the Teranet/National Bank House Price Index. CREA numbers can be influenced by changes in market “composition”, whereas Teranet data is not affected by composition. By design, it attempts to estimate “pure price” changes. As such, where there are big differences in the two data series, the most likely cause has been a change in the composition of the market. When CREA data shows larger rises than Teranet, it is likely that activity has shifted into the higher reaches of the market. Conversely, there are periods when CREA shows less increase than Teranet, which indicates a downshift in the composition. For some time, the Vancouver data has shown distinct waves of distortion (relatively long periods in which one of the two datasets shows greater increases than the other). These most likely have been due to changes in composition. In Toronto, by contrast, for most of this history, there have been differences between the two sets of estimates, but those differences are usually not as large as in Vancouver. Toronto is changing: there has been a large gap most of the time over the last 15 months, with CREA changes

Mortgage Professionals Canada June 2016 “Looking for Balance” Page 22
considerably larger than Teranet changes. This tells us that, in Toronto, there has been a significant shift in composition, with a substantial rise in high-end activity. A further consideration is that, in both Vancouver and Toronto, we are currently seeing extremely high sales levels. In both Vancouver and Toronto, there has been strong locally-generated demand across the spectrum due to favourable combinations of job creation and affordability (affordability is discussed in the next section). On top of that broad strength, there is evidence of elevated activity within the high-end housing markets in both places. The interpretation offered here is that incremental activity from foreign buyers is further increasing total sales activity (and distorting the average price). In these supply-constrained markets. This, in turn, is accelerating the rates of actual price growth. Rapid sales and price pressures in the high end of these markets are forcing some buyers who would like to buy in the high end to look at sequentially lower parts of the market, and causing those pressures to spread downward within the price spectrums. Notably, other data provided by CREA (through its House Price Index) shows that, in Vancouver and Toronto, rates of price increase are now much higher for single-detached homes than they are for lower-priced townhomes and condominiums. In other centres covered by the CREA index, that pattern is absent. The data from Vancouver and Toronto is exactly what we would expect if foreign buying is being added to local demand: wealthy foreign buyers will target prestigious and high-priced locations. The data does not prove conclusively that foreign buying is adding to the heat in these to markets, but it is consistent with the idea. Among the remaining nine out of eleven centres in the Teranet dataset:
• In the data for Montreal, during the past 18 months, increases in CREA data have been higher than Teranet increases, but the differences are not very large. In addition, the pace of activity is much less frenetic than in Vancouver and Toronto, and price increases are tame. As a result, it appears that, if foreign buyers are playing any role, it is minor in Montreal. More likely, the change in composition might be due to increased ability of local buyers to purchase at higher levels within the local price spectrum, due to the combination of very low interest rates and low prices (which is the result of modest price growth over the past three years)
• In Calgary, there was a period of about a year (early 2014 to early 2015) during which CREA’s average price increased by less than Teranet’s index, indicating a downshift in the composition of sales. This probably does not relate to foreign buying. It was more likely caused by increased first-time buying
• In seven centres (Halifax, Quebec, Ottawa-Gatineau, Hamilton, Winnipeg, Edmonton and Victoria), CREA data on changes in average prices is quite volatile. As a result, there are often large differences between the two estimates. But, those differences are random, with no sustained periods in which the differences are moving in the same direction. For those seven locations, the price changes shown by CREA data are broadly consistent with Teranet data. There is no discernible evidence that CREA prices are being distorted by sustained changes in composition, and this data suggests that foreign buying is not significant in these market areas
Mortgage Professionals Canada June 2016 “Looking for Balance” Page 23
A further note on the charts for Vancouver and Toronto: in Vancouver data, the gap has closed in recent months, and for May the CREA growth rate was lower than the rate from Teranet. Although it is too soon to say there has been any kind of turning point, this recent situation indicates that activity is not currently shifting upward. This could be caused by a stabilization of activity by foreign buyers (quite possibly at a high share of the total market). In Toronto, on the other hand, the gap seems to be growing, showing that there is now increased shifting into the upper reaches of the market, which might mean that foreign buyers are currently becoming more active.

Mortgage Professionals Canada June 2016 “Looking for Balance” Page 24
Regarding foreign buyers, there is no point in waiting for better evidence of their role (and we are unlikely to find better evidence any time soon). Based on the anecdotes in combination with the implications that we can tease out of the data, we should be confident that foreign buying is a major incremental factor that is resulting in over-heating, certainly in Vancouver for a long time, and possibly now in Toronto. At this point, rather than waiting for conclusive evidence about buying by foreign investors, we should start a discussion on what – if any – policy responses are warranted. No opinion on that is being offered here. All of this said, there have been suggestions that there are impacts on tax collection in Canada, which ought to be addressed.

Mortgage Professionals Canada June 2016 “Looking for Balance” Page 25
Further, while it might be impossible to create good estimates of foreign buying from existing data sources, some potential policy changes would result in data being created via administrative procedures (in particular from taxation data or in declarations that buyers must make at the time they make purchases). In other words, proceeding with reasonable regulatory changes will, in addition to addressing policy needs, also result in data that can be used later to review and fine-tune the policies. While we have a discussion about objectives, the federal government could quickly compile useful information on best practices internationally. The best of those practices could be introduced in Canada, within a reasonably short period of time. It should be expected that those policies will evolve over time, as we collect stronger data.

Mortgage Professionals Canada June 2016 “Looking for Balance” Page 26
5.0 Is There a “Housing Bubble” in Canada? Since the fall of 2008 (the worst period of the implosion of housing bubbles in the United States), there have been waves of concern in Canada about the possibility of similar events in our country. We are currently experiencing another wave of such worries:
• A report from the Organisation for Economic Co-operation and Development (OECD) calling for more macro-prudential changes to slow homebuying and growth of mortgage credit1
• The Bank of Canada has also weighed in as part of its semi-annual Financial System Review.2 That review points to Vancouver and Toronto, where there has been an increase in mortgages that are at high multiples of the borrowers’ incomes. This is labelled as the “Vulnerability 1”. “Imbalances in the Canadian Housing Market” (notably, rapid price growth in Vancouver and Toronto, and “the possibility that prices are also being supported by self-reinforcing price expectations”) is “Vulnerability 2”
• Media commentary is currently using the “B-word” quite liberally. In bubble discussions, there has not been a lot of clarity about exactly what is a bubble. Most of these opinions equate a bubble with rapid price growth3
A very good definition of bubbles has been provided by American economist Joseph Stiglitz4:
• If the reason that the price is high today is only because investors believe that the selling price will be high tomorrow – when “fundamental” factors do not seem to justify such a price – then a bubble exists
Reading this definition carefully, one ought to conclude that a rapid rise in house prices is not proof that a bubble exists. There are two further criteria:
• First, price growth has been driven by expectations of future growth in prices • Second, prices have become divorced from “fundamentals”
The Bank of Canada is pointing to the first condition, in its concern about “self-reinforcing price expectations”. It is possible that the first condition is now developing in Toronto and Vancouver, but that it is still early days in that process. Before we can use the B-word, we also need to investigate whether the second condition is satisfied. A review is offered below. The conclusion drawn is that house
1 Published June 13: www.oecd.org/eco/surveys/Canada-overview-OECD-economic-survey-2016.pdf 2 Published June 9: www.bankofcanada.ca/wp-content/uploads/2016/06/fsr-june2016.pdf 3 In March 2014, this author published “How to Dissect a Housing Bubble” (unsponsored research). The research calculated “capitalization rates” for owner-occupied housing and concluded that there was still considerable room for house prices to increase. In that sense, housing in Canada could be considered undervalued, in contrast to the consensus that saw enormous overvaluation (with dire implications). That consensus included extreme estimates from the OECD that rely on unsuitable data and should be disregarded. More than two years later, that paper looks increasingly good. 4 “Symposium on Bubbles,” Journal of Economic Perspectives, Volume 4, Number 2, Spring 1990, pages 13-18.

Mortgage Professionals Canada June 2016 “Looking for Balance” Page 27
price growth in Canada, even in Vancouver and Toronto, is still consistent with the economic fundamental of interest rates and affordability (in combination with another economic fundamental of a moderate rate of job creation). It is concluded, therefore, that it is still too soon to speak of a bubble in Canada as a whole or in individual communities. If we are indeed seeing “self-reinforcing price expectations” in some places, however, then localized bubbles could develop if prices become inconsistent with the economic fundamentals. Alternatively, it could happen that there is a significant change to the economic fundamental of low interest rates, to the extent that pricing becomes inconsistent with that fundamental. As an alternative, in the event of a severe economic recession that causes significant numbers of job losses, that fundamental change would reduce housing demand and, thereby, bring about a change in the appropriate level of pricing. A few more thoughts on the first condition:
• Do we see evidence that there is a speculative mindset that causes housing demand to be considerably larger than it should be, and therefore causes prices to rise by considerably more than they should?
• Rapid price growth in itself is not evidence of a speculative mindset. There might be very good reasons for the rapid price growth in economic factors or other local conditions. The price growth might be due to those conditions rather than to speculation
• There is always some pressure in the housing market from an “investment motive” – for decisions to be influenced about expectations for future price changes. Canadians know that house prices rise and, to some extent, see their homes as investments in addition to being a place to live. Prior editions of these semi-annual reports have found that, on average, Canadian homeowners see their homes as 70% a place to live and 30% as an investment. This view is reasonably consistent across the country. It strikes us as a reasonable opinion for people to have, and that this would have only a minor impact on prices
• The question of whether the investment motive is becoming excessive and turning into a speculative mindset is difficult to address directly. There are a great many factors that affect the housing market and the rate of price growth. Disentangling these drivers to draw a conclusion about the influence of one factor in isolation might be an impossible task
• This author has a complex forecasting system for housing markets. It considers various “drivers” that influence housing demand. This includes looking at the extent to which resale market activity is related to recent growth in prices (attempting to quantify the investment motive). The estimated impacts are generally low (single digit percentages) in Canada, except for British Columbia, where the impact is elevated. A 5% rise in BC prices might cause sales to rise by about 10%
• In the historic data that is used in the forecasting system, the first condition has not been met in Canada. It could, however, be a factor in the present or the future
Next, we look at the economic fundamental of interest rates and affordability.

Mortgage Professionals Canada June 2016 “Looking for Balance” Page 28
The analysis shown here uses data from the Teranet/National Bank House Price Index. For each of the 11 centres covered by Teranet data, the analysis combines the price indexes with mortgage interest rates and average wages5. An affordability index is created. The indexes for each of the 11 locales do not tell us how affordable housing is in absolute terms. They look at how affordability has changed over time. The calculations use actual interest rates from the marketplace, not the posted rates that are published by the Bank of Canada. The current rate used here is 2.5% for a five-year, fixed-rate mortgage, not the 4.64% published by the Bank of Canada. This choice of using actual rates from the marketplace has a big impact on outcomes. For each of the 11 locales, two charts are presented below. The first chart looks at the evolving affordability of the total mortgage payment6 (which includes payment of interest and repayment of mortgage principal). The second chart looks solely at the interest component of the payment.
• Most mortgage borrowers are aware that they are repaying their mortgages. The spring 2016 survey by Mortgage Professionals Canada commented to potential homebuyers: “Mortgage payments are composed of both a payment of interest and a repayment of principal. Repaying principal ultimately results in the growth of your equity” and asked them “Have you considered this fact prior to today?” Among those who expect to buy during the coming year, 75% answered “yes”
• They were then asked “And how well would you say you understand this concept?” Among those who expect to buy during the coming year, 53% indicated they have a “full” or “good” understanding of the concept, 36% indicated a “partial” understanding, and just 10% reported “no understanding” or a “weak” understanding
The second component of a mortgage payment (principal repayment) does require the borrower to shell out, but it really is a form of saving since it builds equity in the home. We can call this “forced savings”. At today’s typical mortgage interest rate (2.5%), and assuming an amortization period of 25 years: for the first payment, more than half (53%) is repayment of principal or forced savings. Less than half of that payment (47%), is the interest cost. The chart to the right illustrates that, as interest rates have fallen, “forced savings” has increased. 5 Data for the applicable provinces, for full-time employees, from Statistics Canada’s Labour Force Survey. 6 The index is based on the payment in the first month, based on the data for each month (the interest rate, value of the house price index and the average wage rate). It is assumed that the chosen amortization period is always 25 years.

Mortgage Professionals Canada June 2016 “Looking for Balance” Page 29
For the mortgage borrower, the “effective cost” or “net cost” of the mortgage is the interest component (since the cost of repaying the principal is offset by the reduction in debt). Some people will explicitly consider this (the difference between the monthly cost versus the effective or net cost) when they make a decision to buy a home and take on a mortgage. It is relevant, therefore, to look at housing affordability on the net basis of the interest component only. The second chart in each of the pairs below provides the net-cost index. In theory, consumers’ decisions about mortgage borrowing should be based on the effective interest cost – the principal repayment part of the payment should be irrelevant, as the cost is exactly offset by the benefit. In reality, however, borrowers have to find room in their budgets for both parts of the payment. As a result, decisions will be based on both the total payment and the interest-only part of the payment.7 It can be clearly seen in most of these charts that current affordability is relatively attractive in terms of the total payments (the left-side charts) and exceptionally so on the net cost basis (right-side charts). It can also be seen that there was an earlier period when the cost indexes were far above normal levels: during 2006 to 2008, increased housing prices had increased and mortgage rates rose. This resulted in a disconnection between prices and interest rates. Before then, typical rates had been in the range of 4.5% to 5.0%. By the end of 2007, the typical actual market rate was 6.0%. If these charts portray a worrisome period, it was 2006 to 2008, not the present. Those results are cautionary. If we should see a non-trivial rise in interest rates (say to 3.5% or more, from the current 2.5% or less) that is sustained for more than a few months, the mortgage cost indexes would exceed their normal levels and housing activity would be sharply curtailed. In that event, current prices might be unsustainable in some of these centres. Opinions will differ on the likelihood of substantial, sustained rises in borrowing costs. In Victoria, the current mortgage cost is slightly (3.9%) below the average level. The net cost is currently 34% below its average. On the net basis, affordability in Victoria is currently at the best level in the history of this dataset.
7 The author purchased a house this spring (in the hot Toronto market) and went through exactly that thought process – possibly in more detail than most people would (the calculations included the “opportunity cost” of the down payment and other elements).

Mortgage Professionals Canada June 2016 “Looking for Balance” Page 30
In Vancouver, the current mortgage cost is considerably above the average level (by 29%). But, the net cost is currently 10% below its average. To the extent that borrowers consider the net cost, affordability in Vancouver is currently better than average and close to the best levels seen in prior years.
In Calgary, the current mortgage cost index is far below the average level (15%), and is similar to the low levels seen during the first half of the 2000s. The net cost is currently 41% below its average. On the net basis, affordability in Calgary is currently at the best level in the history of this dataset.
In Edmonton, the current mortgage cost is 13% below the average level. The net cost is currently 40% below its average. On the net basis, affordability in Edmonton is currently at the best level in the history of this dataset.

Mortgage Professionals Canada June 2016 “Looking for Balance” Page 31
In Winnipeg, the current mortgage cost is slightly above the average level (4.6%), the result of very rapid price growth (averaging 6.1% per year over the past 10 years). The net cost is currently 27% below its average. On the net basis, affordability in Winnipeg is currently at the best level in the history of this dataset and slightly better than the previous low seen in 2004.
In Hamilton, the current mortgage cost is 9.6% above the average level (although it is lower than during 2007/2008). The net cost is currently 24% below its average. On the net basis, affordability in Hamilton is close to its best level (seen in 2013).
In Toronto, the current mortgage cost is notably above the average level (12%). The net cost is currently 22% below its average and is close to the lowest level seen (in 2013).

Mortgage Professionals Canada June 2016 “Looking for Balance” Page 32
In Ottawa, the current mortgage cost is notably below the average level (14%). The net cost is currently 40% below its average. On the net basis, affordability in Ottawa is currently at the best level in the history of this dataset.
In Montreal, the current mortgage cost is 5.5% below the average level. The net cost is currently 35% below its average. On the net basis, affordability in Montreal is currently at the best level in the history of this dataset.
In Quebec, the current mortgage cost is fractionally above the average level (0.4%). The net cost is currently 30% below its average. On the net basis, affordability in Quebec is currently at the best level in the history of this dataset.

Mortgage Professionals Canada June 2016 “Looking for Balance” Page 33
In Halifax, the current mortgage cost is far below the average level (17%). The net cost is currently 43% below its average. On the net basis, affordability in Halifax is currently at the best level in the history of this dataset.
Exceptionally low interest rates have created “affordability space” in which housing prices could potentially rise by very substantial amounts. Within each community, actual outcomes are determined by market conditions. Rather than illustrating that housing market bubbles have been created, this data shows that housing markets in Canada are very good at incorporating fundamental economic conditions, as well as other local conditions. Furthermore, the reality of rising amounts of “forced savings” has also limited the amounts that can be borrowed and this has been a constraint on price growth. The indexes of net costs illustrate the extent to which prices have increased to fill the affordability space.
• In Toronto and Vancouver, there are severe supply shortages resulting from prolonged, inadequate new construction of low-rise homes. In Toronto, there has been a supply shortfall of 10,000 low-rise dwellings per year for more than a decade. The consequence is that there are now 100,000 fewer low-rise homes than there should be in Toronto
• In Toronto and Vancouver, large shares of the affordability space have been filled, but not all of it. Prices could rise further and affordability would still be quite good in historic terms
• Elsewhere in Canada, where housing supplies are adequate, the affordability space has been much less used
• In most areas of Canada, house prices have considerable capacity to tolerate higher interest rates. In Vancouver and Toronto there is less capacity, but there is still some capacity
• Disruption of housing markets in Canada would require non-trivial – and sustained – rises in mortgage interest rates. Anyone who believes that these large and sustained rises are coming should be worried about the housing market. People who see a lower-for-longer scenario should be less fretful
A much greater risk to the housing market would be policy changes by mortgage insurers or mortgage lenders that make it harder to finance home purchases. Such errors have the potential to cause a sharp downward adjustment of prices.

Mortgage Professionals Canada June 2016 “Looking for Balance” Page 34
6.0 Does the Government Need to Intervene Again? There are calls from many corners, including the OECD as well as the heads of some of Canada’s largest mortgage lenders, for tightening of mortgage eligibility (“macro-prudential regulation”), to reduce housing demand and slow the growth of mortgage indebtedness. But, we do not have compelling evidence that significant numbers of Canadians are taking unreasonable risks in the housing market. Data from the Canadian Bankers Associations shows that the mortgage arrears rate (0.28% as of March) is close to the lowest all-time rate (0.24% in 2006). The arrears rate, of course, reflects the entire portfolio of mortgages and does not tell us about risks being taken now by new borrowers. Mortgage lenders who are concerned about current risk-taking could very easily and very usefully add to the discussions by publishing data from their own businesses, especially with regard to Gross Debt Service Ratios and Total Debt Service Ratios:
• To what extent do these ratios vary across communities? Are some communities showing more risk-taking than others?
• To what extent have these ratios changed over time? Are the ratios higher now than in the past?
The analysis should not, however, look at averages alone. It would be even more useful to look at the distributions (what are the trends for borrowers at risky levels of the two ratios?). For the executives making public pronouncements about increased risk and the need for policy change, what does their evidence show them? They should open their books. Even more useful, the greatest repository of data on mortgages in Canada resides with an agency of the Government of Canada: CMHC. CMHC has great data assets that would assist the government in its “deep dive” into the housing and mortgage markets. In the spirit of transparency and evidence-based decision-making, it would be helpful if CMHC enabled interested Canadians to become engaged, by publishing vast reams of data and analysis from its own files, to allow non-government groups (like Mortgage Professionals Canada) and individuals (including academics and consultants) to contribute to the interpretation and subsequent discussion of policy options. CMHC could go even farther, by providing microfiles (records of actual, individual mortgages, with identifying data removed) to qualified researchers, much like Statistics Canada provides microfiles from its surveys.

Mortgage Professionals Canada June 2016 “Looking for Balance” Page 35
A broad sharing of information would undoubtedly result in better decisions, in an area that has become highly critical for the economic wellbeing of Canada. We suspect, but await proof, that a fulsome analysis will find that Canadians (borrowers and lenders) are not taking undue risks. We also suspect that the analysis will yield results analogous to the findings in the prior section. The ultimate conclusion might be that, while low interest rates have resulted in more indebtedness, the burden of those debts has not become more onerous. Looking more conceptually:
• Central banks in Canada and elsewhere have encouraged low interest rates in order to stimulate economic growth
• Low interest rates only work if they encourage more borrowing • The impacts of low interest rates (and the growth of the associated
indebtedness) will be greatest in major parts of the economy that are most sensitive to interest rates. In Canada (and elsewhere) the largest interest-sensitive part of the economy is the housing market
• No one should be surprised that low interest rates have resulted in increased mortgage borrowing
• The question is whether the borrowing is sustainable. Under current conditions (at current interest rates and with recent rates of job creation), it appears that the debt is highly sustainable (although it is important to test this with reference to data on actual mortgages, as was discussed earlier)
• From here, the most important element of uncertainty and the greatest risk factor is not the level of indebtedness, but whether the economic fundamentals will be sufficiently stable
• In conclusion, when a central bank encourages low interest rates to stimulate the economy, but then is worried about the borrowing that results, there is a fundamental disconnect in its thinking
Canada has long-established and reasonable criteria for mortgage lending. The low arrears rate (just 0.28%) was illustrated earlier. Moreover, as the semi-annual reports from Mortgage Professionals Canada have demonstrated repeatedly, Canadians are highly motived to repay their mortgages and most mortgages are fully repaid in considerably less time than the original amortization periods. A previous section suggested that pressures from outside Canada are significantly affecting two major market areas. Changing mortgage lending criteria in response to those pressures would unnecessarily punish Canadians who have reasonable expectations of home ownership. As well, those policy changes would unnecessarily impair housing markets in Canada, which would have economic consequences. Prior editions of the reports from Mortgage Professionals Canada (and its predecessor organizations) have commented extensively on a change to mortgage insurance criteria that was imposed in July 2012. This change (eliminating amortization periods of more than 25 years) significantly impaired housing activity and continues to have costs. There is evidence that the July 2012 change is still causing housing market activity to be less than it would otherwise be, and is, therefore, impairing job creation in Canada.

Mortgage Professionals Canada 2005 Sheppard Ave. E., Suite 401, Toronto, ON M2J 5B4 Tel: 416-385-2333/888-442-4625 • [email protected]