looking for answers to the food security problem
TRANSCRIPT

Copyright © UNU-WIDER 2006 1 Institute of Economic Growth, Delhi University, email: [email protected]; 2 UNU-WIDER, email: [email protected]
This paper was prepared for the UNU-WIDER project on Hunger and Food Security: New Challenges and New Opportunities, directed by Basudeb Guha-Khasnobis. The project was carried out in collaboration with the Indian Council of Social Science Research (ICSSR) and the UN Food and Agriculture Organization (FAO).
UNU-WIDER gratefully acknowledges the financial contributions to its research programme by the governments of Denmark (Royal Ministry of Foreign Affairs), Finland (Ministry for Foreign Affairs), Norway (Royal Ministry of Foreign Affairs), Sweden (Swedish International Development Cooperation Agency—Sida) and the United Kingdom (Department for International Development).
ISSN 1810-2611 ISBN 92-9190-907-6 (internet version)
Research Paper No. 2006/123
Looking for Answers to the Food Security Problem
India under Current Compulsions
Nilabja Ghosh1 and Basudeb Guha-Khasnobis2 October 2006
Abstract
Food insecurity at the household level has become unacceptable in India where the economy is growing at high rates and food sufficiency is already achieved at the macro-level. Food security has always been an important issue in the Indian political economy and was addressed by numerous poverty-eradication and rural development programmes that emerged and evolved with time. In recent times of liberalization, the programmes are intended to be more targeted and integrated with other social objectives through innovative designing. In particular, the government is all set to using public works programme, which is nothing new to India or other developing countries, as a nationwide instrument to confer earning opportunity to rural people backed by legal reinforcement. This paper reviews the strategies and instruments in India that impinge on household food insecurity. The paper also examines how far the existing public works programmes in select four states target the households that are likely to be food insecure.
Keywords: food insecurity, public works programmes, poverty alleviation, cereal consumption JEL classification: I38, D63, H75

The World Institute for Development Economics Research (WIDER) was established by the United Nations University (UNU) as its first research and training centre and started work in Helsinki, Finland in 1985. The Institute undertakes applied research and policy analysis on structural changes affecting the developing and transitional economies, provides a forum for the advocacy of policies leading to robust, equitable and environmentally sustainable growth, and promotes capacity strengthening and training in the field of economic and social policy making. Work is carried out by staff researchers and visiting scholars in Helsinki and through networks of collaborating scholars and institutions around the world.
www.wider.unu.edu [email protected]
UNU World Institute for Development Economics Research (UNU-WIDER) Katajanokanlaituri 6 B, 00160 Helsinki, Finland Camera-ready typescript prepared by Liisa Roponen at UNU-WIDER The views expressed in this publication are those of the author(s). Publication does not imply endorsement by the Institute or the United Nations University, nor by the programme/project sponsors, of any of the views expressed.
List of acronyms given at the end of the study.
1
1 Introduction
With the advance of agricultural technology, yield rates of food crops in the world and many developing countries have improved considerably and the food problem is no longer one of global or national food shortage (Pinstrup-Anderson 2002). However, household food insecurity associated with insufficient purchasing power may very well coexist with food abundance at global, national or even sub-national levels. It is, in fact, a form of extreme poverty that depletes the productive capacity inherent in people and creates a vicious circle of poverty and incapacity in which food-insecure households also tend to remain poor. Food is a ‘capability’. It is not only an end but also a means to a variety of ends (Harriss-White 1999; Sen 1995).
Household food insecurity has conventionally been battled with mainstream employment and growth-oriented strategies that improve the purchasing power of households and thus ameliorate poverty. However, historically the conventional macroeconomic employment-generating state policies in a developing country most often failed to recognize the complex realities of the labour market (Braun 1995). Thus, they bypassed certain sections of the society, giving rise to inequality while poverty and food insecurity persisted. Similarly, the current process of structural adjustment and globalization that is expected to bridge areas of shortage and abundance not only within a country but also across countries through the smooth operation of market mechanism can do no better. They do provide benefit to many, but also leave many others worse off. The ‘losers’ are likely to be people who are (i) unskilled due to historical reasons, (ii) physically and economically too weak to compete or (iii) geographically disadvantaged with insufficient and inappropriate resources to utilize the opportunities offered by the market. Growth alone cannot correct the human specificities related to gender, geography, social class or disease. Many believe that mainstream strategies need to be accompanied by direct attempts to eliminate deprivation.
Today, the choice of an appropriate strategy to combat poverty and food insecurity has become an extremely complex task due to policy contradictions and ideological dissension generated by growth-oriented policies and poverty alleviation programmes. On the one hand, efforts at market liberalization and structural adjustment that aim for faster growth are inevitably accompanied with measures for fiscal tightness and shrinkage of public operations. The simultaneous move towards free competitive world markets also calls for cuts in support funds that often serve to assist vulnerable groups. The subsidy- and support-based approach to food security has become incompatible with the present situation. Direct poverty alleviation programmes themselves impose, on the other hand, an immense budgetary burden and drain public resources that could be used to generate more sustainable growth. Moreover, subsidies and conventional poverty programmes command considerable political sensitivity and hence offer little flexibility as policy instruments. Administration of poverty programmes is complex and cannot avoid leakages or inefficient use of funds. A compromise approach that has gained acceptance in the contemporary world is safety-netting for the poor and vulnerable through instruments which ensure maximum targeting. Specific targeting, facilitated by transparency and participation of the people, can save on costly public resources and yet reach the truly needy, such as food-insecure families.
This paper deals with the solutions adopted by India, a country with a long and diverse history of development and poverty alleviation, albeit with varying success. The approach to food security evolved through some laudable successes as well as
2
reprehensible failures. In the 1990s, India launched epochal institutional changes and embarked on a programme of structural adjustment and globalization. Furthermore, India’s political system is struggling to achieve a consensus for eliminating poverty-induced food insecurity through approaches and instruments that would be consistent with its macroeconomic policies. The finer designs of the programmes as well as the institutions that govern their implementation are important for achieving the objectives. The paper reviews the experience of India in fighting the poverty and food problem, and discusses the changing orientation of strategies towards new and innovative methods, also as institutions for rural governance transform. The report traces the evolution of the strategy of public works programme (PWP) that now promises to be an acceptable instrument for targeting. The strategy is considered for its merits and concerns. An empirical study of the rural public works programme in four states is conducted, first, to determine whether a linkage exists between a public works programme and food insecurity, and second to investigate econometrically whether the programme indeed succeeds in seeking out households likely to be food insecure and further to highlight who among the food insecure the programme possibly passes over.
2 India’s approach to food security: a historical sketch
India emerged from its colonial past of British rule into a multiparty democracy in 1947. India, as the second most populous country in the world, incorporates both geographical expanse and diversity, often translating into both economic prosperity and backwardness among the regions. From a backward economy beset by chronic food problems and poverty, India’s road to development started at independence with the introduction of the five-year plans. The plans, underscoring regional balance and social justice, concentrated initially on industrialization. However, the importance of food for the very purpose of pursuing the development plans was gradually appreciated, and food issues became an integral part of development as well as an important element in the country’s political economy.
Historically India was a famine-ravaged country. Between 1860 and 1908, there had been twenty famines and the Bengal famine of 1943 was a tragedy of diabolical magnitude. The construction of railway network in the nineteenth century, attempts by the colonial government to stimulate agriculture, and the curbs on speculator hoarding after independence helped to ease market shortages and the incidence of localized famine. But India as a whole continued to face food shortages even after 1947, and inflows from foreign sources, specifically the politically unpopular imports from USA, helped to fill the deficit. Physical shortage of food went hand in hand with pervasive poverty.
The ‘grow more food’ campaign of the pre-independence period and a Ford Foundation sponsored report ‘India’s Food Crisis and Steps to Meet It’ in 1959 mark the beginning of India’s concern over food security. The green revolution that ensued was the foremost attempt to combat food insecurity and the dependence on foreign supplies that were becoming a disincentive to domestic production. New technology implemented with government support as well as training and extension paved the way to a more market-oriented and dynamic agriculture. India emerged from its subsistence-oriented status, but this progress was confined to specific parts of the country only. India’s plans were based on ‘socialistic’ lines that utilized administered pricing, input subsidies and

3
price support to encourage the adoption of technology for the benefit of rural regions where the majority of the poor lived. Various market controls supplemented the efforts to achieve food security. Technology helped the country reach the target of self-sufficiency in food production at the national level, but the marginal purchasing power of the poverty stricken people limited their economic access to food and its marketability. The significance of household-level food security became apparent. The universally applicable and broad-based ‘public distribution system’ (PDS) was inadequate, given the magnitude of the food-insecurity problem in India. A more deliberate and focused strategy was subsequently adopted using different instruments to transfer food and income to regions and people in need. It was within this broad coverage of a multitude of the so-called poverty eradication programmes that the ‘public works programme’ (PWP) evolved to its current form. PWP was not free of the risks of failure that have affected many development programmes in India, as is also true for similar programmes in other developing countries (Gayi 1995).
By the end of the 1980s, the food economy of the country came to crossroads. First, the green revolution had already offered the coveted self-sufficiency in food at the national level and India was no longer a food-shortage country. In fact, the stock of foodgrains burgeoned, capturing about half of the government’s huge food subsidy bill. Production performance, however, remained uneven across regions and the subsidies went disproportionately to the benefit of the surplus regions which more often were not the poorest. Second, the excess-producing regions faced problems not only with saturation but also ecological issues. Third, in spite of the abundance, scarcity regretfully continued to affect disadvantaged regions and deprived population groups, calling for improved distribution efforts. Fourth, a severe balance of payment crisis forced India to approach the World Bank and as a result, structural adjustment began to shape the 1990s. This was followed by the India’s membership in the World Trade Organization. The resulting programmes were somewhat contrary to India’s own unique economic approach. The role of the government in fiscal and monetary management, trade promotion and price correction through market facilitation became pronounced. Consequently, with the exception of physical infrastructure (mainly roads), public investment and expenditure for rural India languished.
The paradigm shift was not easy. While growth picked up and poverty possibly diminished, people faced extra pressure to acquire a certain measure of life quality in which social necessities such as education, shelter and health assumed increasing importance. Society and the nation now faced greater difficulty in the attempt to move on. Rural regions still lagged behind, remaining poverty-prone; regional balance and social equality were yet to be attained and pockets of extreme poverty, deprivation, starvation and localized famines persisted. Poverty was concentrated among the historically underprivileged classes like the tribal population, specific economic groups and discriminated social classes. Households disadvantaged by non-productive family members found it harder to cope. These households also faced greater vulnerability to any food shortage at the national level or price increases triggered by weather conditions or exports. Food is an issue of extreme political relevance in India’s multiparty system. Policies related to agriculture, poverty and food have caused considerable dissension and feature strongly on electoral agendas. The coalition government formed in 2004, encompassing a variety of ideologies, emphasizes poverty alleviation, as is outlined in their common minimum programme (CMP).
4
2.1 Targeting assistance to the food insecure
In the light of current economic, political and social realities, in order to optimize use of limited public funds, the older poverty programmes are being re-designed with the view to improve project targeting. While new poverty programmes search for a compromise between the growth and distribution-advocates, attempts are being made to target the most vulnerable and needy to ensure that their nutritional requirements are satisfied, while also meeting India’s other developmental objectives.
Food is recognized as the basic minimum necessity of life. Given the country’s past history of food insecurity, post-independent ruling governments have never tired of attempting to devise policies to address insecurity faced by households, by allocating substantial budget shares for welfare programmes. But the measures did not always attain the desired outcome, because of faulty designs, administrative failures and lack of institutions. Instances of starvation deaths, malnutrition and distress suicides never disappeared from the media coverage, creating electoral upheavals. Although all nutrition-oriented programmes are productive and sustainable in the sense that any added nutrition improves the productivity of the recipient, purely welfare-oriented schemes are, at best, short-term measures. In the days of liberalization, it is important to note that typical welfare- and subsidy-based projects are not market consistent or livelihood motivated and have to give way to more sustainable and judicious methods. This section briefly describes some targeted but assistance-based programmes, of which the oldest and most broad-based effort is the PDS that directly addresses food needs.
2.2 Institutional changes for rural programmes
The successful targeting—and efficient operation—of the food-based poverty programmes in the Indian rural sector that cover nearly 750 million people depends largely on project administration at the grassroots level, as well on the individual’s efforts and involvement in his/her own development and welfare. The centralized administration system in India entrusted its large bureaucracy with the implementation of the programmes. But it was acknowledged all along that the system was inadequate for the development of India’s vast rural regions and a more participative system was required. Even with the governing bureaucracy in place, a void existed unfortunately in rural development area, which largely contributed to the sparing success of the different schemes. The decade of the 1990s also saw landmark changes in governance for rural development.
The principle of grassroots governance has existed since independence in spite of India’s complex bureaucracy. Efforts towards self-government and decentralization (Singh 1999) were advanced through the establishment of the community development blocks in 1952, which enabled administration and planning to be carried out at the district, block and village levels, as well as through the enactment by some states of the Panchayat Raj Act, following Batwant Rai Mehta’s recommendations in 1957. Article 40 of the Constitution of India empowered the states to organize the panchayats as units of self-government. But over time, enthusiasm declined and ‘decentralization’ essentially meant additional layers of bureaucratic controls. The cherished principle of grassroot governance embodied in the Panchayati Raj institution (PRI), a three-tier substate level government, finally received constitutional recognition with an amendment of the constitution only in 1992, and is a landmark episode for the
5
development of food security and poverty alleviation at the household level. This allows rural inhabitants, who constitute the vast majority of India’s population, to participate directly in their own development efforts, to select projects according to local needs and to have voice to air their grievances and problems. Local governments elected by the people, now free of the red tape that characterizes centralized governance, and actual beneficiaries are able to work in close interaction and to monitor progress as well as the utilization of funds. Local governments are encouraged to undertake efforts to mobilize resources locally to complement government resources, to identify beneficiaries and to involve voluntary agencies for programme implementation. Payments can be made transparent through public accountability.
Almost all states in India elected to adopt the concept of gram sabha (GSs) as well as the higher tier government. GSs is a body consisting of persons registered in the electoral rolls of a village or a group of villages, which elects a panchayat. In addition to the implementation and administration of different poverty programmes, the GSs participate in identifying the local poor according to the ‘below poverty line’ criterion. The GSs are also concerned with the dissemination of information and simplifying the application process.
After years of bureaucratic administration, the transition to decontrolled governance was far from smooth; political bickering and judicial involvement commonly surround the process of identifying the beneficiaries, and allegations of political patronage and extensive omissions are not uncommon. Governance contradictions between the new PRI-based system and the traditional bureaucratic structure continue. Funding for the PRI has not been organized. Although the transition to PRI is slow, local level governance can certainly help to deal with the problems of household-level poverty and food insecurity.
2.3 The public distribution system in India
A time-tested instrument in India, the PDS expressly addresses the issue of household food security. ‘Rationing’, as it was originally called, has a long history in India, dating from the Second World War. Introduced by the British government, the PDS was retained after independence as a deliberate social policy. Over time, the PDS, which is the largest of its kind in the world, evolved into a national social safety system. It became an alternative and parallel market that made foodgrains available at a ‘fair price’, thus protecting consumers from high prices generated by the free market mechanism.
The PDS became a component in an integrated foodgrain policy of the government: Food Corporation of India (FCI), a public undertaking, conducts foodgrain operations on behalf of the government. It procures grains at remunerative prices from farmers, sells to vulnerable groups at reasonable prices, and maintains buffer and operational stocks. Thus difficulties and inefficiency in FCI’s other operations tend to affect its distributional activities adversely. The PDS failed when, in the face of upwardly adjusting administered prices, the poor purchasing power of the population masses slowed down the offtakes from the public pool, and food security suffered. Yet, this process, in conjunction with the existing open-ended procurement policy and a series of good harvests, piled up public stocks, causing an unsustainable budgetary burden on the government. The PDS was criticized because of its failure to serve the poor, its urban

6
bias, limited coverage within the states with a high concentration of rural poor, and the lack of transparent and accountable delivery arrangements. In other words, the broad-based PDS was perceived as highly untargeted and costly, and there were calls for change, including its dismantling to let the open market adjust prices. The FCI reacted by pointing out that the PDS was necessary for serving the poor and the remote areas.
Inevitably, the public distribution system came under the scanner. After the reforms, the PDS was redesigned to ensure better coverage in backwards areas. Decentralized procurement of grains by state governments or their agencies was introduced in 1997/8, and many states opted to adopt the method. PDS was further modified into a two-tiered structure known as the ‘targeted public distribution system’ (TPDS) where the beneficiaries were identified on the basis of a specific poverty line: (i) households existing below the poverty line (BPL households), whose entitlements were subsidized and (ii) above-the-poverty-line households (APL) who were allocated foodgrain at cost price. This was the new beginning of targeting the PDS.1 To focus the TPDS further, Antodaya Anna Yojana (AAY) was launched in 2000 to identify ten million of the poorest BPL families covered by the programme for the provision of grains at subsidized rates. Prices for the three groups of beneficiaries (APL, BPL and AAY) are tied to their economic position, and the system is strictly monitored.2 The PDS also supplies grains to other food-based welfare programmes of the government. In addition, open sales from public stocks are made to stabilize prices and protect consumers against high food prices. Surplus stocks are exported in accordance to WTO regulations.
Table 1 Allocation and takeoffs in PDS (million tons)
Year 2000/1 2001/2 2002/3 2003/4
Allocation 27.9 30.4 74.7 71.6 Offtake 12.0 13.8 20.1 22.8
Source: GoI (2003/4).
Table 2 Subsidies in Rs millions
Year BPL APL AAY PDS OMS Export Welfare
2001/2 50,860 4,580 11,310 66,750 6,160 13,680 29,530 2002/3 63,360 9,240 26,410 99,010 12,060 57,430 13,050 2003/4 80,050 11,360 28,550 11,960 4,850 36,210 15,510
Notes: BPL = below poverty line; APL = above poverty line; AAY = Antodaya Anna Yojana; PDS = public distribution system; OMS = open market sales. Source: GoI (2003/4).
1 Initially the BPL entitlement was 10 kg per month per family but was increased as of 2002 to 35 kg
for both groups. The entitlement for AAY household was 25 kg per family per month, and is now same as the APL and BPL entitlements.
2 Central issue prices (Rs/kg) for rice and wheat are 5.65 and 4.15, respectively, for BPL households; 8.30 and 6.90 for APL households, and 3 and 2 for AAY recipients.
7
Despite the efforts at fine-tuning, at present the PDS is, at best, a partial solution to food insecurity. The subsidy burden is at odds with the economic and fiscal management of the economy. Furthermore, the misery of undernutrition that persists even when stocks are mounting is an inconsistency that has been described as ‘mass murder’ (Drèze 2001). The takeoff falls short of the grain allocation (Table 1) because even the BPL price set judiciously is not always within the reach of the poor. Also, many households mistakenly identified as being ‘above the poverty line’ are too poor to afford the APL price. But these inadequacies only serve to add to the stock levels and subsidy burden (Tables 3). While discontinuation of the system or even its curtailment is not yet politically feasible, the subsidy-based PDS is essentially difficult to manage and inconsistent with the times.
2.4 Assistance targeted towards specific needy sections of the population
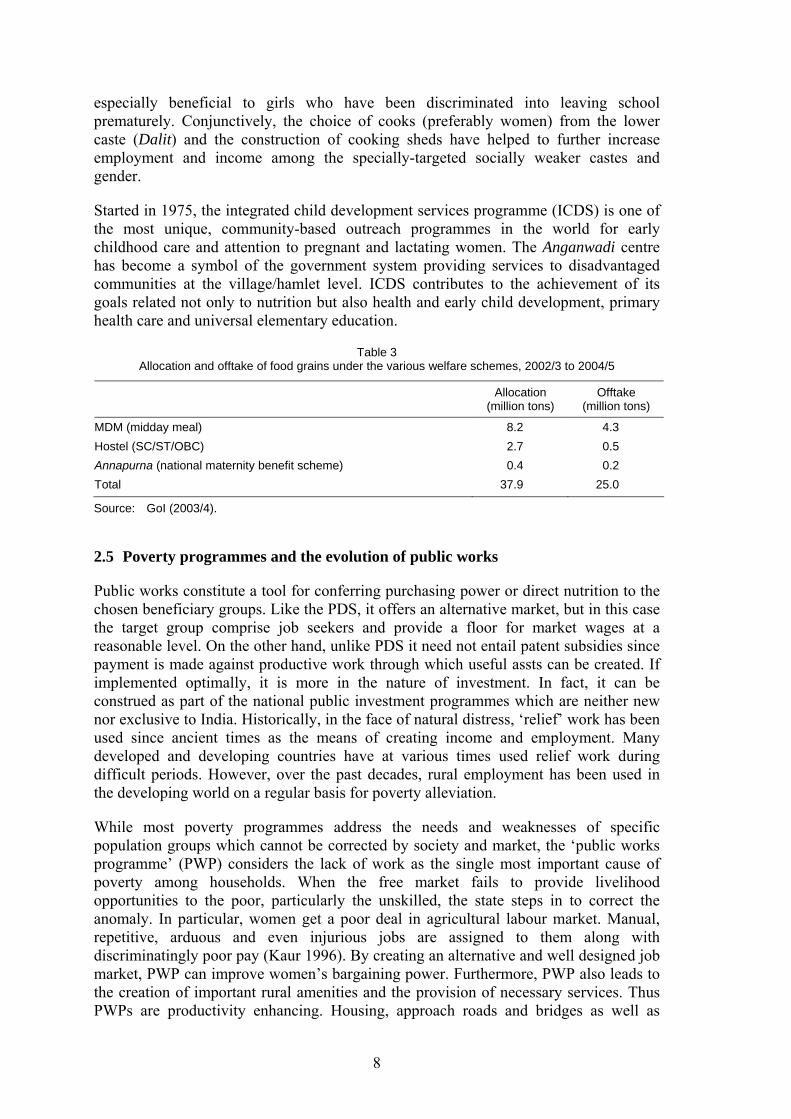
In the current era of structural adjustment and fiscal prudence, the newly evolved programmes seek to identify and target specific sections of the society, often even at the individual level to address intra-household iniquities. Some schemes also aim to address the issue of nutritional requirements in conjunction with other social needs, and come as multi-phased packages. Certain programmes have been modified from existing plans while others have been adapted from successful schemes in individual states. This section will throw light on some of the social assistance schemes, the celebrated ‘midday meal’ (MDM) scheme and the programme called ICDS.
A number of financial assistance schemes, collectively known as ‘national social assistance programmes’ (NSAPs), were launched in 1995/6. To meet the constitutional commitment towards poor households, the NSAPs seek to provide a minimum assurance to those in need or disabled by old age, death of breadwinner and maternity (see Appendix A1). The NSAPs encompass the national old age pension scheme (NOAPS), the national family benefit scheme (NFBS), and the national maternity benefit scheme (NMBS). Annapurna is a scheme started in 2000, addressing the food security of senior citizens, providing free food to specific old-aged groups. Community grain banks, built with a participatory approach, focus on remote tribal-dominated areas for the prevention of starvation deaths, while the wheat-based nutrition programme is catered to adolescent girls; women’s hostels for backward classes serve the traditionally neglected gender. The national nutrition mission, launched in 2001, provides subsidized foodgrains to adolescent girls and expecting and lactating mothers.
The national programme for nutritional support to primary education, or the MDM as it is popularly known, draws on the successful experience of Tamil Nadu. Initiated in all government and government-aided schools, MDM provides either cooked lunches or foodgrains to assure food security without caste or gender bias. Its goal is to eliminate classroom hunger and promote balanced socialization along with free and compulsory education to all children. This goal is as old as the Indian Constitution but received added attention in the 1990s.3 The MDM has been successful in significantly increasing school enrolment, improving attendance and keeping students in school. It has been 3 Supreme Court (the Unnikrishnan Case 1993), on examining constitutional provisions, declared basic
education as a fundamental right. Following this, a bill is currently under consideration to incorporate education for children to the age of 14 years as a fundamental right. Primary education has also gained importance all over the world, especially with structural adjustment.
8
especially beneficial to girls who have been discriminated into leaving school prematurely. Conjunctively, the choice of cooks (preferably women) from the lower caste (Dalit) and the construction of cooking sheds have helped to further increase employment and income among the specially-targeted socially weaker castes and gender.
Started in 1975, the integrated child development services programme (ICDS) is one of the most unique, community-based outreach programmes in the world for early childhood care and attention to pregnant and lactating women. The Anganwadi centre has become a symbol of the government system providing services to disadvantaged communities at the village/hamlet level. ICDS contributes to the achievement of its goals related not only to nutrition but also health and early child development, primary health care and universal elementary education.
Table 3 Allocation and offtake of food grains under the various welfare schemes, 2002/3 to 2004/5
Allocation (million tons)
Offtake (million tons)
MDM (midday meal) 8.2 4.3 Hostel (SC/ST/OBC) 2.7 0.5 Annapurna (national maternity benefit scheme) 0.4 0.2 Total 37.9 25.0
Source: GoI (2003/4).
2.5 Poverty programmes and the evolution of public works
Public works constitute a tool for conferring purchasing power or direct nutrition to the chosen beneficiary groups. Like the PDS, it offers an alternative market, but in this case the target group comprise job seekers and provide a floor for market wages at a reasonable level. On the other hand, unlike PDS it need not entail patent subsidies since payment is made against productive work through which useful assts can be created. If implemented optimally, it is more in the nature of investment. In fact, it can be construed as part of the national public investment programmes which are neither new nor exclusive to India. Historically, in the face of natural distress, ‘relief’ work has been used since ancient times as the means of creating income and employment. Many developed and developing countries have at various times used relief work during difficult periods. However, over the past decades, rural employment has been used in the developing world on a regular basis for poverty alleviation.
While most poverty programmes address the needs and weaknesses of specific population groups which cannot be corrected by society and market, the ‘public works programme’ (PWP) considers the lack of work as the single most important cause of poverty among households. When the free market fails to provide livelihood opportunities to the poor, particularly the unskilled, the state steps in to correct the anomaly. In particular, women get a poor deal in agricultural labour market. Manual, repetitive, arduous and even injurious jobs are assigned to them along with discriminatingly poor pay (Kaur 1996). By creating an alternative and well designed job market, PWP can improve women’s bargaining power. Furthermore, PWP also leads to the creation of important rural amenities and the provision of necessary services. Thus PWPs are productivity enhancing. Housing, approach roads and bridges as well as
9
schoolbuildings add to rural physical and social infrastructure. The construction of wells and restoration of tanks, soil conservation and improvement of the watershed are services that directly impact on agriculture. The poorest population sections benefit from the development and maintenance of common property resources. Thus, the poor and the jobless are, on the one hand, assured of a minimum income through the PWP, while on the other hand, important public goods that the government needs to provide are created. The two-pronged approach has potential for long-term sustainability since productivity is increased in the process. Above all, the PWP—unlike most anti-poverty measures—is not in the nature of assistance. Rather, it is a job market, in which needy households can participate voluntarily and with dignity for a minimum income to satisfy basic needs. The PWP is also a politically recognized minimum safety-net to the rural poor (Hiraway 1994).
Thus by providing a fair and just job market, the PWP can improve the bargaining strength of the poor in the traditional labourmarket, reduce job discrimination by gender, caste or religion, balance seasonal income fluctuation and increase wage levels. PWPs, in the nature of food-for-work (FFW) projects, implemented in various less-developed countries, pay wages directly in kind, thus addressing the minimum nutritional needs of the people and reducing misappropriation of funds. In India, this programme has made use of favourable harvests. In addition, distribution of foodstocks from surplus domestic production serves to promote the disposal of public stocks.
One of most important advantages of the PWP is that it can be designed to be self-targeting. Identifying the poor presents a daunting challenge in most poverty programmes and results in profligate use of scarce public resources, whereas the PWP, through the type of work and wage rates offered, can be used as instruments to attract the truly needy and to discourage the less deserving. For its target selection, the PWP need not rely on some arbitrary identification of the poor that may not always be accurate or exhaustive. But this can also become a disadvantage if the project is not effectively designed and implemented. If the work or conditions become too arduous, unpleasant, gender predisposed or logistically inconvenient, the PWP may in fact discourage the truly needy, given their specific socioeconomic characteristics, and thus become self-defeating. Faulty administration can enable people with more influence to find devious ways of cornering the benefits while the poor prefer to stay away. The test of the programme lies in its ability to focus only on the truly needy (Ravallion 1990).
The history of public works in India is dotted with programmes more diverse in their name than in content, and these received greater notice in political importance than in implementation record. The ‘rural works programme’, first initiated in 1970/1, was later re-designated as the ‘drought prone area programme’ (DPAP). The ‘food-for-work programme’ was started in 1977 with the aim of utilizing the surplus food stocks of the times. The ‘national rural employment programme’ (NREP) evolved in 1980. The ‘rural landless employment guarantee programme’ (RLEGP) was instituted in 1983 to address the plight of the core rural poor. In 1989 NREP and RLEGP were merged to form the Jawahar Rozhar Yojana (JRY) that prioritized backward, schedule caste and schedule tribe classes (SC/ST), women and bonded labour. Central and state governments shared the expenses, and wages were paid partly in cash and partly in food. Labour-intensive projects were preferred and operationalized by stipulating a desired wage-to-material cost ratio. In 1993 the JRY was again modified, and two of its components made independent. These separate programmes—the ‘million wells’ and Indira Awaas Yojana for rural housing—also promoted rural employment. JRY was redesigned again in

10
2000/1, and converted into Jawahar Gram Samriddhi Yojana. The ‘employment assurance scheme’ was set up in 1993 in districts covered by the modified PDS to provide 100 days of unskilled manual labour to the rural poor who want it. This is a typical rural works programme with the primary objective of providing wage employment and with the secondary aim of creating social and economic assets in rural areas for a sustainable community. The three tiers of the panchayat also share in the implementation and allotment of funds and foodgrain.
In November 2004 the newly elected coalition government launched the ‘food-for-work’ programme, based on rozgar badhao (increase incomes), the slogan of the time. The option of productive employment guaranteed by the state gained added importance when it was noted that the employment elasticity of output was declining in the post-reform period and employment growth was falling despite the country’s impressive economic improvement (Sen and Jha 2005). Wage employment campaigns like the ‘employment guarantee scheme’, Jawahar Rojgar Yojana and ‘employment assurance scheme’ were noted to be more pro-poor than programmes like the ‘integrated rural development programme’ (self-employment programme) and the ‘public distribution system’. An employment scheme already functional in the state of Maharashtra was acclaimed by both international and national critics of varied ideologies. The PWP is increasingly being considered as the solution in fighting the deepest levels of poverty. A milestone in the efforts of awarding to the poor the political right to employment is the legal recognition now extended to this issue. According to a new Bill (Appendix A1) the existing FFW will be replaced with the ‘national rural employment guarantee’ (NREG), and the government is obligated to provide a minimum of public works employment opportunities to anyone seeking it. Under consideration is a constructive plan to integrate the NREG with the country’s various infrastructure programmes relating to roads and irrigation. On the other hand, there is some apprehension that a nationwide public-works programme could be impracticable because of (i) the huge budgetary burden it imposes and (ii) the difficulty of implementing it efficiently. While the performance of a nationwide programme can best be evaluated over time, India’s existing schemes can be assessed to determine how far the PWPs were capable of attracting the targeted sections of the society for public ministration. The following section conducts an empirical study of the PWPs in four medium ranking states in India and looks for the association between household food insecurity and participation in PWP.
3 Empirical study
Ideally, a targeted PWP should reach the needy households—and only the needy. As food is one of the basic needs of a household, this study attempts to examine the linkage between PWP and food security. Such a task is, however, difficult because of (i) the definitional ambiguities of the concept of food insecurity and (ii) the economic and political impossibility of identifying all qualifying individuals. Constructing a suitable specification for food security at the household level academically circumvents the first hurdle. The second difficulty is often dealt with in real life applications by a political and administrative process through which the self-declared needy households are evaluated according to a cutoff income level, called the poverty line. The process is complex and leads to political patronage, judicial conflicts and delays. More often than not, it leaves out many deserving cases. A more commonly used approach in India’s
11
development history is to identify the socioeconomic characteristics associated with the problem and to direct expenditure towards the regions, castes and groups considered to be disadvantaged. PWP itself is likely to be self-targeting towards the needy, provided that it is properly designed. An assessment of PWP’s efficiency in addressing the basic requirement of food security can, however, be made by analysing the food security situation of beneficiary households, although PWP participation itself affects the household’s food security status. Essentially, if properly designed and functioning, the PWP would focus on such socioeconomic conditions that are also likely to be associated with food insecurity.
Assessment of the PWPs can therefore be made through the following steps: (i) constructing a reasonable specification and threshold for food security; (ii) identifying the factors associated with food-insecure households; (iii) highlighting the factors associated with PWP participation and matching these to food-insecure households, and (iv) identifying factors that ‘overlook’ or even discourage food-insecure households from participating.
3.1 Data and area of work
The study is based on unit-level observations from the 55th round of quinquennial survey (1999/2000) of the National Sample Survey Organization of India (NSSO). The study covers the rural population of four states: Andhra Pradesh, Madhya Pradesh, West Bengal and Orissa. In view of the fact that the issues under consideration are basic food insecurity and public works, both of which are relevant factors for the less skilled and uninformed population sectors, the study concentrates only on households headed by individuals with no education. As observed in Appendix Table A4, this group constitutes the largest section of rural households, excluding less than 2 per cent of households in most cases.
The NSSO provides information at the household level and member level on various socioeconomic attributes. Since consumption information is mostly provided at the household level, the household is taken as the unit of study for the main purpose of the report. However, member-level information on age and gender composition of households and education of the head of household is obtained from member files and merged with the household database used for the analysis. The household file provides data on PWP participation.
Information on household-level socioeconomic characteristics relevant for the study is collected as possible from the NSSO database. These attributes are mostly described by categorical variables with only limited and discrete values. Since geographical advantage plays an important part in the development of a state and wellbeing of the people, the location of the household is needed. In this case, the states are divided into different regions according to agro-climatic conditions and other considerations provided by NSSO. It is recognized that even when India prospers at the macrolevel, people in drought prone or arid regions bear hardship and malnutrition. However, intervention and prioritization by the state endeavour to level out geographical advantages and disadvantages among the states, as balanced regional development is one of the objectives of the state machinery. Since regional imbalances still exist and the PWP is a part of state policy, geographical divergence is taken into account.

12
Occupation is generally associated with economic conditions, and poverty has been concentrated among certain households, such as agricultural labourers. The NSSO classification of households by ‘household type’ according to main income source is also applied here to categorize households by occupation. Certain social classes are often marginalized due to historical reasons, prejudice or the inevitable majority dominance. Thus, apart from India’s main religion Hinduism, other religious groups at times are neglected, although these may in certain communities even surpass Hindus with regard to progressiveness and prosperity. The largest minority group in India are the Muslims. The caste system is a wellknown complexity of the Indian society and throughout the ages, minority castes and tribes have been deprived of development approach. Scheduled castes and tribes in India are currently protected by the constitution, with a quota in government jobs and special poverty programmes but even now inequality persists. Recently, certain other backward classes (OBCs) have been singled out for special attention, and NSSO reports these households separately as such.
Characteristics of the family members of a household are also important. The household size, measuring the number of members to feed, is an important determinant of its wellbeing and earning power. Family size can also constitute a liability with regard to food consumption, and its composition has an impact. The presence of children in the family creates other demands in addition to food, making a household more vulnerable to food insecurity but less qualified in terms of earning capacity and heavy work. Similarly, female members are at times disadvantaged in the labour market; they are constrained by the nature and condition of the work available, domestic commitments and safety-related issues. The household size and composition variables, measuring the proportion of children and female adults, respectively, are continuous variables. Education confers information, as well as additional power in the labour market. It also influences consumption decisions and diet awareness. The educational level of the household head is taken to characterize this variable. Admittedly, this variable has its limitation, considering that in some cases, the household head may not be the main source of household finances or awareness. This, however, is not likely for the majority of cases. Based on the assumption that headship implies financial and decisionmaking power, this characterization of the household is retained. Education is taken as a categorical variable, using the NSSO’s classification of educational attainment.
3.2 Categorization and characterization of households
Regions: Andhra Pradesh (coastal, inland north, southwestern, inland south); Madhya Pradesh (Chhattisgarh, Vindhya central, Malwa, south, southwestern, north); Orissa (coastal, south, north) and West Bengal (Himalayan, eastern plains, central plains, western plains).
Household types: Self-employed in non-agriculture; agricultural labourer; other labour; self-employed agricultural worker; others.
Education of household head: Illiterate, non-formal education (literate by attending non-formal schools) and literate but less than primary school; primary school; middle school; secondary/higher secondary schooling; graduate and above.
Religion: Majority (Hindu); minority (Muslim); others.

13
Caste: backward, schedule caste and schedule tribes (SC/ST); other backward classes (OBCs); non-backward; general
Household features: Household size; proportion of children; proportion of females.
3.3 The selected states: an overview
The four states selected for the study do not represent the leading states of India in terms of major indicators. All the states have a gross domestic product (GDP) below national average. West Bengal and Andhra Pradesh are middle-ranking states in India both in terms of GDP and human development index (HDI) while Madhya Pradesh and Orissa are lower ranking. The poverty headcount ratio is high in all the states except Andhra. However according to the Planning Commission, the poverty rate in West Bengal came down significantly in 1999, and it is one of the fastest growing states of recent times. But West Bengal is also experiencing slow growth in employment generation, a reflection of its dense population, large share of minority (SC/ST/Muslim) population and concentration of rural poverty. The eastern states West Bengal and Orissa are deficient in electricity infrastructure, while all the states under study have a limited supply of drinking water. Andhra, Orissa and West Bengal encompass coastal belts with superior soil fertility, but are prone to cyclones and floods. Madhya Pradesh is inland bound but richly endowed in minerals. Forest coverage is the greatest in Madhya Pradesh and Orissa, while West Bengal has the least. The former states also have highest ratio of tribal populations, nearly 30 per cent. Orissa is vulnerable to disasters affecting human lives and food availability. Madhya Pradesh has a higher per capita production of cereals than the India average and is the only one among the four states to record a surplus, the others being net consumers.
The Food Insecurity Atlas of Rural India, published by the Swaminathan Research Foundation, gives a fairly complete picture of India’s performance and difficulties in each state. In all the selected states, the average per capita consumption of cereal exceeds the norm of the Indian Council of Medical Research (ICMR) while that of other foods falls far short. In fact, the ratio of cereal consumption to norm is higher than the all-India average (Table 4), a fact which qualifies these states as dominantly cereal consuming. Cereals still seem to be the main dietary item and chief source of energy. It may not, however, be inappropriate to consider cereal intake relative to norm as an
Table 4 Food adequacy in Orissa relative to ICMR norms
Andhra Pradesh
Madhya Pradesh
Orissa
West Bengal India
ICMR norm (grams/person
per day)
Cereals 1.05 1.13 1.26 1.19 1.04 420 Cereal substitutes 0.00 0.01 0.00 0.00 0.05 75 Pulses 0.58 0.81 0.38 0.35 0.58 40 Vegetables 0.53 0.45 0.47 0.51 0.48 125 Fruit 0.45 0.21 0.27 0.38 0.45 50 Milk and milk products 0.52 0.55 0.15 0.31 0.97 150 Oils 0.56 0.45 0.27 0.52 0.52 22 Meat 0.29 0.08 0.08 0.17 0.15 25 Fish 0.15 0.08 0.39 0.72 0.28 25
Source: Swaminathan Research Foundation (2001).
14
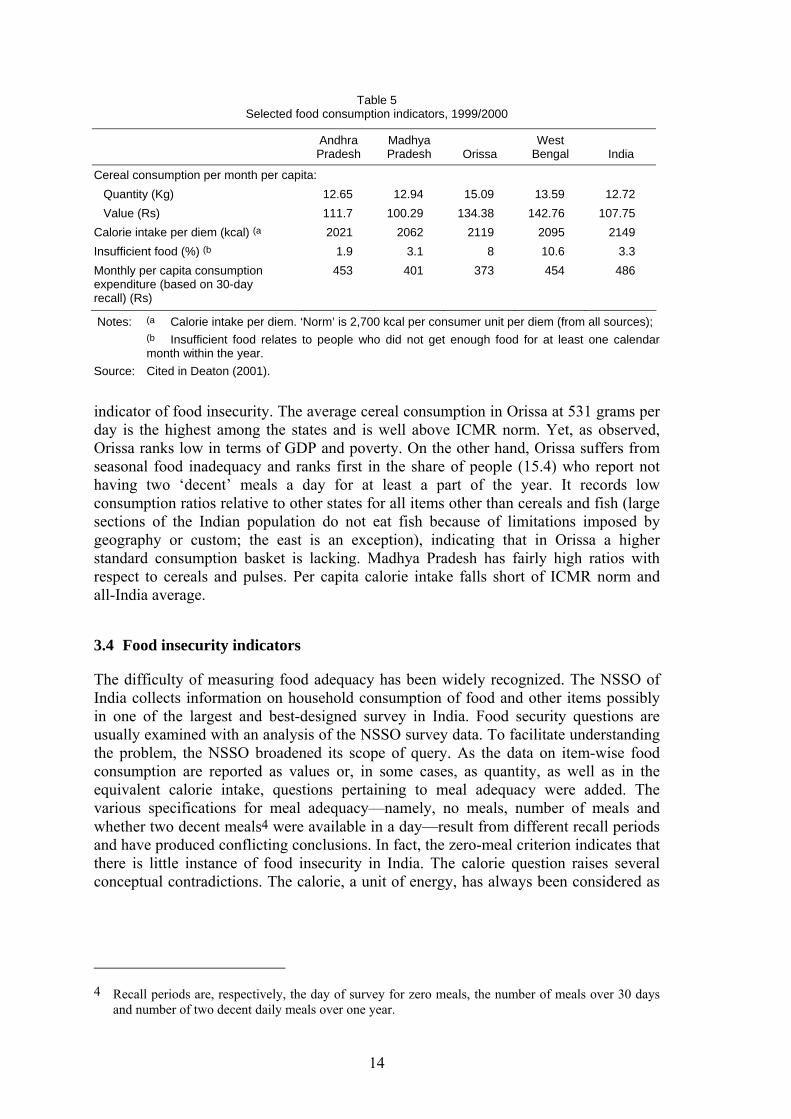
Table 5 Selected food consumption indicators, 1999/2000
Andhra Pradesh
Madhya Pradesh Orissa
West Bengal India
Cereal consumption per month per capita: Quantity (Kg) 12.65 12.94 15.09 13.59 12.72 Value (Rs) 111.7 100.29 134.38 142.76 107.75
Calorie intake per diem (kcal) (a 2021 2062 2119 2095 2149 Insufficient food (%) (b 1.9 3.1 8 10.6 3.3 Monthly per capita consumption expenditure (based on 30-day recall) (Rs)
453 401 373 454 486
Notes: (a Calorie intake per diem. ‘Norm’ is 2,700 kcal per consumer unit per diem (from all sources); (b Insufficient food relates to people who did not get enough food for at least one calendar
month within the year. Source: Cited in Deaton (2001).
indicator of food insecurity. The average cereal consumption in Orissa at 531 grams per day is the highest among the states and is well above ICMR norm. Yet, as observed, Orissa ranks low in terms of GDP and poverty. On the other hand, Orissa suffers from seasonal food inadequacy and ranks first in the share of people (15.4) who report not having two ‘decent’ meals a day for at least a part of the year. It records low consumption ratios relative to other states for all items other than cereals and fish (large sections of the Indian population do not eat fish because of limitations imposed by geography or custom; the east is an exception), indicating that in Orissa a higher standard consumption basket is lacking. Madhya Pradesh has fairly high ratios with respect to cereals and pulses. Per capita calorie intake falls short of ICMR norm and all-India average.
3.4 Food insecurity indicators
The difficulty of measuring food adequacy has been widely recognized. The NSSO of India collects information on household consumption of food and other items possibly in one of the largest and best-designed survey in India. Food security questions are usually examined with an analysis of the NSSO survey data. To facilitate understanding the problem, the NSSO broadened its scope of query. As the data on item-wise food consumption are reported as values or, in some cases, as quantity, as well as in the equivalent calorie intake, questions pertaining to meal adequacy were added. The various specifications for meal adequacy—namely, no meals, number of meals and whether two decent meals4 were available in a day—result from different recall periods and have produced conflicting conclusions. In fact, the zero-meal criterion indicates that there is little instance of food insecurity in India. The calorie question raises several conceptual contradictions. The calorie, a unit of energy, has always been considered as
4 Recall periods are, respectively, the day of survey for zero meals, the number of meals over 30 days
and number of two decent daily meals over one year.
15
the main measure of food adequacy and is the basis of poverty measurement in India.5 What calorie level can be considered adequate for a healthy life? The answer is not clear. The government of India, in setting the poverty line, applied a norm based on the ICMR recommendation of 2,400 kcal per consumer unit for rural India. FAO, on the other hand, fixed a minimum requirement of 1,890 kcal for a typical citizen in India. Actual calorific requirements depend on factors such as gender, age, body-weight and nature of work, all of which vary among individuals. Fixing a norm, therefore, requires a detailed analysis of the population being studied.
Consumption of cereals is a possible indicator of food adequacy, as they are the basic ingredient of the Indian diet and provide the highest energy share (about 71 per cent), of all eaten foods. Lately, however, with higher incomes and improved knowledge of nutrition, the consumption patterns in India have shifted from cereals to milk products, fleshy food and fruit (Radhakrishna 1992). In many states, the average cereal consumption has dropped to less than the ICMR norm and is generally compensated by other foods. But for the large majority of the rural population having low incomes and limited information, the substitution may not be significant and cereals continue to be the main dietary ingredient. The low consumption of cereals in rural India is of concern in the cases where no improvement in the consumption of other foods is obvious.
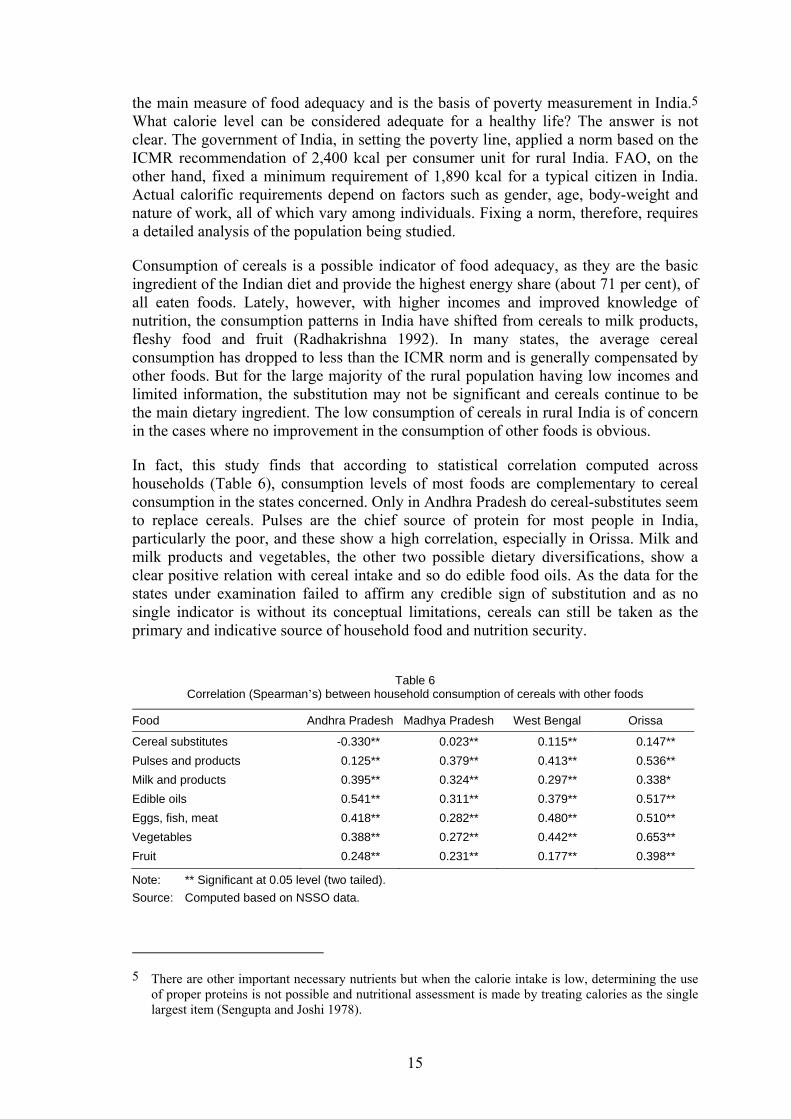
In fact, this study finds that according to statistical correlation computed across households (Table 6), consumption levels of most foods are complementary to cereal consumption in the states concerned. Only in Andhra Pradesh do cereal-substitutes seem to replace cereals. Pulses are the chief source of protein for most people in India, particularly the poor, and these show a high correlation, especially in Orissa. Milk and milk products and vegetables, the other two possible dietary diversifications, show a clear positive relation with cereal intake and so do edible food oils. As the data for the states under examination failed to affirm any credible sign of substitution and as no single indicator is without its conceptual limitations, cereals can still be taken as the primary and indicative source of household food and nutrition security.
Table 6
Correlation (Spearman’s) between household consumption of cereals with other foods
Food Andhra Pradesh Madhya Pradesh West Bengal Orissa
Cereal substitutes -0.330** 0.023** 0.115** 0.147** Pulses and products 0.125** 0.379** 0.413** 0.536** Milk and products 0.395** 0.324** 0.297** 0.338* Edible oils 0.541** 0.311** 0.379** 0.517** Eggs, fish, meat 0.418** 0.282** 0.480** 0.510** Vegetables 0.388** 0.272** 0.442** 0.653** Fruit 0.248** 0.231** 0.177** 0.398**
Note: ** Significant at 0.05 level (two tailed). Source: Computed based on NSSO data.
5 There are other important necessary nutrients but when the calorie intake is low, determining the use
of proper proteins is not possible and nutritional assessment is made by treating calories as the single largest item (Sengupta and Joshi 1978).
16
Table 7 Food security statistics of sample households
Andhra Pradesh
Madhya Pradesh
West Bengal Orissa
Household size, mean persons 4.4 5.6 5.2 4.9 Consumption expenditure, mean per capita per month (Rs)
448.0 396.0 447.0 370.5
Cereal consumption, mean per capita per month (kg) 12.8 12.9 13.6 15.2 FINSEC1, food-insecure people (%) 52.5 52.4 44.3 23.8 FINSEC2, food-insecure people (%) 26.6 41.4 25.5 48.1
Source: Computed based on NSSO data.
Table 8
Monthly per capita expenditure in Rs (MPCE) and household size (HSZ) according to food-security status of households
Andhra Pradesh Madhya Pradesh West Bengal Orissa Region Insecure Secure Insecure Secure Insecure Secure Insecure Secure
1 MPCE HSZ
433 4.5
529 3.7
2986.0
4115.1
3695.2
5114.7
354 5.6
4445.1
2 MPCE HSZ
378 5.0
517 4.2
3276.0
4175.1
3405.4
4944.9
194 4.8
2704.1
3 MPCE HSZ
352 5.2
437 4.6
3716.0
4795.3
4505.1
5375.1
297 5.0
3894.7
4 MPCE HSZ
322 5.1
446 4.6
4276.6
5425.7
3175.7
4785.3
5 MPCE HSZ
2995.5
4354.7
6 MPCE HSZ
3435.9
4525.0
7 MPCE HSZ
3896.2
4955.8
Note: Food insecurity measure = FINSEC1. Source: Computed based on NSSO data.
Table 9
Ranking of regions according to food insecurity
Andhra Pradesh Madhya Pradesh West Bengal Orissa
Rank FINSEC1 FINSEC2 FINSEC1 FINSEC2 FINSEC1 FINSEC2 FINSEC1 FINSEC2
1 2 4 6 5 2 4 2 2 2 3 3 4 1 3 2 3 3 3 4 2 3 6 4 1 1 1 4 1 1 5 3 1 3 5 7 2 6 1 4 7 2 7
Source: Computed based on NSSO data.

17
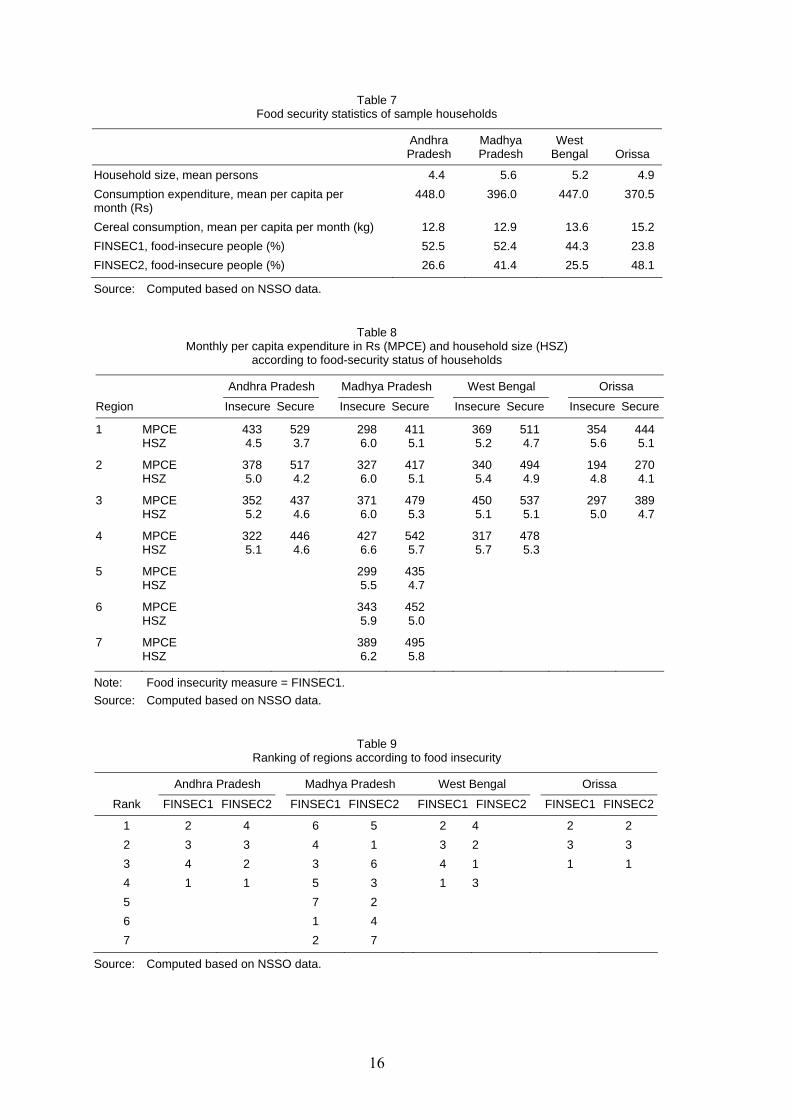
We assume cereal consumption to be a reasonable reflection of the food security of rural households. Therefore, food insecurity is primarily proxied here by the indicator FINSEC1 which considers a shortfall in cereal consumption from the ICMR norm, taken to be the base. Thus, households with consumption below the norm are deemed to be food insecure while others are food secure. This measure presupposes a threshold ascertained by an apex agency on the basis of scientific methodology. An alternative index, FINSEC2, is also considered for comparison. The second indicator indirectly applies the calorie norm, essentially utilizing the official poverty line which corresponds to the minimum expenditure needed to meet calorie requirements as well as certain basic essentials of life. In this sense, a household is considered food insecure in FINSEC2 if it falls below the poverty line.6
The two methods of conceptualization have important differences. FINSEC1 assesses deepest deprivation, according to which the issue is the consumption of the basic minimum energy requirement needed for sustaining life. But it also recognizes the need for other basic items, household preferences and the urge to fulfil them. Indicator FINSEC2 effectively allows for substitution among alternative consumption items within limited means, but is blind to their actual allocation. In other words, a household considered by FINSEC2 to be food secure may, in fact, allocate most of its expenditure to other family-preferred needs and thus be undernourished. The relation between the two indicators is not straightforward. Normally, it would seem that households considered as food insecure by the first indicator are a subset of those indicated by the second. However this is not always true, as can be seen in Table 7 where the extent of insecurity according to FINSEC1 exceeds, in some cases, the insecurity as measured by FINSEC2. Poorest households, verging on destitution and habitually deprived of many other essentials for life quality, are likely to prioritize the most basic need, food, over shelter, education and health. In addition, they may have access to cereals, even if of inferior quality such as that obtained by begging or from charity organizations. A less poor household will possibly have constraints on potential sources of income or food, and often other needs in their expenditure decisions such as children’s education and health take primacy over food.
The monthly per capita expenditure (MPCE) for the sample households in the four states under review is the lowest in Orissa (Table 5) although according to the first criteria, the proportion of food-insecure people in the state is the smallest, but the highest by the second criterion (Appendix Table A4). Based on the two criteria, the ranking of the regions within the states (Table 9) also vary, except for Orissa. Here, the southern region—constituting the districts of Phulbani, Koraput and Kalahandi—stands out as the most food insecure while the coastal region is the least. In Andhra, too, the coastal region is the most food secure and based on the two indicators first place is taken by the two inland regions, respectively. For Madhya Pradesh, the rankings are different and the southern and southwestern regions lead in food insecurity with FINSEC2 and FINSEC1, respectively.
Perhaps one can conjecture that the high (above 50 per cent) proportion of food-insecure households in Andhra Pradesh and Madhya Pradesh within FINSEC1 corresponds to more affluent groups who prefer to substitute higher value foods for cereals. Although
6 Demographic corrections for household composition are not attempted separately but the norms have
an inbuilt correction that corresponds to Indian population character.
18
this possibility cannot be ruled out, Table 8 consistently shows that the food-secure group according to FINSEC1 has, on average, a higher MPCE than the corresponding food-insecure group. This holds for all the states analysed and all regions within them. The possibility of dietary diversification associated with higher income is thus not apparent for the designated food-insecure group. Measures of association (contingency coefficient and Kendal’s tau-C) calculated for the sample households in Appendix Table 5A also suggest a moderately positive association between food security for the two measures essentially based on cereal intake and MPCE, respectively.
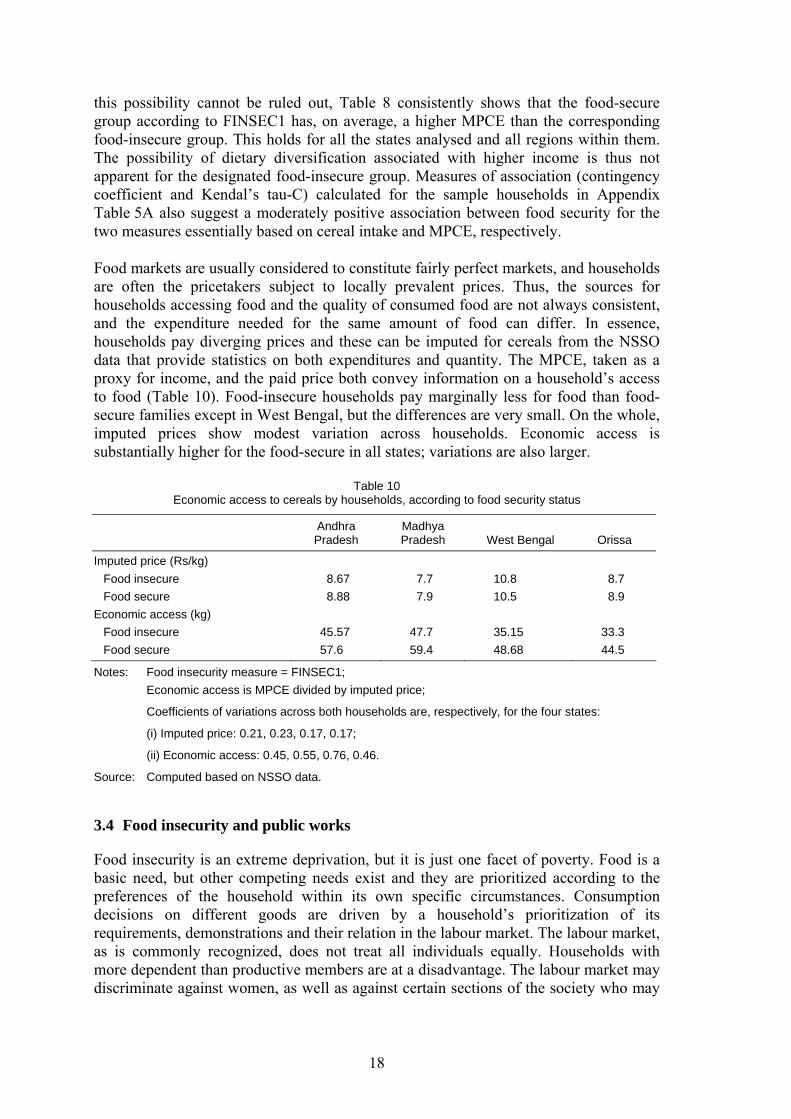
Food markets are usually considered to constitute fairly perfect markets, and households are often the pricetakers subject to locally prevalent prices. Thus, the sources for households accessing food and the quality of consumed food are not always consistent, and the expenditure needed for the same amount of food can differ. In essence, households pay diverging prices and these can be imputed for cereals from the NSSO data that provide statistics on both expenditures and quantity. The MPCE, taken as a proxy for income, and the paid price both convey information on a household’s access to food (Table 10). Food-insecure households pay marginally less for food than food-secure families except in West Bengal, but the differences are very small. On the whole, imputed prices show modest variation across households. Economic access is substantially higher for the food-secure in all states; variations are also larger.
Table 10 Economic access to cereals by households, according to food security status
Andhra Pradesh
Madhya Pradesh West Bengal Orissa
Imputed price (Rs/kg) Food insecure 8.67 7.7 10.8 8.7 Food secure 8.88 7.9 10.5 8.9
Economic access (kg) Food insecure 45.57 47.7 35.15 33.3 Food secure 57.6 59.4 48.68 44.5
Notes: Food insecurity measure = FINSEC1; Economic access is MPCE divided by imputed price;
Coefficients of variations across both households are, respectively, for the four states:
(i) Imputed price: 0.21, 0.23, 0.17, 0.17;
(ii) Economic access: 0.45, 0.55, 0.76, 0.46.
Source: Computed based on NSSO data.
3.4 Food insecurity and public works
Food insecurity is an extreme deprivation, but it is just one facet of poverty. Food is a basic need, but other competing needs exist and they are prioritized according to the preferences of the household within its own specific circumstances. Consumption decisions on different goods are driven by a household’s prioritization of its requirements, demonstrations and their relation in the labour market. The labour market, as is commonly recognized, does not treat all individuals equally. Households with more dependent than productive members are at a disadvantage. The labour market may discriminate against women, as well as against certain sections of the society who may

19
already be historically less privileged. In general, the design and implementation of PWP as well as specific socio-cultural attitudes in the states combine to determine who participate and who do not.
Public works (PWPs) constitute a special segment of the labour market. Although these programmes should be free of the iniquities of open market, it is hard to imagine a PWP without defects. Depending on the power structure and the efficiency of the state administration, discrimination has not spared the PWP. Furthermore, the difficulties of taking advantage of the employment opportunities, coupled with the nature of work offered and its income prospects, may discourage the truly needy households for whom the PWPs are intended. Frequently, the social stigma of a safety-net programme can also deter certain sections of the poor, but the ultimate decision of whether or not to participate depends on the importance a household places on its various needs.
A household is deemed to be participating in a public works programme if at least one member has been employed for at least 60 days through a PWP over the last 365 days. It is not an easy task to examine the relationship between participation and food insecurity, or for that matter, between MPCE and food insecurity. Neither is it simple to answer the questions: (i) is food insecurity eased by PWP participation?, or (ii) is participation motivated by food insecurity? These are fraught with complex causality and any econometric attempt in this direction is usually hindered by problems of endogeneity. However, as Table 11 shows, in the states under study, PWP covers a significantly small share of the food-insecure population, and that households considered as food secure also participate. In line with earlier findings, this suggests that even households not considered as income poor by the conventionally drawn poverty line are often food insecure, and apparently food is not the only factor motivating participation. However important the option of food for sustaining life, a household’s perception of its basic wants within today’s contemporary world ultimately determines its consumption and earning decisions. Despite this dilution, participation and food insecurity are statistically found to be mutually associated in a positive and significant way, as is reported in Appendix Table A5.
Table 11 Percentage of households participating in public works programmes, according to food-security status
Andhra Pradesh Madhya Pradesh West Bengal Orissa Region Insecure Secure Insecure Secure Insecure Secure Insecure Secure
1 1.3 2.3 4.2 1.8 0.7 4.0 1.8 2.4 2 1.4 1.4 3.7 2.8 2.2 1.3 6.8 7.0 3 0.8 0.1 0 0.9 1.6 1.0 5.8 3.5 4 0.4 3.0 2.7 4.8 8.9 2.7 5 3.7 2.9 6 5.0 2.4 7 5.7 4.2
Note: Food insecurity measure = FINSEC1. Source: Computed based on NSSO data
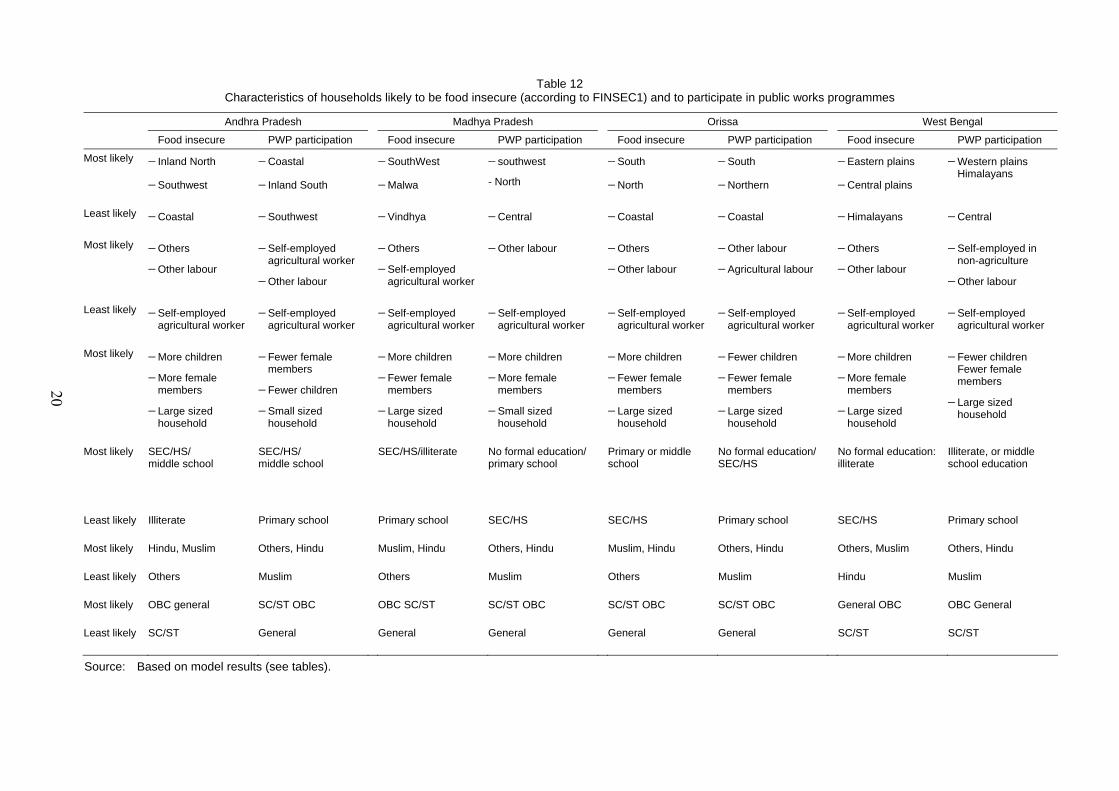
Table 12 Characteristics of households likely to be food insecure (according to FINSEC1) and to participate in public works programmes
Andhra Pradesh Madhya Pradesh Orissa West Bengal
Food insecure PWP participation Food insecure PWP participation Food insecure PWP participation Food insecure PWP participation
Most likely − Inland North
− Southwest
− Coastal
− Inland South
− SouthWest
− Malwa
− southwest
- North
− South
− North
− South
− Northern
− Eastern plains
− Central plains
− Western plains Himalayans
Least likely − Coastal − Southwest − Vindhya − Central − Coastal − Coastal − Himalayans − Central Most likely − Others
− Other labour
− Self-employed agricultural worker
− Other labour
− Others
− Self-employed agricultural worker
− Other labour − Others
− Other labour
− Other labour
− Agricultural labour
− Others
− Other labour
− Self-employed in non-agriculture
− Other labour Least likely − Self-employed
agricultural worker − Self-employed
agricultural worker − Self-employed
agricultural worker − Self-employed
agricultural worker − Self-employed
agricultural worker − Self-employed
agricultural worker − Self-employed
agricultural worker − Self-employed
agricultural worker Most likely − More children
− More female members
− Large sized household
− Fewer female members
− Fewer children
− Small sized household
− More children
− Fewer female members
− Large sized household
− More children
− More female members
− Small sized household
− More children
− Fewer female members
− Large sized household
− Fewer children
− Fewer female members
− Large sized household
− More children
− More female members
− Large sized household
− Fewer children Fewer female members
− Large sized household
Most likely SEC/HS/
middle school SEC/HS/ middle school
SEC/HS/illiterate No formal education/ primary school
Primary or middle school
No formal education/ SEC/HS
No formal education: illiterate
Illiterate, or middle school education
Least likely Illiterate Primary school Primary school SEC/HS SEC/HS Primary school SEC/HS Primary school
Most likely Hindu, Muslim Others, Hindu Muslim, Hindu Others, Hindu Muslim, Hindu Others, Hindu Others, Muslim Others, Hindu
Least likely Others Muslim Others Muslim Others Muslim Hindu Muslim
Most likely OBC general SC/ST OBC OBC SC/ST SC/ST OBC SC/ST OBC SC/ST OBC General OBC OBC General
Least likely SC/ST General General General General General SC/ST SC/ST
Source: Based on model results (see tables).
20
21
4 Modelling approach
The exercise attempts to study the diverging impact of certain important socioeconomic factors that are exogenous to the decisionmaking process in choosing between the two different scenarios, i.e., whether a household opts to remain food insecure or participate in a PWP, respectively. Given the nature of the data and the specifications in this study, both scenarios can be modelled as categorical variables. Based on discrete choice models of qualitative variables, in a non-coercive system both options can be characterized as binary choice variables (i.e., a household chooses to be or not to be food insecure, or a household chooses to participate or not to participate), given the rational household’s individual circumstances. The rationale for the model can be drawn from MacFadden’s random utility class of model according to which households choose the option if the corresponding net benefit N is positive. Correspondingly, a dummy dependent variable Y is defined so that Y = 1 if the household chooses the option, Y = 0 otherwise.
The probability of the event P = Prob(Y=1) is described by a logistic function and the odds are derived as:
P/(1-P) = exp(β´X)
where X is a vector of attribute variables describing the household and β is a vector of parameters bj, showing direction of the relation, the value of β itself being hard to interpret. Exp(b) are presented in Appendix Table A6 indicative of the factor of change on the odds due to unit change in explanatory variables. Thus Exp(bj) =1 signifies that a household’s decision, i.e., the odds that the household selects the event, is unaffected by a change in variable Xi.
Binary logistic models are estimated using socioeconomic and household features as exogenous variables, and ‘food insecurity’ and ‘participation’ as options to be explained. The two equations for ‘food insecurity’ are estimated using the two specifications FINSEC1 and FINSEC2. For ‘participation’, two equations are also estimated: one uncontrolled and the other controlled for food insecurity. The results of the binary logistic model (see Appendix Table A4) for food insecurity and participation are presented in the Appendix Tables A6 and A7. The essential propose of the model is to identify for a comparison the factors associated with the two different events.
The dependent variable takes discrete values indicating the household choice. The exogenous variables are, in most cases, also discrete and the model can help to identify the categories for each possible attribute of the two different options in varying degrees of likelihood. The categories can then be matched for similarity to determine whether the same categories that lead to food insecurity also induce participation. In Table 12 the two categories associated with the maximum likelihood of the options and one category with the least likelihood are compared. In the case of household features that are continuous variables, direction of the relationship is marked in each case.
Households engaged in agriculture are less likely to be food insecure, and both the self-employed in this sector and the labour are not represented among the first two categories in any of the states. This highlights the importance of agriculture to the population of India as a minimum support base. Agricultural labour, however, leads when poverty line based indicator FINSEC2 is used (Appendix Table A8). The
22
employment category ‘others’, which covers a broad range of livelihoods, appears most likely to be food insecure among households in all the states. Large-sized households are noted likely to be food insecure. The number of females has a negative effect in Orissa and Madhya Pradesh, perhaps a reflection of employment opportunities and norms for females. But the number of females has a negative relation to PWP participation in three states, with a positive one only in Madhya Pradesh. The link between the education of household head and PWP participation is not straightforward. Households headed by individuals with high- or middle-school education are more likely to be food insecure in Andhra Pradesh. This introduces the issue of employment opportunities for the educated, as well as suggests that the educated may prioritize other needs. Households headed by illiterate or only primary-educated individuals in Andhra Pradesh and Madhya Pradesh are least likely to participate in PWPs, respectively. But as expected, illiterate headed households are more likely to be food insecure in Madhya Pradesh and West Bengal. The assumption of a stigma from participating in a support programme could not be founded, as households headed by persons with intermediate education are also involved in the work programmes. When the analysis is extended to religious groups, Muslims are more likely to be food insecure in all the states and the category ‘others’ least likely, but curiously, Muslims are found to be least likely to take part in the PWPs. Similarly, households of OBCs in Andhra Pradesh and West Bengal are more likely to be insecure while the backward, SC/ST are least likely. However, these groups and OBCs participate in PWP.
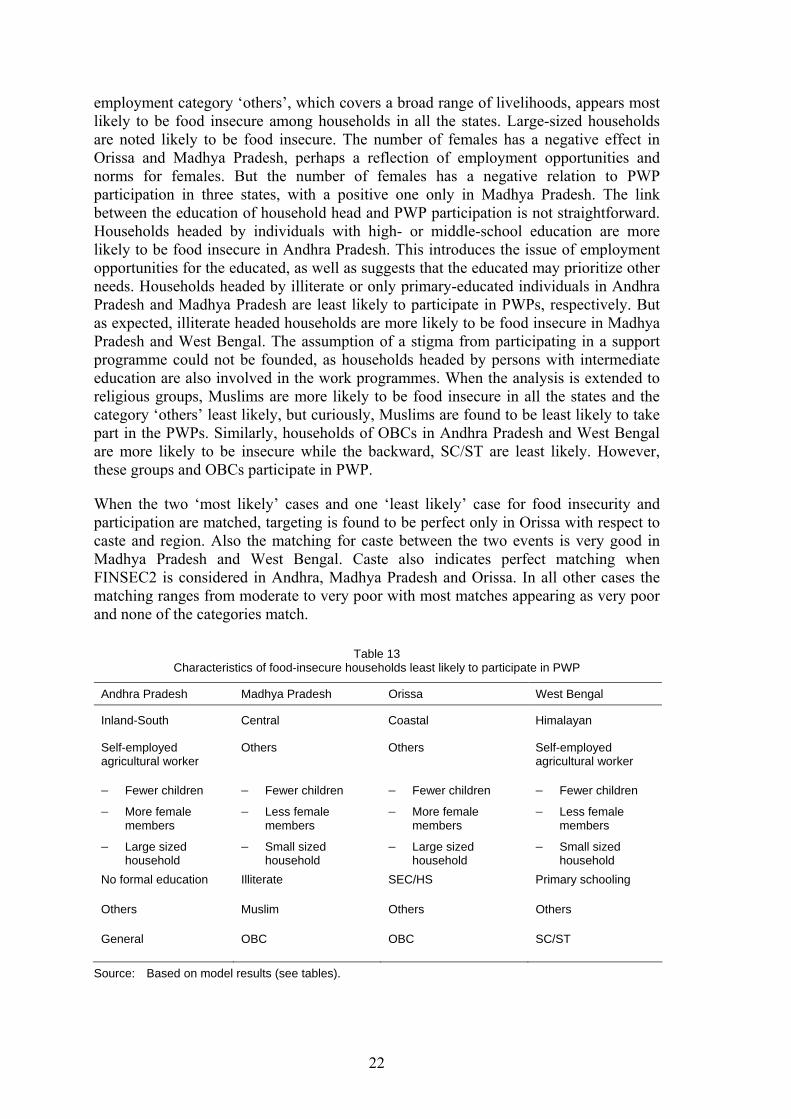
When the two ‘most likely’ cases and one ‘least likely’ case for food insecurity and participation are matched, targeting is found to be perfect only in Orissa with respect to caste and region. Also the matching for caste between the two events is very good in Madhya Pradesh and West Bengal. Caste also indicates perfect matching when FINSEC2 is considered in Andhra, Madhya Pradesh and Orissa. In all other cases the matching ranges from moderate to very poor with most matches appearing as very poor and none of the categories match.
Table 13 Characteristics of food-insecure households least likely to participate in PWP
Andhra Pradesh Madhya Pradesh Orissa West Bengal Inland-South Central Coastal Himalayan Self-employed agricultural worker
Others Others Self-employed agricultural worker
− Fewer children
− More female members
− Large sized household
− Fewer children
− Less female members
− Small sized household
− Fewer children
− More female members
− Large sized household
− Fewer children
− Less female members
− Small sized household
No formal education Illiterate SEC/HS Primary schooling
Others Muslim Others Others
General OBC OBC SC/ST
Source: Based on model results (see tables).

23
Table 13 indicates the non-participants within the food insecure by identifying those least likely to take part in PWPs. The least likely participants, despite food insecurity, include the poorly educated households in three states, the OBCs in two states, individuals from the ‘other’ religious group in three states. Also, self-employed agricultural workers in Andhra and West Bengal are also least inclined to take advantage of the PWPs. This is also true for household type ‘others’ in Madhya Pradesh and Orissa.
5 Conclusion
The influence of structural adjustment and globalization is pressuring the government to curb public expenditure, with profound impact on India’s historic regime of subsidies and development expenditure. There is now a need to devise instruments that attack deprivation in the most targeted way possible.
Food insecurity is a form of extreme deprivation but is distinct from the conventional income poverty. With the progress of time, households are now faced with increasing range of needs that are considered to be socially essential, such as health and education. Households currently encounter the necessity of making choices to fulfil their multiple needs according to individual priorities. The Indian polity has always underscored the importance of food security. With macro-level food sufficiency nearly attained, household food insecurity resulting from inadequate purchasing power is no longer tolerable. A number of poverty alleviation programmes, often working through public works, have attempted to address poverty and food insecurity among the rural masses but with less than total success The household food-security measures in India have often been subject to difficulty of administration, run-away cost, poor targeting and in many cases subject to corruption or political manipulation. With the change in paradigm, the government has redesigned poverty and distribution programmes to effect greater targeting and to introduce new schemes that directly address the food needs of specific sections of the population. The present-day programmes are therefore more innovative directed at greater focus and multiple objectives.
However, the broad based, more market consistent, productivity enhancing and, above all, self-selecting public works programme is the tool that has recently received more credence both politically and economically. Public works have been in operation in India over decades in different forms but now a new law is being enacted to enable households to legally demand wage employment through public works. While these employment programmes have many in-built advantages a nationwide programme would be costly to the budget and its superiority can be borne out only by its effective design to enable appropriate targeting of the needy. This paper essentially tries to look, using NSSO survey data, for the relationship between household food insecurity and participation in public works.
Based on indications that cereals are the main dietary item in India’s rural areas and that they have a complementary relationship to other foods, a food security specification is constructed based on ICMR norm on cereal consumption. For comparison, food security specified as poverty in the conventional sense is also used and the relation between the two specifications, though positively associated, is far from being one to one. Both food insecurity specifications, however, indicate a positive association with PWP
24
participation as it exists. To avoid endogeneity problems with regard to econometrics, exogenous socioeconomic attributes associated with the incidence of food insecurity and participation are identified by logistic models and matched. The factors that shape the two different incidences are found to have limited similarity. The performance and design of the nationwise PWP programme would need constant monitoring for correcting food insecurity while economizing on public expenditure.
References
Alderman, H., and M. Garcia (1993). ‘Poverty, Household Food Security and Nutrition in Rural Pakistan’. IFPRI Research Report 96. Washington, DC: International Food Policy Research Institute.
Braun, J. von (1995). ‘Employment for Poverty Reduction and Food Security: Concept, Research Issues and Overviews’, in J. von Braun (ed.), Employment for Poverty Reduction and Food Security. Washington, DC: International Food Policy Research Institute.
Deaton, A. (2001). ‘Consumption Prices and Poverty Rates in India 1999-2000: National Sample Survey Organization 2000/1’. Sarvekshana, 24-25 (1).
Drèze, Jean (2001). ‘Starving the Poor’. The Hindu, 26 February.
Gayi, S. K. (1995). ‘Adjusting to the Social Cost of Adjustment in Ghana: Problems and Prospects’, in J. Vivian (ed.), Adjustment and Social Sector Restructuring. London: Frank Cass.
Government of India (GoI) (various years). ‘The Economic Survey’. New Delhi: Ministry of Finance.
Government of Orissa. Orissa Agricultural Statistics, 1995-96. Bhubaneswar: Directorate of Economics and Statistics.
Harriss-White, B. (1999). ‘State, Market, Collective and Household Action in India’s Social Sector’, in B. Harriss-White and S. Subramanian (eds), Illfare in India: Essays on India’s Social Sector in Honour of S. Guhan. New Delhi: Sage.
Hirway, I., and P. Terhal (1994). Towards Employment Guarantee in India: Indian and International Experiences in Rural Public Works Programmes. New Delhi: Sage.
Kaur, S., and S. K. Goyal (1996). ‘A Study of Wage Discrimination against Women Agricultural Labourers’. Agricultural Situation in India, 53 (4 July).
M. S. Swaminathan Research Foundation (MSSRF) (2001). Food Insecurity Atlas of Rural India, 2001. Chennai: MSSRF.
Patnaik, U. (2001). ‘Concentration of Regional Food Output and the PDS’. People’s Democracy, XXV (23): June.
Pinstrup-Andersen, P. (2002). ‘Food and Agricultural Policy for a Globalizing World: Preparing for the Future. American Journal of Agricultural Economics, 84 (5): 1204-14.
25
Radhakrishna R., and C. Ravi (1992). ‘Effects of Growth, Relative Price and Preferences on Food and Nutrition’. Indian Economic Review, 27: 303-23.
Ravallion, M., and Q. Wodon (1998). ‘Evaluating a Targeted Social Program when Placement is Decentralized’. WB Policy Research Working Paper No. 1945. Washington, DC: World Bank.
Ravallion, M. (1990). ‘Reaching the Poor through Rural Public Employment’. WB Discussion Paper No. 94. Washington, DC: World Bank.
Sen, A., and J. Drèze (1999). The Amaryta Sen and Jean Drèze Omnibus. New Delhi: Oxford University Press.
Sen, A., and P. Jha (2005). ‘Rural Employment: Patterns and Trends from National Sample Survey’, in R. Nayyar and A. N. Sharma (eds), Rural Transformation in India. Delhi: Institute of Human Development.
Sengupta, S., and P. D. Joshi (1978). ‘Consumption of Cereals and Energy’. Sarvekshana, July.
Singh, K. (1999). Rural Development. New Delhi: Sage.
Swaminathan, M. (2001). ‘A Further Attack on the PDS’. Frontline, 18 (2).
26
Appendix
A1 Various social assurance and employment-generating programmes
A1.1 Social assurance programme
— National old age pension scheme (NOAPS): Rs 75 per month to persons over 65 years.
— National family benefit scheme (NFBS): Rs 10,000 as a lumpsum benefit to bereaved families below poverty in the event of the death of primary breadwinner.
— National maternity benefit scheme (NMBS): Rs 500 per pregnancy, for the first two live births.
A1.2 Recent employment-generating programmes for public works
— National food-for-work programme (FFW): Launched in 2004 in 150 most backward districts of the country, with the objective of intensifying the generation of supplementary wage employment. It is open to all rural poor who are in need of wage employment and wish to do manual and unskilled work.
— Sampoorna Grameen Rozgar Yojana (SGRY): Launched in 2001, it aims to provide additional wage employment in all rural areas and thus improve food security and nutritional levels. The SGRY is open to all rural poor who need wage employment and are willing to do manual and unskilled work in the village/habitat proximity. The programme is implemented to PRI. The schemes Jawahar Gram Samriddhhi Yojna (JGSY) and employment assurance scheme (EAS) have been fully integrated with SGRY.
— Jayprakash Rozgar Guarantee Yojna: Operational modalities for launching of this scheme are being worked out (Economic Survey 2003). The scheme seeks to provide guaranteed employment to the unemployed in the most distressed districts of the country.
— National Rural Employment Guarantee Bill (NREG) was introduced in parliament in December 2004, and incorporates the following salient features Economic Survey 2005):
• State governments to provide at least 100 days of guaranteed wage employment in every financial year to every household whose adult members volunteer to do unskilled work.
• Sampoorna Grameen Rozgar Yojna (SGRY) and the national food-for-work programme to be subsumed within the scheme once the Act is enforced.
• Until such time as a wage rate is fixed by the central government, the minimum wage for agricultural labourers shall be applicable for the scheme.
• An applicant not provided with employment within 15 days is to be entitled to a daily unemployment allowance as specified by the state government subject to economic capacity, provided such rate is not less than a quarter of the wage rate for the first 30 days during the financial
27
year and not less than a half of the wage rate for the remaining period of the financial year.
• Central Employment Guarantee Council to be constituted to discharge various functions and duties assigned to the Council. Every state government also to constitute a state council for this purpose.
• Panchayat at the district level to constitute a standing committee of its members to supervise, monitor and oversee the implementation of the scheme within the district. For every block, state government is to appoint a programme officer for implementation of the scheme. Gram Panchaya to be responsible for the identification of the projects as per the recommendations of the gram sabha and for executing and supervising such works.
• Central government to establish a national employment guarantee fund. State governments to establish state employment guarantee funds for the implementation of the scheme.
• The scheme to be self-selecting in the sense that those among the poor who need work at the minimum wage would report for work under the scheme.
A2 Districts in different regions
Andhra Pradesh
Coastal: Srikakulam, Vizianagaram, Vishakhapatnam, East Godavari, West Godavari Krishna, Guntur, Prakasam, Nellore
Inland north: Mahbubnagar, Rangareddi, Hyderabad, Medak, Nizamabad, Adilabad, Karimnagar, Warangal, Khammam, Nalgonda
Southwest: Anantapur, Kurnool
Inland south: Chittor, Cuddapah
Madhya Pradesh
Chattisgarh: Surguja, Bilaspur, Raigarh, Rajnandgaon, Durg Bastar, Raipur
Vindhya: Tikamgarh, Chhatarpur, Panna, Satna, Rewa, Shahdol, Sidhi
Central: Sagar, Damoh, Vidishah, Bhopal, Sahore, Raisen
Malwa: Mandsaur, Ratlam, Ujjain, Shajapur, Dewas, Jhabua, Dhar, Indore, Rajgarh
South: Jabalpur, Narsimhapur, Mandla, Chhindwara, Seoni, Balaghat
Southwest: Khargone, Khandwa, Betul, Kosangabad
North: Morena, Bhind, Gwalior, Datia, Shivpuri, Guna
Orissa
Coastal: Baleshwar, Cuttak, Ganjam, Puri
South: Phulbani, Koraput, Kalahandi
North: Sambhalpur, Sundargarh, Keonjhar, Mayurbhanj, Dhenkanal, Bolangir
28
West Bengal
Himalayan: Koch, Bihar, Jalpaiguri, Darjiling
Eastern plains: West Dinajpur, Maldah, Murshidabad, Nadia, Birbhum
Central plains: North 24-Parganas, Calcutta, Howrah, Hooghly, Burdwan, South 24-Parganas
Western plains: Midnapur, Bankura, Purulya
A3 Measures of association
Measures of association are indexes that attempt to quantify the relationship between variables in cross classification. The basic hypothesis is that two variables of a cross-tabulated table are independent of each other. The basis for the measures is the Pearson’s chi-square χ2. The probability of an observation falling in the cell ij given as P(ij) worked under independence hypothesis as product of marginal probabilities of the two categories defining the cell.
P(ij) = (count in row i)/N x (count in column j)/N.
The expected number falling in cell ij is:
E(ij)=P(ij) x N.
The statistic then measures the difference between expected and observed number of observations O(i) summed over all cells to obtain:
χ2 = Σ Σ(O(ij)-E(ij)2 /E(ij)
which has a degree of freedom of (r-1) x (c-1) where r and c are number of rows and columns, respectively.
To obtain information on the strength and direction of association insensitive to sample size also and to restrict the coefficient between 0 and 1, two other measures are used:
(1) Contingency coefficient (CC) is a nominal measure with no indication of direction:
CC= Sqrt (χ2/ (χ2+N) );
(2) Kendall tau-C (KC) is an ordinal measure that considers if cases are concordant or discordant or tied and a positive (negative) association is concluded with the preponderance of concordant (discordant) pairs:
KC= 2m (P-Q)/N2 (m-1))
Where P and Q are numbers of concordant and discordant pairs, respectively, and m is the smaller number of the rows and columns.
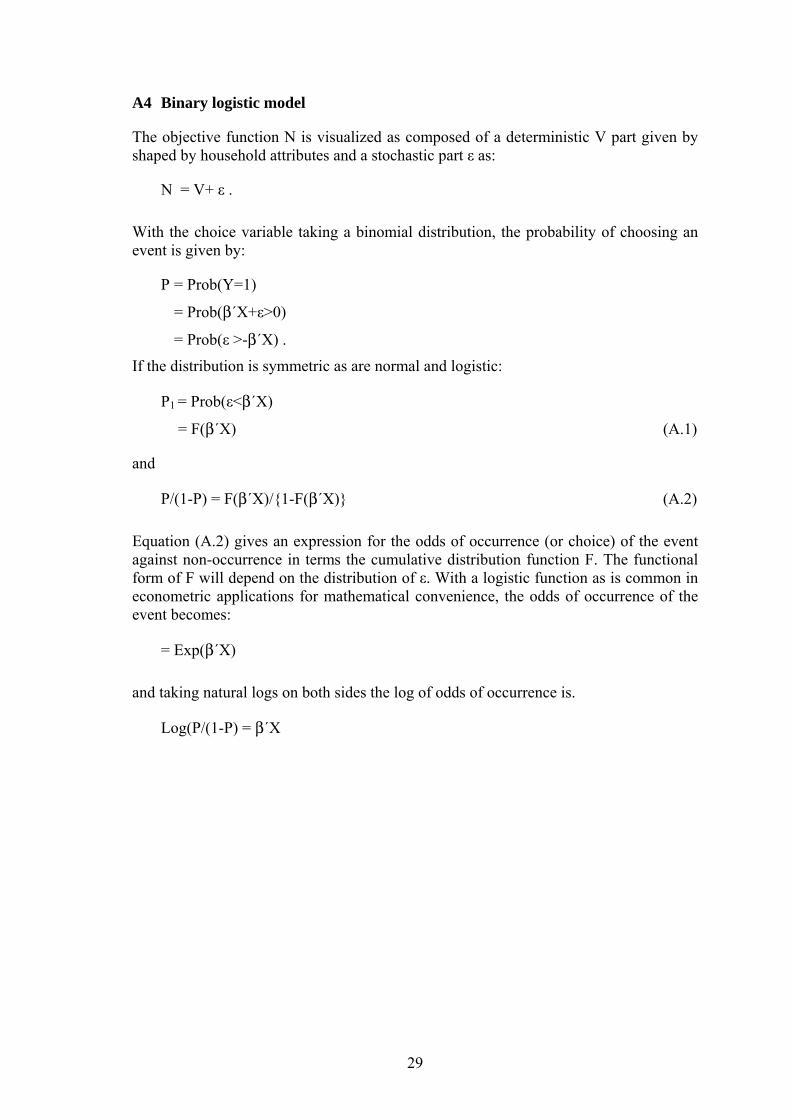
29
A4 Binary logistic model
The objective function N is visualized as composed of a deterministic V part given by shaped by household attributes and a stochastic part ε as:
N = V+ ε .
With the choice variable taking a binomial distribution, the probability of choosing an event is given by:
P = Prob(Y=1)
= Prob(β´X+ε>0)
= Prob(ε >-β´X) .
If the distribution is symmetric as are normal and logistic:
P1 = Prob(ε<β´X)
= F(β´X) (A.1)
and
P/(1-P) = F(β´X)/{1-F(β´X)} (A.2)
Equation (A.2) gives an expression for the odds of occurrence (or choice) of the event against non-occurrence in terms the cumulative distribution function F. The functional form of F will depend on the distribution of ε. With a logistic function as is common in econometric applications for mathematical convenience, the odds of occurrence of the event becomes:
= Exp(β´X)
and taking natural logs on both sides the log of odds of occurrence is.
Log(P/(1-P) = β´X
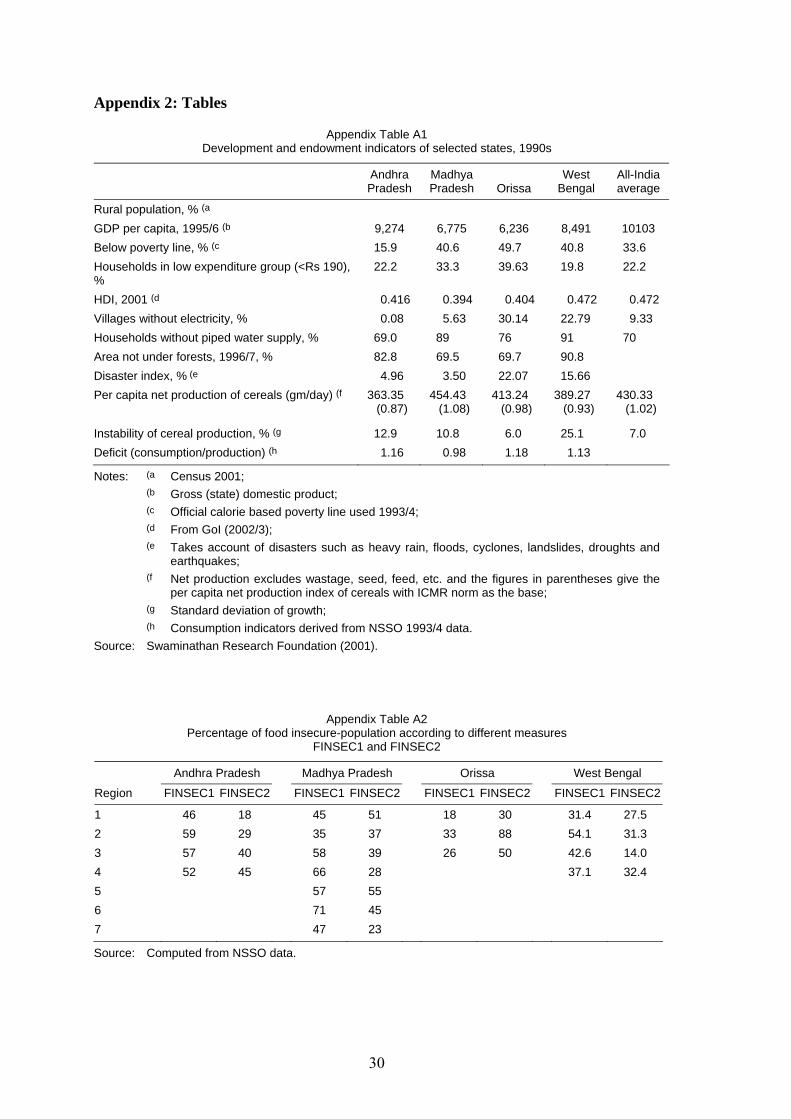
30
Appendix 2: Tables
Appendix Table A1 Development and endowment indicators of selected states, 1990s
Andhra Pradesh
Madhya Pradesh Orissa
West Bengal
All-India average
Rural population, % (a GDP per capita, 1995/6 (b 9,274 6,775 6,236 8,491 10103 Below poverty line, % (c 15.9 40.6 49.7 40.8 33.6 Households in low expenditure group (<Rs 190), %
22.2 33.3 39.63 19.8 22.2
HDI, 2001 (d 0.416 0.394 0.404 0.472 0.472 Villages without electricity, % 0.08 5.63 30.14 22.79 9.33 Households without piped water supply, % 69.0 89 76 91 70 Area not under forests, 1996/7, % 82.8 69.5 69.7 90.8 Disaster index, % (e 4.96 3.50 22.07 15.66 Per capita net production of cereals (gm/day) (f 363.35
(0.87) 454.43
(1.08) 413.24
(0.98) 389.27
(0.93) 430.33
(1.02)
Instability of cereal production, % (g 12.9 10.8 6.0 25.1 7.0 Deficit (consumption/production) (h 1.16 0.98 1.18 1.13
Notes: (a Census 2001; (b Gross (state) domestic product; (c Official calorie based poverty line used 1993/4; (d From GoI (2002/3); (e Takes account of disasters such as heavy rain, floods, cyclones, landslides, droughts and
earthquakes; (f Net production excludes wastage, seed, feed, etc. and the figures in parentheses give the
per capita net production index of cereals with ICMR norm as the base; (g Standard deviation of growth; (h Consumption indicators derived from NSSO 1993/4 data. Source: Swaminathan Research Foundation (2001).
Appendix Table A2 Percentage of food insecure-population according to different measures
FINSEC1 and FINSEC2
Andhra Pradesh Madhya Pradesh Orissa West Bengal
Region FINSEC1 FINSEC2 FINSEC1 FINSEC2 FINSEC1 FINSEC2 FINSEC1 FINSEC2
1 46 18 45 51 18 30 31.4 27.5 2 59 29 35 37 33 88 54.1 31.3 3 57 40 58 39 26 50 42.6 14.0 4 52 45 66 28 37.1 32.4 5 57 55 6 71 45 7 47 23
Source: Computed from NSSO data.
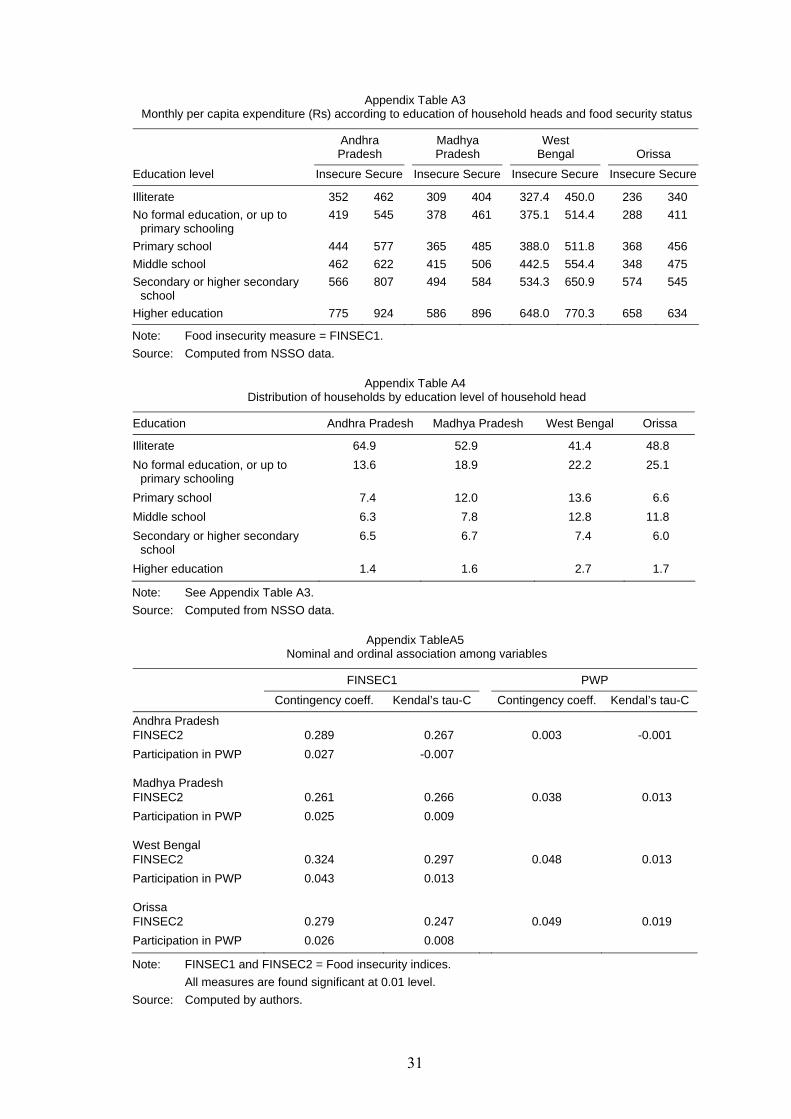
31
Appendix Table A3 Monthly per capita expenditure (Rs) according to education of household heads and food security status
Andhra Pradesh
Madhya Pradesh
West Bengal
Orissa
Education level Insecure Secure Insecure Secure Insecure Secure Insecure Secure
Illiterate 352 462 309 404 327.4 450.0 236 340 No formal education, or up to
primary schooling 419 545 378 461 375.1 514.4 288 411
Primary school 444 577 365 485 388.0 511.8 368 456 Middle school 462 622 415 506 442.5 554.4 348 475 Secondary or higher secondary
school 566 807 494 584 534.3 650.9 574 545
Higher education 775 924 586 896 648.0 770.3 658 634
Note: Food insecurity measure = FINSEC1. Source: Computed from NSSO data.
Appendix Table A4 Distribution of households by education level of household head
Education Andhra Pradesh Madhya Pradesh West Bengal Orissa
Illiterate 64.9 52.9 41.4 48.8 No formal education, or up to
primary schooling 13.6 18.9 22.2 25.1
Primary school 7.4 12.0 13.6 6.6 Middle school 6.3 7.8 12.8 11.8 Secondary or higher secondary
school 6.5 6.7 7.4 6.0
Higher education 1.4 1.6 2.7 1.7
Note: See Appendix Table A3. Source: Computed from NSSO data.
Appendix TableA5 Nominal and ordinal association among variables
FINSEC1 PWP
Contingency coeff. Kendal’s tau-C Contingency coeff. Kendal’s tau-C
Andhra Pradesh FINSEC2 0.289 0.267 0.003 -0.001 Participation in PWP 0.027 -0.007 Madhya Pradesh FINSEC2 0.261 0.266 0.038 0.013 Participation in PWP 0.025 0.009 West Bengal FINSEC2 0.324 0.297 0.048 0.013 Participation in PWP 0.043 0.013 Orissa FINSEC2 0.279 0.247 0.049 0.019 Participation in PWP 0.026 0.008
Note: FINSEC1 and FINSEC2 = Food insecurity indices. All measures are found significant at 0.01 level. Source: Computed by authors.
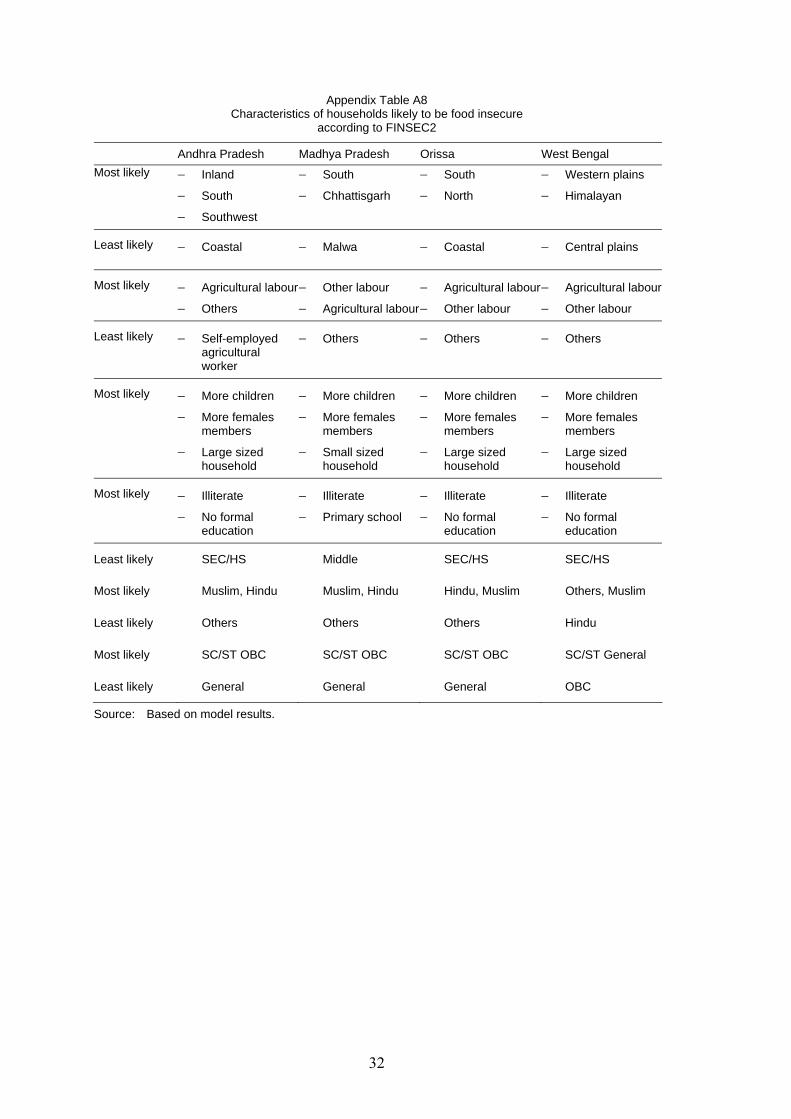
32
Appendix Table A8 Characteristics of households likely to be food insecure
according to FINSEC2
Andhra Pradesh Madhya Pradesh Orissa West Bengal Most likely − Inland
− South
− Southwest
− South
− Chhattisgarh
− South
− North
− Western plains
− Himalayan
Least likely − Coastal − Malwa − Coastal − Central plains
Most likely − Agricultural labour
− Others
− Other labour
− Agricultural labour
− Agricultural labour
− Other labour
− Agricultural labour
− Other labour Least likely − Self-employed
agricultural worker
− Others − Others − Others
Most likely − More children
− More females members
− Large sized household
− More children
− More females members
− Small sized household
− More children
− More females members
− Large sized household
− More children
− More females members
− Large sized household
Most likely − Illiterate
− No formal education
− Illiterate
− Primary school
− Illiterate
− No formal education
− Illiterate
− No formal education
Least likely SEC/HS Middle SEC/HS SEC/HS
Most likely Muslim, Hindu Muslim, Hindu Hindu, Muslim Others, Muslim
Least likely Others Others Others Hindu
Most likely SC/ST OBC SC/ST OBC SC/ST OBC SC/ST General
Least likely General General General OBC
Source: Based on model results.

33
Appendix Table A6 Binary logistic model for food insecurity
Part 1: Andhra Pradesh
FINSEC1 FINSEC2
Coefficient (B) Significance Exp(B) Coefficient (B) Significance Exp(B)
ANDHRA PRADESH
Region (base = inland south) Coastal -0.169 0.001 0.845 -1.577 0.001 0.207Inland north 0.309 0.001 1.363 -1.107 0.001 0.331Southwestern 0.074 0.001 1.077 -0.554 0.002 0.573
Household type (base = others)
Self-employed, nonagriculture 0.612 0.001 1.845 0.454 0.002 1.575
Agriculture labour 0.297 0.001 1.346 0.347 0.001 1.415
Other labour 0.140 0.001 1.150 0.656 0.001 1.927
Self-employed agriculture 0.520 0.001 1.683 0.233 0.002 1.262
Education of head (base = secondary
or higher secondary)
Illiterate -0.450 0.001 0.637 0.985 0.002 2.677No formal education/ up to
primary school -0.326 0.001
0.722 0.563
0.002 1.756Primary school -0.137 0.002 0.872 0.318 0.002 1.375Middle school -0.116 0.002 0.891 0.320 0.003 1.377
Household properties Size 0.135 0.000 1.14 0.185 0.000 1.203Child-ratio 1.794 0.002 6.02 2.935 0.003 8.813Adult female-ratio 0.472 0.003 1.60 1.124 0.004 3.677
Minority religion (base = Hinduism) Islam -0.045 0.002 0.956 0.006 0.002 1.006Others -0.074 0.002 0.929 -0.076 0.002 0.927
Caste (base = general) SC/ST -0.081 0.001 0.922 1.225 0.001 3.403OBCs 0.020 0.001 1.02 0.786 0.001 2.195
Constant -1.179 0.002 -4.36 0.003
Table A6 continues
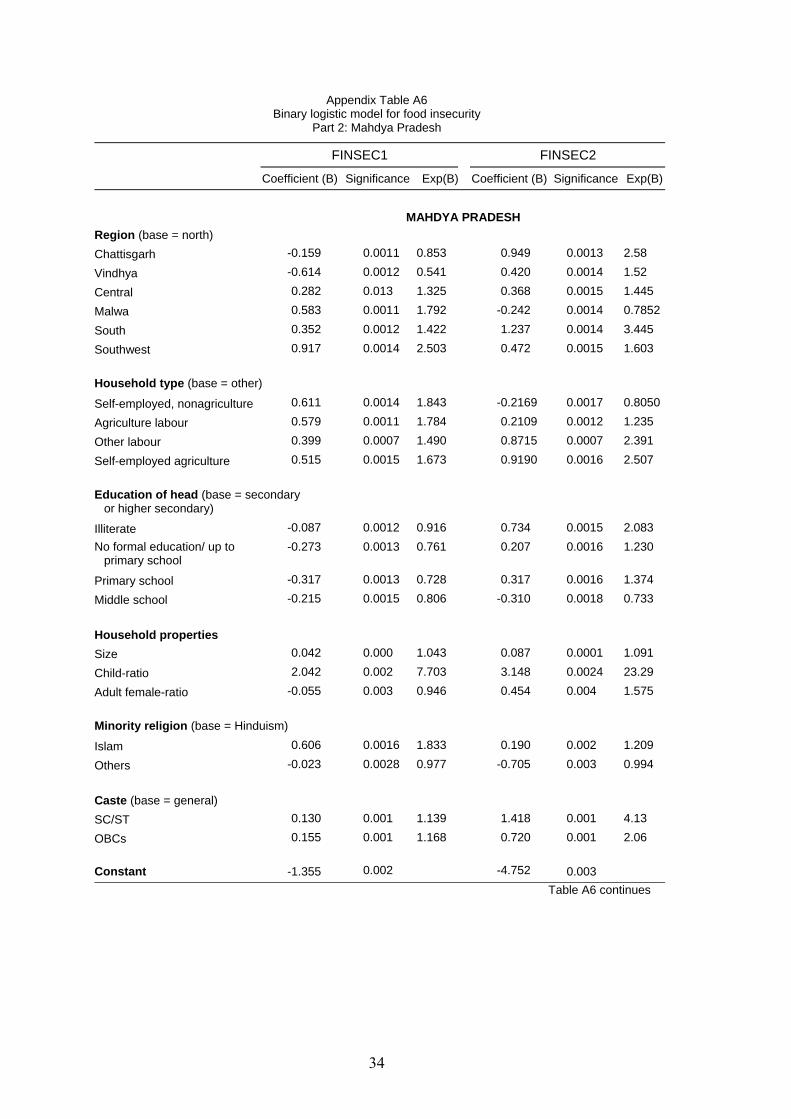
34
Appendix Table A6 Binary logistic model for food insecurity
Part 2: Mahdya Pradesh
FINSEC1 FINSEC2
Coefficient (B) Significance Exp(B) Coefficient (B) Significance Exp(B)
MAHDYA PRADESH
Region (base = north) Chattisgarh -0.159 0.0011 0.853 0.949 0.0013 2.58
Vindhya -0.614 0.0012 0.541 0.420 0.0014 1.52
Central 0.282 0.013 1.325 0.368 0.0015 1.445
Malwa 0.583 0.0011 1.792 -0.242 0.0014 0.7852
South 0.352 0.0012 1.422 1.237 0.0014 3.445
Southwest 0.917 0.0014 2.503 0.472 0.0015 1.603
Household type (base = other)
Self-employed, nonagriculture 0.611 0.0014 1.843 -0.2169 0.0017 0.8050
Agriculture labour 0.579 0.0011 1.784 0.2109 0.0012 1.235
Other labour 0.399 0.0007 1.490 0.8715 0.0007 2.391
Self-employed agriculture 0.515 0.0015 1.673 0.9190 0.0016 2.507
Education of head (base = secondary
or higher secondary)
Illiterate -0.087 0.0012 0.916 0.734 0.0015 2.083 No formal education/ up to
primary school -0.273 0.0013 0.761 0.207 0.0016 1.230
Primary school -0.317 0.0013 0.728 0.317 0.0016 1.374
Middle school -0.215 0.0015 0.806 -0.310 0.0018 0.733
Household properties
Size 0.042 0.000 1.043 0.087 0.0001 1.091
Child-ratio 2.042 0.002 7.703 3.148 0.0024 23.29
Adult female-ratio -0.055 0.003 0.946 0.454 0.004 1.575
Minority religion (base = Hinduism)
Islam 0.606 0.0016 1.833 0.190 0.002 1.209
Others -0.023 0.0028 0.977 -0.705 0.003 0.994
Caste (base = general)
SC/ST 0.130 0.001 1.139 1.418 0.001 4.13
OBCs 0.155 0.001 1.168 0.720 0.001 2.06 Constant -1.355 0.002 -4.752 0.003
Table A6 continues
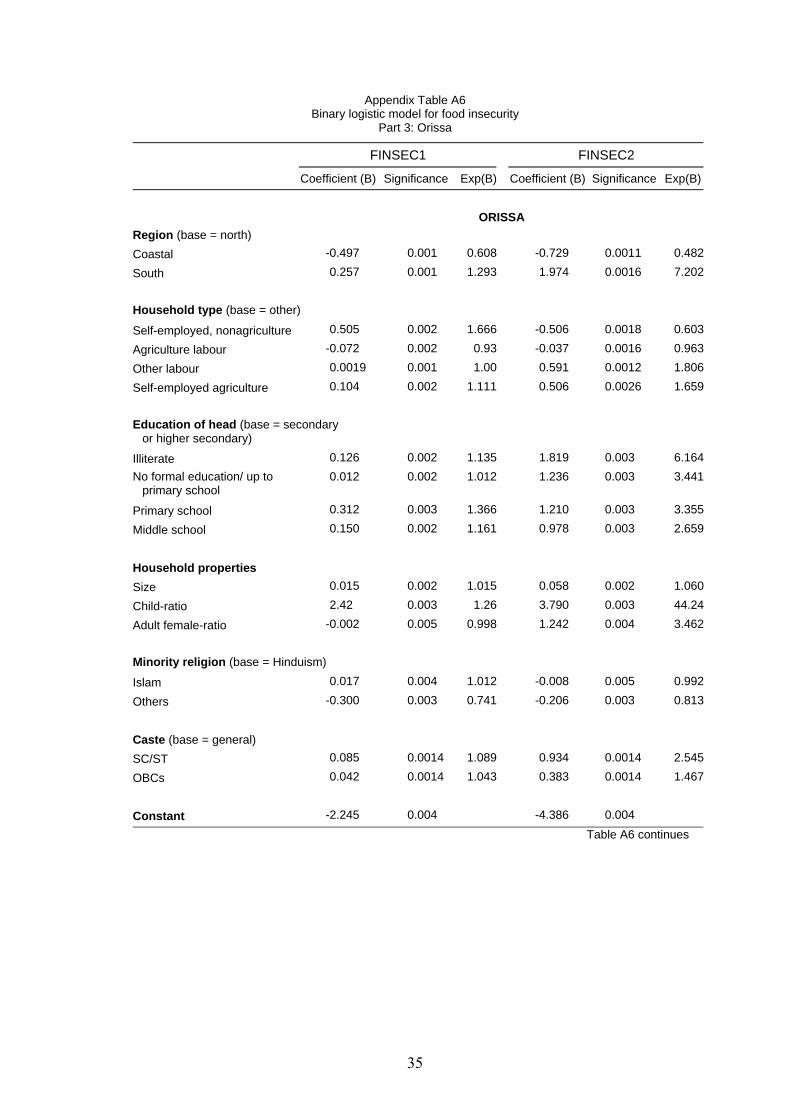
35
Appendix Table A6 Binary logistic model for food insecurity
Part 3: Orissa
FINSEC1 FINSEC2
Coefficient (B) Significance Exp(B) Coefficient (B) Significance Exp(B)
ORISSA
Region (base = north) Coastal -0.497 0.001 0.608 -0.729 0.0011 0.482
South 0.257 0.001 1.293 1.974 0.0016 7.202
Household type (base = other)
Self-employed, nonagriculture 0.505 0.002 1.666 -0.506 0.0018 0.603
Agriculture labour -0.072 0.002 0.93 -0.037 0.0016 0.963
Other labour 0.0019 0.001 1.00 0.591 0.0012 1.806
Self-employed agriculture 0.104 0.002 1.111 0.506 0.0026 1.659 Education of head (base = secondary
or higher secondary)
Illiterate 0.126 0.002 1.135 1.819 0.003 6.164No formal education/ up to
primary school 0.012 0.002 1.012 1.236 0.003 3.441
Primary school 0.312 0.003 1.366 1.210 0.003 3.355
Middle school 0.150 0.002 1.161 0.978 0.003 2.659
Household properties
Size 0.015 0.002 1.015 0.058 0.002 1.060
Child-ratio 2.42 0.003 1.26 3.790 0.003 44.24
Adult female-ratio -0.002 0.005 0.998 1.242 0.004 3.462
Minority religion (base = Hinduism)
Islam 0.017 0.004 1.012 -0.008 0.005 0.992
Others -0.300 0.003 0.741 -0.206 0.003 0.813
Caste (base = general)
SC/ST 0.085 0.0014 1.089 0.934 0.0014 2.545
OBCs 0.042 0.0014 1.043 0.383 0.0014 1.467
Constant -2.245 0.004 -4.386 0.004
Table A6 continues
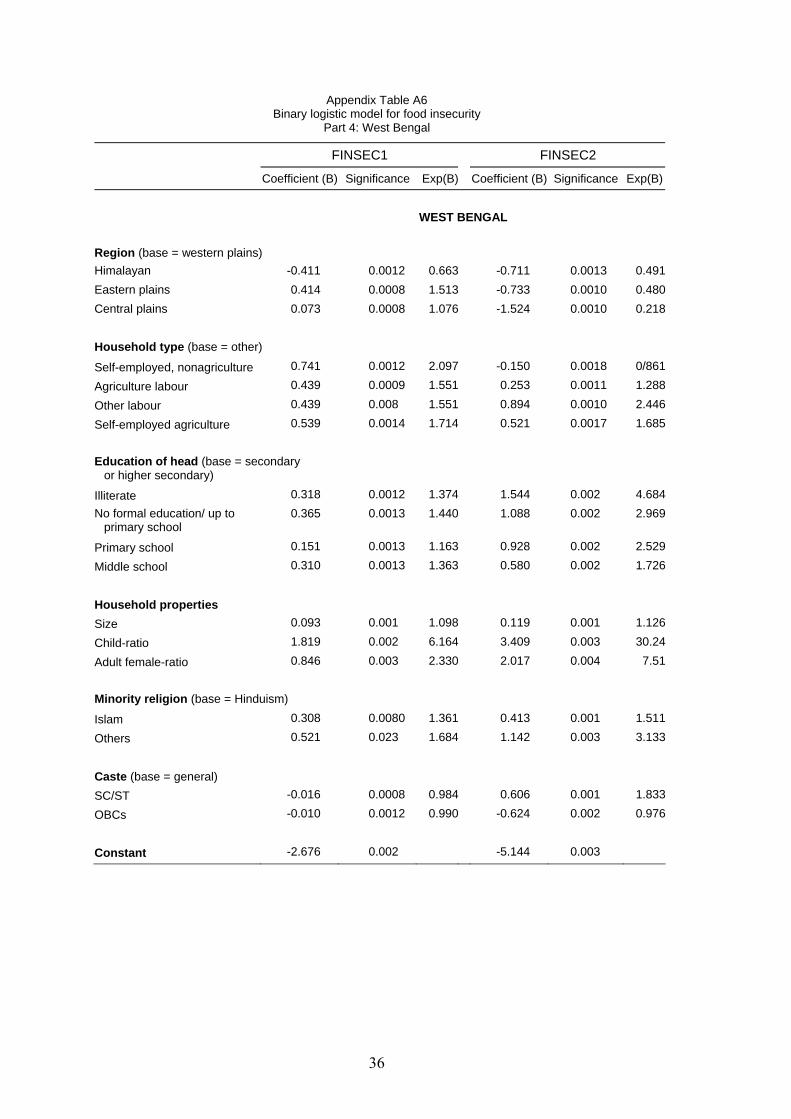
36
Appendix Table A6 Binary logistic model for food insecurity
Part 4: West Bengal
FINSEC1 FINSEC2
Coefficient (B) Significance Exp(B) Coefficient (B) Significance Exp(B)
WEST BENGAL
Region (base = western plains) Himalayan -0.411 0.0012 0.663 -0.711 0.0013 0.491Eastern plains 0.414 0.0008 1.513 -0.733 0.0010 0.480Central plains 0.073 0.0008 1.076 -1.524 0.0010 0.218
Household type (base = other)
Self-employed, nonagriculture 0.741 0.0012 2.097 -0.150 0.0018 0/861
Agriculture labour 0.439 0.0009 1.551 0.253 0.0011 1.288
Other labour 0.439 0.008 1.551 0.894 0.0010 2.446
Self-employed agriculture 0.539 0.0014 1.714 0.521 0.0017 1.685 Education of head (base = secondary
or higher secondary)
Illiterate 0.318 0.0012 1.374 1.544 0.002 4.684No formal education/ up to
primary school 0.365 0.0013 1.440 1.088 0.002 2.969
Primary school 0.151 0.0013 1.163 0.928 0.002 2.529
Middle school 0.310 0.0013 1.363 0.580 0.002 1.726
Household properties
Size 0.093 0.001 1.098 0.119 0.001 1.126
Child-ratio 1.819 0.002 6.164 3.409 0.003 30.24
Adult female-ratio 0.846 0.003 2.330 2.017 0.004 7.51
Minority religion (base = Hinduism)
Islam 0.308 0.0080 1.361 0.413 0.001 1.511
Others 0.521 0.023 1.684 1.142 0.003 3.133
Caste (base = general)
SC/ST -0.016 0.0008 0.984 0.606 0.001 1.833
OBCs -0.010 0.0012 0.990 -0.624 0.002 0.976
Constant -2.676 0.002 -5.144 0.003

37
Appendix Table A7 Binary logistic model for participation in PWP
Part I: Andhra Pradesh
Without control for food insecurity With control for food insecurity
Coefficient (B) Significance Exp(B) Coefficient (B) Significance Exp(B)
ANDHRA PRADESH
Constant -2.929 0.008 -3.58 0.017
Region (base = inland south) Coastal 0.129 0.004 1.14 1.19 0.011 3.28 Inland north -0.374 0.004 0.69 1.07 0.011 2.91 Southwest -1.135 0.008 0.32 0.706 0.0013 2.03
Household type (base = other)
Self-employed, nonagriculture -0.186 0.005 0.83 0.430 0.007 1.537
Agriculture labour -0.839 0.005 0.43 -1.066 0.009 0.344
Other labour -0.228 0.003 0.79 0.171 0.005 1.186
Self-employed agriculture -0.060 0.005 0.94 0.189 0.007 1.208 Education of head (base = secondary or
higher secondary)
Illiterate -0.06 0.004 0.348 -1.001 0.005 0.367 No formal education or up to
primary school -0.78 0.005 0.168 -3.22 0.015 0.039
Primary school -2.55 0.009 0.078 -2.12 0.014 0.119
Middle school -1.00 0.006 0.367 -1.24 0.009 0.288
Household properties
Size -0.022 0.006 0.98 -0.206 0.001 0.814
Child-ratio 0.915 0.007 0.40 0.597 0.013 1.817
Adult female-ratio -0.478 0.009 0.02 -2.914 0.021 0.053
Minority religion (base = Hinduism)
Islam -0.274 0.009 0.76 0.441 0.010 1.55
Others -0.461 0.005 1.59 -4.866 0.108 0.008
Caste (base = general)
SC/ST 1.088 0.004 2.97 1.17 0.007 3.24
OBCs 0.775 0.004 2.17 0.86 0.006 2.37
Table A7 continues
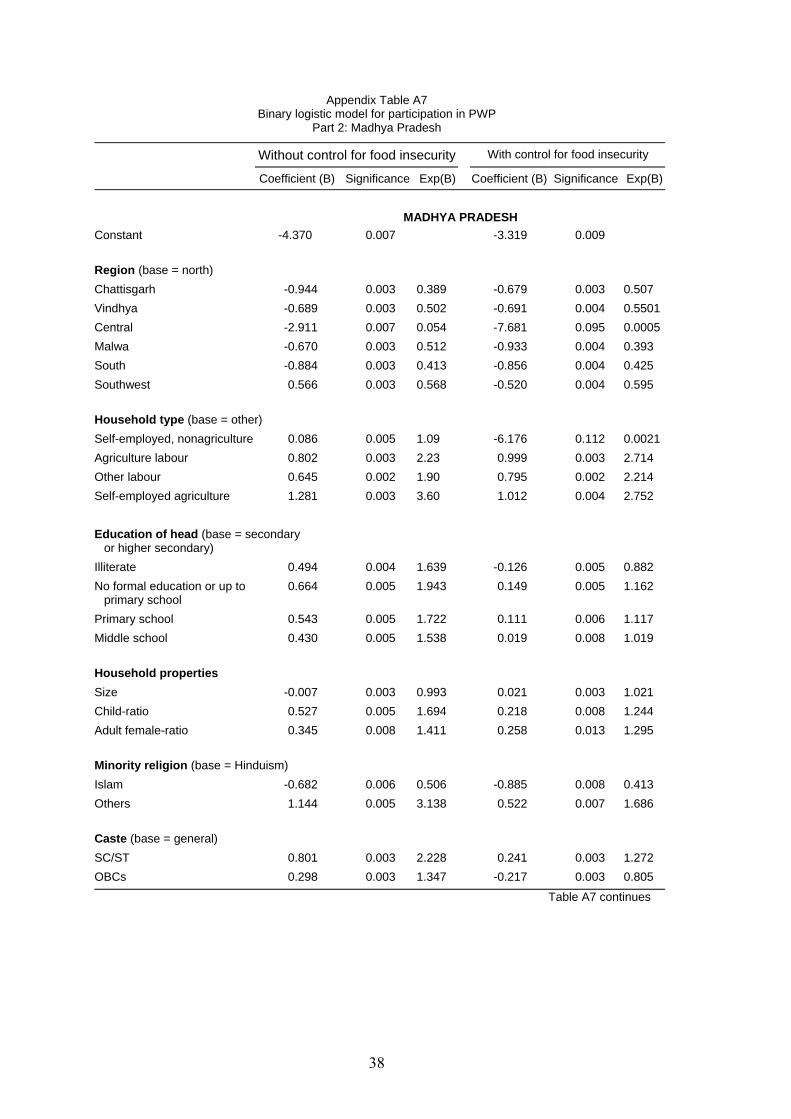
38
Appendix Table A7 Binary logistic model for participation in PWP
Part 2: Madhya Pradesh
Without control for food insecurity With control for food insecurity
Coefficient (B) Significance Exp(B) Coefficient (B) Significance Exp(B)
MADHYA PRADESH
Constant -4.370 0.007 -3.319 0.009
Region (base = north) Chattisgarh -0.944 0.003 0.389 -0.679 0.003 0.507 Vindhya -0.689 0.003 0.502 -0.691 0.004 0.5501Central -2.911 0.007 0.054 -7.681 0.095 0.0005Malwa -0.670 0.003 0.512 -0.933 0.004 0.393 South -0.884 0.003 0.413 -0.856 0.004 0.425 Southwest 0.566 0.003 0.568 -0.520 0.004 0.595
Household type (base = other) Self-employed, nonagriculture 0.086 0.005 1.09 -6.176 0.112 0.0021Agriculture labour 0.802 0.003 2.23 0.999 0.003 2.714 Other labour 0.645 0.002 1.90 0.795 0.002 2.214 Self-employed agriculture 1.281 0.003 3.60 1.012 0.004 2.752 Education of head (base = secondary
or higher secondary)
Illiterate 0.494 0.004 1.639 -0.126 0.005 0.882 No formal education or up to
primary school 0.664 0.005 1.943 0.149 0.005 1.162
Primary school 0.543 0.005 1.722 0.111 0.006 1.117 Middle school 0.430 0.005 1.538 0.019 0.008 1.019
Household properties Size -0.007 0.003 0.993 0.021 0.003 1.021 Child-ratio 0.527 0.005 1.694 0.218 0.008 1.244 Adult female-ratio 0.345 0.008 1.411 0.258 0.013 1.295
Minority religion (base = Hinduism) Islam -0.682 0.006 0.506 -0.885 0.008 0.413 Others 1.144 0.005 3.138 0.522 0.007 1.686
Caste (base = general) SC/ST 0.801 0.003 2.228 0.241 0.003 1.272 OBCs 0.298 0.003 1.347 -0.217 0.003 0.805
Table A7 continues
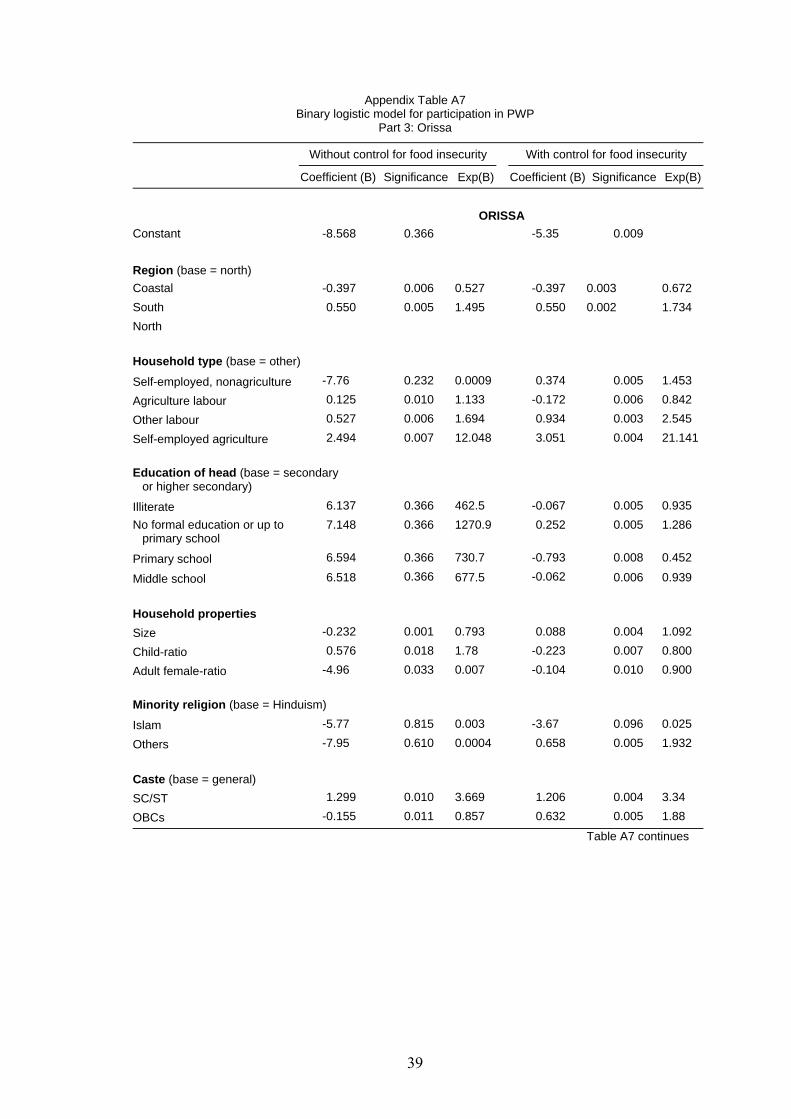
39
Appendix Table A7 Binary logistic model for participation in PWP
Part 3: Orissa
Without control for food insecurity With control for food insecurity
Coefficient (B) Significance Exp(B) Coefficient (B) Significance Exp(B)
ORISSA
Constant -8.568 0.366 -5.35 0.009 Region (base = north) Coastal -0.397 0.006 0.527 -0.397 0.003 0.672 South 0.550 0.005 1.495 0.550 0.002 1.734 North
Household type (base = other)
Self-employed, nonagriculture -7.76 0.232 0.0009 0.374 0.005 1.453
Agriculture labour 0.125 0.010 1.133 -0.172 0.006 0.842
Other labour 0.527 0.006 1.694 0.934 0.003 2.545
Self-employed agriculture 2.494 0.007 12.048 3.051 0.004 21.141
Education of head (base = secondary
or higher secondary)
Illiterate 6.137 0.366 462.5 -0.067 0.005 0.935 No formal education or up to
primary school 7.148 0.366 1270.9 0.252 0.005 1.286
Primary school 6.594 0.366 730.7 -0.793 0.008 0.452
Middle school 6.518 0.366 677.5 -0.062 0.006 0.939
Household properties
Size -0.232 0.001 0.793 0.088 0.004 1.092
Child-ratio 0.576 0.018 1.78 -0.223 0.007 0.800
Adult female-ratio -4.96 0.033 0.007 -0.104 0.010 0.900
Minority religion (base = Hinduism)
Islam -5.77 0.815 0.003 -3.67 0.096 0.025
Others -7.95 0.610 0.0004 0.658 0.005 1.932
Caste (base = general)
SC/ST 1.299 0.010 3.669 1.206 0.004 3.34
OBCs -0.155 0.011 0.857 0.632 0.005 1.88
Table A7 continues
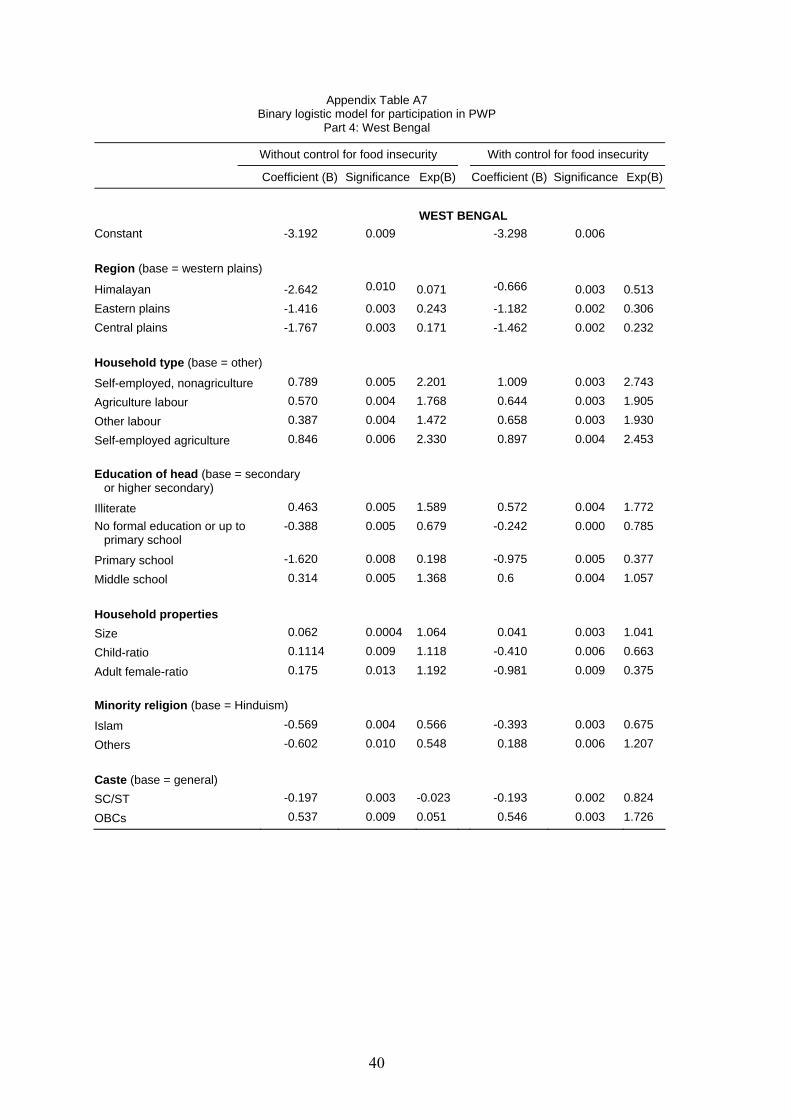
40
Appendix Table A7 Binary logistic model for participation in PWP
Part 4: West Bengal
Without control for food insecurity With control for food insecurity
Coefficient (B) Significance Exp(B) Coefficient (B) Significance Exp(B)
WEST BENGAL
Constant -3.192 0.009 -3.298 0.006
Region (base = western plains)
Himalayan -2.642 0.010 0.071 -0.666 0.003 0.513 Eastern plains -1.416 0.003 0.243 -1.182 0.002 0.306 Central plains -1.767 0.003 0.171 -1.462 0.002 0.232
Household type (base = other)
Self-employed, nonagriculture 0.789 0.005 2.201 1.009 0.003 2.743
Agriculture labour 0.570 0.004 1.768 0.644 0.003 1.905
Other labour 0.387 0.004 1.472 0.658 0.003 1.930
Self-employed agriculture 0.846 0.006 2.330 0.897 0.004 2.453
Education of head (base = secondary
or higher secondary)
Illiterate 0.463 0.005 1.589 0.572 0.004 1.772 No formal education or up to
primary school -0.388 0.005 0.679 -0.242 0.000 0.785
Primary school -1.620 0.008 0.198 -0.975 0.005 0.377
Middle school 0.314 0.005 1.368 0.6 0.004 1.057
Household properties
Size 0.062 0.0004 1.064 0.041 0.003 1.041
Child-ratio 0.1114 0.009 1.118 -0.410 0.006 0.663
Adult female-ratio 0.175 0.013 1.192 -0.981 0.009 0.375
Minority religion (base = Hinduism)
Islam -0.569 0.004 0.566 -0.393 0.003 0.675
Others -0.602 0.010 0.548 0.188 0.006 1.207
Caste (base = general)
SC/ST -0.197 0.003 -0.023 -0.193 0.002 0.824
OBCs 0.537 0.009 0.051 0.546 0.003 1.726
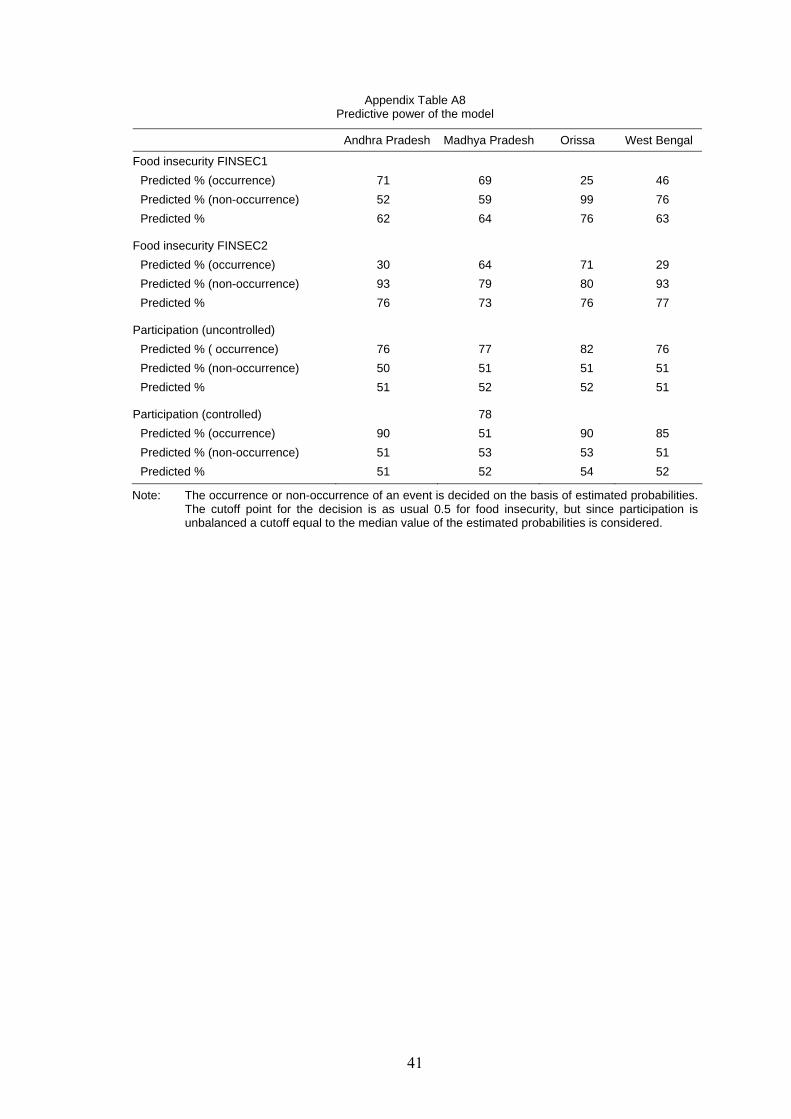
41
Appendix Table A8 Predictive power of the model
Andhra Pradesh Madhya Pradesh Orissa West Bengal
Food insecurity FINSEC1 Predicted % (occurrence) 71 69 25 46 Predicted % (non-occurrence) 52 59 99 76 Predicted % 62 64 76 63
Food insecurity FINSEC2
Predicted % (occurrence) 30 64 71 29 Predicted % (non-occurrence) 93 79 80 93 Predicted % 76 73 76 77
Participation (uncontrolled)
Predicted % ( occurrence) 76 77 82 76 Predicted % (non-occurrence) 50 51 51 51 Predicted % 51 52 52 51
Participation (controlled) 78
Predicted % (occurrence) 90 51 90 85 Predicted % (non-occurrence) 51 53 53 51 Predicted % 51 52 54 52
Note: The occurrence or non-occurrence of an event is decided on the basis of estimated probabilities. The cutoff point for the decision is as usual 0.5 for food insecurity, but since participation is unbalanced a cutoff equal to the median value of the estimated probabilities is considered.
42
Acronyms
AAY Antodaya Anna Yojana (grain scheme for the poorest of the poor)
APL individuals living above the poverty line
BPL individuals living below the poverty line
CMP common minimum programme
DPAP drought prone area programme
EAS employment assurance scheme
FCI Food Corporation of India
GDP gross domestic product
GSs Gram sabha
HDI human development index
ICDS integrated child development services programme
ICMR Indian Council of Medical Research
JRY Jawahar Rozhar Yojana
MDM midday meal schedule
MPCE monthly per capita expenditure
NFBS national family benefit scheme
FFW food-for-work programme
NMBS national maternity benefit scheme
NOAPS national old age pension scheme
NREP national rural employment programme
NREG national rural employment guarantee programme
NSAP national social assistance programme
NSSO National Sample Survey Organization of India
OBCs other backward classes
OMS open market sales
PDS public distribution system
PRI Panchayati Raj institution
RLEGP rural landless employment guarantee programme
SC/ST schedule castes and schedule tribes
TPDS targeted public distribution system
PWPs public works programmes
WTO World Trade Organization