looking for a better way to find wetlands: comparing
TRANSCRIPT

LOOKING FOR A BETTER WAY TO FIND WETLANDS: COMPARING
MAPPING MODELS ON THE QUINAULT INDIAN RESERVATION
by
Greg Eide

A Thesis
Submitted in partial fulfillment
of the requirements for the degree
Master of Environmental Studies
The Evergreen State College
June 2017

©2017 by Greg Eide. All rights reserved.

This Thesis for the Master of Environmental Studies Degree
by
Greg Eide
has been approved for
The Evergreen State College
by
________________________
Richard Bigley
Member of the Faculty
________________________
Date

ABSTRACT
Looking for a better way to find wetlands: comparing mapping models on the Quinault
Indian Reservation
Greg Eide
An improved wetland database is consistent with the management goals of the Quinault
Indian Reservation and other land managers in the Pacific Northwest. Wetland screening
tools are used in land use planning and are important to protect the habitat of valuable
species that utilize wetlands. This project compared to the National Wetland Inventory
and a proprietary wetland map known as the AECOM wetland suitability index. The two
wetland mapping databases were compared as part of a larger effort to assess the extent
of certain wetland classifications. Predicted wetland area polygons (65) were sampled
and the field verified classification was used to compare with predicted from both
wetland screening tools. This study determined the accuracy of each database based on
the success rate of correctly predicted Cowardin (1979) classifications. Both databases
were compared to field observations using a kappa statistic method. Results showed a
statistically insignificant difference between each database, although AECOM
approaches a better level of reliability than NWI. Both screening tools were rated as
“fair” overall in predicting wetland system and class, with an average success rate of
about 52%.


v
List of Figures
Figure 1. 2015 aerial image of area surrounding wetland sampling 0213. ....................... 25
Figure 2. NWI map of predicted wetland extent and Cowardin class .............................. 25
Figure 3. NWI and AECOM predicted wetland area ........................................................ 26
Figure 4. Estimated actual extent of wetland area around sampling point 0213 .............. 26

vi
List of Tables
Table 1: Comparison of predicted and observed wetland classifications in terms of
percentage correct ............................................................................................................. 15
Table 2: NWI and WSI classification error matrix for QIR study area ............................ 16
Table 3: WSI and NWI Modeled Wetland Classifications by acres on the Quinault Indian
Reservation……………………………………………………………..………………..22

vii
Acknowledgements
The faculty, whom I had the pleasure of studying under during the Masters of
Environmental Studies program deserve thanks: Shangrila Wynn, Ted Whitesell, Kevin
Francis, Sarah Hammon, Erin Martin, Kathleen Saul, Dina Roberts, and Peter Dorman.
Adjunct faculty John Kirkpatrick and classmate Nick Kohnen deserve an honorable
mention for their statistics advice.
This project would not have been possible without the support of the Quinault Indian
Nation Land and Natural Resources Committee, Quinault Division of Natural Resources
Director Dave Bingaman, Environmental Protection Manager Daniel Ravenel, Cultural
Resource Officer Justine James, and Quinault Attorney Karen Allston. Funding for this
project was provided by the United States Environmental Protection Agency.
And last but not least, Richard Bigley, who gracefully fulfilled his obligations as my
reader during the thesis writing process.

1
Contents
Introduction ..................................................................................................................... 2
Literature Review ............................................................................................................ 7
Methods ......................................................................................................................... 10
Results ........................................................................................................................... 13
Discussion ..................................................................................................................... 17
Conclusion ..................................................................................................................... 22
References ..................................................................................................................... 28
Appendices…………………………………………………………………………….32

2
Introduction
Finding wetlands
Reliable information on the extent of wetlands is critical to understanding their
resource value and plan for their management. To date, often the only source of wetland
mapping has been through the National Wetland Inventory (NWI) (United States Fish
and Wildlife Service, 2016). The NWI provides landowners and resource managers a
consistent format, based on established nomenclature and methods. NWI information is
based on aerial photo interpretation in combination with limited field verification. The
NWI approach provides rough estimates of how many acres and what type of wetlands
occur in an area of interest. The accuracy of NWI wetland identification and
classification is highly dependent on forest cover and is generally believed to
underestimate forested wetlands in particular, and subsequently, total wetland area by
approximately 45% (Werner 2004).
Defining wetlands
There are several definitions in the wetland literature that are based on legal and
ecological characteristics (Ramsar 2013). This study uses the U.S. Army Corps of
Engineers definition which is the nationwide standard and is used in implementing the
Clean Water Act. This definition is recognized in planning efforts to protect water
quality, providing wildlife habitat and flood storage. The manual states that wetlands are:

3
“those areas that are inundated or saturated by surface or ground water at a frequency
and duration sufficient to support, and that under normal circumstances do support, a
prevalence of vegetation typically adapted for life in saturated soil conditions. Wetlands
generally include swamps, marshes, bogs, and similar areas.”
Wetland types or classes in this study follow the characterization method
developed by Cowardin (1979) which is also used by NWI. The Cowardin system can be
used to classify all types of wetlands in the United States. This study focuses on are
freshwater Forest/scrub shrub (wetlands with a canopy cover of >30%, also known as
Palustrine forested/scrub shrub or PFO/SS), Emergent (Wetlands with less than 30%
cover of trees or shrubs and covered by herbaceous plants, also known as Palustrine
emergent or PEM), and Estuarine (Tidally influenced, brackish water wetlands).
Quinault wetland management
The Quinault Indian Reservation (QIR) is located in a very remote and
undeveloped region of Washington State with the primary land use being industrial
forestry. Past management of QIR wetlands has resulted in degradation of habitat
structure, hydrologic regimen, and water quality. In some cases failing culverts have
created additional wetland areas effectively turning roads into berms. Declining water
quality in the QIR and surrounding basins has been documented over the last several
years (Quinault Indian Nation, 2016). Logging has been proven to permanently alter
hydrologic processes in similar forested habitats (Perry and Jones, 2017) which is likely
contributing to this degradation. Further, Beckett et al. (2016) studied the effectiveness of

4
the Forest Practices Act (Title 222 of the Washington Administrative Code) and found
that harvesting in and upslope of forested wetlands results in a higher water table and
increased water runoff in watersheds. Compared to residential and other industrial land
uses however, timber production causes less degradation overall due to minimal increases
in impervious surface. As long as haul routes are directed around instead of through
wetlands, and adequate measures are taken to preserve the hydrology of adjacent
wetlands to timber sale units (such as buffers and strategically placed culverts) the worst
impacts from harvest activity is loss of wildlife habitat, altered hydrologic regime, such
as reduced water quality and increased runoff. An improved wetland inventory could aid
foresters in laying out timber sales so that landowners can have both an income as well as
habitat for culturally important plant and animal species since Cowardin classifications
represent specific habitat types.
Forested ecosystems are notoriously difficult for mapping wetlands using remote
sensing because canopy cover obscures photo interpretation of forested wetlands
(Werner, 2004; Tiner, 2015). The QIR has low laying topography and receives up to 120
inches of annual rainfall (PRISM, 2004). Forested wetlands on the QIR are composed of
primarily Sitka Spruce (Picea sitchensis) and Western Hemlock (Tsuga heterophylla) but
plantations have included a higher ratio of Douglas fir (Pseudotsuga menziesii). The vast
majority of forested wetlands and riparian zones were logged at some point over the last
century. Non-forested wetlands count for at least 1/3 of the total wetland area on the QIR.
This type of wetland provides habitat for many culturally important species such as
Camassia quamash, Ledum groenlandicum, Cervus Canadensis, Odocoileus hemionus.

5
Harvest management priorities now include buffers for wetlands and vary depending on
the associated stream.
Current wetland screening tools
The current mapping effort is part of the Quinault Indian Nation (QIN) Wetland
Program Plan (Bingaman and Ravenel, 2016). Prior to the implantation of this plan, NWI
maps provided the most comprehensive wetland inventory on the QIR. These maps were
produced using photointerpretation of aerial imagery from 1985 (Bill Kirschner, USFWS,
Personal Communication 2016). Although there have been field verification sites off
reservation, no field verification sites were visited on the QIR (Tony Hartrich, Personal
communication, 2016). The current effort is part of the 2nd
phase of an Environmental
Protection Agency Wetland Program Development grant. The first phase of the grant
funded mapping of reservation wetlands using a predictive model (known as the AECOM
Wetland Suitability Index, or WSI), as opposed to photo interpretation (AECOM, 2015).
In association with the AECOM wetland mapping project a there was a field verification
effort consisting of 53 sites of the predicted 1,353 QIR wetland polygons. This field
verification was restricted to wetlands along or near roads and Cowardin class and total
area were not verified. The AECOM verification effort found an error rate of
approximately 40%, suggesting that this model database is only 60% accurate in
predicting wetland presence and class. This current study, is more comprehensive in that
it looks at the difference in predicted vs. observed Cowardin classes in addition to
determining jurisdictional wetland presence. For example, PFO/SS wetlands may have an
even higher ratio of predicted wetlands to actual wetlands (errors of commission),

6
whereas PEM or PSS classes have a lower ratio due to less canopy cover and a more
distinct signature in ancillary data sets. This study does not identify errors of omission, or
rather unmapped wetlands in areas predicted by the model to be uplands. The time and
resources for this project limited the scope. Each wetland sample site was also rated using
the Washington State Department of Ecology’s 2014 Wetland Rating System for Western
Washington (Hruby, 2014) to aid in documenting Cowardin class, but the results of these
ratings are not reported. Riverine, Marine and Lacustrine wetlands make up a large
percentage of the total wetland acreage on the QIR, but because these are more easily
mapped using remotely sensed data than the types selected for this study, they are not
included.
The aim of this project
The information obtained from remote sensing and field investigation is useful for
managing oftentimes conflicting natural resource uses. This is true for wetland
management throughout the United States as much as on the QIR. For example, Forested
wetlands that have little value as timber could be conserved for wildlife use. With better
wetland maps, foresters could exclude forested wetlands with economically marginal
timber from the harvest units to prioritize wildlife habitat and other ecological functions.
To better understand wetland ecosystems and subsequently inform a compromise
between management priorities on the QIR I ask the question: How accurate are two
predicted wetland presence and classification models that are based on primarily
remotely sensed data? This study adopts modified methods from several previous

7
wetland verification studies to compare modern wetland mapping models to inform the
reader of the utility of the each model.
Literature Review
A review of the literature shows that many studies have been done to map
wetlands that combine remotely sensed data with field investigations. The methods used
for the current research follow those outlined in the literature review. The results of this
study reflect the findings of studies done in areas of similar forested landscape and
hydrologic complexity. Ways of improving the model and database are discussed in
terms of past verification studies, as well as suggestions for future research based
observations.
Quinault Indian Nation project area
Little has been published on wetlands specifically on the QIR. However, QIN
(The governing body of the QIR and its people) is aware of the value wetlands have as a
natural resource and is interested in understanding reservation wetlands in the context of
research conducted in similar landscapes. QIN also recognizes that identifying and
classifying wetlands on the QIR is of critical importance in the current climatic situation.
Several studies that focus on the wetland prairies of the western Olympic Peninsula are
helpful in setting the stage for this study (Anderson, 2009; Rocchio et al. 2015; Gavin et
al. 2013; Bach and Conca, 2004) which characterize most of the bog and fen wetland

8
types found on the QIR. Decadal to century scale changes in floodplain wetlands have
also been studied on and around the QIR (O'Connor etal. 2003).
The most important regulatory document relevant to this study is the QIN Forest
Management Plan (FMP). This document is the regulatory framework for all natural
resource management decisions on the QIR. It contains a regulatory definition of wetland
areas and how they are treated under various types of resource activities. The other
primary wetland document produced for the QIN is the Models and Methods report for
the WSI. This index was created for QIN by a contractor (AECOM 2015) and is based on
a GIS model that includes several sources of information including National Wetland
Inventory (USFWS, 2016), LIDAR, and soil data (See Appendix 1). The appropriate
regional supplement to the U.S. Army Corps of Engineers 1987 wetland delineation
manual for the QIR is the Western Mountains Valleys and Coast (USACOE 2010).
Wetland classification
The Wetland Determination Form for this manual was used to determine wetland
presence. This determination by itself, however only provides information in a very small
area (<10m) for classifying various wetlands (see Methods section for classification
schema). One classification method utilized in this study to determine the Cowardin class
is the Hydrogeomorhic (HGM) approach (Brinson 1993). The HGM approach to
classifying wetlands provides more information on the types of ecological functions
provided. It categorizes the wetland into classes that describe how the water moves
through the wetland as opposed to relying on vegetation cover in the Cowardin method.

9
Examples of HGM types include slope, depressional, lake-fringe, tidal fringe, and
riverine wetlands. HGM class is notoriously difficult to predict using remote sensing
technology (Dvorett et al. 2012). Both NWI and WSI use the Cowardin code
classification method, but special modifiers at the subclass level of classification are
similar to the HGM approach.
Comparing wetland screening approaches
Several similar studies involving the field verification of NWI maps have been
conducted throughout the country. Wu et al. (2014) compared the ACOE method (used
for regulatory purposes) to the NWI method (used for inventory/planning purposes) in
New York and found that the data agreed 78% of the time with field investigations.
Dvorett et al. (2012) used existing NWI data to predict HGM classification in Oklahoma.
The authors conducted field verification at 149 sites and found that NWI predicted HGM
class at 60% of sites. Werner (2004) found that NWI maps predicted wetland areas
relatively accurately (293 out of 294) in California, but missed 50% of additional
wetlands (errors of omission). Dahl et al. (2015) discusses additional major drawbacks of
remotely sensed wetland data. They point out that wetland substrate, salinity, and certain
vegetation communities are impossible to measure via satellite. Rampi et al. (2014)
assessed the accuracy of the recently updated NWI maps for the state of Minnesota. They
found that an object based image analysis method had a much higher accuracy than NWI
(a 9% to 20% improvement depending on the area of interest) at predicting actual
wetland boundaries. At least one of their study sites was in a similarly forested landscape
like that found on the QIR. Another study by Fuller et al. (2006) used an “early spring

10
IKONOS pan-sharpened satellite image.” They found that any amount of automated
classification and delineation did not result in significantly improved predictions.
All of these studies highlight the limitations of remotely sensed wetland data in
predicting Cowardin/HGM class and regulatory wetland presence. This study recreates
portions of the previously discussed types of validation on a new area that is extremely
hydrologically complex and uses the resulting data to analyze the NWI map and the WSI.
Methods
Environmental setting
The project area for this study (the QIR) is approximately 200,000 acres of low
laying, gentle topography, in the hyper-marine, Sitka spruce forest zone of the Olympic
Peninsula. The maritime climate with abundant moisture throughout the year, relatively
mild winters, and cool summers. Annual precipitation varies within the range of Sitka
spruce and is influenced greatly by local topography. Most of the annual precipitation
falls in the winter and early spring and summer precipitation is limited but persistent
coastal fog maintains healthy epiphyte communities.
Experimental Design
Data collection for this study took place December, 2016 thru February, 2017.
Although not an ideal time to make wetland determinations, scheduling and funding
constraints necessitated winter field work. Typical wetland field verification methods for
planning purposes (EPA Level 1 Rapid assessment method, U.S. EPA, 2006) were used

11
to locate and estimate Cowardin cover class. Standard wetland determination and
classification methods were used to identify wetland presence and class (See
Introduction). Observed Cowardin Class was determined by looking at the dominant
cover class in the predicted NWI or WSI predicted wetland polygon area. Mixed classes
were recorded as specified by Dahl et al. (2015), but the dominant class surrounding the
sample point took precedence over the total extent of the wetland polygon.
In order to reduce sampling bias, a Generalized Random Tessellation Stratified
survey design was constructed for WRIA 21 (Olsen, 2016). From this set of randomly
selected points, a subsample 65 sites were selected out of the three most abundant
Cowardin classes (20 Estuarine, 21 PEM and 24 PFO/SS) with the exception of Riverine.
The NWI predicted Cowardin class of wetland polygons in which these points are located
were then overlaid on the WSI GIS layer. This sample size and classes were selected
based on the availability of one wetland scientist to conduct field research in the area of
interest. These methods are designed to be scaled up for verification of more wetland
polygons as time or resources become available. This level of effort was dictated by the
Wetland Program Development grant.
Specific Cowardin classifications that were field investigated for this study
included Estuarine, Intertidal, with the classes unconsolidated shore, emergent, scrub
shrub, forested, Palustrine Emergent, and Palustrine scrub/shrub and Forested (referred to
as PEM, PFO/SS in Figure 1). The correct classifications was recorded in order to
compare to the predicted classifications to the field verified classifications.

12
Study Approach
This study only identifies errors of commission. Distance to the actual wetland
edge from the predicted wetland polygon was estimated using a GPS to measure the
distance between two points along the access route and as needed elsewhere. None of the
sample plots was >10 meters from the edge of the wetland unit being
investigated/classified. Several sample locations were flooded at the time of inspection,
in which case the sampling location was offset to the nearest point to gain access to the
soil profile. It will be assumed that if hydric soil characteristics are present on slight rises,
there wetland soil characteristics are also present in the flooded areas. Wetland plant
species were identified with twig characteristics and collected as a reference, the
remnants of herbaceous species were identified and photographed as reference. Although
determinations were done in the winter, enough remnants of plants (or a lack of plants for
unconsolidated areas) were present at each of the sample sites to positively identify the
correct Cowardin class. Hydrogeomorphic position, Cowardin water regime and other
special modifiers were recorded when obvious but as stated before, these data are not
used in the analysis of each wetland map.
Data Analysis
The Kappa statistic is used to determine the significance of categorical data by
comparing observed to predicted classification (Fleiss etal. 2013). This method is
standard in the analysis of remotely sensed data (Congalton, 2008). Kappa matrices were
calculated for NWI and WSI for both the system and class level of Cowardin
13
classification, similar to Rampi et al. (2014). The resulting statistic indicates the level of
accuracy of each map. The Kappa statistic takes into account the number of classes that
would be correctly predicted if they were just randomly assigned to wetland polygons.
These results are reported along with the percent correct because they provide more of an
explanation rather than just indicating an incorrect classification. Each dataset was
entered into an online kappa statistic calculator (Graphpad, 2017). The ratio of correct
Cowardin classes versus the incorrect classes are reported (although many wetlands have
multiple Cowardin classes, the dominant Cowardin class observed in the polygon in
which the sample point is located was used for the purposes of this study). This
determines the likelihood that a Cowardin system or class is likely to be dominant at an
unsampled wetland within the QIR. This analysis is similar to Kudray and Gale’s (2000)
methods in that they take into account different Cowardin classes.
Results
Observed Cowardin classes and jurisdictional determinations
Of the 65 wetland sampling locations, 60 met all three indicators of the Army
Corps of Engineer wetland determination form (90%). This result does not say much
because there was always a wetland nearby and the point just happened to be within the
adjacent upland.
The two models agreed at the system level at 54 sites (83%) and at 34 sites at the
class level (52%). NWI correctly predicted Cowardin system and class at 33 sites (51%).
WSI correctly predicted Cowardin system and class at 35 sites (54%). Both models were

14
best at predicting a Palustrine Forested or Scrub/shrub (PFO/SS) wetland with a 75%
success rate. NWI did poorest with Palustrine Emergent (PEM) wetlands, only getting
those right 25% of the time. Both mapping resources correctly guessed Estuarine
wetlands correctly about half the time. Out of the observed sample sites, both models
agreed with each other more often for all Cowardin classes than with field conditions.
See Table 1 for a comparison of predicted and observed wetland classifications andTable
2 for a compasrison of observed class to predicted class using the kappa statisticTable 3
displays the predicted wetland area for each Cowardin class for both NWI and WSI.
NWI class prediction agreed with observations approximately 17.89% more often
than was expected by chance (Kappa=0.225) and NWI system prediction agreed with
observations 31.39% more often than was expected by chance (Kappa=0.671). Higher
Kappa scores indicate strong agreement between data sets. WSI class prediction agreed
with observations 26.58% more often than was expected by chance (Kappa=0.344) and
WSI system prediction 42.11% more often than was expected by chance (Kappa=.846).
Even though WSI system prediction is considered to be very good, the 95% confidence
interval (0.725 to 0.966) overlaps with NWI’s (0.509 to 0.833) which indicates that WSI
is not significantly different than NWI. The Kappa analysis is better than just reporting
percent correct because in addition to ruling out agreements expected by chance, it
accounts for the bias each map has towards one class or another. In other words,
predictions for both maps tended to favor one classification over the other (i.e. EM,
which were observed to be SS, see Table 2). It is important to note that kappa just
compares two datasets, not an unknown and known (e.g. estimate vs guess), necessarily.

15
It is a measure of concordance between datasets, and does not assume or mean that one
dataset is "right" and another is a hypothesis.
Table 1: Comparison of predicted and observed wetland classifications in terms of
percentage correct
Cowardin Class # of correct NWI
Classifications
(% correct)
# of correct
WSI
classifications
(% correct)
# of correct
ACOE
jurisdictional
wetlands (%
correct)
# of WSI and NWI
agreed (% agreement)
System Class
PFO/SS 21 (91%) 25 (89%) 20 (83%) 22 (92%) 15 (63%)
PEM 5 (22%) 2 (15%) 20 (95%) 20 (95%) 10 (48%)
Estuarine 12 (67%) 8 (40%) 20 (100%) 12(60%) 6 (30%)
Total # correct
(%correct)
33 (51%) 35 (54%) 60 (92%) 54 (83%) 34 (52%)

16
Table 2: NWI and WSI classification error matrix for QIR study area

17
(U= Unconsolidated shore, EM=Emergent, FO=Forested, SS=Scrub/shrub)
Discussion
Mapping and classifying wetlands is difficult, especially on the low topographic
relief and the hydrologic complexity of the QIR. The WSI wetlands screening tool
provided little improvement in wetland classification over existing NWI. The area of
wetland screening tool development is rapidly developing, Rampi et al. (2014) found a
22% increase in accuracy using an object based image analysis approach which utilized
high resolution leaf off orthorectified imagery taken in a forested landscape. Object based
image analysis could with existing data on the QIR if resources were available Field
verification is the most reliable way to tell the extent of wetlands on the QIR but, it is not
feasible given the extent and remoteness of the QIR. The combination of remote sensing
data in tandem with field verification data would be to develop program that uses the
Tracking Analyst extension in ArcGIS to track changes apparent in aerial imagery of
wetland areas over time (such as forested wetlands that are logged and go through
successional stages to become forested again). Inputs into this program would consist of
field verified spectroscopic readings to provide characteristic spectral signatures for
automated computer recognition.
One of the data sources for the WSI was the NWI (weighted 16%). Since over
90% of the sample sites were within a jurisdictional wetland, an improved map should
just incorporate 100% of the predicted NWI maps. Any additional wetland areas should
be predicted using the other data sources, with the majority of NWI’s 16% weight going

18
towards the GAP land cover database (See Appendix 1). GAP imagery is the most
comprehensive land cover inventory in the United States (Gergely and McKerrow 2016)
and could have been better utilized in my opinion.
Several of the sample sites were within wetlands that were either highly modified
or created by road building for logging operations. Most of these structures were installed
over 40 years ago so the resulting wetlands have established highly functioning
ecosystems. It would be almost impossible to parse these “artificial” wetlands out of the
wetland database and doing so would be a disservice to the ecosystem services they are
providing. Careful consideration should be given to each particular project that is likely
to impact wetland or stream hydrology even if it is restoring a more natural hydrologic
regime.
Figures 3 through 6 illustrate the boundary and classification discrepancies
between NWI, WSI, and field observations. At this example site, WSI predicted much
more wetland area than NWI, but field observations revealed even more. This was the
most significant example out of the 65 sites, but it was a common theme. These situations
would benefit from additional photo interpretation and field verification in order to
produce a more realistic wetland boundary map.
The ecological implications of missing and misclassifying wetlands are
significant. The more wetlands that are known, the better they will be managed for their
ecological functions and designated uses based on water quality standards. Since having
good water quality and habitat for fish and wildlife species is important to community

19
members, land managers will be better able to keep conditions suitable and improve
degraded sites with an improved wetland database. Using only remotely sensed wetland
data to make natural resource management decisions does not account for the wetlands
that were not correctly predicted and may lead to poorly managed wetlands that do not
reach their full ecological potential.
Both the NWI and WSI correctly predicted fewer Cowardin classes than other
field verification studies (Kudray and Gale, 2000; Werner, 2004; Wu et al. 2014).
However, the rate of correctly predicting an ACOE jurisdictional wetlands (93%) were
similar to Kudray and Gale’s (95%), Wu’s (83%) and Werner’s (99%) findings which
were conducted in similar forested landscapes. Although the rate of correctly predicted
jurisdictional wetland areas was high, these data reveal significant discrepancies between
both models and actual classifications on the QIR.
Predicted WSI wetland polygons appear to align with features made more
apparent by the increased resolution of topography afforded by new remote sensing data.
(Fig 3). The level of effort that the Minnesota Department of Natural Resources put into
their 2016 NWI update (Macleod, Paige, & Smith 2013) is a good example for
jurisdictions looking to improve the accuracy of their wetland inventories and compares
the utility of two classification models against actual conditions.
Most of the wetland sites investigated for this study consisted of distinct plant
community types but there were considerable gradations and interspersion of other
communities. The community types observed are typical of those found in hydrologicly
20
complex systems and especially for PFO wetlands, relatively frequent disturbance regime
(most of this class of wetlands on the QIR are harvested every 40 years). Streamflow
impoundment due to failed culverts was the primary anthropogenic influence for the
current community at many sites. For example, many PUS and PSS wetlands were either
PFO or upland before an access road was constructed, causing the water table to rise and
in many cases, preserving the old growth stumps which were observed scattered
throughout an otherwise non-forested wetland (See Appendix 3).
Many wetlands were in transitional states between different classes. For some
sample wetlands near the river, but above the 100 year floodplain were old oxbows
formed thousands of years ago that have slowly filled in with sediment or peat to become
fens. Another blending of two classifications is the Myrica gale dominated wetlands
which were always associated with Sphagnum. A few observed wetlands were artificial.
Roads constructed over the years have significantly altered the water regime of many
streams and wetlands. These impacts are particularly noticeable in areas with failing
culverts. Neither model is designed to track the changing classifications over time as
vegetation communities go through successional stages.
Most wetlands incorrectly classified as Emergent by both NWI and WSI were
Scrub/Shrub due to the dominance of stunted Myrica gale (See Appendix 2: Example in
situ photography of erroneously classified Emergent wetland). Most of the sample
locations in these areas were likely predicted to be PEM because the M. gale was very
low growing and difficult to distinguish as a dominant species from aerial imagery.

21
Emergent plants were often co-dominant (>30% cover), but the prevailing Cowardin
classification of PSS trumped the PEM determination in these cases.
The wetland upland gradient was difficult to determine in many areas because of
the extremely subtle topography gradient. Some of the sample points that did not meet all
three of the ACOE criteria for jurisdictional wetland presence did have 1 or even 2 of the
3 criteria. For delineation purposes, these wetland edges would be further scrutinized
because there were likely special circumstances that would constitute the point being
within a jurisdictional wetland.
Interspersion of the various Cowardin classes at most points was much higher
than suggested by both WSI and NWI. Although this information is anecdotal, it is
relevant to this study because any future wetland mapping effort must take this into
account. Figures 1 through 4 illustrate this interspersion at one sampling location
(WET0213).

22
Table 3. WSI and NWI Modeled Wetland Classifications by acres on the Quinault Indian
Reservation
Conclusion
Which is the better model?
The WSI was 3% better than NWI at predicting Cowardin class. This is not
statistically significant, but at least it is a step in the right direction. Since this study is
part of a larger effort to improve the QIR wetland geodatabase, additional field
verification and photointerpretation will have to be done before either WSI or NWI
wetland maps are considered accurate. I propose that the WSI and NWI be used in
tandem to create a more comprehensive map of the wetlands on the reservation. The
results of this study should inform the reader that the reliability of remotely sensed
wetland data in general depends heavily on the level of effort put into creating the model

23
and the quality and types of inputs including field investigations and other ancillary
datasets. The results indicate that both the NWI and the WSI have only a slightly better
than 50% chance of correctly predicting Cowardin class. Some larger, more common
wetland types may be correctly identified, but they day to day operations that impact
wetlands on the QIR would benefit from having much more detailed information for all
potential wetlands gained by conducting site visits by a wetland scientist. Given this rate,
some apprehension should be expected when using either of these maps for planning
purposes, let alone project level analyses.
How could we more definitively tell which map is better?
Navigating to sites revealed wetland areas likely extend beyond the boundaries
suggested by both mapping resources. A study of errors of omission (i.e. unmapped
wetlands) should be conducted to identify areas not mapped as wetlands by either NWI or
the WSI, but have water tables within 1 m as predicted with a wet area index model such
as White et al.’s (2012) method. Several edges of wetlands visited for this study extended
well beyond the predicted edge for both mapping resources. A delineation study utilizing
the Wet Area Index method as well as field verification should be conducted in order to
determine how accurate each mapping approach is at predicting the total wetland area on
the QIR.
Further wetland field investigations on the reservation would benefit to follow the
framework described in this study. In order to keep the QIN wetland database up to date,
the most recent available datasets should be input into the WSI algorithm or an equivalent

24
such as the wet area index or the object based image analysis method (Rampi et al. 2014).
Photointerpretation should be used to bring the WSI up to Federal Geodatabase standards
(Dahl et al. 2015) so it can be incorporated into the official NWI database. Other
Cowardin classifications should be investigated, especially Riverine and Palustrine
Forested in order to reconcile the discrepancy between NWI and WSI predicted amount
of riverine and Palustrine Forested wetlands. Additional investigations need to be done to
quantify errors of omission, which I have observed to be up to 40% in similar forested
ecosystems (BPA 2016). Field verification efforts should expand to include Riverine
wetlands, which were not analyzed in this study, to come up with a better estimate for
total Palustrine Forested and Riverine wetlands on the QIR. One reason NWI may
estimate more Riverine than Palustrine wetlands is its incorporation of a buffered stream
layer. This buffering essentially creates a polygon feature out of a line feature in GIS.
The WSI doesn’t incorporate a buffered stream map. A buffered stream network would
help bring the estimated riverine wetlands closer to reality.

25
Figure 1. 2015 aerial image of area surrounding wetland sampling 0213.
Figure 2. NWI map of predicted wetland extent and Cowardin class (Light green
indicates Palustrine Emergent and Dark green indicates Palustrine Forested)

26
Figure 3. NWI and WSI predicted wetland area (Brown indicates Palustrine Forested,
Green indicates Palustrine Emergent, and White is NWI)
Figure 4. Estimated observed extent of wetland area around sampling point 0213.

27
If there were a chance to repeat this study, shrub and forested wetlands would be
considered separately because although there were wetlands that were transitioning from
PSS to PFO, most of the PSS wetlands consisted of the Myrica gale community type
which are relatively permanent (Kunze, 1994) and were historically managed by Native
Americans who burned them at certain intervals (Bach and Conca, 2004) for cultural use.
A study to detect actual wetland boundaries should include some field verification in
areas notoriously difficult to distinguish from uplands. It would also include a wet area
index model as described by White et al. 2012.
Field investigations should be done to delineate a sample of wetlands in order to
set more realistic weights to the various data inputs. Additional investigation should be
directed towards riverine and PFO/SS in order to determine why there are so many more
riverine wetlands predicted by NWI than WSI and why there are much more PFO/SS
wetlands predicted by WSI than NWI. This difference is suspicious and actual conditions
could be somewhere in between or much greater than either map predicts. Finally,
besides wetland classification, wetland area should be investigated since both NWI and
WSI tended to underestimate the size of wetlands.
There are many ways that wetland mapping could be improved on the Quinault
Indian Reservation. Given the resources, a wetland scientist could choose one of or just
the parts of the myriad of other wetland mapping studies used elsewhere in the U.S. The
path forward is only possible with continued funding of the wetland program and

28
sustained interest in managing the ecosystem more holistically rather than for a single
resource.
References
AECOM 2015, Process Record for Creation of an Updated Quinault Indian Nation
Estimated Wetland Layer, QIN Wetland Model Methods and Process Record 10-13-15
Anderson, M.K., 2009. The Ozette prairies of Olympic National Park: their former
Indigenous uses and management. Final Report to Olympic National Park, Port Angeles,
Washington. USDA Natural Resources Conservation Service, Davis, CA.
Bach, A. and Conca, D., 2004. Natural History of the Ahlstrom’s and Roose’s Prairies,
Olympic National Park, Washington. Report to Olympic National Park.
Beckett, L., Adamus, P., Dan Moore, R. D., Sobota, D., Howard Haemmerle, H. 2016
Forested Wetlands Effectiveness Project, Best Available Science and Study Design
Alternatives Document, Forested Wetlands Effectiveness Project Technical Writing and
Implementation Group (TWIG): Cooperative Monitoring, Evaluation and Research
Committee Washington Department of Natural Resources Adaptive Management
Program (Unpublished manuscript)
Bingaman, D., and Ravenel, D., 2016 Quinault Indian Nation Wetland Program Plan
(2016-2021) retrieved from https://www.epa.gov/sites/production/files/2016-
03/documents/qin_wpp_final.pdf November 20th 2016
Brinson, M.M. 1993. A hydrogeomorphic classification for wetlands, Technical Report
WRP–DE–4, United States Army Corps of Engineers Engineer Waterways Experiment
Station, Vicksburg, MS.
Congalton, R.G. and Green, K., 2008. Assessing the accuracy of remotely sensed data:
principles and practices. CRC press.
Cowardin, L. M., U.S. Fish and Wildlife Service, & Biological Services Program (U.S.).
1979. Classification of wetlands and deepwater habitats of the United States.
Washington, D.C: Fish and Wildlife Service, United States Dept. of the Interior.

29
Dahl, T.E., J. Dick, J. Swords, and B.O. Wilen. 2015. Data Collection Requirements and
Procedures for Mapping Wetland, Deepwater and Related Habitats of the United States.
Division of Habitat and Resource Conservation (version 2), National Standards and
Support Team, Madison, WI. 92 p. https://www.fws.gov/wetlands/documents/Data-
Collection-Requirements-and-Procedures-for-Mapping-Wetland-Deepwater-and-Related-
Habitats-of-the-United-States.pdf
Dvorett, D., Bidwell, J., Davis, C. and DuBois, C., 2012. Developing a hydrogeomorphic
wetland inventory: reclassifying national wetlands inventory polygons in geographic
information systems. Wetlands, 32(1), pp.83-93.Environmental Laboratory, 1987. Corps
of Engineers Wetlands Delineation Manual Technical Report Y-87-1, United States
Army Engineer Waterways Experiment Station, Vicksburg, Miss.
Fleiss, J.L., Levin, B. and Paik, M.C., 2013. Statistical methods for rates and proportions.
John Wiley & Sons.
Fuller, L.M., Morgan T.R., and Aichele, S.S., 2006, Wetland Delineation with IKONOS
High-Resolution Satellite Imagery, Fort Custer Training Center, Battle Creek, Michigan,
2005: U.S. Geological Survey, Scientific Investigations Report 2006-5051, 8 p.
Gavin, D.G., Fisher, D.M., Herring, E.M., White, A. and Brubaker, L.B., 2013.
Paleoenvironmental Change on the Olympic Peninsula, Washington: Forests and Climate
from the Last Glaciation to the Present. Report on file at the Olympic National Park, Port
Angeles, WA.
Gergely, K.J., and McKerrow, A., 2016. Terrestrial ecosystems—National inventory of
vegetation and land use (ver. 1.1, August 2016): U.S. Geological Survey Fact Sheet
2013–3085, 1 p., https://pubs.usgs.gov/fs/2013/3085/
Graphpad.com QuickCalcs Online Kappa statistic calculator, accessed May 11th
, 2017
http://graphpad.com/quickcalcs/kappa1/
Hruby, T. 2014. Washington State Wetland Rating System for Western Washington:
2014 Update. Publication #14-06-029. Olympia, WA. Washington Department of
Ecology.
Kudray, G.M. and Gale, M.R., 2000. Evaluation of National Wetland Inventory maps in a
heavily forested region in the upper Great Lakes. Wetlands, 20(4), pp.581-587.Kunze,
L.M., 1994. Preliminary classification of native, low elevation, freshwater wetland
vegetation in western Washington. Washington State Department of Natural Resources,
Natural Heritage Program, Resource Protection.

30
Macleod, R. D., Paige, R. S. & Smith, A. J. 2013. Updating the National Wetland
Inventory in East-Central Minnesota: Technical Documentation. Minnesota Department
of Natural Resources
http://files.dnr.state.mn.us/eco/wetlands/nwi_ecmn_technical_documentation.pdf
O'Connor, J.E., Jones, M.A. and Haluska, T.L., 2003. Flood plain and channel dynamics
of the Quinault and Queets Rivers, Washington, USA. Geomorphology, 51(1), pp.31-59.
Olson, T., 2016. Quinault Tribe Wetlands Survey Design: USFWS National Wetland
Inventory digital map used to extract wetlands within WRIA 21,Generalized Random
Tessellation Stratified (GRTS) survey design, Environmental Protection Agency
(unpublished)
Perry, T.D. and Jones, J.A., 2017. Summer streamflow deficits from regenerating
Douglas‐fir forest in the Pacific Northwest, USA. Ecohydrology, 10(2).
PRISM Climate Group, Oregon State University, http://prism.oregonstate.edu, created 4
Feb 2004
Quinault Indian Nation Forest Management Plan, adopted 2017 (unpublished)
Quinault Indian Nation 2016 State of Our Watersheds Report Queets, Quinault, Chehalis
Basins Northwest Indian Fisheries Commission
https://geo.nwifc.org/SOW/SOW2016_Report/Quinault.pdf
Rampi, L.P., Knight, J.F. and Pelletier, K.C., 2014. Wetland mapping in the upper
midwest United States. Photogrammetric Engineering & Remote Sensing, 80(5), pp.439-
448.
Ramsar Convention Secretariat, 2013. The Ramsar Convention Manual: a guide to the
Convention on Wetlands (Ramsar, Iran, 1971), 6th ed. Ramsar Convention Secretariat,
Gland, Switzerland
Rocchio, F.J., Crawford, R.C. and Niggemann, R., 2015. Wetland Ecosystem
Conservation Priorities for Washington State. An Update of Natural Heritage
Classification, Inventory, and Prioritization of Wetlands of High Conservation Value.
Tiner, R.W., Lang, M.W. and Klemas, V.V. eds., 2015. Remote sensing of wetlands:
applications and advances. CRC Press. Tiner, R.W. 1993 The primary indicators

31
method—A practical approach to wetland recognition and delineation in the United
States, Wetlands 13: 50. doi:10.1007/BF03160865
Hartrich, T. 2016. GIS Program Manager, Division of Natural Resources, Quinault Indian
Nation.
United States Army Corps of Engineers. 2010. Regional Supplement to the Corps of
Engineers Wetland Delineation Manual: Western Mountains, Valleys, and Coast Region
(Version 2.0), ed. J. S. Wakeley, R. W. Lichvar, and C. V. Noble. ERDC/EL TR-10-3.
Vicksburg, MS: U.S. Army Engineer Research and Development Center.
United States Fish and Wildlife Service 2016. National Wetland Inventory. Wetlands and
deepwater habitats classification page. USFWS, Washington, D.C. Available at
https://www.fws.gov/wetlands/ (accessed 15 November, 2016)
Werner, W. H., 2004 Assessing the Accuracy of Wetlands Maps at Sequoia, Kings
Canyon, and Point Reyes, Park Science Vol. 23, No. 1, Winter 2004–2005 Unite States
Department of the Interior, National Park Sevice ISSN 0735-9462
White, B., Ogilvie, J., Campbell, D.M., Hiltz, D., Gauthier, B., Chisholm, H.K.H., Wen,
H.K., Murphy, P.N. and Arp, P.A., 2012. Using the cartographic depth-to-water index to
locate small streams and associated wet areas across landscapes. Canadian Water
Resources Journal, 37(4), pp.333-347.
Wu, M., Kalma, D., & Treadwell-Steitz, C. 2014. Differential Assessment of
Designations of Wetland Status Using Two Delineation Methods. Environmental
Management, 54(1), 23-29. doi:10.1007/s00267-014-0273-3

32
Appendices
33
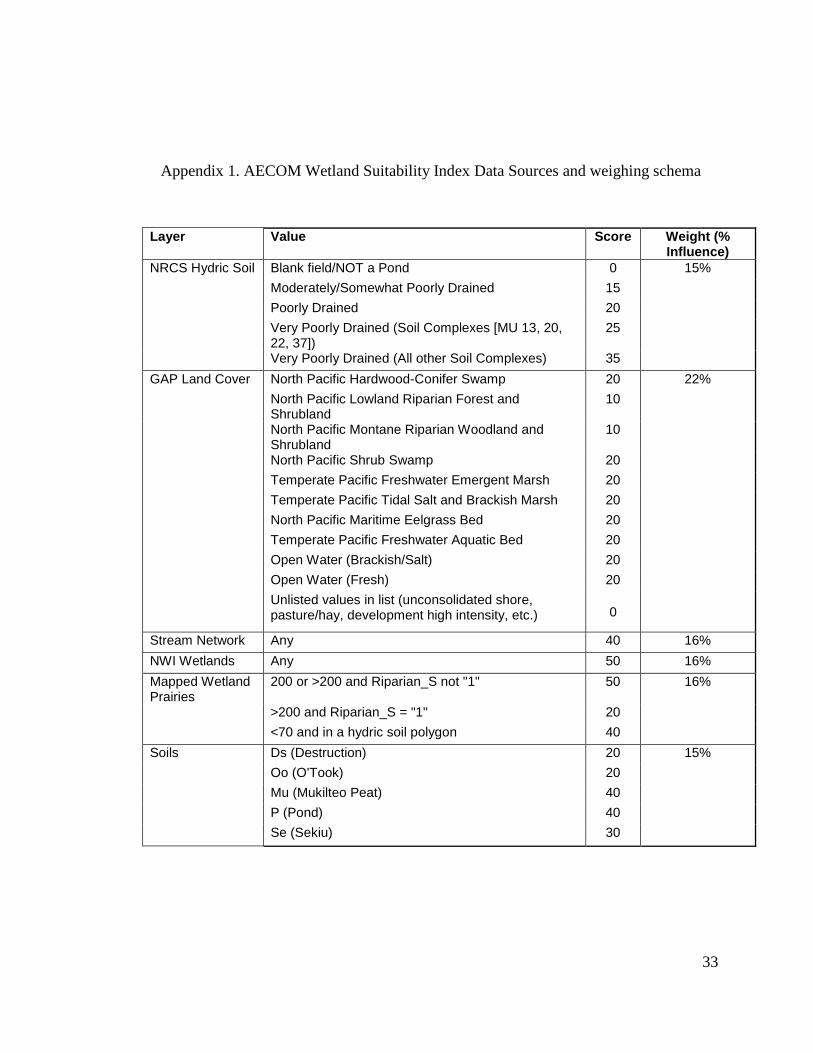
Appendix 1. AECOM Wetland Suitability Index Data Sources and weighing schema
Layer Value Score Weight (% Influence)
NRCS Hydric Soil Blank field/NOT a Pond 0 15%
Moderately/Somewhat Poorly Drained 15
Poorly Drained 20
Very Poorly Drained (Soil Complexes [MU 13, 20, 22, 37])
25
Very Poorly Drained (All other Soil Complexes) 35
GAP Land Cover North Pacific Hardwood-Conifer Swamp 20 22%
North Pacific Lowland Riparian Forest and Shrubland
10
North Pacific Montane Riparian Woodland and Shrubland
10
North Pacific Shrub Swamp 20
Temperate Pacific Freshwater Emergent Marsh 20
Temperate Pacific Tidal Salt and Brackish Marsh 20
North Pacific Maritime Eelgrass Bed 20
Temperate Pacific Freshwater Aquatic Bed 20
Open Water (Brackish/Salt) 20
Open Water (Fresh) 20
Unlisted values in list (unconsolidated shore, pasture/hay, development high intensity, etc.) 0
Stream Network Any 40 16%
NWI Wetlands Any 50 16%
Mapped Wetland Prairies
200 or >200 and Riparian_S not "1" 50 16%
>200 and Riparian_S = "1" 20
<70 and in a hydric soil polygon 40
Soils Ds (Destruction) 20 15%
Oo (O'Took) 20
Mu (Mukilteo Peat) 40
P (Pond) 40
Se (Sekiu) 30

34
Appendix 2. Example in situ photography of erroneously classified Emergent wetland
The dark brown areas are dominated by Myrica gale, a shrub. This wetland was
misclassified as Emergent by both NWI and WSI wetland maps. Photo Credit: Greg Eide,
Quinault Indian Nation

35
Appendix 3: Example site of preserved old growth stumps in artificially impounded
wetland (note soil shovel in lower right for scale)