looking at an angle - fisme.science.uu.nl at an... · james browne jasmina milinkovic frans van...
TRANSCRIPT

Looking atan AngleGeometry andMeasurement
TEACHER’S GUIDE

Mathematics in Context is a comprehensive curriculum for the middle grades.It was developed in 1991 through 1997 in collaboration with theWisconsin Centerfor Education Research, School of Education, University ofWisconsin-Madison andthe Freudenthal Institute at the University of Utrecht, The Netherlands, with thesupport of the National Science Foundation Grant No. 9054928.
The revision of the curriculum was carried out in 2003 through 2005, with thesupport of the National Science Foundation Grant No. ESI 0137414.
National Science FoundationOpinions expressed are those of the authorsand not necessarily those of the Foundation.
© 2010 Encyclopædia Britannica, Inc. Britannica, Encyclopædia Britannica, thethistle logo, Mathematics in Context, and the Mathematics in Context logo areregistered trademarks of Encyclopædia Britannica, Inc.
All rights reserved.
No part of this work may be reproduced or utilized in any form or by any means,electronic or mechanical, including photocopying, recording or by any informationstorage or retrieval system, without permission in writing from the publisher.
International Standard Book Number 978-1-59339-967-2
Printed in the United States of America
1 2 3 4 5 13 12 11 10 09
Feijs, E., de Lange, J., van Reeuwijk, M., Spence, M. S., Brendefur, J., &Pligge, M. A. (2010). Looking at an angle. InWisconsin Center for EducationResearch & Freudenthal Institute (Eds.), Mathematics in context. Chicago:Encyclopædia Britannica, Inc.
The Teacher’s Guide for this unit was prepared by David C.Webb, Sarah Ailts, JillVettrus, Els Feijs, Jan de Lange, and Mieke Abels.

The Mathematics in Context Development TeamDevelopment 1991–1997
The initial version of Looking at an Angle was developed by Els Feijs, Jan deLange, andMartin van Reeuwijk. It was adapted for use in American schools by Mary S. Spence, and Jonathan Brendefur.
Wisconsin Center for Education Freudenthal Institute StaffResearch Staff
Thomas A. Romberg Joan Daniels Pedro Jan de LangeDirector Assistant to the Director Director
Gail Burrill Margaret R. Meyer Els Feijs Martin van ReeuwijkCoordinator Coordinator Coordinator Coordinator
Project Staff
Jonathan Brendefur Sherian Foster Mieke Abels Jansie NiehausLaura Brinker James A, Middleton Nina Boswinkel Nanda QuerelleJames Browne Jasmina Milinkovic Frans van Galen Anton RoodhardtJack Burrill Margaret A. Pligge Koeno Gravemeijer Leen StreeflandRose Byrd Mary C. Shafer Marja van den Heuvel-PanhuizenPeter Christiansen Julia A. Shew Jan Auke de Jong Adri TreffersBarbara Clarke Aaron N. Simon Vincent Jonker Monica WijersDoug Clarke Marvin Smith Ronald Keijzer Astrid de WildBeth R. Cole Stephanie Z. Smith Martin KindtFae Dremock Mary S. SpenceMary Ann Fix
Revision 2003–2005
The revised version of Looking at an Angle was developed by Jan deLange and Els Feijs. It was adapted for use in American schools by Margaret A. Pligge.
Wisconsin Center for Education Freudenthal Institute StaffResearch Staff
Thomas A. Romberg David C. Webb Jan de Lange Truus DekkerDirector Coordinator Director Coordinator
Gail Burrill Margaret A. Pligge Mieke Abels Monica WijersEditorial Coordinator Editorial Coordinator Content Coordinator Content Coordinator
Project Staff
Sarah Ailts Margaret R. Meyer Arthur Bakker Nathalie KuijpersBeth R. Cole Anne Park Peter Boon Huub Nilwik Erin Hazlett Bryna Rappaport Els Feijs Sonia PalhaTeri Hedges Kathleen A. Steele Dédé de Haan Nanda QuerelleKaren Hoiberg Ana C. Stephens Martin Kindt Martin van ReeuwijkCarrie Johnson Candace UlmerJean Krusi Jill VettrusElaine McGrath
Cover photo credits: (left) © Corbis; (middle, right) © Getty Images
Illustrationsviii (left) Christine McCabe/© Encyclopædia Britannica, Inc.; xMap from the Road Atlas ©1994 by Rand McNally; (right) © Encyclopædia Britannica, Inc.; xii (bottom right), xiii(right) Holly Cooper-Olds; vi (left and top) Christine McCabe/© Encyclopædia Britannica,Inc.; 2 (bottom), 3, 4 Christine McCabe/© Encyclopædia Britannica, Inc.; 6 Rich Stergulz;10, 16 Christine McCabe/© Encyclopædia Britannica, Inc.; 20 Rich Stergulz; 41 ChristineMcCabe/© Encyclopædia Britannica, Inc.; 45 James Alexander; 47 Holly Cooper-Olds;52 James Alexander; 61 (top) Christine McCabe/© Encyclopædia Britannica, Inc.;(bottom) James Alexander; 62 (top) Rich Stergulz
Photographsx (top right) Historic Urban Plans, Inc.; xiii Courtesy of Michigan State University Museum.;xvii © Corbis; viVictoria Smith/HRW; 1 © Els Feijs; 2 © Corbis; 3Victoria Smith/HRW; 9 ©Els Feijs; 11 © Corbis; 12 (top) © Getty Images; (bottom) Adrian Muttitt/Alamy; 18, 19 SamDudgeon/HRW; 25© Els Feijs; 32© Corbis; 34, 39 Sam Dudgeon/HRW; 42© PhotoDisc/Getty Images; 46 Fotolincs/Alamy; 57 ©Yann Arthus-Bertrand/Corbis
Looking at an Angle v
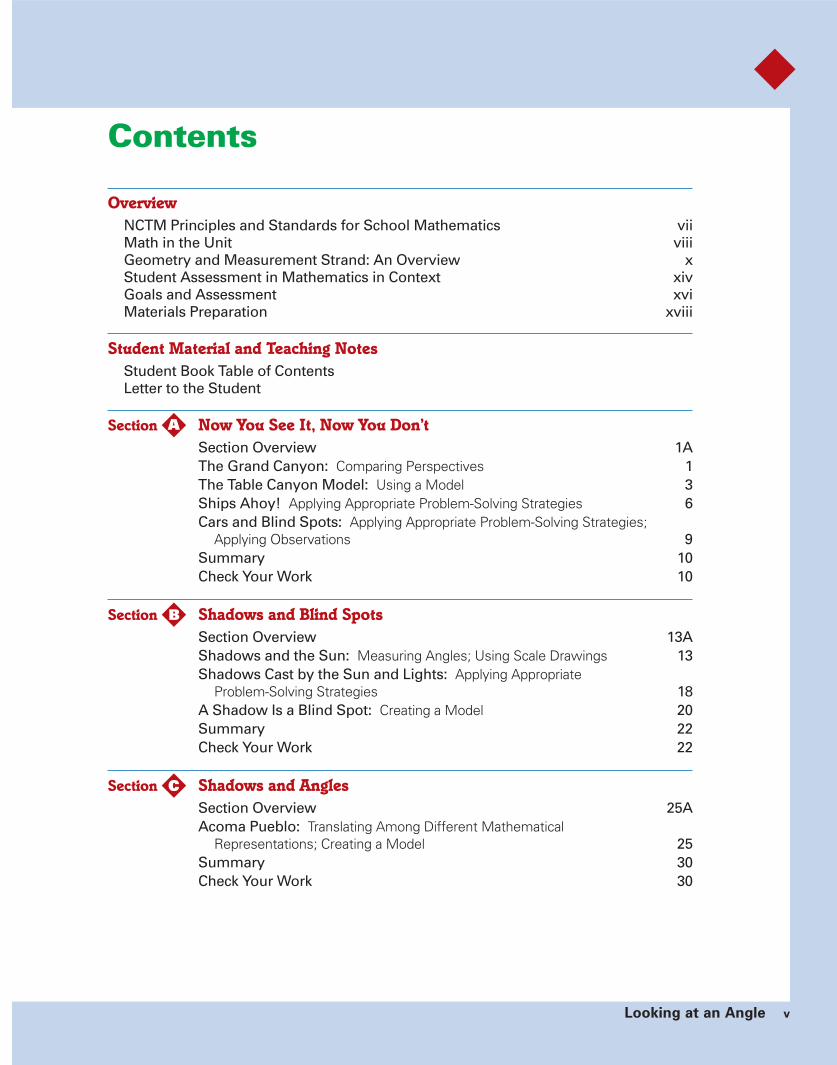
Contents
OverviewNCTM Principles and Standards for School Mathematics viiMath in the Unit viiiGeometry and Measurement Strand: An Overview xStudent Assessment in Mathematics in Context xivGoals and Assessment xviMaterials Preparation xviii
Student Material and Teaching NotesStudent Book Table of ContentsLetter to the Student
Section Now You See It, Now You Don’tSection Overview 1AThe Grand Canyon: Comparing Perspectives 1The Table Canyon Model: Using a Model 3Ships Ahoy! Applying Appropriate Problem-Solving Strategies 6Cars and Blind Spots: Applying Appropriate Problem-Solving Strategies;
Applying Observations 9Summary 10Check Your Work 10
Section Shadows and Blind SpotsSection Overview 13AShadows and the Sun: Measuring Angles; Using Scale Drawings 13Shadows Cast by the Sun and Lights: Applying Appropriate
Problem-Solving Strategies 18A Shadow Is a Blind Spot: Creating a Model 20Summary 22Check Your Work 22
Section Shadows and AnglesSection Overview 25AAcoma Pueblo: Translating Among Different Mathematical
Representations; Creating a Model 25Summary 30Check Your Work 30
C
B
A

vi Looking at an Angle Contents
Contents
Section Glide AnglesSection Overview 32AHang Gliders: Translating Among Different Mathematical
Representations; Using Scale Drawings 32Glide Ratio: Applying Ratios; Determining Equivalent Forms
of Numbers 34From Glide Ratio to Tangent: Defining the Tangent Ratio 37Summary 42Check Your Work 42
Section Reasoning with RatiosSection Overview 45ATangent Ratio: Examining Pictures; Identifying the Tangent Ratio 45Vultures Versus Gliders: Making Comparisons; Applying the
Tangent Ratio 46Pythagoras: Applying the Tangent Ratio; Using the
Pythagorean Theorem 47The Ratios: Tangent, Sine, Cosine: Defining and Applying
Right Triangle Trigonometric Ratios 50Summary 54Check Your Work 54
Additional Practice 56
Appendix A 61A
Assessment and SolutionsAssessment Overview 64Quiz 1 66Quiz 2 68Unit Test 70Quiz 1 Solutions 76Quiz 2 Solutions 77Unit Test Solutions 78
Glossary 82
Blackline MastersLetter to the Family 84Student Activity Sheets 85Teaching Transparency 96
D
E

Overview
Looking at an Angleand the NCTM Principlesand Standards forSchool Mathematicsfor Grades 6–8The process standards of Problem Solving, Reasoning and Proof,Communication, Connections, and Representation are addressedacross all Mathematics in Context units.
In addition, this unit specifically addresses the following PSSMcontent standards and expectations:
Geometry
In grades 6–8, all students should:
• create and critique inductive and deductive arguments concerninggeometric ideas and relationships, such as congruence, similarity,and the Pythagorean relationship;
• draw geometric objects with specified properties, such as sidelengths or angle measures;
• use two-dimensional representations of three-dimensional objectsto visualize and solve problems;
• use visual tools to represent and solve problems;
• use geometric models to represent and explain numerical andalgebraic relationships; and
• recognize and apply geometric ideas and relationships in areasoutside the mathematics classroom, such as art, science, andeveryday life.
In grades 9–12, all students should:
• use trigonometric relationships to determine lengths and anglemeasures and
• use geometric ideas to solve problems in, and gain insights into,other disciplines and other areas of interest such as art andarchitecture.
Measurement
In grades 6–8, all students should:
• understand both metric and customary systems of measurement;
• understand relationships among units and convert from one unitto another within the same system;
• select and apply techniques and tools to accurately find lengthand angle measures to appropriate levels of precision; and
• solve problems involving scale factors, using ratio and proportion.
Overview Looking at an Angle vii

Overview
Prior Knowledge
This unit assumes that students have an under-standing of:
• metric measurements;
• ratio tables;
• how to use a compass card or protractor tomeasure angles;
• relationships between ratios, decimals, andfractions;
• equivalent ratios, decimals, and fractions;
• how to compute areas;
• information that is embedded in two-dimensional representations of three-dimensional situations;
• properties of triangles (especially righttriangles);
• the construction of triangles;
• scale as used in drawings and maps; and
• line graphs.
In Looking at an Angle, the last unit of theGeometry strand, different concepts are formal-ized. Investigating a model of the Grand Canyon,students identify lines of sight, or vision lines.They figure out, for example, from which places onthe rim of the Grand Canyon the river can be seenand why it cannot be seen from other vantagepoints.
Then they use vision lines to determine the blindspot of the captain of different ships in which aswimmer or small boat will not be seen. They dis-cover the relationship between the length of theblind spot and the measure of the angle betweenthe vision line and the water surface. Students alsouse graph paper and toy boats to investigate thesize and shape of the blind spot of different boats.
Students explore the movement of the sun and theeffect on the direction and length of shadows andthe angle of the sun’s rays. They describe differ-ences between shadows caused by the sun andshadows caused by a nearby light source. Studentslearn that shadows are similar to blind spots orblind areas.
Math in the Unit
viii Looking at an Angle Overview
Ship B
Captain
Captain
Ship A

Overview
The steepness of a vision line, of the sun’s rays, ofa ladder, and of the flight path of a hang glider canall be modeled by a right triangle. This leads toformalization of the use of the Pythagorean theoremand its reverse. Students also learn about two otherratios between the sides of a right triangle, thesine and the cosine, which are then used insolving problems.
When students have finished this unit, they:
• understand and use the concept of vision lines;
• Students model situations and solve problemsinvolving vision lines, blind spots, and blindareas.
• They understand the relationship betweenvision lines and blind spots, and sun’s rays andshadows.
• They understand the difference betweenshadows caused by the sun and shadowscaused by a nearby light source.
• understand and use the concept of tangent,sine and cosine; and
• Students use previous knowledge of ratio,proportion, angle, and angle measure.
• They develop informal understanding oftangent ratio by studying blind spots,shadows, steepness, and glide ratios.
• They develop formal notation and solveproblems involving tangent, sine and cosine.
• Students use a calculator to find the tangentof an angle and the reverse operation.
• Students explore the relationship betweenslope and glide ratio (tan �).
• know and use the Pythagorean theorem andits reverse.
Overview Looking at an Angle ix
40 m
10 m
heig
ht
(h
)
distance (d )
�
The context of a ladder leaning against a wall isagain similar to that of a vision line or a light ray.It is used to formalize the concept of steepness,which can be determined by either the anglebetween the ladder and the ground or the ratioof the height to the distance. Students learn thatsituations similar to that of the ladder can berepresented by right triangles.
The path of a hang glider is used to introduce thetangent ratio and to formalize students’ under-standing of it. Students compare the performanceof different hang gliders by considering their glideratio: the ratio between the height from which ahang glider takes off and the distance it covers.They learn how glide ratios can also be expressedas fractions or decimals. Students’ understandingof the glide ratio is formalized as the tangent ratio,which they use to solve problems.
tan � � h—d .
cos � �side adjacent to �
�AB
hypotenuse AC
sin � �side opposite �
�BC
hypotenuse AC B
C
A
�
B
C
A
�

Overview
x Looking at an Angle Overview
In the MiC units, measurement concepts and skillsare not treated as a separate strand. Many measure-ment topics are closely related to what studentslearn in geometry. The Geometry and Measurementunits contain topics such as similarity, congruency,perimeter, area, and volume. The identification ofand application with a variety of shapes, both two-dimensional and three dimensional, is alsoaddressed.
The developmental principles behind geometry in Mathematics in Context are drawn from HansFreudenthal’s idea of “grasping space.” Throughoutthe strand, ideas of geometry and measurementare explored. Geometry includes movement andspace—not just the study of shapes. The majorgoals for this strand are to develop students’ abilityto describe what is seen from different perspectivesand to use principles of orientation and navigationto find their way from one place to another.
The emphasis on spatial sense is related to howmost people actually use geometry. The develop-ment of students’ spatial sense allows them to solveproblems in the real world, such as identifying acar’s blind spots, figuring out how much materialto buy for a project, deciding whether a roof orramp is too steep, and finding the height or lengthof something that cannot be measured directly,such as a tree or a building.
Mathematical content
In Mathematics in Context, geometry is firmlyanchored in the physical world. The problem contexts involve space and action, and studentsrepresent these physical relationships mathe-matically.
Throughout the curriculum, students discoverrelationships between shapes and develop theability to explain and use geometry in the realworld. By the end of the curriculum, students work more formally with such geometric conceptsas parallelism, congruence, and similarity, and usetraditional methods of notation as well.
Geometry and Measurement Strand:An Overview
SanJose
PacificOcean
Half MoonBay
Hayward
Golden Gate Bridge
1
SanFrancisco
680
92
10 miles5
10 16 kilometers5
0
Airports
S
N
W E
NE
NW
SW
SE
0 10 2030
40
5060
7080
90100
110120
130
140150
160170180190200210
220
230
240
250
26027
028
029
030
031
0
320330
340 350
101
280
San Francisco Bay
San Francisco Oakland BayBridge
OaklandInternationalAirport
84

Overview
Overview Looking at an Angle xi
Organization of the Geometry andMeasurement Strand
Visualization and representation is a pervasivetheme in the Geometry strand and is developed in all of the Geometry and Measurement strandunits. The units are organized into two substrands: Orientation and Navigation, and Shape andConstruction. The development of measurementskills and concepts overlaps these two substrandsand is also integrated throughout otherMathematics in Context units in Number, Algebra,and Data Analysis.
Orientation and Navigation
The Orientation and Navigation substrand is intro-duced in Figuring All the Angles, in which studentsare introduced to the cardinal, or compass,directions and deal with the problems that arisewhen people in different positions describe a location with directions. Students use maps andcompass headings to identify the positions of airplanes. They look at angles as turns, or changes in direction, as well as the track made by a sled inthe snow. They discern different types of anglesand learn formal notations and terms: vertex, �A,and so on. The rule for the sum of the angles in atriangle is informally introduced. To find anglemeasurements students use instruments such as aprotractor and compass card.
123
Pathways through the Geometry and Measurement Strand
(Arrows indicate prerequisite units.)
Level 2
Level 1
Level 3
Figuring Allthe Angles
Reallotment
Made toMeasure
Packages andPolygons
Triangles andBeyond
30o
60o
90o
120o
150o
180o210o
240o
270o
300o
330o
N
30 mi.30 mi.30 mi
10 mi.10 mi.
20 mi.20 mi.
10 mi
20 mi
It’s All theSame
Looking atan Angle

Overview
xii Looking at an Angle Overview
In Looking at an Angle, the last unit in the Geometrystrand, the tangent ratio is informally introduced.The steepness of a vision line, the sun’s rays, a ladder,and the flight path of a hang glider can all be mod-eled by a right triangle. Considering the glide ratioof hang gliders leads to formalization of the tangentratio. Two other ratios between the sides of a righttriangle are introduced, the sine and the cosine. This leads to formalization of the use of thePythagorean theorem and its converse.
Shape and Construction
Reallotment is the first unit in the Shape andConstruction substrand. Students measure andcalculate the perimeters and areas of quadrilaterals,circles, triangles, and irregular polygons. Studentslearn and use relations between units of measure-ment within the Customary System and the MetricSystem.
Solids are introduced in Packages and Polygons.Students compare polyhedra with their respectivenets, use bar models to understand the concept of rigidity, and use Euler’s formula to formallyinvestigate the relationships among the numbers of faces, vertices, and edges of polyhedra.
In Triangles and Beyond,students develop a moreformal understanding ofthe properties of triangles,which they use to constructtriangles. The concepts ofparallel lines, congruence,and transformation areintroduced, and studentsinvestigate the propertiesof parallel lines and paral-lelograms. A preformalintroduction to thePythagorean theorem is presented.
After studying this unit,students should be able to recognize and classifytriangles and quadrilaterals.In the unit It’s All the Same,students develop an under-standing of congruency,
similarity, and the properties of similar trianglesand then use these ideas to solve problems. Theirwork with similarity and parallelism leads them tomake generalizations about the angles formedwhen a transversal intersects parallel lines, and thePythagorean theorem is formalized.
Does Euler’s formula workfor a five-sided tower?Explain your answer
If a triangle has aright angle, then the square on the longest side has the
same area as the other two combined.

Overview
Overview Looking at an Angle xiii
Measurement
The concept of a measurement system, standard-ized units, and their application overlaps the sub-strands of Orientation and Navigation, and Shapeand Construction. Furthermore, the developmentand application of measurement skills is integratedthroughout units in the Number, Algebra, andData Analysis strands, through topics such as useof ratio and proportion, finding and applying scalefactors, and solving problems involving rates (forinstance, distance-velocity-time relationships).
In Mathematics in Context, the Metric System isused not only as a measurement system, but alsoas a model to promote understanding of decimalnumbers.
The unit Made to Measure is a thematic measure-ment unit where students work with standard andnon-standard units to understand the systems andprocesses of measurement. They begin by studyinghistoric units of measure such as foot, pace, andfathom (the length of outstretched arms). Studentsuse their own measurements in activities aboutlength, area, volume, and angle and then examinewhy standardized units are necessary for each.
The relationships between measurement units areembedded in the number unit, Models You CanCount On, where students explore conversionsbetween measures of length within the Metric System. The measurement of area in both Metricand Customary Systems is explicitly addressed inthe unit Reallotment. Students also learn somesimple relationships between metric and customarymeasurement units, such as 1 kilogram is about2.2 pounds, and other general conversion rules tosupport estimations across different measurementsystems. In Reallotment, Made to Measure, andPackages and Polygons, the concepts of volumeand surface area are developed. Strategies thatwere applied to find area measurements inReallotment are used to derive formulas forfinding the volume of a cylinder, pyramid, and cone.
Visualization andRepresentation
Visualization and representation is a componentof every geometry unit. In Mathematics in Context,this theme refers to exploring figures from differentperspectives and then communicating about theirappearance or characteristics.
In Reallotment, students use visualizations andrepresentations to find the areas of geometric figures. They decide how to reshape geometric figures and group smaller units into larger, easy-to-count units. They also visualize and representthe results for changing the dimensions of a solid.In the unit It’s All the Same, studentsvisualize triangles tosolve problems.
Packages
Pencils
1
15
� 2 � 2
2
30
4
60
1 cm2

Overview
xiv Looking at an Angle Overview
Level III analysis
Level II connections
Leve
ls o
f Rea
sonin
g
Questions P
osedDom
ains of Mathem
atics
Level I reproduction
algebra
geometry
number
statistics &
probability
X
O
easy
difficult
Student Assessment in Mathematics in ContextAs recommended by the NCTM Principles and Standards for SchoolMathematics and research on student learning, classroom assessmentshould be based on evidence drawn from several sources. An assessmentplan for a Mathematics in Context unit may draw from the followingoverlapping sources:
• observation—As students work individually or in groups, watchfor evidence of their understanding of the mathematics.
• interactive responses —Listen closely to how students respond toyour questions and to the responses of other students.
• products —Look for clarity and quality of thought in students’solutions to problems completed in class, homework, extensions,projects, quizzes, and tests.
Assessment Pyramid
When designing a comprehensive assessment program, the assessmenttasks used should be distributed across the following three dimensions:mathematics content, levels of reasoning, and difficulty level. TheAssessment Pyramid, based on Jan de Lange’s theory of assessment, is a model used to suggest how items should be distributed acrossthese three dimensions. Over time, assessment questions should “fill” the pyramid.

Overview
Overview Looking at an Angle xv
Levels of Reasoning
Level I questions typically address:
• recall of facts and definitions and
• use of technical skills, tools, and standard algorithms.
As shown in the pyramid, Level I questions are notnecessarily easy. For example, Level I questions mayinvolve complicated computation problems. Ingeneral, Level I questions assess basic knowledgeand procedures that may have been emphasizedduring instruction. The format for this type ofquestion is usually short answer, fill-in, or multiplechoice. On a quiz or test, Level I questions closelyresemble questions that are regularly found in agiven unit substituted with different numbersand/or contexts.
Level II questions require students to:
• integrate information;
• decide which mathematical models or tools touse for a given situation; and
• solve unfamiliar problems in a context, based on the mathematical content of the unit.
Level II questions are typically written to elicit shortor extended responses. Students choose their ownstrategies, use a variety of mathematical models,and explain how they solved a problem.
Level III questions require students to:
• make their own assumptions to solve open-endedproblems;
• analyze, interpret, synthesize, reflect; and
• develop one’s own strategies or mathematicalmodels.
Level III questions are always open-ended problems.Often, more than one answer is possible and thereis a wide variation in reasoning and explanations.There are limitations to the type of Level III prob-lems that students can be reasonably expected torespond to on time-restricted tests.
The instructional decisions a teacher makes as heor she progresses through a unit may influence thelevel of reasoning required to solve problems. If amethod of problem solving required to solve aLevel III problem is repeatedly emphasized duringinstruction, the level of reasoning required to solvea Level II or III problem may be reduced to recallknowledge, or Level I reasoning. A student who doesnot master a specific algorithm during a unit butsolves a problem correctly using his or her owninvented strategy may demonstrate higher-levelreasoning than a student who memorizes andapplies an algorithm.
The “volume” represented by each level of theAssessment Pyramid serves as a guideline for thedistribution of problems and use of score pointsover the three reasoning levels.
These assessment design principles are usedthroughout Mathematics in Context. The Goalsand Assessment charts that highlight ongoingassessment opportunities—on pages xvi and xviiof each Teacher’s Guide—are organized accordingto levels of reasoning.
In the Lesson Notes section of the Teacher’s Guide,ongoing assessment opportunities are also shownin the Assessment Pyramid icon located at the bottom of the Notes column.
Assessment Pyramid
6
9
Understand the ratiobetween an object and itsshadow caused by the sunfor different times of theyear.

Overview
xvi Looking at an Angle Overview
Goals and AssessmentIn the Mathematics in Context curriculum, unit goals, organized accordingto levels of reasoning described in the Assessment Pyramid on page xiv,relate to the strand goals and the NCTM Principles and Standards forSchool Mathematics. The Mathematics in Context curriculum is designed to help students demonstrate their understanding of mathematics in
each of the categories listed below. Ongoingassessment opportunities are also indicated ontheir respective pages throughout the Teacher’sGuide by an Assessment Pyramid icon.
It is important to note that the attainment of goals in one category is not a prerequisite toattaining those in another category. In fact, students should progress simultaneously toward
several goals in different categories. The Goals and Assessment table isdesigned to support preparation of an assessment plan.
Level I:
Conceptual
and Procedural
Knowledge
Ongoing Unit
Goal Assessment Opportunities Assessment Opportunities
1. Understand the concepts Section A p. 4, #5 Quiz 1 #1b, 2abof vision line, angle, and p. 6, #10 Test #1, 2, 5blind spot. p. 8, #15
p. 9, #18
2. Understand the concept Section D p. 37, #13 Quiz 2 #1, 3of glide ratio or tangent. p. 39, #15
3. Construct and measure Section B p. 19, #14 Quiz 1 #1b, 2abvision lines and blind spots Test #3, 5(or light rays and shadows) intwo- and three-dimensionalrepresentations.
4. Measure angles. Section B p. 15, #6 Quiz 1 #1a, 3Section C p. 28, #10 Test #8Section D p. 36, #9
5. Make scale drawings of Section B p. 14, #4 Quiz 2 #3situations. Section C p. 28, #10 Test #12

Overview
Overview Looking at an Angle xvii
Level II:
Reasoning,
Communicating,
Thinking,
and Making
Connections
Level III:
Modeling,
Generalizing,
and Non-Routine
Problem Solving
Ongoing Unit
Goal Assessment Opportunities Assessment Opportunities
6. Make relative Section A p. 9, #17 Quiz 2 #2comparisons involving Section C p. 27, #6steepness problems. Section D p. 34, #4c
p. 35, #6Section E p. 46, #2ad
p. 53, #14b
7. Understand the Section A p. 7, #12c Test #9, 11, 12, 13relationship among Section B p. 18, #12absteepness, angle, and Section C p. 28, #9height-to-distance ratio. Section D p. 40, #23
8. Understand the ratio Section B p. 15, #9 Test #6, 7between an object and its p. 18, #10bcshadow caused by the sun for different times of the year.
Ongoing Unit
Goal Assessment Opportunities Assessment Opportunities
9. Understand the Section D p. 44, correspondence between For Further Reflectioncontexts that may be Section E p. 46, #2bcrepresented by a right triangle.
10. Use ratios to solve Section A p. 9, #16 Test #4, 10problems. Section D p. 34, #4ab
11. Solve problems using Section D p. 39, #19 Test #9, 10, 13right triangle trigonometry Section E p. 49, #5bratios. Section E p. 52, #13
p. 55, For Further Reflection

Overview
The following items are the necessary materialsand resources to be used by the teacher andstudents throughout the unit. For further details,see the Section Overviews and the Materials sectionof the Hints and Comments column on eachteacher page. Note: Some contexts and problemscan be enhanced through the use of optionalmaterials. These optional materials are listed inthe corresponding Hints and Comments section.
Student Resources
Quantities listed are per student.
• Letter to the Family
• Student Activity Sheets 1–10
• Student Activity Sheet 2 (several copies pergroup of students)
• Appendix A
Teacher Resources
No resources required
Student Materials
Quantities listed are per student, unless otherwiseindicated.
• 3 ft � 5 ft length of paper (two sheets per groupof students)
• 8 1__2 " � 11" paper (one sheet)
• Angle measure tools, constructed by students(see page 16)
• Books or boxes that can stand upright
• Calculator
• Centimeter cubes (at least 10 per pair ofstudents)
• Centimeter ruler
• Cardstock
• Directional compass
• Glue (one bottle per pair of students)
• Markers (one per group of students)
• Metric measuring tape
• Pieces of string, straws, or uncooked spaghetti(one per pair of students)
• Protractors or compass cards
• Scissors
• Straightedges or rulers
• Sticks, 0.7 meter long
• Sticks, 1.2 meters long
• String (one roll per pair of students)
• Tape (one dispenser per group)
• Transparency with a line on it (one per student)
• Toy boats with flat bottoms (one per group)
Materials Preparation
xviii Looking at an Angle Overview

StudentMaterial
andTeaching
Notes
StudentMaterial
andTeaching
Notes

Teachers Matter
v Looking at an Angle Teachers Matter
ContentsLetter to the Student vi
Section A Now You See It, Now You Don’tThe Grand Canyon 1The Table Canyon Model 3Ships Ahoy 6Cars and Blind Spots 9Summary 10Check Your Work 10
Section B Shadows and Blind SpotsShadows and the Sun 13Shadows Cast by the Sun
and Lights 18A Shadow is a Blind Spot 20Summary 22Check Your Work 22
Section C Shadows and AnglesAcoma Pueblo 25Summary 30Check Your Work 30
Section D Glide AnglesHang Gliders 32Glide Ratio 34From Glide Ratio to Tangent 37Summary 42Check Your Work 42
Section E Reasoning with RatiosTangent Ratio 45Vultures Versus Gliders 46Pythagoras 47The Ratios: Tangent, Sine, Cosine 50Summary 54Check Your Work 54
Additional Practice 56
Answers to Check Your Work 61
Appendix A 68
S
EN
W

Teachers Matter
Teachers Matter vT
Dear Student,
Welcome to Looking at an Angle!
In this unit, you will learn about vision lines and blind areas. Haveyou ever been on one of the top floors of a tall office or apartmentbuilding? When you looked out the window, were you able to see thesidewalk directly below the building? If you could see the sidewalk, itwas in your field of vision; if you could not see the sidewalk, it was ina blind spot.
The relationship between vision lines and rays of light and the relationship betweenblind spots and shadows are some of thetopics that you will explore in this unit.Have you ever noticed how the length of a shadow varies according to the timeof day? As part of an activity, you willmeasure the length of the shadow of astick and the corresponding angle of thesun at different times of the day. You willthen determine how the angle of the sunaffects the length of a shadow.
Besides looking at the angle of the sun, youwill also study the angle that a ladder makeswith the floor when it is leaning against a walland the angle that a descending hang glidermakes with the ground. You will learn two different ways to identify the steepness of anobject: the angle the object makes with theground and the tangent of that angle.
We hope you enjoy discovering the many ways of “looking at an angle.”
Sincerely,
TThe Mathematics in Context Development Team
shadow
sun rays

Day 1: The Grand Canyon Student pages 1–4
INTRODUCTION Problems 1–3 Discuss the view of the Colorado Riverfrom the rim of the Grand Canyon.
ACTIVITY Activity, pages 2 and 3 Use two tables to create a model of the Problem 4 Grand Canyon to investigate vision lines
and blind spots.
HOMEWORK Problem 5 Write a report on the activity using theterms visible, not visible, and blind spot.
Day 2: The Table Canyon Model Student pages 5–7
INTRODUCTION Problems 6–9 Investigate vision lines using a diagram of the side view of the paper models.
CLASSWORK Problems 10–12 Determine blind spots by drawing visionlines on pictures of various boats.
HOMEWORK Problem 13 Reason about vision lines, blind spots, and driving patterns for boats.
Day 3: Ships Ahoy (Continued) Student page 8
INTRODUCTION Review homework. Review homework from Day 2.
ACTIVITY Problem 14 Determine the area of a blind spot of a toy boat.
HOMEWORK Problem 15 Relate the size of the blind spot to the size of the boat.
1A Looking at an Angle Teachers Matter
Teachers MatterA
Section Focus
The instructional focus of Section A is to:
• discover the concept of vision line;
• investigate situations involving vision lines and blind spots;
• construct vision lines in two- and three-dimensional representations;
• measure angles; and
• use ratio to solve problems involving vision lines and blind spots.
Pacing and Planning

Day 4: Cars and Blind Spots Student pages 9–12
INTRODUCTION Review homework. Review homework from Day 3.
CLASSWORK Problems 16–19 Discuss visions lines and blind spots of a car.
HOMEWORK Check Your Work Student self-assessment: Identify, draw,For Further Reflection reason about vision lines and blind spots.
Teachers Matter Section A: Now You See It, Now You Don’t 1B
Teachers Matter A
MaterialsStudent Resources
Quantities listed are per student, unless otherwisenoted.
• Letter to the Family
• Student Activity Sheets 1 and 3
• Student Activity Sheet 2 (several copies pergroup of students)
Teachers Resources
No resources required
Student Materials
Quantities listed are per group of students, unlessotherwise noted.
• 3' x 5' length of paper, (two sheets)
• 8 1__2 " x 11" paper (one sheet per student)
• Compass card or protractor (one per student)
• Marker
• Scissors (one pair per student)
• Straightedge or ruler (one per student)
• String (one roll per class)
• Tape
• Toy boat with flat bottom
* See Hints and Comments for optional materials.
Learning Lines
Informal Exploration of Steepness and Angle of Elevation
This section focuses on different contexts inwhich vision plays a role:
• a hiker on the rim of the Grand Canyon lookingdown trying to see the Colorado River;
• the captain of a ship looking at the water overthe bow of the ship;
• the driver of a car looking at the road throughthe front windshield.
These contexts share a similar trait: there is anobject blocking the view (rocks, the bow of theship, the hood of the car). In each of these contexts,vision lines (i.e., imaginary straight lines from theeye to an object) can be used as a tool to determinewhat can and cannot be seen (i.e., a blind spot).Each situation can be represented with a right triangle: there is a height for the eye, an objectblocking the view, a blind spot, and an angle ofelevation of the vision line.
The exploration in this section is informal.Students are encouraged to discover the conceptof vision line and investigate blind spots. Theyinformally reason about the ratios involved andabout the relationship with the angle between thevision line and the surface.
At the End of This Section:Learning Outcomes
Students understand the concept of vision line.They are able to construct vision lines in two- andthree-dimensional representations in order todetermine blind spots. They have an informalunderstanding of the concept of steepness andthe relationship between steepness and angle of elevation.
Additional Resources: Additional Practice, Section A, Student Book page 56
eye
object
vision line
blind spot
angle of elevation

1 Looking at an Angle
Now You See It, NowYou Don’t
A
The Grand Canyon is one of the most famous natural wonders in theworld. Located on the high plateau of northwestern Arizona, it is ahuge gorge carved out by the Colorado River. It has a total length of446 kilometers (km). Approximately 90 km of the gorge are located in the Grand Canyon National Park. The north rim of the canyon (theKaibab Plateau) is about 2,500 meters (m) above sea level.
ANow You See It, NowYou Don’t
The Grand Canyon
This photograph shows part of the Colorado River, winding along thebottom of the canyon.
1. Why can’t you see the continuation of the river on the lower rightside of the photo?
Notes
Encourage students tofocus on the location of the photographer’s camera,the location of the rim of the canyon, and thevisibility of the river. Moststudents know from playinghide-and-seek that objectsor persons may be hiddenfrom view when somethingis in the way.
Reaching All LearnersHands-On Learning
If students have difficulty with this context, you could set up a simpleclassroom situation to make this point clear. For example, if someone isapproaching the classroom, some students may be able to see theapproaching person through the open door. However, other students mayfind that their view of the approaching person is blocked by a wall.
Parent Involvement
Send Letter to the Family home with students. Have students share it withtheir parents, discussing the questions. Parents can write a comment ontheir experiences with the context. These letters can then be shared in class.

Section A: Now You See It, Now You Don’t 1T
Hints and CommentsOverviewStudents look at a photograph of the Grand Canyon.They determine why the Colorado River cannot beseen in the lower right portion of the photograph.
About the Mathematics
An important mathematical goal for this section is tohave students understand the concept of the visionline, an imaginary straight line from your eye to anobject. Do not, however, mention this idea yet. At thispoint, it is enough for them to realize that somethingmay be hidden from view because something is in theway. Later in this section, the concept of a “blind spot”will be introduced.
Planning
Students may work on problem 1 in small groups.Discuss students’ answers with the class. For additionalinformation on the Grand Canyon, visit:www.nps.gov/grca
Solutions and Samples
1. Explanations will vary, but students should indicatethat something is blocking their view. Samplestudent explanations:
The ledge in front of us is hiding the ColoradoRiver.
The river is a long way down and the rocks are inthe way.

2 Looking at an Angle
Now You See It, NowYou Don’t
A
The Colorado River can barely be seenfrom most viewpoints in Grand CanyonNational Park.
This drawing shows a hiker on the northrim overlooking a portion of the canyon.
2. Can the hiker see the river directlybelow her? Explain.
Now You See It, Now You Don’tA
Here you see a photograph and a drawing of the same area of theGrand Canyon. The canyon walls are shaped like stairs in the drawing.
3. Describe other differences between the photo and the drawing.
Notes
3 Some students may find the drawing easier tounderstand, while othersmay prefer the photo-graph. In either case,students should realizethat the drawing simplifiesthe canyon’s rockformations.
3 Discuss similarities aswell as differences.
Reaching All LearnersAct It Out
Students may use gestures to show how much of the canyon they will beable to see.

Section A: Now You See It, Now You Don’t 2T
Hints and CommentsOverviewStudents visualize how much of the Colorado River ahiker on the rim can see. Students also consider thedifference between a drawing and a photograph of theGrand Canyon.
About the Mathematics
In problem 1, students were asked to work withinformation supplied by a photograph. Problem 2 isdifferent in the sense that students have to putthemselves in the position of the hiker to imagine thisperson’s view of the river. Problem 2 is aiming at theidea of vision lines. Students may actually come upwith the idea of using string or something else toshow such a line.
Planning
Students may work on problems 2 and 3 in smallgroups. You may want to discuss students’ answerswith the whole class.
Solutions and Samples
2. Answers will vary. Sample response:
The hiker is kneeling on a rock that is blockingher view. She can probably see the river only if shelooks to the left or the right.
3. Answers will vary. Sample response:
The drawing simplifies the canyon. Details that canbe seen on the photograph, such as roads, trees,differences in the color of the rock formations, andshadows, are lost in the drawing. Because thesedetails are left out of the drawing, other features ofthe canyon can be seen more clearly. It is easier tosee the river. It is also easier to see that the rockformations are shaped like stairs.

3 Looking at an Angle
Now You See It, NowYou Don’t
A
The Table Canyon ModelIn this activity, you will build your own “table canyon” to investigatehow much of the “river” can be seen from different perspectives. Todo this activity, you will need at least three people: two viewers andone recorder.
Materials
• two tables
• two large sheets of paper
• a meter stick
• markers
• a boat (optional)
• Place two tables parallel to each other, with enough roombetween them for another table to fit.
• Hang large sheets of paper from the tables to the floor as shownin the photograph above. The paper represents the canyon walls,and the floor between the two tables represents the river.
• Sit behind one of the tables, and have a classmate sit behind the other. Each of you is viewing the canyon from a differentperspective.
• Have another classmate mark the lowest part of the canyon wallvisible to each of you viewing the canyon. The recorder shouldmake at least three marks along each canyon wall.
Notes
Be sure each student getsthe chance to sit behindthe table.
Reaching All LearnersExtension
To give students experiences with different perspectives and vision lines,have the students stand up or use different size tables.
Section A: Now You See It, Now You Don’t 3T
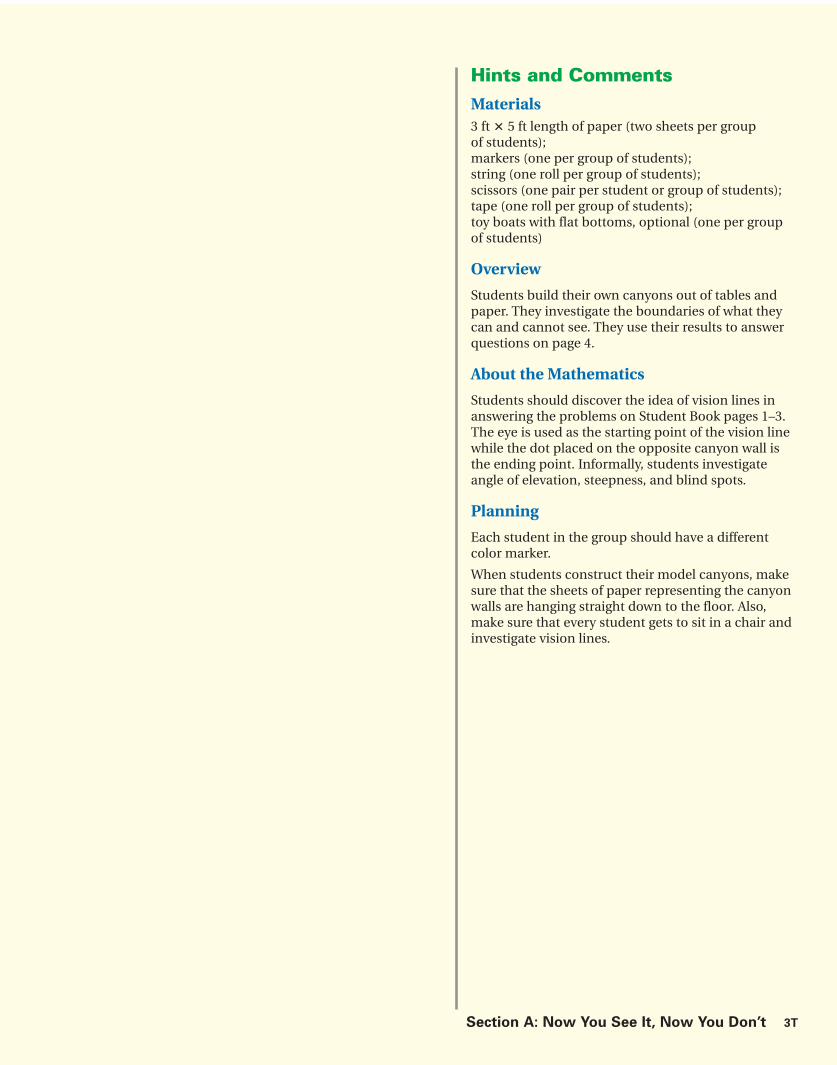
Hints and CommentsMaterials3 ft � 5 ft length of paper (two sheets per group of students); markers (one per group of students); string (one roll per group of students); scissors (one pair per student or group of students);tape (one roll per group of students);toy boats with flat bottoms, optional (one per groupof students)
Overview
Students build their own canyons out of tables andpaper. They investigate the boundaries of what theycan and cannot see. They use their results to answerquestions on page 4.
About the Mathematics
Students should discover the idea of vision lines inanswering the problems on Student Book pages 1–3.The eye is used as the starting point of the vision linewhile the dot placed on the opposite canyon wall isthe ending point. Informally, students investigateangle of elevation, steepness, and blind spots.
Planning
Each student in the group should have a differentcolor marker.
When students construct their model canyons, makesure that the sheets of paper representing the canyonwalls are hanging straight down to the floor. Also,make sure that every student gets to sit in a chair andinvestigate vision lines.

4 Looking at an Angle
Now You See It, NowYou Don’t
A
Assessment Pyramid
5
Understand the concept ofblind spot.
Measure the height of the marks from the floor with the meter stick,and make notes for a report so that you can answer the following.
4. a. Can either of you see the river below? Explain.
b. On which wall are the marks higher, yours or your classmate’s? Explain.
c. Are all the marks on one wall the same height? Explain.
d. What are some possible changes that would allow you to see the river better? Predict how each change affects what you can see.
e. Where would you place a boat on the river so that both of you can see it?
f. What would change if the boat were placed closer to one of the canyon walls?
5. Write a report on this activity describing your investigations and discoveries. You may want to use the terms visible,not visible, and blind spot in your report.
These drawings show two schematic views of the canyon. The one on the right looks something like the table canyon from the previousactivity.
Now You See It, Now You Don’tA
Notes4 If students havedifficulty, you might havethem represent the linefrom each student’s eyesto each of the three markswith string.
4e and f You may wish tohave students experimentusing a toy boat. Studentsmay put the boat in severaldifferent places. Forexample, they could put itin a visible area and moveit closer and closer towarda canyon wall until itdisappears from view.
Discuss what makes thetwo drawings similar.
Reaching All LearnersEnglish Language Learners
Be sure students understand the terms visible and blind spot. These maynot be part of their usual vocabulary.
Writing Opportunity/Parent Involvement
You may ask students to write their answers to problem 5 in their journals.Writing a report on this activity encourages students to reflect on what theydid, and gives you something to refer to during the rest of the unit.Students can share their report with their parents and have parents share ablind spot experience, which can be added to the report.

Section A: Now You See It, Now You Don’t 4T
Hints and CommentsOverviewStudents continue working on the activity from page 3and answer problems related to the activity.
Planning
Students may work on problem 4 in small groups oras a class. They may work on problem 5 individually.At the end of the activity, have students discuss theirresults with the whole class.
Comments About the Solutions
4. c. This problem can lead to an interestingdiscussion because the results may not be what students expected. Some students mayhave expected the mark in the middle to belower than those on the sides, thinking that the “shortest route” would allow them to seefurther down the wall.
Solutions and Samples
4. a. Answers will vary, depending on the sittingheight of the student, how far s/he leanstoward the edge, and the distance between thetables. A taller person or a person leaningtowards the edge has a better chance of seeingthe river.
b. Answers will vary. The marks of a taller studentwill be lower down the canyon, unless a shorterstudent leans closer to the edge of the canyon.
c. Yes. Explanations will vary. Sample explanation:
The marks on the opposite wall should all be atthe same height because the table positiondetermines how far down I can look. I can evenmove my head up and down; it doesn’t dependon the height of my eyes but on the blockedview from the table edge. If the tables were notparallel, the marks would not be at the sameheight; I would see farther down the canyonwhere the tables were farther apart.
d. Answers will vary. Sample response:
There are several things I can do to see theriver. I can sit up straight, stand up, lean forward,or widen the canyon by moving one or bothtables.
e. Answers will vary. Sample responses:
If we could both see just enough of the river tosee the middle, then we could see a boat comingdown the middle of the river.
If the boat was farther down the river, to theright or left of us, both of us could see it.
f. Answers will vary. Sample response:
If the boat moved closer to one of the canyonwalls, then whoever was sitting next to that wallwould no longer be able to see the boat. Theedge of the table blocked the view of the riverfrom the person sitting there.
5. Reports will vary. Sample report:
I was surprised that the marks I could see were allat the same height. We decide this was becausethe tables were parallel and the edge of the tableblocked views of the canyon. At first, the river was not visible at all. Then we moved the tablesfarther apart so that the opposite side of the riverwas visible. When the boat came down my side of the river, it was in my blind spot, and it didn’tmatter how far up or down the river the boat was.The boat became visible to me only when it movedto the other side of the river or far to my left orright.

5 Looking at an Angle
Now You See It, NowYou Don’t
A A
We will look more closely at that drawing on the right. Now we see itin a scale drawing of the cross-section of the canyon.
6. Is it possible to see the river from point A on the left rim? Why orwhy not?
7. What is the actual height of the left canyon wall represented inthe scale drawing?
8. If the river were 1.2 centimeters (cm) wide in the scale drawing,could it be seen from point A?
9. In the scale drawing above, the river is now 1 cm wide. Is it possible to see the river from point B? If not, which ledge is blocking your view? Explain.
ANow You See It, Now You Don’t
Scale
120 m
0.8 cm
0
B
A
Scale
120 m
1 cm
0
B
A
Notes
6 and 8 Students can usethe line on the transparencyas vision line.
7 Students may need helpusing the scale todetermine the height ofthe canyon.
9 Students may need todraw the vision lines to see which ledge isblocking the view.
Reaching All LearnersAccommodation
Have copies of the drawing for students so they can mark it as they go.Some students may wish to cut these out so they can move the canyons.
Vocabulary Building
Students may need a reminder about cross sections. Have a discussionabout when they’ve used this term in science class.
Extension
Explain why wide canyon ledges make it difficult to see the river.

Section A: Now You See It, Now You Don’t 5T
Hints and CommentsMaterialscalculators, optional (one per student);centimeter rulers (one per student);a transparency with a line of about 10 cm long
(one transparency per student)
Overview
Students study schematic representations of theGrand Canyon. Students work on problems involvingscale and ratio. The problems are related to a crosssection of the canyon.
About the Mathematics
The photograph of the Grand Canyon shown onpage 2 is being schematized more and more, first tothe drawing on page 2, then on page 4 to perspectivedrawings with less and less details, and finally to across section as shown on page 5. Students should befamiliar with drawing and interpreting cross sections.They have to realize that a vision line starts frompoint A and extends straight until it meets withsomething opaque. Students should also have a basicunderstanding of scale and ratio. They should befamiliar with the use of a ratio table.
Planning
You may discuss with students what information isrepresented in a cross section that is to scale. Studentsmay work on problems 6–9 in small groups. You maywant to discuss problems 6 and 7 in class.
Comments About the Solutions
6.–9.Encourage students to use a ratio table to solvethe scale problems. You may also wish to havethem use a calculator.
8. Students may make a scale drawing representinga canyon with a wider river.
Solutions and Samples
6. No. Explanations will vary. Sample explanation:
It is not possible to see the river from point A,because when I use a ruler as a vision line, it hitsthe opposite canyon wall, as shown below. Theresult is the same as in the Table Canyon Activity.
7. The actual height is 720 meters. Point A is sixcentimeters above the river in the model. Everycentimeter in the drawing represents 120 meters.In a ratio table:
8. Yes. More of the river can be seen. A vision line toat least part of the river is now clear. Students maycheck by measuring how far the vision line wouldmeet the river level from the left wall. Thisdistance is less than 1.2 cm.
9. No. The first ledge below point B blocks the line ofsight, as shown below.
AB
A
1.2 cm
B
Drawing
Reality
1 cm
120 m
� 6
6 cm
720 m
ABLedge bloding
the view

6 Looking at an Angle
Now You See It, NowYou Don’t
A
Assessment Pyramid
10
Understand the concept ofblind spot.
Picture yourself in a small rowboat rowing toward a ship that is tiedto a dock. In the first picture, the captain at the helm of the ship is ableto see you. As you get closer, at some point the captain is no longerable to see you.
10. Explain why the captain cannot see you in the fourth picture.
Now You See It, Now You Don’tA
Ships Ahoy
The captain’s height and position in the ship determine what thecaptain can and cannot see in front of the ship. The shape of the ship will also affect his field of vision. To find the captain’s field ofvision, you can draw a vision line. A vision line is an imaginary linethat extends from the captain’s eyes, over the edge of the ship, and to the water.
A. B.
C. D.
Notes
10 After answering thisproblem, ask students howthis relates to the canyoncontext.
Students may need helpmaking sense of the terms‘‘vision line’’ and ‘‘field ofvision’’.
Reaching All LearnersIntervention
If students have difficulty, you might remind them of the Canyon TableModel Activity, where they moved a boat into a blind spot on the water bybringing it closer to a canyon wall.
Extension
Ask students, Is it true that if you cannot see the captain, the captain cannotsee you? (This statement is true.) However, it is possible that you are able tosee the captain’s head sticking out but you cannot see the captain’s eyes.In that case, the captain cannot see your eyes. So if you cannot see thecaptain’s eyes, the captain cannot see your eyes. For this reason, in traffic,people often try to make eye contact with other drivers.

Section A: Now You See It, Now You Don’t 6T
Hints and CommentsOverviewStudents investigate the blind spot of a captainstanding on the bridge of a ship. The concept of avision line is made explicit.
About the Mathematics
Again we are dealing with a person looking at somethingwith his or her view partially obstructed by an object(in this case the bow of the boat). On the next page,students will draw vision lines, measure the angle thevision line makes with the water, and draw conclusionsabout the captain’s blind spot. Later in this section,blind spot will be referred to as the “blind area.”
Planning
Before students begin problem 10, you may want tointroduce some nautical terms, such as bow, stern,bridge, crew, and sail. Students may work on problem10 in small groups.
Did You Know?
A ship has two main sections—the front, or bow, andthe back, or stern. A ship is navigated from a raisedplatform called the bridge. Some ships have a sail,which is a piece of fabric that, with the wind, propelsthe ship through water. The people who work on aship are the crew.
Solutions and Samples
10. Explanations will vary. Sample explanations:
I cannot see the captain, so he cannot see me.
As I row, I move closer to the ship. It’s just like inthe Table Canyon Model Activity. When the boatwas close to my side of the canyon, I couldn’t seeit. When I get closer to the ship, the captaincannot see me because the ship’s bow is blockinghis view.

7 Looking at an Angle
Now You See It, NowYou Don’t
A
Assessment Pyramid
12c
Understand the relationshipbetween the angle and theheight-to-distance ratio.
A
11. For each ship shown on Student Activity Sheet 1, draw a visionline from the captain, over the front edge of the ship, to the water. Measure the angle between the vision line and the water.(A star marks the captain’s location.)
12. Compare the ships on Student Activity Sheet 1.
a. On which ship is the captain’s blind area the smallest? Explain.
b. How does the shape of the ship affect the captain’s view?
c. How does the angle between the vision line and the wateraffect the captain’s view?
Suppose that you are swimming in the water and a large boat iscoming toward you. If you are too close to the boat, the captain maynot be able to see you! In order to see a larger area of the water, acaptain can travel in a zigzag course.
13. Explain why the captain has a better chance of seeing somethingin front of the boat by traveling in a zigzag course.
Now You See It, Now You Don’t
swimmer
swimmer
Straight
Course
Zigzag
Course
Ship C
Captain
Ship D
Captain
Captain
Ship A
Ship B
Captain
Notes
Students must know how touse a protractor to completethis activity. Some reviewmay be needed.
11 Rulers are necessaryfor drawing straight visionlines. Students should alsoextend the bottom of theboats to help measure theangles. Also, if studentsreason that there are otherobstacles on the boat thatare in the way, such astowers, tell them that thecaptain can see past those.
13 Students may maketop-view or side-viewdrawings or use words to explain why the captainhas a better chance ofseeing the swimmer bytraveling a zigzag course.Students should refer tovision lines and blindspots.
Reaching All LearnersIntervention
If students have difficulty, you might have them model the situation witha toy boat. Have students use a string to model the vision line.
Accommodation
Some students may need an enlarged copy of the Straight and Zigzag Courses.

Section A: Now You See It, Now You Don’t 7T
13. Explanations may vary. Sample response:
By zigzagging, the captain is no longer lookingover the bow of the boat, but over the side.The side of the ship is closer to the bridge, so thecaptain’s vision line over the side of the ship issteeper and provides a better view than the visionline over the bow. The drawings below show why:
If the captain sails straight ahead, the swimmer isin the boat’s blind spot.
If the captain turns the boat, the swimmer is outof the blind spot.
Solutions and Samples
11.
The angles of the vision lines are approximately as follows:
Ship A: 6° Ship C: 10°
Ship B: 3° Ship D: 23°
12. a. The captain of Ship D has the smallest blindarea and the best view.
b. Explanations will vary. Sample explanation:
On Ship D, the captain’s bridge is close to thebow and very high. The captain’s vision lineis steeper than those of the captains on theother ships.
On Ship B, the captain’s bridge is at the back ofthe ship. The vision line extends a long way andis more horizontal than those of the captainson the other ships. The captain of Ship B hasthe biggest blind spot and the worst visibility.
c. Explanations will vary. Sample explanation:
On Ship D, the angle between the vision lineand the water is large, and the blind spot issmall.
On Ship B, the angle between the vision lineand the water is very small, and the blind spotis large. When the angle is large, there is a smallblind spot and good visibility, and when theangle is small, there is a large blind spot andpoor visibility.
Hints and CommentsMaterialsStudent Activity Sheet 1 (one per student); straightedges (one per student); compass cards or protractors (one per student);string, optional (one roll per group); toy boats with flat bottoms, optional (one per group)
Overview
Students draw vision lines and measure the anglebetween the vision line and the water. They drawconclusions about the size of the captain’s field ofvision. Students also investigate how sailing a zigzagcourse changes the captain’s field of vision.
Planning
Students may work on problems 11 and 12 in smallgroups. Discuss students’ answers in class. You mightreview how to measure angles with a compass card,which is introduced in the unit Figuring All the Angles.Students may work on problem 13 individually or insmall groups. This problem is optional. If time is aconcern, it may be omitted or assigned as homework.If you assign problem 13 as homework, be sure todiscuss students’ answers in class.
Comments About the Solutions
11. Students’ angle measurements will vary due toerrors in measurement. Accept responses that areclose to the given angle measurements in theSolutions column.
Captain
Ship A
Ship B
Captain
Ship C
Captain
Ship D
Captain
River
Swimmer
Swimmer
River

8 Looking at an Angle
Now You See It, NowYou Don’t
A
Assessment Pyramid
15
Understand the concept ofblind spot.
For this activity, each group of students needs a piece of string and a toy boat. The boat can be made of either plastic or wood, but it must have a flat bottom.
Line up all the boats in the front of the classroom. For each boat,assign a number and determine the captain’s location.
14. Without measuring, decide which boat has the largest blind spot and which has the smallest blind spot. Explain your decisions.
When comparing blind spots, you have to take into account the size of the boat. A large boat will probably have a large blind spot, but you must consider the size of the blind spot relative to the size of the boat.
In your group, use the following method to measure your boat’s blind spot.
Place your boat on the Student Activity Sheet 2 graph paper. Trace the bottom of the boat. Attach a piece of string to the boat at the place where the captain is located. The string represents the captain’s vision line.
Using the string and a pencil, mark the spot on the graph paper where the captain’s vision line hits the water. Make sure the vision line is stretched taut and touches the edge of the boat.
Mark several places on the graph paper where the captain’s vision line hits the water so that you can determine the shape of the blind spot (the captain looks straight ahead and sideways). If the graph paper is not large enough, tape several pieces together. Draw the blind spot on the graph paper.
Find the area of the blind spot. Note: Each square on the graph paper is one square centimeter.
15. Make a list of the data for each boat. Decide which boat has the largest blind spot relative to its size and which has the smallest blind spot relative to its size.
Notes
Before the activityMake sure that studentsunderstand what a blindspot is (the area of waterthat the captain cannot see).You may want to have aclass discussion about areaand how to determine thearea of partial squares.Remind students to thinkof strategies they used inthe unit Reallotment.
14 Discuss and makepredictions before doingthe activity.
15 Students should realizethat they must make a faircomparison. They mustdetermine which boat hasthe largest or smallestblind spot relative to itssize. A chart would behelpful. See solutions.
Reaching All LearnersIntervention
Add a column that would show the ratio of the area of the boat to the areaof the blind spot to the chart for problem 15. Convert the ratios to decimals.What would a ratio of 1 mean? Students may have an easier time if it’sreferenced as a ratio of one, equal to one, or greater than one.
Accommodation
Read through the activity and prepare a bullet summary of the directions.

Section A: Now You See It, Now You Don’t 8T
Hints and CommentsMaterialsStudent Activity Sheet 2 (several copies per group); string (one roll per group); scissors (one per student);tape (one dispenser per group); toy boats with flat bottoms (one per group)
Overview
Students estimate the relative sizes of the blind spotsof different toy boats. They check their estimates bymeasuring the blind spots. Students make a list of thedata for the boats and draw conclusions about the sizesof the blind spots relative to the sizes of the boats.
Planning
Students may work on problems 14 and 15 in smallgroups. The activity will take an entire class period.The activity will work better if students have different-sized boats. If boats are not available, try using cars orother toy vehicles. Discuss students’ results.
Comments About the Solutions
14. You may wish to discuss with students whetherthe water underneath the boat should be consideredpart of the blind spot as well. (In the steps listedin the Student Book, the area underneath the boatis not considered part of the blind spot.)
Also, it must be clear in what direction the captainis looking. It is possible to have the captain look inall directions, but you may want to narrow thisdown to have the captain look straight ahead andsideways only (the steps listed in the Student Bookare based on the assumption that the captain looksonly straight ahead and to the side.)
• Look at the ratio between the area of the blindspot and the area of the boat as shown above.For instance, for Boat 1 the ratio is 1.25:1. Inother words, the area of the blind spot is 1.25times as big as the area of the boat. Thisapproach is basically the same as the first, butthe reasoning is slightly different.
Solutions and Samples
14. Estimates and explanations will vary. Studentsmay base their explanations on the followingfeatures.
• The position of the bridge—a captain at theback of the boat will probably see less.
• The height of the bridge—a high bridge willimprove visibility.
• The height of the bow or side of the boat—ifthe obstacle blocking the captain’s view is high,the captain will see less.
• Some boats may have other obstacles besidesthe bow that block the captain’s view.
15. Tables and rankings will vary. Students should givetheir data in square centimeters. Sample table:
In the sample table above, Boats 1 and 4 have blindspots that are similar in size. Students should lookat the size of the boat. Boat 1 is much smaller,which means it has a relatively larger blind spot.
Two possible strategies to make the comparisons:
• Divide both the area of each boat’s blind spotand the area of the boat by the area of the boat.As a result, the area of the boat becomes 1,making it possible to compare the boats fairly,as shown below.
Encourage students to use a calculator.Discuss with students how many decimalpoints they need and how to round off.
BoatArea of theBlind Spot(in cm2)
Area of theBoat (in cm2)
1
2
3
4
5
6
7
8
55
91
94
56
844
140
237
754
44
68
64
192
176
136
60
56
BoatArea of Boat
(in boat units)
Area of
Blind Spot
(in boat units)
1
2
3
and so on
1.25
1.34
1.47
1
1
1

9 Looking at an Angle
Now YouSee It, NowYou Don’t
A
Assessment Pyramid
16
17
18
Use ratios to solve problemsinvolving steepness, makerelative comparisons, andunderstand vision angles.
Notes16 Students should makea fair comparison byrelating the length of theblind area to the length ofthe car. When discussing,have students measurehow many car lengths longthe blind spot is. This willmake problem 17 easier tounderstand.
18 Clarify that the visionline is from the driver’seyes looking up from thetop of the windshield.
19 You may want todiscuss students’ answersin class. Check students’work for appropriatemathematical language,appropriateness of thepictures, and originality ofcontext. In most cases, atop-view drawing will notbe appropriate because itshows in which directionyou are looking, but doesnot indicate the area youcannot see.
Reaching All LearnersIntervention
If students are confused about how to start problem 16, ask them to pointout the part of the road that cannot be seen by the driver.
Extension
How are the blind spots in cars influenced by the height of the drivers?
Parent Involvement
Use problem 19 as homework for students to discuss with their parents.Challenge them to develop a situation other than one discussed in class.
You might have students measure the length of the blind area of theirfamily car, a bicycle, or a motorcycle. All the data can then be comparedin class.
A
This photograph is of a 1958Pontiac Star Chief. This car is5.25 m long.
Now You See It, Now You Don’t
Cars and Blind Spots
Here is a side view of the car with vision lines indicating theblind area.
Today cars are designed so that the blind area in front of the car ismuch smaller. The car shown below is a 1997 Buick Skylark that is4.7 m long. Notice how the vision line touches the hood of this car.
16. Find the length of road in front of each car that cannot be seen bythe driver.
17. Which car has the longest relative blind spot?
18. What does the vision line that extends upward from each carindicate? Why is it important that this vision line be as closeto vertical as possible?
19. Describe a situation from your daily life which involves a blindspot. Include a drawing of the situation with the blind spot clearlyindicated.

Section A: Now You See It, Now You Don’t 9T
Hints and CommentsMaterialsscissors (one pair per student);8 1__
2 " � 11" paper (one sheet per student)
Overview
Students compare the lengths of the blind areas oftwo different cars. Students also describe a situationfrom their daily lives involving a blind spot.
About the Mathematics
The idea of a vision angle is implied in problem 18.There are an infinite number of vision lines you candraw between objects that define the field of vision.The crucial vision lines for the car indicate what thedriver can see in front of the car. Both vision linesform an angle.
Planning
Students may work on problems 16–19 individually.Problems 16–18 are optional. Discuss students’answers in class.
The last example in the Solutions column shows thedrawings of a student who is struggling with thisconcept. The student added the side and front viewsonly after feedback from the teacher.
Solutions and Samples
16. Pontiac 10 m, Buick, 3.5 m. Estimates can vary.Students may use a variety of strategies to findtheir answers. Sample strategy:
Cut a strip of paper and use it to mark the lengthof the Pontiac, bumper to bumper. The length ofthe Pontiac is 5.25 meters, so the length representedon the strip of paper must also be 5.25 meters.The strip fits in the length of the blind area almosttwo times. Therefore, the length of the blind areamust be about 10 meters, as shown here.
Mark the length of the Buick on another strip ofpaper. The length represented on the strip is 4.7meters. The strip fits in the length of the blindarea less than once. So, the length of the blindarea is about 3.5 meters, as shown here.
17. The Pontiac. The blind area of the Pontiac isabout twice as long as the car. The blind area ofthe Buick is less than the length of the car. So thePontiac has a relatively longer blind spot.
18. Answers will vary. Sample response:
This vision line indicates what the driver can andcannot see when looking up. It is important thatthis line be as steep as possible so that the drivercan see high traffic lights.
19. Answers will vary. Sample responses:
• If I want to see the cat, I cannot see it if I’mstanding behind the chair, because the chair isbetween us.
5.25 m 5.25 m 5.25 m
3.5 m 4.7 m
• When I’m working at my desk, and I look sideways,there is a large area of the floor I cannot see.
• When I wake up in the morning, I cannot see thefloor next to my bed because the edge of my bedis blocking my view.
vision line
blind spot
top view side view front view

10 Looking at an Angle
Now You See It, NowYou Don’t
A
Notes
Summary
Have students share theirresponses to problem 19with class. When readingthe Summary, refer tosituations discusseddealing with these terms.
Reaching All LearnersVocabulary Building
Be sure students recognize that the horizon is horizontal!
Now You See It, Now You Don’t
When an object is hidden from your view because something is in the way, the area that you cannot see is called the blind area orblind spot.
Vision lines are imaginary lines that go from a person’s eyes to anobject. Vision lines show what is in a person’s line of sight, and theycan be used to determine whether or not an object is visible.
In this section, you used vision lines to discover that the ColoradoRiver is not visible in some parts of the Grand Canyon. You also usedvision lines to find the captain’s blind area for ships of various sizes.
These drawings on Student Activity Sheet 3 show three different waysa ship’s bridge, or steering house, can be positioned. The dot on eachboat is the front of the boat.
A

Section A: Now You See It, Now You Don’t 10T
Hints and CommentsOverviewStudents read the Summary, which reviews the mainconcepts covered in this section. Students use theCheck Your Work problems as self-assessment.The answers to these problems are also provided onpages 61 and 62 of the Student Book. After studentscomplete Section A, you may assign as homeworkappropriate activities from the Additional Practicesection, located on Student Book page 56.

11 Looking at an Angle
Now YouSee It, NowYou Don’t
A
Assessment Pyramid
1, 2
Assesses Section A Goals
Notes
Reaching All LearnersExtension
If the best spot for the bridge is near the front of the boat, what happenswhen the boat moves in reverse?
1. a. Draw the vision lines to show the blind spots of the captain ineach of the three cases.
b. Measure the angle between the vision line and the horizon ineach case.
c. How does the blind spot at the back of ship change if youmove the bridge forward?
Vision lines, such as the ones you drew on Student Activity Sheet 1,do not show everything that captains can and cannot see. For example,some ships’ bridges, the area fromwhich the captain navigates theship, are specially constructed to improve the captain’s view. Thecaptain can walk across the bridge, from one side of the boat to theother side, to increase his or her field of vision.
Below is a photograph of a large cruise ship. Notice how the bridge,located between the arrows, has wings that project out on each sideof the ship.
2. Explain how the wings ofthe bridge give the captaina better view of the waterin front of the ship.

Section A: Now You See It, Now You Don’t 11T
Hints and CommentsMaterialsstraightedges (one per student); Student Activity Sheet 3 (one per student); compass cards or protractors (one per student)
Overview
Students draw vision lines and measure the anglebetween the vision line and the water. They drawconclusions about the size of the captain’s blindspot. Students also study a boat with a wing-likebridge to improve the captain’s view.
Planning
These problems may be used for studentself-assessment.
Solutions and SamplesAnswers to Check Your Work
1. a.
b. 8°–10°
20°
30°
c. The blind spot gets smaller in front but largerin back.
2. The captain can walk to the ends of the wings andincrease the area he or she can see directly infront and on the sides of the ship. You can make adrawing showing how the blind spot moves as thecaptain walks from one side of the bridge to theother, as shown here.
Area I indicates the blind spot when standing onthe left side of the bridge.
Area II indicates the blind spot when standing inthe middle of the bridge.
Area III indicates the blind spot when standingon the right side of the bridge.
I
IIIII

12 Looking at an Angle
Now You See It, NowYou Don’t
A
Assessment Pyramid
FFR
3
Assesses Section A Goals
Section
Hydrofoils have fins that raise the boat out of the water when ittravels at high speeds.
3. Make two side-view drawings of a hydrofoil: one of the hydrofoilin the water traveling at slow speed and one of it rising out of thewater and traveling at high speed. Use vision lines to show thedifference between the captain’s view in each drawing. (You maydesign your own hydrofoil.)
When you approach a town from afar, you sometimes see a tall toweror building. As you move closer to the town, the tall object seems todisappear. Make a drawing with vision lines to show why the tower orbuilding seem to disappear when you get closer to town.
A
Reaching All LearnersIntervention
If students have difficulty with problem 3, you might prepare twotransparencies: one showing a hydrofoil and a vision line and one showingthe water level. Moving the transparency with the hydrofoil up from thewater will help students see what happens: the vision line stays the same,the angle between the vision line and the water stays the same, but theblind spot increases.
Notes
For Further Reflection
You may need to encouragestudents to get started bydrawing a sketch of a townwith a tall building andsome smaller buildings aswell. Remind them tochoose an appropriate view(top, side, or front) to drawthe situation in order toexplain the phenomenon of the disappearing tallbuilding. Tell students it isokay if they need severaltrial sketches.

Section A: Now You See It, Now You Don’t 12T
Hints and CommentsMaterialsstraightedges (one per student); blank transparencies, optional (two per class)
Overview
Students study a hydrofoil that is lifted from the waterat high speeds.
About the Mathematics
Students imagine themselves on the bridge of theboat to discover the area the captain cannot see infront of the boat. Sketching the situation can behelpful. Students may first think that their view willimprove as the boat lifts out of the water, since thiswas the case with the previous boats: a boat with a tallbridge gives the captain a better view. However, it isnot just the captain that is lifted, but also the wholeboat, causing the bow to block even more of the areain front of the boat.
Planning
Problem 3 may be used for students’ self-assessment.
Solutions and Samples
3. Your drawings may differ from the onesshown here.
The higher the ship, the larger the captain’sblind spot.
For Further Reflection
Answers will vary. Student drawings should includevision lines. A sample side-view drawing:
A person is moving toward a tall tower. The lines withnumbers represent vision lines from the person lookingat the top of the tall tower. Vision lines 1, 2, and 3 showthat from those positions the person can still see thetop of the tower; vision line 4 indicates that the personat that point cannot see the top of the tower anymore.There is another building blocking the view.
Person
Tall Tower
I I I I
1
2 3
4

13A Looking at an Angle Teachers Matter
Teachers MatterB
Day 5: Shadows and the Sun Student pages 13–15
INTRODUCTION Problems 1 and 2 Investigate changes in shadows cast by the sun.
CLASSWORK Problems 3–8 Create a table and scale drawings relatingthe direction of the sun, the length of shadows, and the angle of the sun’s raysfor different times of the day.
HOMEWORK Problem 9 Describe the changes in the length of ashadow and the angle of the sun’s raysfrom season to season.
Day 6: Shadows and the Sun (Continued) Student pages 16–18
ACTIVITY Activity, pages 16 and 17 Conduct an experiment to compare thelength and angle of shadows from the sunat different times throughout the day.
HOMEWORK Problems 10–12 Analyze the results of the shadows fromthe sun experiment.
Day 7: Shadows Cast by the Sun and Lights Student pages 18–21
INTRODUCTION Review homework. Review homework from Day 6.
CLASSWORK Problems 13–16 Sketch and describe differences betweenshadows caused by a nearby light sourceand the sun.
ACTIVITY Activity, page 21 Begin an investigation of blind areas for a model of a tugboat.
Section Focus
The instructional focus of Section B is to:
• explore the movement of the sun throughout the day and for different seasons;
• investigate the length of shadows caused by the sun, in relation to the steepnessof the sun’s rays;
• measure angles;
• use ratios to solve problems involving light rays and shadows;
• construct shadows in two- and three-dimensional representations;
• compare shadows caused by the sun with shadows caused by a nearby lightsource; and
• discover how vision lines are similar to light rays.
Pacing and Planning

Teachers Matter Section B: Shadows and Blind Spots 13B
Teachers Matter B
Day 8: A Shadow is a Blind Spot Student pages 21–24
ACTIVITY Activity, page 21 Complete the investigation of blind areasfor a model of a tugboat.
CLASSWORK Check Your Work Student self-assessment: Identify and drawblind spots and shadows cast by the sun.
HOMEWORK For Further Reflection Define key terms from Sections A and B.
Day 9: Summary
INTRODUCTION Review Review classwork and homework fromDay 9.
ASSESSMENT Quiz 1 Assessment of Section A and B Goals.
Additional Resources: Additional Practice, Section B, Student Book page 57
MaterialsStudent Resources
Quantities listed are per student.
• Student Activity Sheets 4–9
Teachers Resources
No resources required
Student Materials
Quantities listed are per pair of students, unlessotherwise noted.
• Angle measure tools constructed by students onStudent page 16
• Construction paper (one sheet per student)
• Glue
• Magnetic (directional) compass
• Metric measuring tape
• Protractor and/or compass card
• Scissors
• Stick, 0.7 meter long
• Stick, 1.2 meters long
• Straightedge or ruler
• String (one roll per class)
• centimeter cubes (one per pair of students)
* See Hints and Comments for optional materials.
Learning Lines
Spatial Sense
The mathematical content of this section ispresented in the context of shadows. A typical realworld context becomes a rich source for studentsto develop geometrical concepts, contributing totheir spatial sense. Students have undoubtedlyencountered real life phenomena concerning lightand shadow earlier. Now they learn to discussthese phenomena in mathematical terms, learningto reason about them and draw conclusions basedon mathematical representations, visualizationsand systematic exploration.
At the End of This Section:Learning Outcomes
Students understand how shadows are similarto blind spots. They can construct shadows, bothcaused by the sun or by a nearby light source,in two- and three-dimensional representations.Students develop a broader and deeper under-standing of the concepts of steepness and angleof elevation.

13 Looking at an Angle
Shadows andBlind Spots
B
Notes
Start the class with adiscussion of shadows and sunlight. Ask studentswhat they know abouttopics such as:
• the relation betweenshadows’ directions andthe direction the sun isshining from;
• the relation betweenthe length of a shadowand the object casting theshadow;
• the sun’s movement inthe sky during the day;
• the varying length ofshadows during a day, orduring a year; and so on.
• the difference in sunshadows for those livingin the Northern andSouthern hemispheres.
1 Have graph paperavailable for students.Have them show answerson the overheard.
2 Discuss why the 9 A.M.shadow is not 2 meterslong. (The diagonal islonger than a side of asquare.)
Reaching All LearnersIntervention
Talk about where the directions (east, west, north, and south) wouldbe located on the picture in the book. This will help students answerproblem 2.
Accommodation
Students can use cm graph paper to draw the top views of the shadows at6, 9, and 12 A.M. If students have difficulty with this activity, complete thisusing a copy of graph paper on a transparency. Then students can draw theshadows for problem 1 on the same paper.
When the sun is shining, it casts shadows. The length of the shadowvaries throughout the day. Sometimes shadows are very short (whenthe sun is “high”), and sometimes they are very long (when the sun isrising or setting).
Here are three sketches of a tree and its shadow in the early morning,mid-morning, and noon.
1. Sketch how the pictures would look at 3.00 P.M. and 6.00 P.M.
The tree is two meters high. The tiles are one meter wide.
2. At what time do you think the tree’s shadow will be two meterslong?
The sun rises in the east.
3. Indicate east, west, north, and south in your sketch.
BShadows and Blind Spots
Shadows and the Sun
6:00 A.M. 9:00 A.M. 12:00 NOON

Section B: Shadows and Blind Spots 00T
Hints and CommentsMaterialslj;sakfj
Solutions and Samples Hints and CommentsMaterialscentimeter graph paper, optional (one sheet perstudent)
Overview
Students start their investigation of shadows.The first part of this section deals with shadowscaused by the sun.
About the Mathematics
A blind spot (or blind area) is a region not seen bysomeone; a shadow (or shaded area) is a region notreached by light rays. In both cases, there is an objectthat is blocking the “view.” In the context of trees,vision lines cannot go through a tree, and neither canlight rays.
Planning
You may want to start this section with a classdiscussion about shadows caused by the sun.This will give you an opportunity to investigatestudents’ informal knowledge of shadows. Studentswill have gathered this knowledge from daily lifeobservations, but it is likely they have not systematizedwhat they know nor investigated their observationsfrom a mathematical viewpoint. Before starting thissection, students can observe the length and directionof shadows in relation to the sun’s position in the sky.
Comments About the Solutions
1.–3.Encourage students to closely examine the threesketches of the tree’s shadow, focusing on thechanges in shadow length and direction. Theyshould also realize that the sun is shining fromthe direction opposite the direction the shadowpoints at. You also may need to remind studentsthat the sun rises in the east, sets in the west, andtravels across the southern part of the sky.
2. An estimation based on the three given sketchesis sufficient.
Solutions and Samples
1. At 3 P.M.:
At 6 P.M.:
2. The shadow will be around 2 meters at around10 A.M. (and around 2 P.M.).
3.
3:00 P.M.
6:00 P.M.
E
W
S
N
Section B: Shadows and Blind Spots 13T
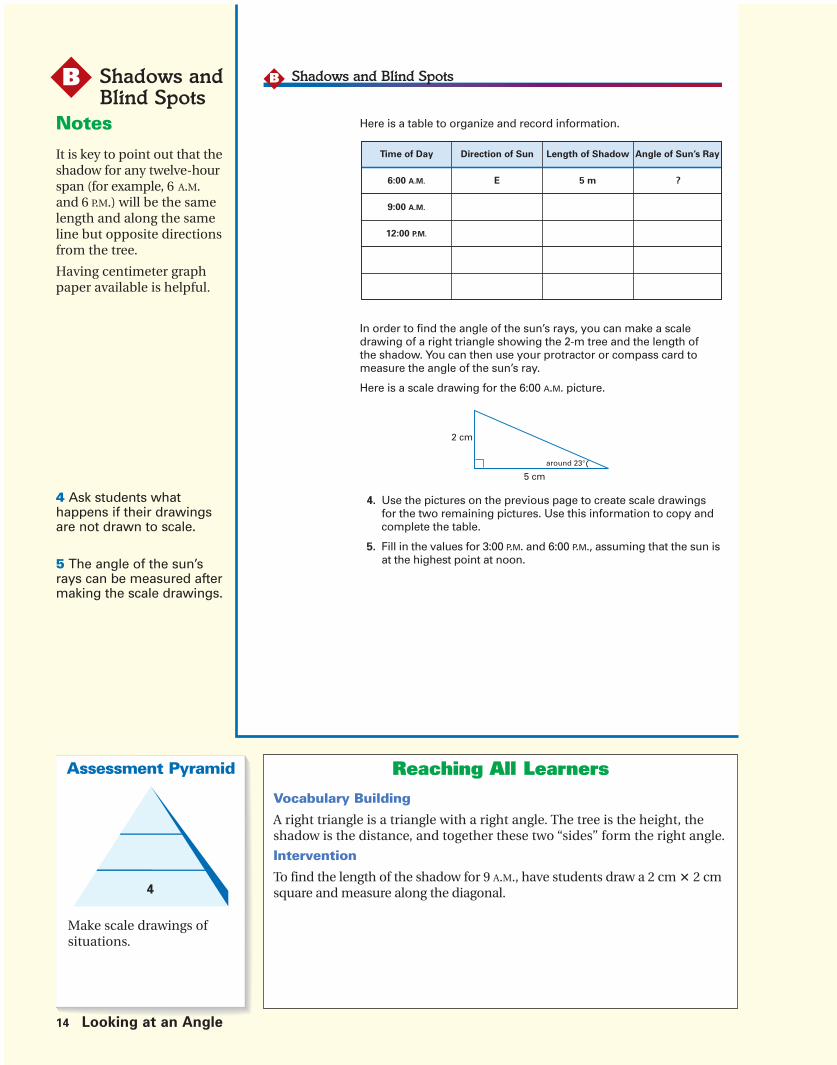
14 Looking at an Angle
Shadows andBlind Spots
B
Assessment Pyramid
4
Make scale drawings ofsituations.
Notes
It is key to point out that theshadow for any twelve-hourspan (for example, 6 A.M.and 6 P.M.) will be the samelength and along the sameline but opposite directionsfrom the tree.
Having centimeter graphpaper available is helpful.
4 Ask students whathappens if their drawingsare not drawn to scale.
5 The angle of the sun’srays can be measured aftermaking the scale drawings.
Reaching All LearnersVocabulary Building
A right triangle is a triangle with a right angle. The tree is the height, theshadow is the distance, and together these two “sides” form the right angle.
Intervention
To find the length of the shadow for 9 A.M., have students draw a 2 cm � 2 cmsquare and measure along the diagonal.
Here is a table to organize and record information.
In order to find the angle of the sun’s rays, you can make a scaledrawing of a right triangle showing the 2-m tree and the length of the shadow. You can then use your protractor or compass card tomeasure the angle of the sun’s ray.
Here is a scale drawing for the 6:00 A.M. picture.
4. Use the pictures on the previous page to create scale drawingsfor the two remaining pictures. Use this information to copy andcomplete the table.
5. Fill in the values for 3:00 P.M. and 6:00 P.M., assuming that the sun isat the highest point at noon.
Shadows and Blind SpotsB
around 23°
5 cm
2 cm
Time of Day Direction of Sun Length of Shadow Angle of Sun’s Ray
6:00 A.M. E 5 m ?
9:00 A.M.
12:00 P.M.
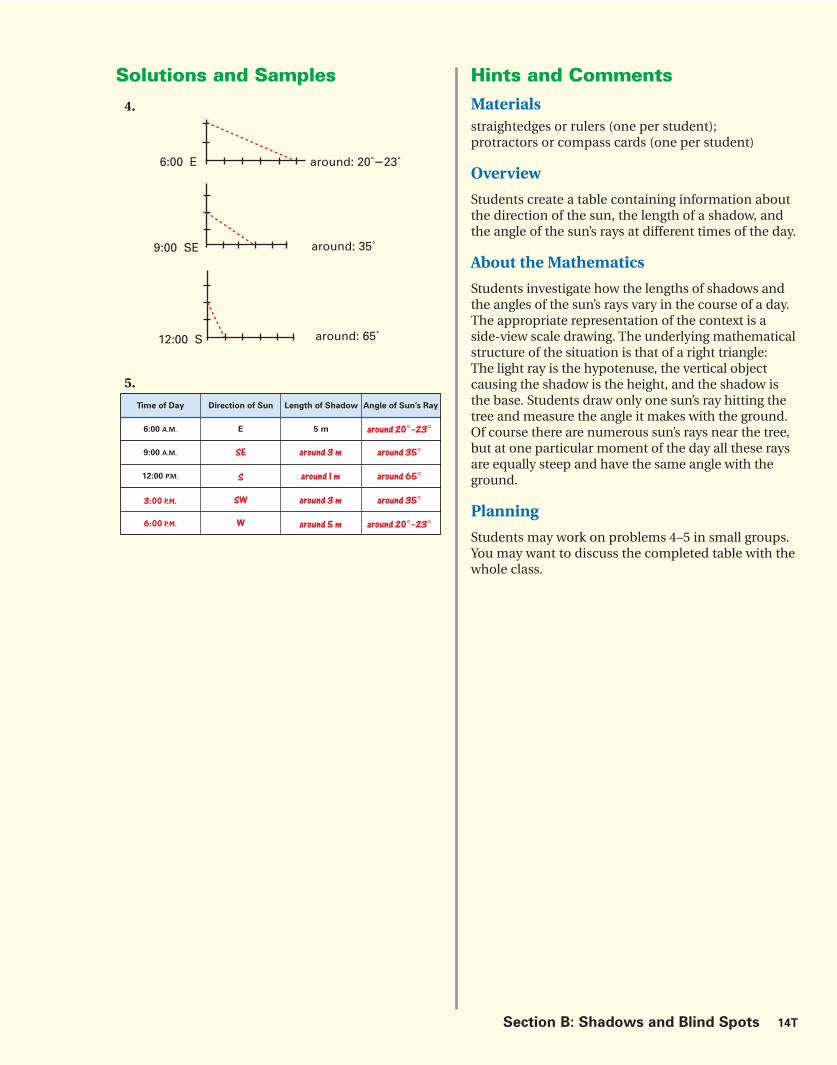
Section B: Shadows and Blind Spots 14T
Hints and CommentsMaterialsstraightedges or rulers (one per student);protractors or compass cards (one per student)
Overview
Students create a table containing information aboutthe direction of the sun, the length of a shadow, andthe angle of the sun’s rays at different times of the day.
About the Mathematics
Students investigate how the lengths of shadows andthe angles of the sun’s rays vary in the course of a day.The appropriate representation of the context is aside-view scale drawing. The underlying mathematicalstructure of the situation is that of a right triangle:The light ray is the hypotenuse, the vertical objectcausing the shadow is the height, and the shadow isthe base. Students draw only one sun’s ray hitting thetree and measure the angle it makes with the ground.Of course there are numerous sun’s rays near the tree,but at one particular moment of the day all these raysare equally steep and have the same angle with theground.
Planning
Students may work on problems 4–5 in small groups.You may want to discuss the completed table with thewhole class.
Solutions and Samples
4.
5.
6:00 E around: 20˚�23˚
around: 35˚9:00 SE
around: 65˚12:00 S
Time of Day Direction of Sun Length of Shadow Angle of Sun’s Ray
6:00 A.M. E
SE around 3 m
around 1 m
around 3 m
around 5 m
around 35°
around 20°–23°
around 65°
around 35°
around 20°–23°
S
SW
W
5 m
9:00 A.M.
12:00 P.M.
3:00 P.M.
6:00 P.M.

[Create tech art. Two row table with the following headers]
Season Building Height Shadow Length Ratio of Shadow: Building
Angle
Overflow
15 Looking at an Angle
Shadows andBlind Spots
B
Assessment Pyramid
9
6
Understand the ratiobetween the lengths of anobject and its shadow causedby the sun. Measure angles.
Notes
6 Before completing thisproblem talk about thedistance being half theheight of the building. Giveexamples: If the building is15 m, the shadow wouldbe 7.5 m. Hint to get started:measure the building.
7 When drawing theseright triangles, the largerthe drawing, the moreprecise the anglemeasurement will be.
7a and 8a Have studentsshare drawings on theoverhead.
Reaching All LearnersIntervention
To help students complete the problems on this page, have students begina table with the following column headings:
Advanced Learners
Ask, Why is there a change in shadow length with the change of seasons? (In the Northern Hemisphere, the sun is lower in the sky throughout theday in the winter and higher in the sky in the summer.)
Season AngleBuilding
Height
Shadow
Length
Ratio of
Shadow:Building
Around noon during the winter, the length of this building’s shadow istwo times the height of the building.
7. a. Draw a side view of the building and its shadow around noonduring the winter.
b. Measure the angle between the sun’s rays and the ground.
Around noon during the spring, the angle between the sun’s rays andthe ground is 45°.
8. a. Draw a side view of the building and its shadow around noonduring the spring.
b. If the building is 40 m tall, how long is its shadow?
9. Describe the changes in the length of the shadow and the angleof the sun’s rays from season to season.
BShadows and Blind Spots
shadow
sun rays
The lower the sun is, the longer theshadows that are cast. The height of thesun not only depends on the time of theday, but also on the season. Shown hereis a side view of a building around noonduring the summer.
The length of the building’s shadow isone-half the height of the building.
6. Measure the angle between thesun’s rays and the ground.
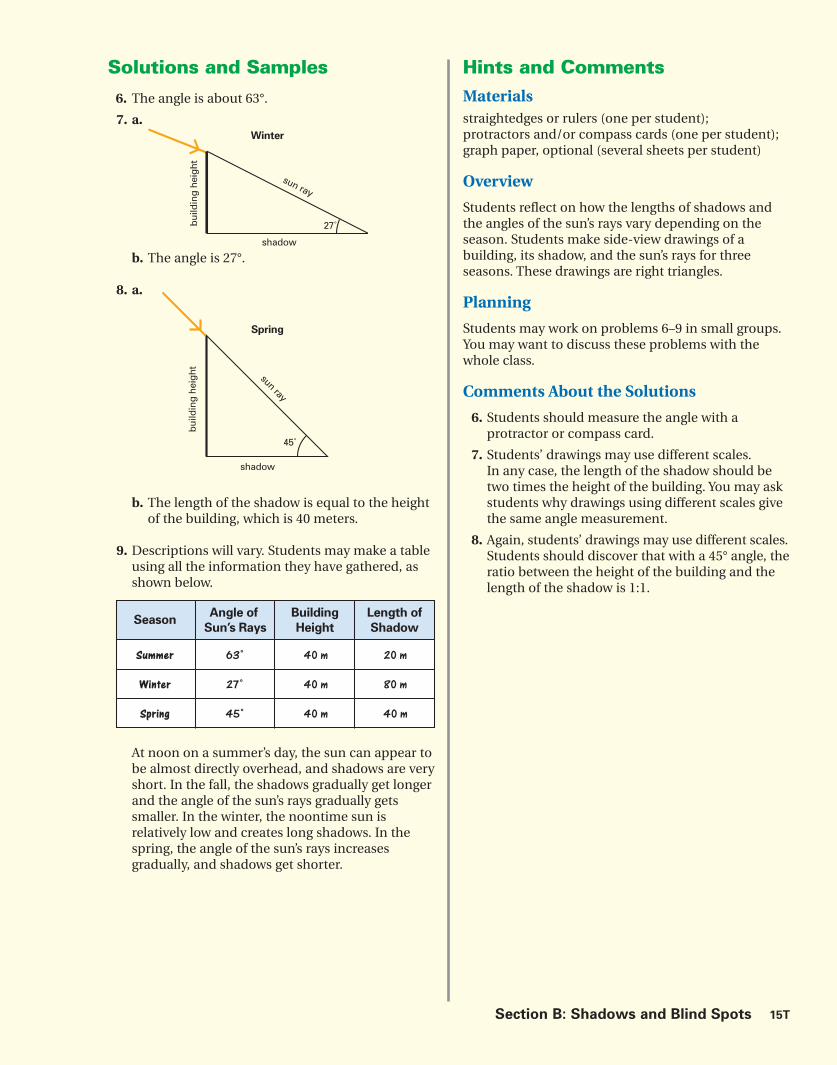
[Essential. Pick up art from original TGpage 63.]
[Essential. Pick up art from original TGpage 63.]
Essential. Pick up table from original TGpage 63. Position below text.]
Section B: Shadows and Blind Spots 15T
Solutions and Samples
6. The angle is about 63°.
7. a.
b. The angle is 27°.
8. a.
b. The length of the shadow is equal to the heightof the building, which is 40 meters.
9. Descriptions will vary. Students may make a tableusing all the information they have gathered, asshown below.
At noon on a summer’s day, the sun can appear tobe almost directly overhead, and shadows are veryshort. In the fall, the shadows gradually get longerand the angle of the sun’s rays gradually getssmaller. In the winter, the noontime sun isrelatively low and creates long shadows. In thespring, the angle of the sun’s rays increasesgradually, and shadows get shorter.
shadow
build
ing
heig
htsun ray
27˚
Winter
Spring
shadow
build
ing
heig
ht sunray
45˚
SeasonAngle of
Sun’s Rays
Building
Height
Length of
Shadow
Summer
Winter
Spring
63˚
27˚
45˚
40 m
40 m
40 m
20 m
80 m
40 m
Hints and CommentsMaterialsstraightedges or rulers (one per student);protractors and/or compass cards (one per student);graph paper, optional (several sheets per student)
Overview
Students reflect on how the lengths of shadows andthe angles of the sun’s rays vary depending on theseason. Students make side-view drawings of abuilding, its shadow, and the sun’s rays for threeseasons. These drawings are right triangles.
Planning
Students may work on problems 6–9 in small groups.You may want to discuss these problems with thewhole class.
Comments About the Solutions
6. Students should measure the angle with aprotractor or compass card.
7. Students’ drawings may use different scales.In any case, the length of the shadow should betwo times the height of the building. You may askstudents why drawings using different scales givethe same angle measurement.
8. Again, students’ drawings may use different scales.Students should discover that with a 45° angle, theratio between the height of the building and thelength of the shadow is 1:1.

16 Looking at an Angle
Shadows andBlind Spots
B
Notes
Students could work onthis as a group, setting upa few per class, and havingeach class measure theshadow during their classtime.
Provide a one meter stringfor each student to measurethe lengths they need sincemany will not have a meterstick at home. If studentsdo not have a compass athome, they can leave thatcolumn blank.
Reaching All LearnersParental Involvement
This activity could be assigned as a family project for extra credit.
In this activity, you will investigate the shadows caused by the sun. On a sunny day, you will measure the shadow and the angle of thesun’s rays.
First, you need to assemble your angle measuring tool (AMT). Cut out the figure on Student Activity Sheet 4 along the solid lines. Make the first fold as shown here and glue the matching shadedpieces together. Continue to fold your AMT in the order shown.
You will need the following items:
● a stick about 1.2 m long
● a stick about 0.7 m long
● a metric tape measure
● several meters of string
● your AMT
● a directional compass
Fold 3 Fold 4
Fold 1 Fold 2
Section B: Shadows and Blind Spots 16T
Hints and CommentsMaterialsStudent Activity Sheet 4 (one per student); scissors (one pair per student);glue (one bottle per pair of students);cardstock, optional (one sheet per student)
Overview
Students build an angle measurement tool. They willuse it to investigate the shadows caused by the sun.There are no problems on this page for students tosolve.
About the Mathematics
The underlying mathematical structure of thesituation is again that of a right triangle. The lightray is the hypotenuse, the vertical object causing theshadow is the height, and the shadow is the base.
Planning
Copy Student Activity Sheet 4 onto cardstock, whichis sturdier than regular paper and will make a moreaccurate angle measurement tool.

17 Looking at an Angle
Shadows andBlind Spots
B
Notes
Some students may notknow how to use adirectional compass. Thecompass should be heldflat, with the needle linedup with the mark for North.The compass can then belaid in the path of theshadow to mark thedirection of the sun.
Reaching All LearnersAccommodation
This activity is designed to be completed when the sun is shining. If it isimpossible to do this experiment outside, either at school or at home, itcan be replaced by an indoor simulation using a strong light. However, youwill not be able to model the sun exactly.
Drive both sticks into the ground about 2 m apart. The longer stick should have a height of 1 m above the ground, and the shorter stick should have a height of 0.5 m above the ground. The sticks should be perfectly vertical.
In your notebook, copy the following table. Take measurements at least five different times during the day and fill in your table. Add more blank rows to your table as needed.
Use the compass to determine the direction from which the sun is shining. Use the tape measure to measure the lengths of theshadows of both sticks, and use your AMT and string (as shownbelow) to measure the angle between the sun’s rays and the ground for both sticks. Be sure to stretch the string to where the shadow ends and place your AMT there.
end of shadow
string
0.5-meter Stick 1-meter Stick
Time
of Day
Direction
of Sun
Length of
Shadow
(in cm)
Angle of
Sun’s Rays
Length of
Shadow
(in cm)
Angle of
Sun’s Rays

Section B: Shadows and Blind Spots 17T
Hints and CommentsMaterialsstring (one roll per pair of students);scissors (one pair per student);directional compasses (one per student);metric measuring tapes (one per student);sticks, 0.7 meter long (one per student);sticks, 1.2 meters long (one per student);angle measurement tools constructed by students onthe previous page (one per student)
Planning
Students may do the Activity individually or in smallgroups. It may also be assigned as homework over aweekend. Alternatively, you might plan with otherteachers to have students take measures for one fullday.
Comments About the Activity
This activity may be assigned as homework.
Students should use the sticks to create shadows.They should put the sticks in the ground in an openarea to avoid interfering shadows from surroundingobjects. Students should use the string to model thesun’s rays. To measure the angle of the sun’s rays,students should place the angle measurement toolflat on the ground. The vertical flap should alignperfectly with the string.
The earlier in the day students start measuring, thelower the sun will be, the smaller the angle, and thelonger the shadows. In other words, you will get agreater range of measures. Be sure to have studentsnote the date and season that the measures weretaken, as well as the location.
Solutions and Samples
Answers will vary, depending on the number ofmeasurements taken, the time of day, the season,the location, and so on. Sample measurements:
0.5-meter Stick 1-meter Stick
Time
of Day
Direction
of Sun
Length of
Shadow
(in cm)
Angle of
Sun’s Rays
Length of
Shadow
(in cm)
Angle of
Sun’s Rays
1 1 A.M.
4 P.M.
Southeast
Southwest
50 cm
100 cm
100 cm
200 cm
45°
27°
45°
27°

Overflow
18 Looking at an Angle
Shadows andBlind Spots
B
Assessment Pyramid
10bc, 12ab
Understand the ratiobetween an object and itsshadow and the relationshipbetween angles and theheight-to-distance ratio.
Notes
Do this page as a classdiscussion and developfour summary statementsthat focus on problems10b, 10c, 11a, 12a, and 12b.
11a Set up a ratio of theshadow length:height ofstick.
11b Have students defineparallel. (Parallel lines areequidistant apart andtherefore never intersect.)
Reaching All LearnersExtension
Challenge students with the following questions:
• How would the size of the angles of the sun be different during anotherseason? (Summer days are longer than winter days. Also the sun is higherin the summer. The angle of the sun’s rays and the length of the shadowchange accordingly.)
• How would the size of the angle of the sun be different if you lived closer tothe Equator? (The sun is higher when you are closer to the Equator, soshadows are shorter and the angle of the sun’s rays is larger.)
• How would your measurements be different if you lived in the SouthernHemisphere? (The sun travels across the northern part of the sky.)
Use your data from the table you made in the activity on pages 16and 17 to answer the following problems.
10. a. Describe the movement of the sun during the day.
b. Describe how the direction of the shadow changes throughoutthe day. How are the shadows related to the direction fromwhich the sun is shining?
c. Describe the changes in the length of the shadow throughoutthe day. When are the shadows longest and when are theyshortest?
Compare the shadows of the longer stick with the shadows of theshorter stick.
11. a. Describe the relationship between the length of the shadowand the height of the stick.
b. Were the shadows of the two sticks parallel at all times? Explain.
Compare the angle of the sun’s rays for each stick at any momentduring the day.
12. a. Describe how the angle of the sun’s rays changed during theday. When is the angle the greatest, and when is it the smallest?
b. How is the size of the angle of the sun’s rays related to thelength of the shadows?
Shadows and Blind SpotsB
Shadows Cast by the Sun and Lights
The sun causes parallel objectsto cast parallel shadows. In thisphotograph, for example, thebars of the railing cast parallelshadows on the sidewalk.
Section B: Shadows and Blind Spots 18T
Hints and CommentsOverviewStudents analyze the data they collected in the previousActivity and draw conclusions.
About the Mathematics
The ratios between the heights and shadow lengths ofobjects are the same when measured at the same timeof the day. However, the height-to-shadow lengthratio varies for different times of the day.
Planning
Students may work on problems 10–12 individually.These problems may also be assigned as homework.
Comments About the Problems
12. b. Students may give their answers in words,or they may make a graph with times of dayon the x-axis and the lengths of the shadowson the y-axis.
Writing Opportunity
You may want to have students write a reportexplaining their data and the results of the activity.Students should include data, drawings, tables, andgraphs in their reports.
Solutions and Samples
10. a. Descriptions will vary. Sample response:
The sun rises in the east and sets in the west.Also, in the Northern Hemisphere, the suntravels across the southern part of the sky.
b. Descriptions will vary. Sample response:
The direction of the shadows is exactly oppositethe direction from which the sun is shining(a difference of 180�).
c. Descriptions will vary. Sample response:
The shadows are longest at the beginning andend of the day. They are shortest at noon.
11. a. Descriptions will vary. Sample response:
The shadow of the shorter stick is always half thelength of the longer stick; provided you measurethe shadows at the same time. So, at any givenmoment of the day, the ratio between an object’slength and that of its shadow is constant.
b. Yes. Explanations will vary. Sample explanations:
If the sticks are vertical, the shadows will alwaysbe parallel because the sun’s rays are all parallel.
The sun hits the sticks at the same angle.
12. a. When the sun is near the horizon, the angles aresmall. This happens near sunrise and sunset.
At noon, the angles are larger.
b. When the sun is low in the sky, the angle of thesun’s ray is small, causing long shadows. Whenthe sun is high in the sky, the angle of the sun’sray is large which makes shorter shadows.

19 Looking at an Angle
Shadows andBlind Spots
B
Assessment Pyramid
14
Construct light rays andshadows in two-dimensionalrepresentations.
Notes
13 Before answering thisproblem you may wantstudents to investigateshadows caused by alamp. For this purpose youmay use a stationary, high-powered lamp (overheadprojector) and objects ofdifferent heights placed atdifferent distances fromthe lamp.
13 Be sure students havea clear understanding ofthe solution for thisproblem before advancingto problem 14.
Reaching All LearnersAct It Out
Have students hold pencils up and show where the shadow would be inrelation to the sun’s location. They should notice that all the shadows areparallel. Select a student to be a lamp. Have students indicate the shadowscast from the lamp. They should notice that the shadows fan out from thelight source.
A streetlight causes a completely differentpicture.
13. Explain the differences between theshadows caused by the streetlight and the shadows caused by the sunand the reasons for these differences.
BShadows and Blind Spots
This is a picture of a streetlight surrounded by posts.
14. On Student Activity Sheet 5, draw in the missing shadows. It isnighttime in top view A, so the streetlight is shining. It is daytimein top view B, so the streetlight is off, and the sun is shining.
Top View A Top View B
Nighttime Streetlight Daytime Sunlight

Top View A
Top View B
Section B: Shadows and Blind Spots 19T
Hints and CommentsMaterialsStudent Activity Sheet 5A stationary, high-powered lamp (overheadprojector), optional;objects of different heights, optional
Overview
Students describe the differences between the shadowscaused by a nearby light source and shadows causedby the sun. Students also use what they learned aboutdifferences between shadows caused by a light andshadows caused by the sun in order to draw shadowscaused by sunlight and by a streetlight.
About the Mathematics
Shadows caused by the sun are different fromshadows caused by a nearby light source. Both thedirection and the lengths of the shadows are different.Shadows caused by the sun do not fan out but areparallel, and the lengths of the shadows depend onthe height of the sun and the time of year.
Planning
Students may work on problem 13 in small groups.Discuss student answers in class. Students may workon problem 14 individually.
Comments About the Solutions
14. In the first picture, all shadows should be equallylong, and they should be fanning out from thelamp. In the second picture, all shadows of theposts are also equally long, but they should beparallel to each other. To make their drawingscomplete, students should also include theshadow of the streetlight. To estimate the lengthof the streetlight’s shadow, students shouldremember that at a given time of the day, the ratiobetween an object’s length and the length of itsshadow is constant.
Solutions and Samples
13. Answers will vary. Sample response:
The sun is very far away from us. The sun’s rays are parallel. Therefore parallel objects, like thebars of the railing in the photograph on page 18,cause parallel shadows.
A lamp is much closer to the objects. The lightcomes from one point and therefore the light raysspread out in an array, and as a consequence sodo the shadows (as shown in the photograph ontop of page 19).
14. Top View A
Top View B

20 Looking at an Angle
Shadows andBlind Spots
B
Notes
16 Students shouldunderstand the relationshipbetween blind spots andshadows and be able toconnect Section A and B.What the eye does not see,a light would not reacheither.
Reaching All LearnersExtension
Have students investigate their shadow patterns when there are multiplelight sources in a room. With two or more overhead projectors or strongflashlights in a darkened room, students could observe the multipleshadows cast by their pencils.
This is a picture of a singer on stage.Three different spotlights are used inthe performance. Three shadows areformed on the stage.
15. Which light creates which shadow?
Shadows and Blind SpotsB
A Shadow Is a Blind Spot
Here are two boats.
One picture shows the blind spot of the captain on the boat duringthe day. The other picture shows the shadow of the boat at nighttime,caused by a searchlight.
16. Explain why these pictures are almost exactly the same.
A
12
3
BC

Section B: Shadows and Blind Spots 20T
Hints and CommentsOverviewStudents relate a shadow to the light source creatingit. They also reflect on the similarity between ashadow and a blind spot.
Planning
Students may work on problem 15 individually.Problem 16 may be done in small groups. Discussstudents’ answers to problem 16 in class.
Solutions and Samples
15. Light A creates shadow 3.
Light B creates shadow 2.
Light C creates shadow 1.
16. Answers may vary. Sample response:
The pictures are the same because vision linesfor the captain act very much like the light raysfor the search light. What the captain cannot see,the light cannot touch.
The vision lines “produce” a blind area orblind spot.
The light rays “produce” a shadow.
The shadow and blind area look identical(the same).

21 Looking at an Angle
Shadows andBlind Spots
B
Notes
Use connecting cubes orblocks for this activity.
Make sure students areable to draw vision linescorrectly. If not, you mighthave students lookcarefully at their tugboatsfrom the viewpointsindicated on StudentActivity Sheet 6. While onestudent watches, his or herpartner could identify thecaptain’s vision line withstring, a straw, or a piece ofuncooked spaghetti.
Reaching All LearnersIntervention
Have students look at their boats from eye level in order to see the visionlines. Turn the boat to face the necessary view.
Extension
You may want to redesign the cube boat (or move the captain’s bridge)and have students delineate the blind area of the new boat.
In this activity, you will investigatethe blind area of a tugboat.
● Use 1-cm blocks to build amodel of the tugboat.
● Place your boat on the top-viewoutline on Student Activity
Sheet 6.
● Use string to represent thecaptain’s vision line.
On Student Activity Sheet 6, drawthe captain’s vision lines for theside, top, and front views.
In the top view, shade the area ofthe graph paper that represents theblind area of the boat.
On Student Activity Sheet 7, drawvision lines and shade the blind areafor the view shown. One vision linehas already been drawn.
Captain
SideView
Fro
nt V
iew
Top View

[Essential. Pick up art from original TG page 35,bottom of page problem 26.]
Section B: Shadows and Blind Spots 21T
Hints and CommentsMaterialsStudent Activity Sheets 6 and 7 (one per student); pieces of string, straws, or uncooked spaghetti (oneper pair of students);centimeter cubes (at least 10 per pair of students)
Overview
Students build a model of a tugboat and find the blindarea for the tugboat’s captain.
About the Mathematics
This activity focuses students’ attention on the exactconstruction of a blind area and its shape. It forms abridge between the canyon tables activity fromSection A—where the marks on the opposite wallwere all on the same level—and this section, wherestudents find that the shadow of a straight object willform a straight shadow. The shape of a shadow issimilar to the shape of the object casting the shadow,just like the shape of the blind area of a boat is similarto the boat itself.
Planning
Students may work on the activity in pairs.
Comments About the Solutions
Discuss the kind of information that is captured andlost in Student Activity Sheet 6’s point of view. In theside view, students see where the vision lines hit thewater in front. In the front view, they see where thevision lines hit the water at the sides. In the top view,they see the directions of the vision lines.
The drawing on Student Activity Sheet 7 builds on what students did on Student Activity Sheet 6.Students should be able to use the information theygathered earlier in this activity to shade in the blind area.
Solutions and Samples
Student Activity Sheet 6:
Student Activity Sheet 7:
Side
View
Fro
nt V
iew
Top View

22 Looking at an Angle
Shadows andBlind Spots
B
Assessment Pyramid
1
Assesses Section B Goals
Notes
1 Be sure students noticethe location of thesearchlight since it isdifferent from the captain’slocation on the previouspage.
Reaching All LearnersEnglish Language Learners
With a partner, create a drawing for each point made in the Summary.
Accommodation
Have cubes available for problem 1 and refer students to their drawings forStudent Activity Sheets 6 and 7.
Shadows and Blind SpotsB
Shadows can be caused by two kinds of light:
• light that is nearby, such as a streetlight;
• light that is very far away, such as the sun.
When the light comes from the sun, the rays of light are parallel, andthe shadows of parallel lines are parallel.
When the light comes from a lamp, the shadows are cast in differentdirections. They resemble vision lines.
For that reason, shadows are similar to blind spots or blind areas.
As the sun moves, shadows will too.
A sun low in the sky casts long shadows.
A sun high in the sky casts short shadows.
The shadows caused by the sun do not only change in length, theyalso change in direction. In the morning shadows will stretch towardthe west.
AThe model of a tugboat has a searchlightat point A.
In order to show the shadow caused by the searchlight, two rays of light are drawn.
1. Use Student Activity Sheet 8 todraw and shade in the shadow of the tugboat caused by the searchlight.

Section B: Shadows and Blind Spots 22T
Hints and CommentsMaterialsStudent Activity Sheet 8 (one per student)
Overview
Students read the Summary, which reviews the mainconcepts covered in this section. Students use theCheck Your Work problems as self-assessment. Theanswers to these problems are also provided on pages62 and 63 of the Student Book. After students completeSection A, you may assign as homework appropriateactivities from the Additional Practice section, locatedon page 57 of the Student Book. After students completeSections A and B, you may use Quiz 1 with students as amid-unit assessment.
Planning
Problem 1 may be used for students’ self-assessment.
Solutions and SamplesAnswers to Check Your Work
1.A

23 Looking at an Angle
Shadows andBlind Spots
B
Assessment Pyramid
2, 3, 4, 5, 6
Assesses Section B Goals
Notes
6 Remind students that ata particular time of daythere is a constant ratio: abuilding twice as tall asanother building makes ashadow twice as long.
Reaching All LearnersAccommodation
Have cubes available for students as they complete problems 2 and 3.Again, you may want to refer students to their drawings on Student ActivitySheets 6 and 7.
Here is a top view of the same tugboat.The shadow caused by searchlight A isshaded.
2. Check whether this shadow iscorrect and explain why orwhy not.
3. Shade in the shadow (in Student
Activity Sheet 8) caused bysearchlight B.
4. Is the blind area now smaller?
5. Where would you place thesearchlight?
A
B
S
EN
W
Time: Noon
The picture here shows the shadows of two buildings at noon. Thesun is shining from the south. One building is twice as tall as the other.
6. Study the shadows of the buildings shown here. Describe thedirection and length of the shadows.

Section B: Shadows and Blind Spots 23T
Hints and CommentsMaterialsStudent Activity Sheet 8 (one per student);centimeter cubes (at least 10 per pair of students)
Planning
Problems 2–6 may be used for students’ self-assessment.
Solutions and Samples
2. From the answers for problem 1, it is clear thatthe shadow is part of a four-by-four square minusfour squares.
3.
4. No, the blind area is still a four-by-four squareminus four squares.
5. I would place it in the middle because that is theplace where the captain will be.
6. Your description may differ from this example.
The sun is shining from the south, so the shadowsfall toward the north. The shadow of the shorterbuilding is half as long as the shadow of the tallerbuilding.
Captain
B

24 Looking at an Angle
Shadows andBlind Spots
B
Assessment Pyramid
7b
7a, FFR
Assesses Section B Goals
Notes
7 You may need toremind students that thesun rises in the east, setsin the west, and travelsacross the southern partof the sky.
For Further Reflection
Encourage students to beas precise as possible intheir wording. Also, makesure that they add labels totheir drawings showingwhat is represented.
Reaching All LearnersParent Involvement
You may want to have students show parents their work from this sectionand explain how they completed the Check YourWork questions.
Shadows and Blind Spots
Now here are two buildings drawn at four different times of day.
7. a. On Student Activity Sheet 9, draw and shade in theshadows that are missing. Note: Picture D needs bothshadows shaded in. Assume that the sun is setting inPicture D.
b. Label each picture with an appropriate time of day.
For a classmate, explain the meaning of each phrase or word.You may use drawings for your explanation.
• vision line
• blind spot
• shadow
B
Picture A Picture B
Picture C Picture DS
EN
W
S
EN
W
S
N
W
E
S
N
W
E
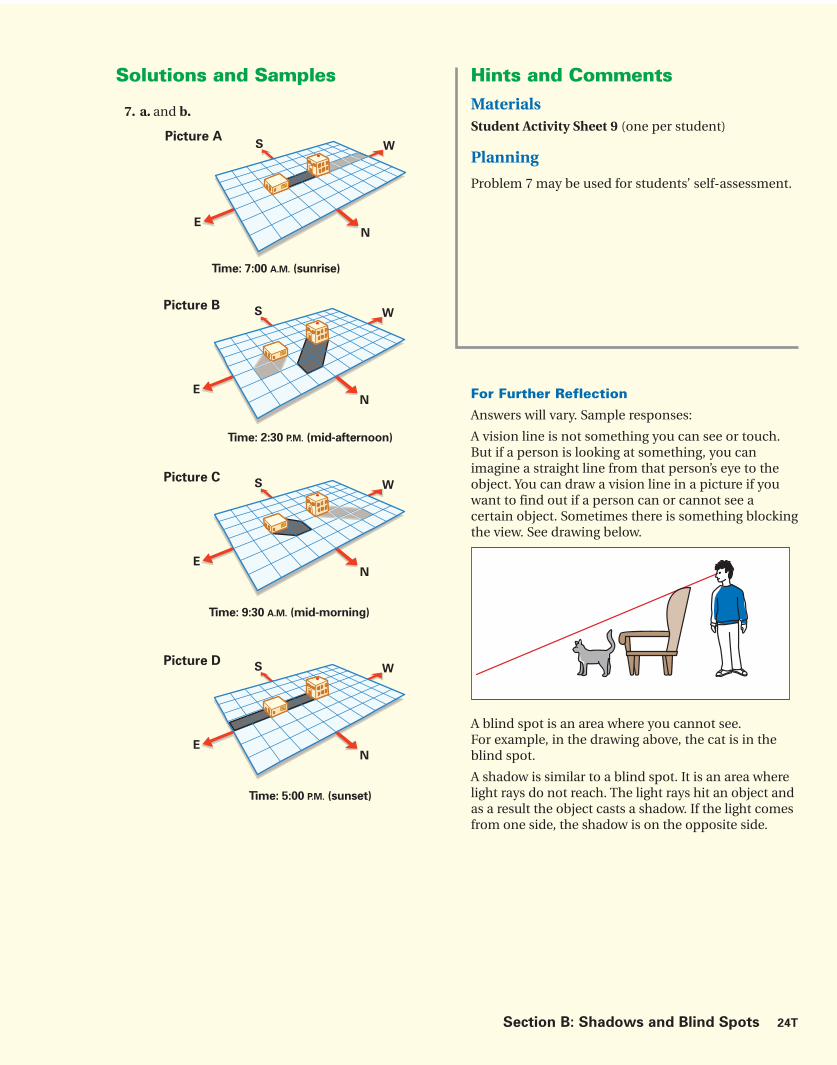
[Insert Check Your Work solutions for Section B,problem 7, below. Pick up from LAA SB, page 63
Quark doc.]
[Essential. Pick up from original TG page 39. Makesure there is a vision line, an object blocking the view,and something apparently hidden from view. Position
below text.]
Section B: Shadows and Blind Spots 24T
For Further Reflection
Answers will vary. Sample responses:
A vision line is not something you can see or touch.But if a person is looking at something, you canimagine a straight line from that person’s eye to theobject. You can draw a vision line in a picture if youwant to find out if a person can or cannot see acertain object. Sometimes there is something blockingthe view. See drawing below.
A blind spot is an area where you cannot see.For example, in the drawing above, the cat is in theblind spot.
A shadow is similar to a blind spot. It is an area wherelight rays do not reach. The light rays hit an object andas a result the object casts a shadow. If the light comesfrom one side, the shadow is on the opposite side.
Solutions and Samples
7. a. and b.
Picture AS
N
W
E
Time: 7:00 A.M. (sunrise)
Picture CS
N
W
E
Time: 9:30 A.M. (mid-morning)
Picture BS
EN
W
Time: 2:30 P.M. (mid-afternoon)
Picture DS
EN
W
Time: 5:00 P.M. (sunset)
Hints and CommentsMaterialsStudent Activity Sheet 9 (one per student)
Planning
Problem 7 may be used for students’ self-assessment.

Day 10: Acoma Pueblo Student pages 25–28
INTRODUCTION Problem 1 Discuss the shadows in a picture.
CLASSWORK Problems 2–9 Draw a series of parallel lines to representthe shadows cast by the rungs of a ladderin the sun.
HOMEWORK Problem 10 Measure the height, distance, and angleof the right triangle formed by the groundand a ladder leaning against a wall.
Day 11: Acoma Pueblo (Continued) Student pages 29–31
INTRODUCTION Review homework. Review homework from Day 10 andProblem 11 create a table of the angle and height-to-
distance ratio of different right triangles.
CLASSWORK Problems 12–14 Graph the angle and height-to-distanceratio data from different right triangles.
HOMEWORK Check Your Work Student self-assessment: Make scaleFor Further Reflection drawings and find the height-to-distance
ratios for right triangles.
25A Looking at an Angle Teachers Matter
Teachers MatterC
Section Focus
This section starts with the introduction of the context of ladders.To make the connection with the previous section, students drawshadows of the rungs of a ladder that is out in the sunlight. Then,the focus is on different levels of steepness of a ladder placed indifferent positions. After an informal investigation, students useside-view drawings of ladders to systematically study the relationshipbetween the angle of elevation of the ladder and the ratio betweenthe height reached by the ladder and the distance between the foot ofthe ladder and the wall. They make both a table and a graph of theirfindings. The instructional focus of Section C is to:
• apply knowledge of shadows caused by the sun to constructshadows in a representation;
• investigate different levels of steepness;
• make side-view drawings (to scale) and find height-to-distanceratios of differently positioned ladders;
• measure angles; and
• make a steepness table and a steepness graph.
Pacing and Planning
Additional Resources: Additional Practice, Section C, Student Book page 58

Teachers Matter Section C: Shadows and Angles 25B
Teachers Matter C
MaterialsStudent Resources
Quantities listed are per student.
• Student Activity Sheet 10
Teachers Resources
No resources required
Student Materials
Quantities listed are per student.
• Book or box that can stand upright
• Centimeter ruler
• Graph paper (two sheets)
• Protractor or compass card
• Ruler
* See Hints and Comments for optional materials.
Learning Lines
Toward Formalization of Steepness
The context of a ladder leaning against a wall moti-vates the study of steepness. In the first place, it is acontext with relevance: How steep can a ladder be inorder to be positioned safely? What measures can youuse to describe a ladder’s steepness? In the secondplace, the side-view drawing of a leaning laddersuggests a right triangle, which is convenient sincethe eventual content of this unit is ratios betweenthe sides of a right triangle. The ladder contextserves as a powerful model.
In Sections A and B, students investigated righttriangle situations in which an object wasblocking either the view (causing blind spots)or light rays (causing shadows). In ladder situations,there is no such obstacle.
While making side-view sketches drawn to scale,attention is given to the symbols used in a righttriangle: the symbol used to indicate a right angleand the symbols used to indicate other angles.Height and distance are abbreviated as h and d.This is a move toward formal notation andformalization.
By using a context that is very close to real experi-ences, this section gives students the opportunityto understand what steepness actually is and howwe can use measures to describe steepness.The steeper a ladder is positioned against a wall:(a) the higher the height on the wall that can bereached by the top of the ladder, (b) the smallerthe distance between the foot of the ladder andthe wall, and (c) the larger the angle between theladder and the ground. Students find that theheight-to-distance ratio is what matters whendescribing steepness. Students also understandthat the larger the height-to-distance ratio, thelarger the angle. However, the relationship betweenthis ratio and the angle size is not linear.
At the End of This Section:Learning Outcomes
Students understand what steepness is and howit can be measured. They use two measures todescribe steepness in the context of ladders:the height-to-distance ratio and the angle size.They also understand how these two measuresare related. They can use these measures in scaledrawings of right triangles in order to reasonabout steepness.
height(h)
ladder(I)
distance (d)This symbol is used toindicate a 900, or right angle.

25 Looking at an Angle
Shadows andAngles
C
Notes
1 You may need toremind students that thesun shines from differentdirections at differenttimes of day and thatthe length of shadowschanges during the day.
Reaching All LearnersIntervention
If students are having a difficult time visualizing the shadow at noon in thephoto, have them refer to past experiences with “shadow play.” Think oftimes of day when your shadow is the longest and the shortest.
The Acoma Pueblo is considered the oldest continually inhabitedvillage in the United States. This drawing is of the Acoma Pueblo as it might have looked over 100 years ago. Located near Albuquerque,New Mexico, it is famous for its beautiful pottery and architecture. Byanalyzing the pottery, archaeologists have determined that this villagewas settled about 1,000 years ago.
CShadows and Angles
Acoma Pueblo
The photograph on the left showsthe typical architecture of a mainstreet of the village. This picturewas taken in the morning.
1. Describe how the shadows willbe different at noon.

Section C: Shadows and Angles 25T
Hints and CommentsOverviewIn this section, students will investigate the steepnessof ladders. The ladders are found in the context of theAcoma Pueblo. Before looking at the ladders’ steepness,students look at shadows, thus making the connectionwith the previous section. Students read about theAcoma Pueblo before working on problem 1.
Planning
Students may work on problem 1 individually or insmall groups.
Comments About the Solutions
1. You might remind students of the activity onpage 17 of the Student Book, in which theymeasured shadows of sticks at different times ofthe day. In that activity, they learned that the sunshines from different directions at different timesof the day and that the lengths of shadows changeduring the day.
Did You Know?
The Acoma Pueblo is also known as “Sky City.” Thepueblo’s name comes from the Keresan language; akomeans “white rock,” and ma means “people.” Acoma’speople live in adobe houses at the top of a sandstonebutte 357 feet (109 meters) high. Most make a livingby farming on the plains below or by making pottery.The village has been inhabited since the 10th century.Logs for its mission church, San Esteban Rey, and dirtfor its graveyard were hauled up the cliffs in 1629–1641.Today, people can reach Acoma by road or by climbinga staircase cut into the rock.
Solutions and Samples
1. Answers will vary. Sample response:
The shadows will become shorter as noonapproaches. At noon, the sun will be shining froma different direction. In the Northern Hemisphere,the sun shines from the east in the morning andfrom the south around noon.

26 Looking at an Angle
Shadows andAngles
C
Reaching All LearnersAccommodation
If students have difficulty drawing the parallel lines of the shadows,you might have them observe shadows made by a light shining on a realladder or choose another smaller object with parallel rungs.
Originally, the houses in the Acoma Pueblo had no front doors;ladders were used to enter the houses on the second floor. Ladderspropped against the houses formed different angles. The steepness of the ladders can be measured several ways.
Recall from Section B that the sun’s rays are parallel. The drawingmarked Picture A shows a ladder and its shadow. The drawing alsoshows how the shadow of one rung in the ladder is cast by a ray ofsunlight.
2. Use Student Activity Sheet 10 to draw rays of sunlight that cast a shadow for each of the other ten rungs of Picture A.
The drawing marked Picture B shows the same ladder in the sameposition, but at a different time of day.
3. Use Student Activity Sheet 10 to draw rays of sunlight and the corresponding shadow for each of the other ten rungs of Picture B.
Shadows and AnglesC
Picture A Picture B
Notes
2 and 3 Have rulersavailable to help drawparallel lines.
Review the definition ofparallel from page 18.(Parallel lines areequidistant apart, andtherefore never intersect.)
2 It should be clear tostudents that the sun’s raystouch the tip of the rungand continue from there tothe tip of the shadow ofthe rung. Remind studentsthat shadows are createdbecause light cannot passthrough opaque objects(just as people cannot seethrough opaque objects).
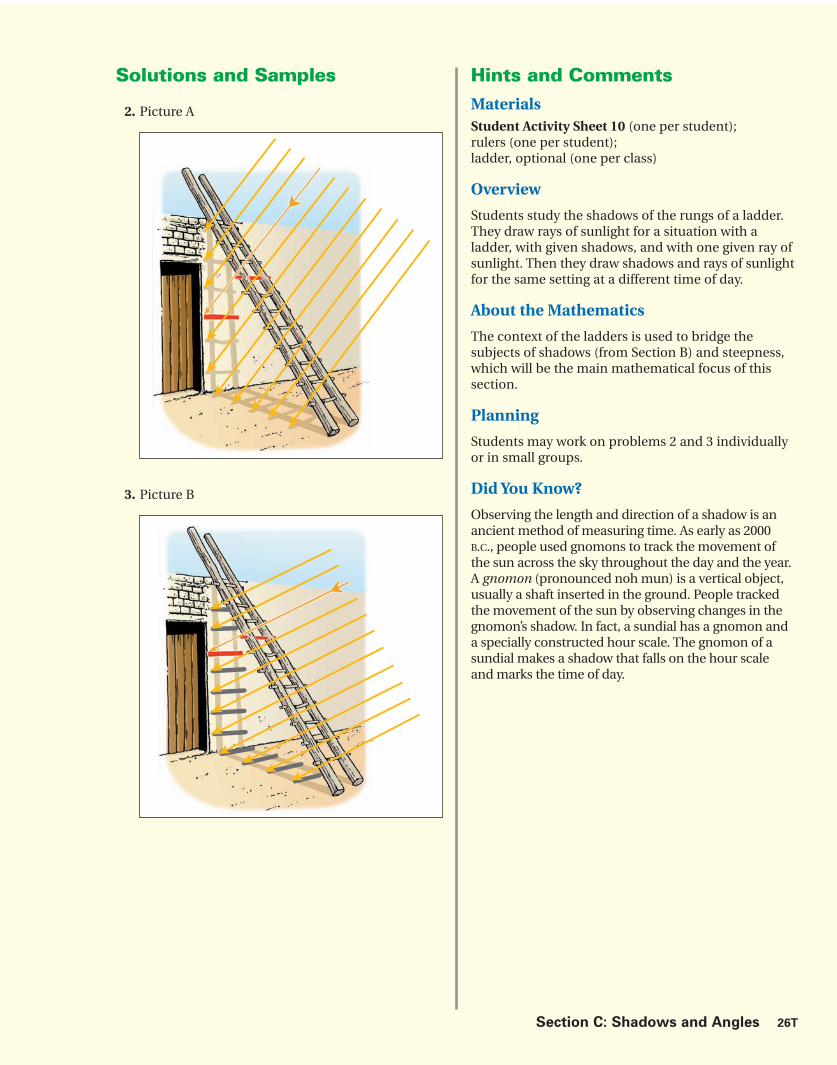
Section C: Shadows and Angles 26T
Hints and CommentsMaterialsStudent Activity Sheet 10 (one per student);rulers (one per student);ladder, optional (one per class)
Overview
Students study the shadows of the rungs of a ladder.They draw rays of sunlight for a situation with aladder, with given shadows, and with one given ray ofsunlight. Then they draw shadows and rays of sunlightfor the same setting at a different time of day.
About the Mathematics
The context of the ladders is used to bridge thesubjects of shadows (from Section B) and steepness,which will be the main mathematical focus of thissection.
Planning
Students may work on problems 2 and 3 individuallyor in small groups.
Did You Know?
Observing the length and direction of a shadow is anancient method of measuring time. As early as 2000B.C., people used gnomons to track the movement ofthe sun across the sky throughout the day and the year.A gnomon (pronounced noh mun) is a vertical object,usually a shaft inserted in the ground. People trackedthe movement of the sun by observing changes in thegnomon’s shadow. In fact, a sundial has a gnomon anda specially constructed hour scale. The gnomon of asundial makes a shadow that falls on the hour scaleand marks the time of day.
Solutions and Samples
2. Picture A
3. Picture B

27 Looking at an Angle
Shadows andAngles
C
Assessment Pyramid
6
Make relative comparisonsinvolving steepness.
Notes
4 Guide students todescribe in terms of ``Howhigh? How steep? How farfrom the wall?’’
Before beginning problem 6,use protractors to practicemeasuring, beginning withthe angles on the twoladders on this page.
6 Set up a chart (see theSolutions column) togetherbefore students work onthis problem in pairs. It is helpful to use graphpaper. Have rulers formeasurement.
Reaching All LearnersIntervention
Create a table for problem 6.
English Language Learners
Problem 5 uses the word steep. Have students demonstrate, with theirarms, hills that vary in degree of steepness.
Accommodation
It is helpful to have graph paper available so that students can easily drawthe ratios.
Ladder A Ladder B
Height (low) (high)
Distance (far) (close)
Angle to Floor (small) (bigger)
Here are drawings of two side views of the same ladder leaningagainst a wall.
4. Describe differences between the positions of the ladder againstthe wall in the drawings.
5. a. What problems might occur if the ladder is very steep?
b. What problems might occur if the ladder is not steep enough?
As the steepness of the ladder changes, the following measurementsalso change:
• the height on the wall that can be reached by the top of the ladder;
• the distance between the foot ofthe ladder and the wall;
• the angle between the ladder and the ground.
6. Investigate different degrees of steepness by using a ruler or pencil to represent a ladder and an upright book or box to represent a wall. Describe your discoveries. You may use drawings.
CShadows and Angles
heig
ht
distance
angle

Section C: Shadows and Angles 27T
Hints and CommentsMaterialsrulers, optional (one per student);books or boxes that can stand upright (one per student);ladder, optional (one per class)
Overview
Students explore the steepness of a ladder leaningagainst a wall.
About the Mathematics
The concept of steepness is informally introduced.When students learn to measure steepness, threethings are involved: the position of the top of theladder on the wall, the distance between the wall andthe foot of the ladder, and the angle formed betweenthe ladder and the ground. The concept of steepnesswill be formalized later in the section.
Planning
You may want to discuss problems 4 and 5. Studentsmay work on problem 6 in small groups.
Comments About the Solutions
4. At this point, students’ answers need not be welldeveloped. You may want to have a whole-classdiscussion in which students make a list of thedifferences they have found.
5. The answer will be obvious if you can demonstratewith a real ladder.
6. Encourage students to look more closely at therelationship between the height and grounddistance and between the ratio of the height-to-ground distance and the angle. This problem canbe used to lead students to see the relationshipbetween inverse ratios and their angles. Forinstance, the ratios 1:5 and 5:1 have angles thatadd up to 90 degrees.
Solutions and Samples
4. Answers will vary. Sample response:
When I compared the two ladders, I noticed thatthe ladder on the left is positioned low on the walland is not very steep. The ground distance thatthis ladder covers is much greater than that of theladder on the right. The angle formed by the footof this ladder and the ground is small. The ladderon the right is positioned high on the wall and ismuch steeper. The ground distance that this laddercovers is much less. The angle formed by the footof the ladder and the ground is much larger.
5. a. Answers will vary. Sample response:
When the ladder is really steep, it may bedangerous. It may tip backwards whensomeone climbs it.
b. Answers will vary. Sample responses:
A person climbing such a ladder may not beable to reach the top of the wall due to its lowposition on the wall.
When the ladder is not very steep, or is too flat,it may collapse.
6. Answers will vary. Students may use pictures andtables to describe their findings. The sampleresponse below shows a pattern among the picturesof the triangles, the ratios of height-to-grounddistance, and the angles.
When the ladder is positioned higher on the wall,the distance that the ladder covers on the groundbecomes shorter, and the angle of the ladder tothe ground becomes larger. When the ratios areinverses (for example, 1:5 to 5:1), the two anglesadd up to 90°.
Pictures AngleRatio
(height:distance)
1:5
2:4.7
3:4.1
4:3.2
5:1
11� or 12�
23� or 24�
35� or 36�
51� or 52�
78� or 79�
1
2
3
4
5
5
4.7
1
3.2
4.1

28 Looking at an Angle
Shadows andAngles
C
Assessment Pyramid
9
10
Understand the relationshipamong steepness, angle, andheight-to-distance ratio.Measure angles and makescale drawings of situations.
Notes
7 Students should discusswhy height is measuredvertically. Ask students,How do you measure yourheight at home?(Vertically.) ``What wouldhappen if you measuredyour height if you werestanding at an angle andthe measuring tape washeld vertically?’’ (Themeasurement would bewrong.)
8 Be sure to the checkangle measurements tosee that students aremeasuring with theprotractors appropriately.
9 Refer to the chart madefor problem 6. If studentshave difficulty seeing thata ratio increases, youmight have them convertthe ratio to a decimal or afraction.
Reaching All LearnersHands-On Learning
Have students use their pencils as the ladder, their book as the wall, andplace a ruler along the distance as a measuring guide. Have class put eraserof pencil on 3 cm. Then on 6 cm. Ask, What happens to the height?the distance? (You also may want to refer to problem 6, page 27.)
Accommodation
Using graph paper to make a chart (with headings Picture, Alpha Angle,and Height:Distance ratio) works well for problem 10.
Intervention
Show students how to draw a right triangle with a given angle since thisis difficult for many of them.
Shadows and AnglesC
Here is a drawing of a ladder leaning against a wall. Angles are oftengiven names. Sometimes the name of the angle is a letter of the Greekalphabet. The first letter in the Greek alphabet is � (alpha), the secondletter is � (beta), and the third letter is � (gamma).
7. Why must the angle between the height (h) and the distance (d)be 90°?
8. Measure angle � in the drawing.
There are several ways to measure the steepness of a ladder. You can measure angle �, or you can find the ratio of the height to thedistance. The ratio of height to distance can be expressed as a ratio, a fraction, or a decimal.
9. What happens to angle � as the ratio of the height to distanceincreases?
10. Use a compass card or a protractor and a ruler to make side-viewdrawings to scale of a ladder leaning against a wall for each of the following situations. Also, label �, h, and d with theirmeasurements, and find the height-to-distance ratio.
a. � � 45°
b. h � 2, d � 1
c. � � 30°
d. h � 1, d � 2
e. � � 60°
ladder(l )
distance (d )
angle
height(h)
(�) This symbol is used to indicate a 90°, or right, angle.

Section C: Shadows and Angles 28T
Solutions and Samples
7. By definition, height is always measured vertically.
8. Angle � is equal to 50°.
9. As the ratio gets larger, the height increases, theground distance decreases, and the angle �becomes larger.
10. a. Scale height and distance can vary.
The ratio h:d is 1:1.
b.
The ratio is 2:1. Angle � is about 63°.
c. Scale height and distance can vary.
Using a scale drawing, the ratio h:d is about 4:7or 1 :1.75.
d.
The ratio is 1:2 and is the inverse of the ratio inproblem b. Since the angles of inverse ratiosmust add up to 90°, angle � is 90° � 63°, or 27°.
e. Scale height and distance can vary.
Angle � is 60°. Angle � for problem c is 30°.Together they add up to 90°. That means theirratios are inverses. Since the ratio for problemc is 4:7, the ratio for this problem must be 7:4.
1
1
45˚
7
4
30˚
2
1
27˚
7
460˚
1
2
63˚
Hints and CommentsMaterialscentimeter rulers (one per student);protractors or compass cards (one per student);graph paper, optional (two sheets per student)
Overview
Students measure heights, distances, and angles inside-view drawings of ladders and describe therelationships between these measurements. They alsoconstruct side-view drawings of ladders.
About the Mathematics
The height-to-distance ratio may be expressed indifferent ways: as a ratio, as a fraction, or as a decimal.It could also be expressed as a percent (for example,a road with a rise of 10%). Make sure students arefamiliar with writing ratios as fractions or percents.
Planning
Students may work on problems 7–9 in small groups.They may work on problem 10 individually.
Comments About the Solutions
7. Problem 7 is critical because it is the first timestudents are asked to relate steepness andmathematical descriptions of steepness, such asthe ratio of height to distance (slope) or the angleof elevation.
9. If students have difficulty seeing that a ratioincreases, you might have them convert the ratioto a decimal or fraction.
10. Students might solve problems d and e using thesame method used to solve a, b, and c, or theycan solve these problems by observing the patternthat is being developed.

29 Looking at an Angle
Shadows andAngles
C
Notes11 Be sure students havecorrect data for problem 10before beginning. Remindstudents to arrange anglesin increasing order. Addanother row to the chartfor height:distance as adecimal.
12 Have graph paperavailable for students touse.
13 If students are not ableto see a pattern in thegraph, you may want toprompt with: The largerthe angle .....,
14 You may need to pointout that the vertical axisdoes not go to three, so itneeds to be extended.
Reaching All LearnersExtension
Have students enter information from problem 11 into a graphing calculator.Use trace feature to see ratios for various angles.
Use the graph from problem 12 to estimate height:distance for other angles.
Advanced Learners
Restate problem 14 as an inequality (2 < h:d < 3) and have students writethe answer as an inequality (64° < � < 71°).
CShadows and Angles
11. Copy the following table and fill it in using your data fromproblem 10. Arrange your entries so that the angle measurementsincrease from left to right.
12. Use the table from problem 11 to make a graph of the height-to-distance ratio for a ladder leaning against a wall. Label yourgraph as shown here.
13. Explain the information shown in your graph. Compare yourgraph to your answer to problem 9.
Suppose that it is safe to be on a ladder when the ratio h:d is greaterthan two and smaller than three.
14. Give a range of angles for which a ladder can be positioned safely.
Angle Measure (in degrees)
He
igh
t-to
-Dis
tan
ce
Ra
tio
15°
0.5
1.5
2.0
1.0
30° 45° 60° 75°
Steepness Graph
(angle measure in degrees)�
h :d (ratio of height to distance)
Steepness Table

Section C: Shadows and Angles 29T
Hints and CommentsMaterialscentimeter rulers (one per student);ladder, optional (one per class);graph paper (two sheets per student)
Overview
Students make a table and a graph of steepness andangles of elevation. They describe the relationshipbetween the two. They also investigate the height-to-distance ratios at which a ladder can be positionedsafely.
About the Mathematics
The table students fill in for problem 11 will be usedagain in Section D, where students investigate a tableof the tangent in the context of glide ratios.
Planning
Students may work on problems 11–13 individually.Problems 11 and 12 may also be assigned ashomework. Be sure to discuss problem 13 in class.Students may continue working on problem 14 insmall groups.
Comments About the Solutions
11. This problem is critical because it focuses students’attention on the relationship between steepnessand angle of elevation. Make sure students havethe correct data from problem 10. The ratio h:dmay be expressed as a fraction or a decimal.
12. Again, students need the correct answers fromproblem 10. The height-to-distance ratio shouldnow be expressed as a decimal because this makesit easier to label the axes.
14. A height-to-distance ratio between two and threeis safe for most ladders, but it depends on theladder.
Solutions and Samples
11.
12.
13. The larger the angle, the larger the ratio of heightto distance. The ratio increases faster than theangle increases.
14. To be safe, the ladder can be positioned at anyangle between 64° and 71°.
(angle measure
in degrees)
�
h :d (ratio of height
to distance)
Steepness Table
27°
1:2 � 0.5
30°
4:7 � 0.57
45°
1 : 1 � 1.0
60°
7:4 � 1.75
63°
2:1 � 2.0
0.5
15� 30�
Angle Measure (in degrees)
Steepness Graph
Heig
ht-
to-D
ista
nce R
ati
o
45� 60�
1.0
1.5
2.0

30 Looking at an Angle
Shadows andAngles
C
Assessment Pyramid
1
Assesses Section C Goals
Notes
For the Summary, be sureto review how to changethe height:distance ratio toa decimal. Example 3:5 �0.6.
Have students use graphpaper for Check Your Work.
1 If students struggle withthis problem, refer them toproblem 10, page 28.
Reaching All LearnersIntervention
Students may need help setting up these problems.
(For example: for problem 1a, students should initially draw a horizontalline which represents the floor, then a vertical line somewhere at the rightside of the floor, which represents the wall. Then they choose a point on thefloor at a certain distance from the wall. At that point, they should measurea 60° angle to draw the ladder. They may have to extend the height of thewall.)
Shadows and AnglesC
As the angle between a ladder and the ground increases, the heightof the position of the ladder on the wall increases. At the same time,the distance between the foot of the ladder and the wall decreases.
In the same way, as the angle between a ray of sunlight and theground increases, a shadow on the ground becomes shorter.
The steepness of a ladder can be measured in the following two ways:
● by the angle (the greater the angle, the steeper the ladder);
● by the ratio of height to distance, or h:d (the greater the ratio, thesteeper the ladder).
1. Use a compass card or a protractor and a ruler to make scaledrawings of a ladder leaning against a wall for each of the following situations:
a. � � 60°
b. h � 3, d � 1
c. Measure and record � from problem b.

Section C: Shadows and Angles 30T
Hints and CommentsMaterialscompass card or protractor (one per student);rulers (one per student)
Overview
Students read the Summary, which reviews the mainconcepts covered in this section. Students use theCheck Your Work problems as self-assessment. Theanswers to these problems are also provided onStudent Book page 64. After students completeSection C, you may assign as homework appropriateactivities from the Additional Practice section, locatedon Student Book page 58.
Planning
Problem 1 may be used for students’ self-assessment.
Solutions and Samples
Answers to Check Your Work
1. a.
b.
c. � � 72�.
60°
( 1 )
( 3 )

31 Looking at an Angle
Shadows andAngles
C
Assessment Pyramid
FFR
3
2
Assesses Section C Goals
Notes
2 Specify to students thatthey should usecentimeters.
3 Have students drawtriangles formed from thevision lines. Label heightand distance in order tocompare the two triangles.
For Further Reflection
Reflective questions aremeant to summarize anddiscuss important concepts.
Reaching All LearnersAdvanced Learners
Choose another ledge for the height and find the height-to-distance ratio.What do you notice?
Intervention
As students complete the For Further Reflection problem, you may needto remind students of their findings in the shadow measuring activity onpages 16 and 17 and in particular of their conclusion for problem 11a.Encourage students to give an example involving numbers.
Here are three different scale drawings of right triangles, eachrepresenting a “ladder situation.”
2. For each ladder situation, use the scale drawing to find �, h, d,and h:d.
Here is a drawing of a cross-section of another canyon model, like theone you worked with in Section A. The numbers indicate the scale of the height and the width of the ledges and the width of the river.
2
4
A
B
4 5
44
1.6
22
2
4
a b c
3. Which vision line is steeper, theone from point A down to theriver or the one from point Bdown to the river? Support youranswer with information aboutthe angle between the visionline and the river and the ratioof the height to the distance.
Explain how you could use shadows to estimate the height of a tower.

Section C: Shadows and Angles 31T
Hints and CommentsMaterialscompass cards or protractors (one per student);centimeter rulers (one per student)
Planning
Problems 2–3 may be used for student self-assessment.
Comments About the Solutions
2. You may encourage students to record the data ofthe three triangles in a table.
3. This problem makes a connection with Section A,where students investigated vision lines in thecontext of the Grand Canyon. You may refer to theactivity with the table canyon on Student Bookpage 3. The vision line of a taller person (or aperson sitting nearer the edge of the canyon wall)was steeper; therefore this person could see moreof the river.
Students can determine the steeper vision line bycomparing the ratios of the two vision lines,concluding which ratio is bigger, and deducingwhich angle must be larger. Students might alsocompare the sizes of the angles and deduce whichheight-to-distance ratio must be bigger. Eitherapproach is fine, as long as students use the dataof ratio and angle to support their answers.
You may want to discuss the advantages anddisadvantages of using ratios instead of protractorsto find angles.
Solutions and Samples
2.
3. Vision line from ledge B is steeper.
Explanations may vary. Here are two.
Using the canyon scale information, I constructeda right triangle for each situation and found �.It is larger toward ledge B, making it steeper.
I compared h:d for both: 12:6 and 9:3.6. This islike 2:1 compared to 2.5:1. Since this 2.5:1 is larger,the line to goes up faster and is steeper.
For Further Reflection
Answers will vary. Sample response:
If you want to find out how high a building is withoutactually measuring it on a sunny day, you can use itsshadow. First you measure the length of the building’sshadow. Suppose it’s 80 meters long. Then you put a1-meter stick upright on the ground and measure itsshadow. Suppose the shadow of the stick is 2 meterslong. This means that the shadow at that time of theday is twice as long as the height of the object castingthe shadow. In the case of the building, this impliesthat the height of the building is half of the length ofthe shadow, which is 40 meters. In a ratio table:
height object 1 40
length shadow 2 80
� d hd
h
a.
b.
c.
34°
45°
76°
2
2
4
3
2
1
1
4
23
9
3.6
B
12
6
63
68
A

32A Looking at an Angle Teachers Matter
Teachers MatterD
Section Focus
The instructional focus of Section D is to:
• make side-view drawings (to scale) of the glide path of different gliders;
• compare the performance of different gliders using the glide ratio;
• make a steepness table and find equivalent glide ratios, fractions, and decimals;
• describe the relationship between the glide ratio, glide angle, and tangent;
• use formal tangent notation and use tangent to solve problems; and
• use a tangent table or the tangent key on a scientific calculator.
Pacing and Planning
Day 12: Hang Gliders Student pages 32–35
INTRODUCTION Problems 1 and 2 Explore the ratio of height of take-off tothe distance traveled.
CLASSWORK Problems 3–6 Use a ratio table and the glide ratioto determine the height of take-off orthe distance traveled for different hangglider flights.
HOMEWORK Problems 7 and 8 Create scale drawings of glide ratios.
Day 13: Hang Gliders (Continued) Student pages 36 and 37
INTRODUCTION Review homework. Review homework from Day 12.
CLASSWORK Problems 9–12 Determine the glide angle that correspondsto each glide ratio.
HOMEWORK Problem 13 Compare different glide ratios andgraph the relationship between glideangles and ratios.
Day 14: From Glide Ratio to Tangent (Continued) Student pages 38 and 39
INTRODUCTION Problems 14 and 15 Introduce the relationship between theglide ratio and the tangent and calculatethe tangent.
CLASSWORK Problems 16–18 Make scale drawings of right triangles tofind angle measures and side lengths.
HOMEWORK Problem 19 Use the tangent of an angle to solvea problem involving a ladder leaningagainst a wall.

Day 15: From Glide Ratio to Tangent (Continued) Student pages 40–44
INTRODUCTION Review homework. Review homework from Day 14 andProblems 20–22 explore the relationship between the
tangent ratio and angle measures.
CLASSWORK Problem 23 Student self-assessment: Use the tangentCheck Your Work ratio to solve right triangle problems.
HOMEWORK For Further Reflection Explain the mathematical relationshipbetween different problem contexts.
Day 16: Summary
INTRODUCTION Review Review problems from Day 15.
ASSESSMENT Quiz 2 Assessment of Section C and D Goals.
Teachers Matter Section D: Glide Angles 32B
Teachers Matter D
MaterialsStudent Resources
Quantities listed are per student.
• Student Activity Sheet 11
• Appendix A on Teacher’s Guide pages 61A–62(Student Book pages 68–70)
Teachers Resources
No resources required
Student Materials
Quantities listed are per student.
• Centimeter rulers
• Protractors or compass cards
* See Hints and Comments for optional materials.
Learning Lines
Formalization of Steepness as theTangent Ratio
The mathematical content of this section isintroduced in the context of hang gliders. Itnaturally motivates a strategy to compare theperformance of different gliders. Two differentmeasures may be used: the size of the glide angle(the angle between the flight path and the ground)or the glide ratio (the ratio between the height theglider is launched from and the distance it coversas measured on the ground).
Represented in a side view, the situation is verysimilar to that of a ladder.
The previous sections have been preparing studentsfor this formal introduction of the tangent. It isimportant at this point that students learn how touse the appropriate mathematical language (suchas: the ratio h:d is also called the tangent of angle �),formal notation (for example: tan 35° � 7___
10 � 0.7),and mathematical tools (tangent table, calculator).
At the End of This Section:Learning Outcomes
Students understand that the glide ratio is thetangent of the glide angle. They can express theglide ratio in fractions and decimals. Studentsunderstand the relationship between the sizeof an angle and its tangent value. Students canuse formal tangent notation and apply theirunderstanding of tangent in solving problems.
Additional Resources: Additional Practice, Section D, Student Book pages 58 and 59
flight path
glide angle
distance (d )
distance (h)

32 Looking at an Angle
Glide AnglesD
Notes
Ask students to share theirknowledge of gliders (andpaper airplanes!). What arethe differences in the designbetween a glider anda passenger airplane?
Reaching All LearnersAct It Out
In order to peak students’ interest in the new context, have students makepaper airplanes and have a contest to find out whose plane flies thefarthest. Do taller people have an advantage?
Hang gliders are light, kite-like glidersthat carry a pilot in a harness. Thepilot takes off from a hill or a cliff intothe wind. The hang glider then slowlydescends to the ground.
When pilots make their first flightwith a new glider, they are verycareful because they do not knowhow quickly the glider will descend.
DGlide Angles
Hang Gliders

Section D: Glide Angles 32T
Hints and CommentsMaterialsmodel glider airplane, optional (one per class)
Overview
Students begin this section by reading about hanggliders. There are no problems on this page for studentsto solve.
About the Mathematics
The context of the hang glider is similar to the otherthree contexts featured in the previous sections.All contexts involve steepness and can be representedwith a right triangle: the steepness of the vision line inthe context of the canyon, the steepness of the visionline of the captain on a ship, the steepness of ladders,and, in this section, the steepness of the flight path ofthe hang glider.
Students investigate the glide ratio: a general ratio inwhich the steepness of the path varies and the height isfixed at 1. The steeper path will have a large glide ratiosuch as 1:1 or 1:0.5, with a value larger than 1. A lesssteep path would have a glide ratio of 1:2 or 1:20, witha value less than 1. The glide angle is also investigated.The glide angle (as shown in the figure below) is theangle the flight path makes with the ground. A steeperpath has a glide angle of between 45 and 90 degrees.A less steep path has a glide angle of between 0 and45 degrees. In reality, the safest glide angle for a hangglider is about 6 degrees or smaller.
The right triangles of hang gliding are used to studythe tangent function of the angle of any right triangle.The ratio of height to distance is equal to the tangentof the angle opposite the height.
In the example shown here, the tangent of the 35° angleis 0.7. By looking at a table of tangent values for anglesranging from 0 to 90 degrees (see Appendix A onTeacher’s Guide pages 61A–62), it can be seen that thetangent ratio increases slowly for the first 45 degrees,ranging from 0 to 1, and then increases rapidly as theangle increases from 45 to 90 degrees. The section endswith students solving problems using the tangentrelationship.
7
1035°

33 Looking at an Angle
Glide AnglesD
Notes
1 and 2 Use a ratio table.Do 1 as a class discussion.
2 Remind students that the distance is from theground to the cliff, not thepath of the glider.
3 Students should usegraph paper and drawtriangles to scale.
Reaching All LearnersAccommodation
How high is a 10 m cliff? Show a meter stick and talk about a meter beingclose to three feet. (30 yards on a football field)
Intervention
Review ratio tables with various operations (doubling, halving, addingcolumns etc.) If students have difficulty, you might also have them sketchside views of the flight paths.
Marianne, the pilot in this picture, decides to make her first jump froma 10-m cliff. She glides along a straight line, covering 40 m of groundas shown in the drawing.
After several successful flights, she decides to go to a higher cliff. Thiscliff is 15 m high.
1. How much ground distance does the glider cover from the highercliff? Note: Assume that the steepness of the flight path remainsthe same.
2. Marianne makes flights from three cliffs that are 20 m, 50 m, and100 m high. How much ground distance does the glider cover oneach flight?
Marianne has designed a glider that can travel farther than her firstone. With the new glider, Marianne claims, “When I jump from a 10-m cliff, I can cover 70 m of ground!”
3. a. Draw a side view of Marianne’s flight path with the new glider.
b. Copy the table below and complete it for the new glider.
DGlide Angles
40 m
10 m
Height (in m) 10
70 245 1,000
25 100
Distance (in m)

Section D: Glide Angles 33T
Hints and CommentsMaterialscentimeter rulers (one per student)
Overview
Students use ratio tables to find out how far a gliderwill fly from various heights when the distance for oneheight is given.
About the Mathematics
At the start of the section, students look at a gliderwith a fixed height-to-distance ratio, so the steepnessof its flight path is constant. Side-view drawings ofdifferent flights of this glider will look like similartriangles; the angle between the flight path and theground remains the same.
Next, students investigate gliders with a differentheight-to-distance ratio. Further on in the section,students need to develop a measure (the “glide ratio”)in order to compare the performances of differenthang gliders.
Planning
You may want to have students work on problem 1as a whole-class activity. They may work on problems2 and 3 in small groups. Discuss students’ answers.
Comments About the Solutions
1.–3. For these problems, distance refers to thedistance covered on the ground. So when aproblem asks how far the glider flew, the solutionis not the length of the flight path of the glider(the hypotenuse of the right triangle formed byheight, distance, and flight path). The distanceis the ground distance covered by the glider.
3. a. Tell students to sketch a side view that is drawnto scale. You might have students determine anappropriate scale themselves. For example,1 centimeter could represent 10 meters.
Solutions and Samples
1. The glider covers 60 meters. Students may use adrawing. Others might use a ratio table:
2. Answer are recorded in the table:
Here’s a ratio table solution:
3. a. The size of the triangle may vary depending onthe scale that is used. Sample solution:
b.
Height (in m)
Distance (in m)
10
40
5
20
15
60
2 � 3
Height (in m) 20 50 100
Distance (in m) 80 200 400
Height (in m)
Distance (in m)
10
70
25
175
100
700
35
245
≈14.3
100
143
1,000
column 2
� 10 7
4
Height
Distance
Height (in m)
Distance (in m)
10
40
20
80
50
200
100
400
� 2
� 5
� 2
70 m
10 m

34 Looking at an Angle
Glide AnglesD
Assessment Pyramid
4ab
4c
Use ratios to solve problemsand make relativecomparisons involvingsteepness problems.
Notes
4 Clarify that studentsshould trace the path ofthe glider and use this tocreate a right triangle.
4c Note that this refers toproblems 1 and 3.
5 Discuss this problem to be sure studentsunderstand glide ratio.
Reaching All LearnersExtension
Review ways to write ratios: 1__3 , 1:3, 1 to 3.
Vocabulary Building
A glide ratio is height:distance. Have students draw a picture of a gliderand its path and label it with the height, distance, and � angle.
Glide AnglesD
Glide Ratio
16.3 cm
2 cm
This picture is based on three separate photographs, taken one after the other. It shows a model glider that is used in laboratoryexperiments. By taking three pictures within a short period of time,you can determine the path of the glider.
4. In your notebook, trace the path of this glider and make a scaledrawing similar to the drawing on top of page 33. Use your scale drawing to answer the following questions.
a. If the glider in the picture is launched from a height of 5 m,how far will the glider fly before landing?
b. How far will the glider fly from a 10-m cliff?
c. Compare the distances covered by Marianne’s two hanggliders and this model glider. If all three are launched from 10 m, which one flies the farthest? Explain.
To determine which hang glider travels farther, you can consider theglide ratio. Marianne’s first glider flew 40 m from a 10-m cliff. Thisglider has a glide ratio of 1:4 (one to four). Marianne’s second gliderflew 70 m from a 10-m cliff.
The second glider has a glide ratio of 1:7.
5. What do you think a glide ratio is?

Section D: Glide Angles 34T
Hints and CommentsMaterialscentimeter rulers (one per student)
Overview
Students trace the flight path of a glider with a givensteepness and determine how far the glider will fly if itis launched from a given height. They compare theperformance of the glider with those of the gliders onpage 33 of the Student Book. Students also explainwhat a glide ratio is.
Planning
Students may work on problem 4 individually. Discussstudents’ answers in class.
About the Mathematics
The term glide ratio is used in aviation as a measurefor the performance of gliders. It is defined as theheight-to-distance ratio.
Comments About the Solutions
4. a. When students trace the glider’s path, makesure that they maintain the glider’s steepness.Students can do this by aligning the notebookpaper so that its edges are exactly lined up withthe edges of the Student Book page, or so thatits edges are parallel to the edges of the StudentBook page. Students should draw the heightand a line that represents the ground (and thatintersects with the flight path). The height andthe line that represents the ground should forma right angle.
5. Encourage students to write extensively aboutwhat they think a glide ratio is. Discuss students’answers. Be sure that all students understandthe definition of glide ratio before they continue.
Solutions and Samples
4. a. About 41 meters. Answers may vary somewhatdue to measurement errors. Strategies will vary.Sample strategies:
• The ratio is 2:16.3, which is about 1:8.2.Launched from a height of 5 meters, theglider will travel about 41 meters.
• Using a ratio table, I used my drawingmeasurements, but changed them to meterssince I need to get to a height of 5 m.
b. 82 m.
In problem a. I found that launched from aheight of 1 meter, the plane will get about 8.2meters far. So from a height of 10 meters, thiswill be 82 meters.
c. The model glider flies the farthest.
I put the information in one chart, making theheight all the same (10 m).
5. Answers will vary. Students should note that a glideratio is the ratio of height to (horizontal) distance.It tells you how far a glider can fly (in meters) if itis launched at a height of one meter.
16.3 cm
2 cm
Height (in m) 2 1 5
Distance (in m) 16.3 8.2 41
Height
10
10
10
40
70
82
Distance

35 Looking at an Angle
Glide AnglesD
Assessment Pyramid
6
Make relative comparisonsinvolving steepnessproblems and understandglide ratios.
Notes6 and 7 Students shoulddraw pictures of theseproblems and make a ratiotable.
6 Change glide ratios todecimals.
7 Note that distance isgiven, not height.
8 Students should usegraph paper and drawthese triangles to scale.Remind students to drawtriangles large enough toget an accuratemeasurement of the angle.(On quarter-inch graphpaper, a triangle with aratio of 1:1 could be drawnas an 8:8.)
Reaching All LearnersEnglish Language Learners
Have students draw Lilienthal’s flights and label the triangles.
Intervention
Ask, What information is necessary to solve the Lilienthal problems?What information is unnecessary?
Intervention
To practice, have students use 5 meters for the height and find the distancefor Lilienthal’s glider. Then they can use a height of 8 meters.
DGlide Angles
Otto Lilienthal made more than 2,000 flights with hang gliders at theend of the 19th century. Suppose that on one of his flights from theRhinower Hills near Berlin, Germany, he started from a height of 25 mand covered 185 m of ground distance as shown here. On his nextflight, suppose he redesigned his glider a little, started from a heightof 20 m, and traveled a ground distance of 155 m.
6. What were the glide ratios of Otto’s two gliders? Which glidercould travel farther?
7. Suppose that a glider has a glide ratio of 1:8. It takes off from acliff and covers 120 m of ground distance. How high is the cliff?
8. Make scale drawings to represent the following glide ratios.
a. 1:1 b. 1:2 c. 1:4
d. 1:10 e. 1:20
185 m
25 m

Section D: Glide Angles 35T
Hints and CommentsMaterialscentimeter rulers (one per student);graph paper, optional (one sheet per student)
Overview
Students compare the performances of two gliders usingglide ratios. They also make scale drawings showing theflight paths of gliders with given glide ratios.
Planning
Students may work on problems 6 and 7 in smallgroups. Students may do problem 8 individually.This problem can also be assigned as homework.
Comments About the Solutions
6. Students will need to simplify the ratios in orderto compare the planes. Students may rememberthe process of simplifying ratios from the workthey did in problem 4 on page 34 of theStudent Book.
7. Students may use a ratio table to solve this problem.
8. This problem may be assigned as homework.You might want to have students use graph paperto make their scale drawings so they can aligntheir right angles with the lines on the paper.
Did You Know?
Otto Lilienthal was an important aviation pioneer.Orville and Wilbur Wright, the brothers who built thefirst powered airplane that was capable of sustainedflight, drew on the work of Otto Lilienthal. Beforetrying to build powered airplanes, the Wright brothersbuilt three glider airplanes.
Solutions and Samples
6. 25:185 or 1:7.4 or about 1:7.
20:155 or 1:7.75 or about 1:8.
The second glider can travel farther because it hasa slightly better glide ratio.
7. The cliff is 15 meters high. Students may use aratio table:
8.
a.
b.
c.
d.
e.
Height (in m)
Distance (in m)
1
8
10
80
5
40
15
120
� 10 2
column 2
1
1
2
1
4
1
10
1
201

36 Looking at an Angle
Glide AnglesD
Assessment Pyramid
9
Measure angles.
Notes9 Discuss ways to expressglide ratios. Is it easier tocompare fractions ordecimals?
Point out to students thesimilarities between theladder and the glidersituations.
9 Add another row to thechart labeled h:d (as adecimal).
10 Encourage students tosolve this problem withoutusing a calculator.
10 If students havedifficulties, have themchange all the ratios todecimals. Remind studentsthat some of the ratios willnot have a match.
Reaching All LearnersVocabulary Building
Point out that equivalent means equal.
Accommodation
It may help students to have the ratios from problem 10 written onnotecards to support the matching exercise.
Advanced Learner
Write ratios on cards. Each student receives a card and converts the ratiointo a decimal. Students then order the cards from least to greatest,stacking the equivalent ratios.
In Section C when you studied ladders at different angles, you made atable similar to the one below, showing the angle between the ladderand the ground and the ratio of the height to the distance.
You can organize your information about the steepness of the glidepath of a hang glider with a similar table. The angle that the hangglider makes with the ground as it descends is called a glide angle.
9. Copy this table in your notebook. Fill in the missing glide anglesby using the scale drawings you made for problem 8. Measurethe angles using a compass card or protractor.
Glide ratios can also be expressed as fractions or decimals.
10. Which of the following glide ratios are equivalent?
1:25 4�����100 1:20 3:75 1����201����30 2:40 0.04 1����25 4:100
0.05 1���4 0.20 4:120 2����50
Glide AnglesD
Glide Angle �
1:1Glide Ratio h:d 1:2 1:4 1:10 1:20
Glide Path Steepness
� 27° 30° 45° 60° 63°
0.5 0.6 1 1.7 2h:d
Ladder Steepness
heig
ht
(h
)
distance (d )
�
heig
ht
(h
)distance (d )
�

Section D: Glide Angles 36T
Hints and CommentsMaterialsscientific calculators, optional (one per student orgroup of students)
Overview
Students make a table of the steepness of differentflight paths using the information they gathered onpage 35 of the Student Book. Also, they matchequivalent glide ratios that are expressed as ratios,fractions, and decimals.
About the Mathematics
Students learned about equivalent ratios and fractionsand about the relationships among ratios, fractions,and decimals in several MiC units in the Numberstrand. Make sure students are familiar with expressingratios as fractions or percents.
Planning
Students may work on problems 9 and 10 in smallgroups. Have students compare their answers. You maywant to discuss students’ answers as a whole class.
Comments About the Solutions
9. For this problem, students will need the scaledrawings they made for problem 8 on page 35 of the Student Book. If students’ scale drawingsare incorrect, their angle measures may also be inaccurate.
Extension
Glide ratios can also be expressed as percents.For example, 1__5 and 0.20 are equivalent to 20%; 4:100, 1___
25 , and 0.04 are equivalent to 4%; 1:30 isequivalent to 3 1__
3 %; and 1:20 is equivalent to 5%. You may want to have students express the ratios,fractions, and decimals given in problem 10 aspercents.
Solutions and Samples
9.
10. There are three different glide ratios with equivalentratios: 1:25, 1:20 and 4:120. 1__
4 and 0.20 have noequivalents.
1:25 � 3:75 � 4:100 � 1___25 � 2___
50 � 4____100 � 0.04.
1:20 � 2:40 � 1___20 � 0.05.
4:120 � 1___30 .
Glide Angle �
1:1Glide Ratio h:d 1:2 1:4 1:10 1:20
Glide Path Steepness
45° 27° 14° 6° 3°

37 Looking at an Angle
Glide AnglesD
Assessment Pyramid
13
Understand the concept ofglide ratio or tangent.
Notes11 Encourage students tosolve this problem usingthe table from problem 9.
12 Remind students thatthe smaller the glide ratio,the safer the glider.
13 Read about tangenttogether. Ask students ifthey’ve ever seen the tanbutton on a calculator.Clarify problem 12 byhaving students completethe statement, ‘‘Thegreater the glide ratio,the (safer/more unsafe)the glider.’’
Reaching All LearnersVocabulary Building
Tangent of alpha � height:distance.
Extension
Ask students, How are the ladder problems and the glider problems similar?
Intervention
For problem 11, check students' understanding of “a glide ratio smallerthan 1:10.” Ask students to give an example of a glide ratio smaller than1:10. (For example, 1:100)
Ask students, How would you compare the the glide angle for a glide ratioof 1:100 and the glide angle for a glide ratio of 1:10?
DGlide Angles
From Glide Ratio to Tangent
h
d
�
Suppose that it is safe to fly gliders that have a glide ratio smallerthan 1:10.
11. What is the largest glide angle that is safe?
Suppose three gliders have the following glide ratios.
• Glider 1: 1:27
• Glider 2: 0.04
• Glider 3: 3����78
12. Which glider is the safest? Explain.
The relationship between the glide ratio and the glide angle is veryimportant in hang gliding, as well as in other applications, such asthe placement of a ladder. For this reason, there are several waysto express this ratio and angle.
glide ratio � h:d
glide angle � �
The ratio h :d is also calledthe tangent of angle �, ortan � � h—d .
For a glide ratio of 1:1, the glide angle is 45°, so tan 45° � 1��1� 1.
Suppose that another one of Otto’s hang gliders has a glide ratio of1:7. This means that the tangent of the glide angle is 1 to 7 (or 1��7 ).
13. Describe in your own words the relationship between the glideratio, glide angle, and tangent.

Section D: Glide Angles 37T
Hints and CommentsMaterialsscientific calculators, optional (one per student orgroup of students)
Overview
Students compare the performances of gliders todetermine which glider is the safest. Students alsostudy a formal description of the concept of tangent.They are introduced to tangent notation.
About the Mathematics
At this point, what was known to students as“steepness” in the context of ladders or “glide ratio”in the context of gliders is formally named tangent.The tangent is the ratio of vertical height to horizontaldistance in any context that can be represented witha right triangle.
Planning
Problems 11 and 12 may be done in small groups.Discuss students’ answers in class. You may want toread and discuss the bottom half of this page togetherwith students. Encourage students to ask questionsand discuss anything that may be unclear to them.Students will use formal tangent notation throughoutthe rest of this section.
Comments About the Solutions
11. Any angle smaller than six degrees is safe, since itmeans that the glider will travel a long distance.A glider flying at a very steep angle is more likelyto crash.
12. Students should realize that they will have toconvert all the glide ratios to decimals or ratios inorder to compare them.
Solutions and Samples
11. The largest glide angle that is safe is about 6�.
12. Glider 1 has the smallest glide angle, so it cantravel farther than the other two gliders. The gliderthat can travel the farthest is also the safest.
In order to compare the gliders, students maywrite their glide ratios as decimals:
Glider 1 1:27 � 0.037
Glider 2 0.04
Glider 3 3___78 � 0.038
Or they may convert the decimal notations toglide ratios:
Glider 1 1:27
Glider 2 0.04 � 1:25
Glider 3 3___78 � 1:26
13. Descriptions will vary. Sample description:
The tangent is the same as the glide ratio; the ratiobetween the height a glider is launched from andthe distance along the ground it flies. The glideangle is the angle between the flight path of aglider and the ground. The smaller the glide angle,the smaller the ratio between the height and thedistance (or the glide ratio or tangent).

38 Looking at an Angle
Glide AnglesD
Notes
14 The tangent of an angledescribes the height-to-distance ratio and can beexpressed as a fraction,decimal, or ratio. Remindstudents that tangent isalways height overdistance.
Reaching All LearnersIntervention
Relate these problems to the distance the hang gliders traveled and thedistance the ladder was from the wall.
Reflection
Ask, How does the angle size affect the ratio (tangent)?
Glide AnglesD
7
1035°
25
53 B
C
A
Suppose that a glider follows the flight path shown here.
From this information, you know that theglide ratio of a 35°angle is 0.7 (or 7:10).You can write this information in thefollowing way.
tan 35° � 7����10 � 0.7
Here is a different glider situation.
You know the tangent of angle A is 25:53,or 0.47.
You can write this information in thefollowing way.
tan A � 25����53 � 0.47
14. Complete the statements below for each of the followingright triangles.
a. tan ?° � ? b. tan ?° � ?
c. tan ?° � ? d. tan ?° � ?
2 1
1 1
27° 45°
2
3
1 1
63° 72°

Section D: Glide Angles 38T
Hints and CommentsOverviewStudents study formal tangent notation. Then theyfind the tangents of angles in four right triangles.
Planning
Students should read the text at the top of the pagecarefully. Students may work on problem 14individually. Discuss students’ answers in class.
Comments About the Solutions
14. This problem is meant for students to becomefamiliar with and practice formal tangent notation.They do not have to calculate or measure. Theymay refer to the example at the top of the page tosee how statements like these are written. Note:The measurements shown in the Solutions columnare approximations. For example, tan 63° is closerto 1.9626 than to 2.
Solutions and Samples
14. a. tan 27° � 1:2, or 0.5
b. tan 45° � 1:1, or 1
c. tan 63° � 2:1, or 2
d. tan 72° � 3:1, or 3

39 Looking at an Angle
Glide AnglesD
Assessment Pyramid
19
15
Solve problems involvingright triangle trigonometryratios.Understand the concept ofglide ratio, or tangent.
Notes
16 Review how to namesides of a triangle.Students should use graphpaper to easily make scaledrawings.
17 Draw these trianglesreasonably. It’s notnecessary to draw themexactly to scale.
Students should add thedimensions for height anddistance to their drawings.
19 Rephrase this problemto: “How far is the ladderfrom the wall, and what isthe height of the ladder upthe wall?” Draw thistriangle.
Reaching All LearnersExtension
You might ask students to comment on the following statement: “The smallerthe glide angle, the better the glider.” Have students compare this statementto the one made by the salesperson on page 39 of the Student Book.
Peter wants to buy a balsa wood modelglider for his nephew, but he is not surewhich one to buy. The salesperson atthe hobby store claims, “The smallerthe tangent of the glide angle, the betterthe glider.”
15. Is the salesperson correct? Explain.
DGlide Angles
16. Suppose for triangle ABC, the measure of angle B is 90° andtan A � 3���5 .
a. Make a scale drawing of triangle ABC.
b. Suppose you drew triangle ABC so that side AB measures10 cm. What is the length of side BC?
c. What is the measure of angle A in triangle ABC? Is it the samesize in both of the triangles drawn?
The following table lists some angles and the approximatemeasurements of their tangents.
Use the table to answer the following problems.
17. a. Draw a side view of the flight path for a glider whose glideangle is 5°.
b. What is the glide ratio for this glider?
18. If the glide angle is 35°, how much ground distance does aglider cover from a height of 100 m?
19. If a ladder makes an 80° angle with the ground, what canyou determine about the position of the ladder if you knowtan 80°� 5.7?
Angle
(in degrees)0°
0 0.02 0.04 0.05 0.07 0.09 0.60 0.63 0.65 0.68 0.70
1° 2° 3° 4° 5° 31° 32° 33° 34° 35°
Tangent of Angle
(as a decimal)

Section D: Glide Angles 39T
Hints and CommentsMaterialscentimeter rulers (one per student);protractors or compass cards (one per student);scientific calculators, optional (one per student)
Overview
Students investigate how the tangent of the glideangle affects the performance of a glider. They alsomake scale drawings of right triangles. When theglide angle is given, students find the tangent,and vice versa. They use a table of angles and theircorresponding tangents to solve problems.
Planning
Students may work on problem 15 individually.Discuss students’ answers in class. Then students cancontinue working on problems 16–19 in small groupsor individually. Discuss their answers in class.
Comments About the Solutions
15. Students must realize that a glider with a smallglide ratio or tangent will fly relatively far(considering the height).
16. a. There are several possibilities for making ascale drawing of the triangle. Any scale drawingis acceptable as long as the ratio betweenheight and distance is 3:5. Make sure studentslabel vertices A, B, and C correctly.
b. If the distance is multiplied by two, the heightmust also be multiplied by two to maintain thesame height-to-distance ratio.
c. No matter what size students’ drawings are, theyshould find that the angle measures about 31°.
17. a. Students may first draw the 5° angle and thencomplete the triangle. The length of thedistance they choose is not important, but itwill be easier to find the height-to-distanceratio if students choose a convenient length.
b. Students can find the glide ratio by measuringthe height and distance of the triangle theydrew. But it is easier to use the table on page 39of the Student Book.
19. This problem assesses students’ ability tounderstand the contexts involving steepness thatmay be represented with a right triangle. Be surestudents understand that the tangent ratio relatesto triangles formed in many contexts, such asgliding, ladders leaning against walls, vision lineson boats, and so on.
Solutions and Samples
15. Yes, the salesperson is correct. Explanations willvary. Sample explanation:
The smaller the tangent of the glide angle, thebetter the glide ratio. For instance, a glide ratioof 1:20 means that for every meter of launchingheight, the glider will cover 20 meters on theground. A smaller glide ratio such as 1:200 meansthat the glider covers 200 meters on the ground ifit is launched from a height of 1 meter. This wouldbe a spectacular distance to travel with such atake-off height, obviously a better glider!
16. a.
b. Side BC would measure 6 centimeters.
Many students will know the distance is doubledand will not need to use a ratio table here.
c. Angle A measures about 31°. Yes, angle A is thesame size in both triangles.
17. a. Sample explanation:
b. 9:100. The table shows that for an angle of 5°,the tangent is 0.09, which is 9 hundredths. Thisis written as 9:100. Therefore, when the glider islaunched from a height of 9 meters, it covers aground distance of 100 meters.
18. 143 meters.
If the glide angle is 35°, the table shows the tangentis 0.70 or 7:10; when the glider takes off from aheight of 7 meters, it covers 10 meters of grounddistance.
Here is a ratio table solution:
19. Answers will vary. Sample response:
The ladder reaches 5.7 metersup the wall if the bottom ofthe ladder is 1 meter awayfrom the wall, as shown here.
B
C
A
20
9
40 60 80 100
5°
Height (in m)
Distance (in m)
700
1,000
7
10
100
143
1 m
Ladder 5.7 m
Wall
80�
40 Looking at an Angle
Glide AnglesD
Assessment Pyramid
23
Understand the relationshipamong steepness, angle,and height-to-distance ratio.
Notes
For many students,a scientific calculator is amysterious "black box."In the beginning, studentswill benefit from using thetable in the Appendix,which will help them makesense of the relationshipbetween the angle andtangent ratios.
20 Students should beable to give the height anddistance of triangles withthe given glide angles.
21 This is an importanttangent value to remember;you might call it abenchmark tangent value.You may ask studentswhat they know about thetangent values for anglessmaller than 45� and largerthan 45°.
Reaching All LearnersIntervention
Give students various sizes of squares and have them cut them apartacross the diagonal. Students should see that the triangles are congruent.Have them measure the three angles. Students should discover the two45° angles have equal opposite sides. Because of that property of triangles,the tangent of 45° is always 1.
The table in Appendix A shows the relationship between the size ofan angle and its tangent value. You can also use a scientific calculatorto find the tangent of an angle. Since calculators differ, you may wantto investigate how to use the tangent key on your calculator. You canuse the table in the appendix to verify your work.
You can also use a scientific calculator to find angle measurements ifyou know the tangent ratio.
Use either the table or the tangent key on your scientific calculator toanswer the following problems.
20. What do you know about a glider with a glide angle of 4°?A glide angle of 35°?
21. Explain why tan 45° � 1.
22. Which angle has a tangent value of 2? Of 3? Of 4?
23. How much does the measurement of the angle change when thetangent value changes in these ways?
a. From 0 to 1
b. From 1 to 2
c. From 2 to 3
d. From 3 to 4
e. From 4 to 5
Glide AnglesD

Section D: Glide Angles 40T
Hints and CommentsMaterialsAppendix A on Teacher’s Guide pages 61A–62
(Student Book pages 68–70);scientific calculators, optional (one per student)
Overview
Students find angle measures for tangent valuesand vice versa, using a scientific calculator or atangent table.
Planning
Introduce the tangent table from Appendix A or thetangent key on a scientific calculator in class. Makesure all students understand how to use one or both.Students will need to use the tangent table or ascientific calculator to solve the remaining problemsin this section. Students may work on problems 20–23in small groups. Discuss their answers in class.
Comments About the Solutions
20. Students may find the corresponding glide ratiosin the tangent table (or by using a calculator) andreason from there.
22. and 23.The purpose of these problems is to familiarizestudents with the use of the tangent table or thetangent key on a scientific calculator.
Solutions and Samples
20. Answers will vary. Sample responses:
A glider with a glide angle of 4° has a tangent of0.070, or a glide ratio of 7:100. This glider cantravel 100 meters when it is launched from a heightof 7 meters.
A glider with a glide angle of 35° has a tangentof 0.700, or a glide ratio of 7:10. This glider isdangerous. If it is launched from a height of7 meters, it will fly only 10 meters.
21. The tangent of 45° is equal to 1 because theheight and distance in a right triangle with two45� angles are equal. The ratio is 1:1, so the tangentis 1__
1 or 1.
22. An angle of about 63° or 64° has a tangent of 2.
An angle of about 71° or 72° has a tangent of 3.
An angle of about 76° has a tangent of 4.
23. a. The measure of the angle changes by 45°.When the tangent value is 0, the anglemeasures 0°; when the tangent value is 1,the angle measures 45°. The difference is 45°.
b. The measure of the angle changes by 18°.When the tangent value is 1, the angle measures45°; when the tangent value is 2, the anglemeasures about 63°. The difference is 18°.
c. The measure of the angle changes by 8°.When the tangent value is 2, the anglemeasures about 63°; when the tangent valueis 3, the angle measures about 71°. Thedifference is 8°.
d. The measure of the angle changes by 5°.When the tangent value is 3, the anglemeasures about 71°; when the tangent value is4, the angle measures 76°. The difference is 5°.
e. The measure of the angle changes by 3°.When the tangent value is 4, the angle measures76°; when the tangent value is 5, the anglemeasures about 79°. The difference is 3°.

41 Looking at an Angle
Glide AnglesD
Reaching All LearnersAdvanced Learners
Encourage students to search the Internet to find descriptions of thevarious applications of glide ratio. Have them report their findings tothe rest of the class.
DGlide Angles
Math History
Umbra versa
Umbra recta
Shadows and Gliders
Shadow reckoning was an early device for finding heights. If yousee the sun’s rays under an angle of 45°, you can measure theshadow of a tower to know its height.
Around 400 B.C., the Hindus understood the use of shadows tomeasure heights. Albategnius made the first tables of shadowsaround 920 A.D.
Around 860, the first table of tangents wasconstructed by the Arabs (Habash-al-Hasib).Arab writers described thestraight shadow umbra recta(horizontal distance) andthe turned shadow orumbra versa (vertical distance).
As soon as the first glider planes were invented, their performanceswere compared by using glide ratios. The German aviator OttoLilienthal (around 1890) made a kind of hang glider with glide ratiosof around 1 to 9, which is also the glide ratio of NASA’s space shuttle.
There is always confusion about glide ratios: In Europe, peopleidentify 1:40 as the glide ratio of a good contemporary sailplane(sometimes even 1:60!), but in the United States you can often see42:1 or even just 42.
Gliding is also a common adaptation in mammals.In a scientific article by Brian Stafford and others, theglide ratios of Japan’s flying squirrels are compared.The scientists conclude that the glide paths of theseanimals vary greatly. The best gliders among thosesquirrels have a glide ratio close to 1:3.5. Not bad!The worst flyers barely reach 1:1. Hard landings canbe expected.

Section D: Glide Angles 41T
Hints and CommentsOverviewYou may want to have students read this page anddiscuss it in class. It is optional.

42 Looking at an Angle
Glide AnglesD
Assessment Pyramid
1
Assesses Section D Goals
Reaching All LearnersIntervention
For more practice, use an example of two glide ratios such as 7:10 and 2:5.What are the alpha angles?
Glide Angles
The steepness of a ladder, the angle of thesun’s rays, and the flight path of a hangglider can all be modeled by a right trianglesuch as the one here.
Steepness can be measured as the angle �or as the ratio h :d.
The ratio h :d is also called the tangent ofangle �, or tan � � h��d .
On a calm day, a glider pilot wants to make a flight that covers120 km. The glider has a glide ratio of 1:40.
1. From what height does the glider have to be launched?
D
h
d
�
Notes
1 Students should showequivalent ratios for thisproblem.

Section D: Glide Angles 42T
Hints and CommentsOverviewStudents read the Summary, which reviews the mainconcepts covered in this section. Students use theCheck Your Work problems as self-assessment. Theanswers to these problems are also provided on pages65 and 66 of the Student Book. After students completeSection D, you may assign as homework appropriateactivities from the Additional Practice section, locatedon pages 58 and 59 of the Student Book. After studentshave completed Sections C and D, you may use Quiz 2as a mid-unit assessment.
About the Mathematics
The Summary of this section outlines the mainmathematical concepts of Sections A–D. Each contextthat was featured in these sections may be representedwith a right triangle: steepness of the vision line,steepness of the sun’s rays, steepness of the ladder,and steepness of the glide path. Each serves to establishunderstanding of the tangent concept. Students mayalways remember the tangent as the “glide ratio” of aglider.
Solutions and SamplesAnswers to Check Your Work
1. The glider must be launched from a height of 3 km.
Since the glide ratio is 1:40, and 120 is three times40 km, you only need to triple the height.
3 km
120 km
Height (in km) 1 3
Distance (in km) 40 120
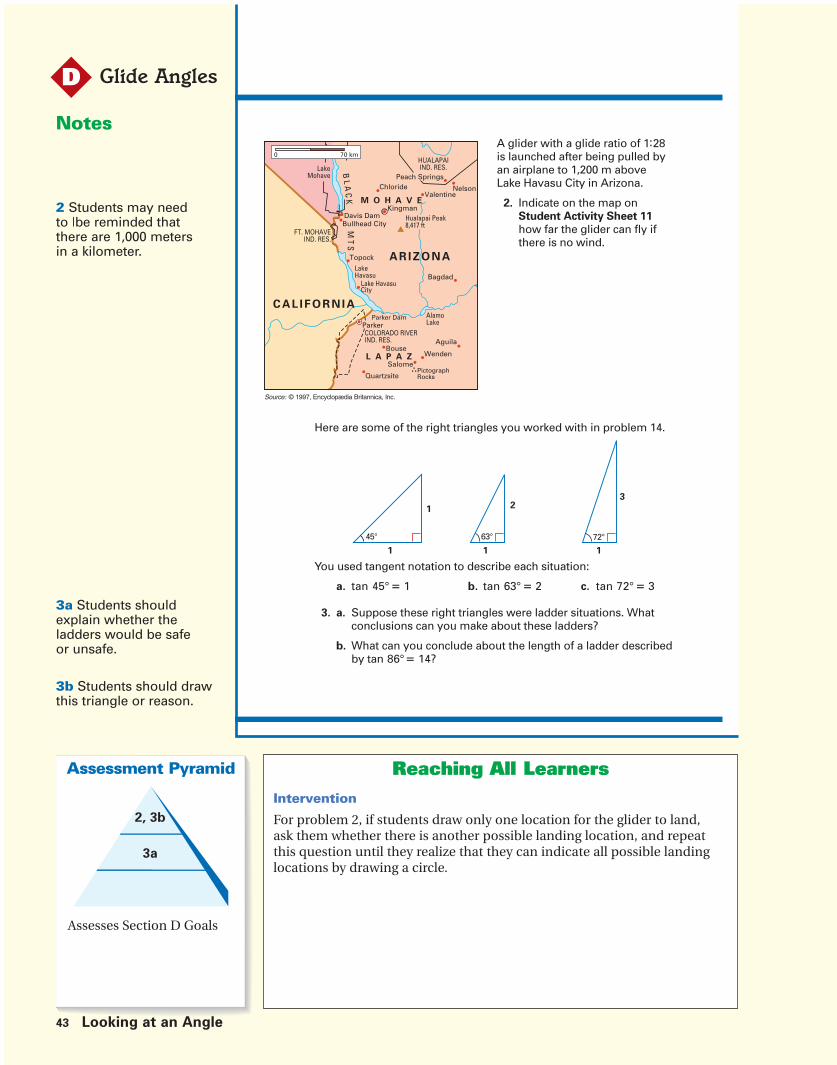
43 Looking at an Angle
Glide AnglesD
Assessment Pyramid
2, 3b
3a
Assesses Section D Goals
Reaching All LearnersIntervention
For problem 2, if students draw only one location for the glider to land,ask them whether there is another possible landing location, and repeatthis question until they realize that they can indicate all possible landinglocations by drawing a circle.
A glider with a glide ratio of 1:28is launched after being pulled byan airplane to 1,200 m aboveLake Havasu City in Arizona.
2. Indicate on the map onStudent Activity Sheet 11
how far the glider can fly ifthere is no wind.
Davis DamBullhead City
KingmanHualapai Peak8,417 ft
ChloridePeach Springs
HUALAPAIIND. RES.Lake
Mohave
FT. MOHAVEIND. RES.
CAL IFORN IA
Lake HavasuCity
LakeHavasu
Parker DamParkerCOLORADO RIVERIND. RES.
AlamoLake
WendenBouse
PictographRocks
Salome
Quartzsite
ValentineNelson
Bagdad
Topock
L A P A Z
M O H A V E
BL
AC
KM
TS
0 70 km
ARIZONA
Aguila
Source: © 1997, Encyclopædia Britannica, Inc.
Here are some of the right triangles you worked with in problem 14.
You used tangent notation to describe each situation:
a. tan 45° � 1 b. tan 63° � 2 c. tan 72° � 3
3. a. Suppose these right triangles were ladder situations. Whatconclusions can you make about these ladders?
b. What can you conclude about the length of a ladder describedby tan 86°� 14?
45° 63° 72°
1 23
1 1 1
Notes
2 Students may needto |be reminded thatthere are 1,000 metersin a kilometer.
3a Students shouldexplain whether theladders would be safeor unsafe.
3b Students should drawthis triangle or reason.

Section D: Glide Angles 43T
Hints and CommentsMaterialsStudent Activity Sheet 11
Overview
Students use the Check YourWork problems asself-assessment.
Solutions and Samples
2. The distance the glider can go is 33,600 m or 33.6km.
Here is a ratio table with the 1:28 glide ratio,building up to 1,200 m height.
Using the map scale line, you should draw a circlearound Lake Havasu City.
3. a. Some students will focus on the ladder positionon the wall; others might focus on the relativelengths of the ladders. As the ladder was movedhigher up the wall, the angle at the baseincreased. If you want to keep the ladder 1 mfrom the wall, then you need to get taller andtaller ladders to make the specified angle.
b. The length of the ladder is probably greaterthan 14 m if the height is 14 m when the ladderis 1 meter from the wall. The ladder shouldalways be greater than the height along thewall.
Davis DamBullhead City
KingmanHualapai Peak8,417 ft
ChloridePeach Springs
HUALAPAIIND. RES.Lake
Mohave
FT. MOHAVEIND. RES.
C A L I F O R N I A
Lake HavasuCity
LakeHavasu
Parker DamParkerCOLORADO RIVERIND. RES.
AlamoLake
WendenBouse
PictographRocks
Salome
Quartzsite
ValentineNelson
Bagdad
Topock
L A P A Z
M O H A V E
BL
AC
KM
TS
0 70 km
ARIZONA
Aguila
Height (in m) 1 10
Distance (in m) 28 280
1,000
28,000
20
560
200
5,600
1,200
33,600

44 Looking at an Angle
Glide AnglesD
Assessment Pyramid
FFR
4, 5
Assesses Section D Goals
Notes
For Further Reflection
This type of reflectivequestion supports studentsummarization ofimportant concepts fromthis section.
Reaching All LearnersIntervention
Students may need help getting problem 4 set up: tan 12° � height/10 km.
Glide Angles
A road has been constructed with a fairly large angle between theroad and the horizontal plane.
4. a. Use the tangent table or your calculator to find tan 12°.
b. Use this to compute height h.
At a distance of 160 m from a tower, you look up at an angle of 23°and see the top of the tower.
5. What is the height of the tower? Hint: Use tan 23°.
Write a short paragraph about the similarities you see between thesituations involving ladders and hang gliders. In your description,use the terms steepness, height-to-distance ratio, and angle.
D
BA
C
h
10 km
12°
160 m
23°

Section D: Glide Angles 44T
Hints and CommentsOverviewStudents use the Check Your Work problems as self-assessment. They may reflect on Sections C and D byanswering the For Further Reflection problem.
Comments About the Solutions
For Further ReflectionYou may want to encourage students to includedrawings in their writing. Make sure that they addlabels to their drawings showing what is represented.
Solutions and Samples
4. a. tan 12° � 0.21.
b. 2.1 km.
Strategies may vary. Sample strategy:
tan 12° � 0.21, which means that you need a heightof 21 km to travel 100 km. The car needs to descenda ground distance of 10 km, so I only need to divide21 by 10 to get an answer of 2.1 km. This keeps thesame glide ratio and angle of 12°.
5. 67.2 m.
Sample strategy:
tan 23° � 0.42, which means that you need a heightof 42 m to travel 100 m along the ground. Then Iused a ratio table and placed the glide ratio in thefirst column. My goal was to build up to a distanceof 160 m.
For Further Reflection
Answers will vary. Sample response:
Situations involving ladders and hang gliders can berepresented with a right triangle:
h stands for the height reached by the ladder or theheight a glider is launched from; d stands for thedistance between the ladder and the wall or thedistance a glider flies.
If you want to indicate the steepness of the ladderor the flight path of the glider, you can use theheight-to-distance ratio: the bigger the ratio, thesteeper the ladder or the flight path of the glider.You can also look at the angle �: The larger the angle,the steeper the ladder or the flight path of the glider.
Height (in m) 42 21
Distance (in m) 100 50
4.2
10
67.2
160
d
h
�

Day 17: Tangent Ratio Student pages 45–50
INTRODUCTION Problems 1 and 2 Read about the flying method used by vultures and compare the glide ratio of a vulture to that of a glider.
CLASSWORK Problems 3–6c Use the Pythagorean theorem to find missing side lengths of right triangles and to calculate the length of a vulture’sflight path.
HOMEWORK Problems 6d–7 Solve problems using the tangent ratio and the Pythagorean theorem.
Day 18: The Ratios: Tangent, Sine, and Cosine Student pages 50–55
INTRODUCTION Review homework. Review homework from Day 17.
CLASSWORK Problems 8–14 Investigate and apply sine, cosine, and tangent.
HOMEWORK Check Your Work Student self-assessment: Solve problems For Further Reflection using sine, cosine, and tangent.
45A Looking at an Angle Teachers Matter
Teachers MatterE
Section Focus
The instructional focus of Section E is to:
• reflect on the different contexts in this unit and find commonalities;
• review the concept of tangent and relate the concept of slope to tangent;
• review the Pythagorean theorem;
• learn about the sine and cosine and use formal notation for tangent, sine,and cosine;
• use a sine and cosine table or the sine and cosine keys on a scientific calculator; and
• use tangent, sine, cosine and the Pythagorean theorem to solve problems.
Pacing and Planning
Additional Resources: Additional Practice, Section E, Student Book page 60

Teachers Matter Section E: Reasoning with Ratios 45B
Teachers Matter E
MaterialsStudent Resources
Quantities listed are per student.
• Appendix A on Teacher’s Guide pages 61A–62(Student Book pages 68–70)
Teachers Resources
No resources required
Student Materials
Quantities listed are per student.
• Calculators
• Protractors or compass cards
* See Hints and Comments for optional materials.
Learning Lines
Pythagorean Theorem
In the unit Triangles and Beyond, the Pythagoreantheorem was introduced. It is briefly reviewed inthis section, where students learn that it can bewritten as an equation, a2 b2 � c2 , where a and brepresent the two smallest sides of a right triangle,and c represents the longest side. The termhypotenuse is used for the first time in this unit,but the concept is not new since students arefamiliarized with it as being the flight path or theladder. The Pythagorean theorem can be used tofind the length of any one side of a right triangleif the lengths of the other two sides are known.This becomes quite useful for solving problemsinvolving ratios between the sides of right triangles(i.e., tangent, sine, cosine).
Slope
In the unit Graphing Equations, slope was intro-duced as the ratio of the vertical component tothe horizontal component. The slope of a linegives the direction of a line, which is a measure ofhow steep it is. In the unit Graphing Equations,students also investigated if the tangent of theangle that a line makes with the positive (or right)side of the x-axis is equal to the slope. This is onlythe case if both the horizontal and the verticalaxis are scaled in the same way. The tangent of anangle is similarly defined as the vertical distancedivided by the horizontal distance. Students alsodiscovered that the slope is not proportional tothe angle.
In Section E of this unit, the concept of slope isrevised as a measure for the steepness of a glider’sflight path. It is the same as the glide ratio. Insummary:
• � � glide angle
• tan � � h__d
• glide ratio � h:d or h__d
• slope � h:d or h__d
Tangent, Sine, Cosine
The concept of tangent was carefully developedin this unit, using several contexts that serve as amodel. When students need to know what tangentis, they only need to remind themselves that it is thesame as the glide ratio: the ratio of the height theglider is launched from to the horizontal distanceit covers. After the formalization process of theconcept of tangent is completed, sine and cosineare introduced at a formal level, as being twoother ratios, which describe a relationshipbetween two sides of a right triangle. In summary:
At the End of this Section:Learning Outcomes
Students understand the concept of tangent andslope at a formal level. Students know what thesine and cosine ratios mean, they can use formalsine and cosine notation, and they can find sineand cosine values when solving problems.Students also know how to use the Pythagoreantheorem to solve problems involving the lengthsof the sides of a right triangle.
height
h
horizontal distance
d
flight p
ath
�
B
C
A
�
B
C
A
�
cos � �side adjacent to �
�AB
hypotenuse AC
sin � �side opposite �
�BC
hypotenuse AC

45 Looking at an Angle
Reasoningwith Ratios
E
Notes
Use this page to review thecontent of the unit so farwith your students.
Reaching All LearnersExtension
Some students may need a word bank from the solution for problem 1.
Word bank: height, distance, height of cliff, height up wall, distance fromwall, ground distance, hypotenuse, ladder, glider path, glide angle, blindarea, blind spot, vision line, ladder angle.
So far, you have worked with situations like these.
1. The elements of these situations are labeled with numbers from1 to 15. Name each element. For example, a line labeled with anumber might be a ray of light or a flight path.
EReasoning with Ratios
Tangent Ratio
vision lines
2
1
shadows, rays of light
4
3
glide angle, glide ratio
1110
8
10
9
tangent of an angle
13
15
14
�
12
ladder steepness
7
5
6

Section E: Reasoning with Ratios 45T
Hints and CommentsOverviewStudents review the mathematical content of theprevious sections.
About the Mathematics
On this page, the different contexts students have seenin the unit are summarized. Notice that each of thesecontexts can be represented with a right triangle. Also,in each context the concept of steepness is important.
Planning
Have students work on problem 1 individually anddiscuss the results in class.
Solutions and Samples
1. 1 vision line
2 blind spot
3 light ray
4 shadow (or blind spot)
5 ladder
6 height reached by the ladder on the wall
7 angle indicating steepness of ladder
8 flight path
9 ground distance flown
10 height the glider is launched from
11 glide angle
12 distance
13 angle
14 height
15 hypotenuse

46 Looking at an Angle
Reasoningwith Ratios
E
Assessment Pyramid
2bc
2ad
Understand when contextscan be represented by aright triangle.Make relative comparisonsinvolving steepness.
Notes
2a Encourage students tosketch right triangles forthe vulture’s glide pathand the glider’s path.
Refer to page 39 for a defi-nition of a better glider.The smaller the tangent ofthe glide angle, the betterthe glide.
Note: The Vultures vs.Gliders paragraph containsadditional unnecessaryinformation.
2c Students can useAppendix A on StudentBook pages 68–70 orscientific calculators todetermine the glide anglesusing the glide ratios.
Reaching All LearnersIntervention
Review method of converting between decimals and fractions and how tocompare the glide ratios as fractions.
All the situations on the previous page have a right triangle incommon. In many situations, the ratio of the height to distanceplays an important role, tan � � h���d .
This ratio is a measurement for steepness, as is the angle. A smallangle corresponds to low steepness.
Reasoning with RatiosE
Vultures Versus GlidersWhile searching for food, vultures useupdraft hot air currents, or thermals, togain altitude. They rise up circling and afterreaching a certain altitude, glide down tocatch a new thermal column. Vultures lookfor thermals so that they can gain altitudewithout expending energy. Like vultures,gliders also rely on thermals.
Vultures and gliders can be compared interms of their glide ratios.
For the vulture, the glide ratio is 1:10, ortan � � 0.1.
For the glider, tan � � 0.03.
2. a. Who is the better “glider?”
b. What distance can each fly, startingfrom a vertical height of 1 km?
c. What is the size of the two glideangles?
d. Which flight path is steeper?

Section E: Reasoning with Ratios 46T
Hints and CommentsMaterialsAppendix A on Teacher’s Guide pages 61A–62
(Student Book pages 68–70);scientific calculator (one per student);
Overview
Students may read the conclusions to be drawn fromthe previous page. Students read about the flyingmethod used by vultures and compare the glide ratioof a vulture to that of a glider. Students will againencounter vultures in problem 5 of this section.
Planning
You may have students read the text at the top of thepage and the text about vultures and gliders beforethey start working on problem 2. This problem maybe done in small groups. Use this problem to assessif students understand the concepts of glide ratio,glide angle and steepness.
Did You Know?
Vultures use various methods of flight. They can beator flap their wings, or they can hover and remainsuspended in the air. Vultures are large birds, so theygenerally flap their wings only to begin flight or tomove from perch to perch. Once airborne, they needlarge thermals to support their weight. The Old Worldblack vulture is one of the biggest and heaviest birdsof flight. It weighs about 12.5 kilograms (27.5 pounds),is about 100 centimeters (39 inches) long and has awingspan of about 2.7 meters (9 feet).
Solutions and Samples
2. a. The glider is better because it doesn’t have tobe up as high as the vulture to cover the samedistance along the ground.
vulture: 1:10
glider: 0.03
b. vulture: 10 km (glide ratio is 1:10)
glider: 33 km (glide ratio is 3:100, which isabout 1:33)
c. vulture: about 6°
tan � � 0.1 then � 5.7° or 6°
glider: about 2°
tan � � 0.03 then � 1.7° or 2°
d. The vulture has a steeper flight path.

47 Looking at an Angle
Reasoningwith Ratios
E
Notes
The Pythagorean theoremwas introduced in the unitTriangles and Beyond.
Reaching All LearnersVocabulary
Hypotenuse: the side opposite the right angle of a right triangle (also thelongest side). In the context we have used so far, it is the vision line,the light ray, the ladder, and the flight path.
Pythagorean theorem: a2 b 2 � c 2. This only applies to right triangles!
Hands-On Learning
Have students take graph paper and cut out squares of 3 � 3, 4 � 4, and5 � 5. Discuss the relationship between the area of a square and squaring.Show that the area of the two smaller squares will fit into the larger square.This will help students recall “squaring” and how the Pythagorean theoremworks.
You may remember a theorem that is closely connected to righttriangles. It is called the Pythagorean theorem. Pythagoras wasborn in Samos, Ionia, in the sixth century B.C. The Pythagoreantheorem is used to calculate the length of any one side of a righttriangle if the lengths of the other two sides are known.
EReasoning with Ratios
Pythagoras
a
a2
c
leg
leghypotenuse
c2
bb2
If a triangle has aright angle, then the squareon the longest side has the
same area as the othertwo combined.
You can write the Pythagorean theorem asan equation, a2 b2 � c2, where a and brepresent the two short sides, called legs,of a right triangle, and c represents thelongest side, called the hypotenuse. Thehypotenuse is always the side oppositethe right angle.

Section E: Reasoning with Ratios 47T
Hints and CommentsOverviewStudents read about the Pythagorean theorem.
About the Mathematics
The Pythagorean theorem is used to find to find amissing side of a right triangle given the lengths of theother two sides. Make sure students understand thatthe theorem applies only to right triangles. The termhypotenuse is used for the first time in the unit.Make sure students understand what it means. Youmay refer to contexts they have seen before in whichthe hypotenuse could be the vision line, the light ray,the ladder or the flight path.
Planning
You may read the text on this page and discuss it inclass. Make sure students understand the drawing atthe bottom of the page and explain what the equationshows.

48 Looking at an Angle
Reasoningwith Ratios
E
Notes
With this picture story youmay need to point out tostudents that they shouldfollow the arrows from onepicture to the next.
3a Encourage students toexplain the story orallybefore they begin writing.Make sure students readthrough the picture story,like a comic.
3b Remind students tofind the square root of 25.
Reaching All LearnersAccommodation
Give students graph paper and have them prove the picture story byreallotting the two smaller squares to make the larger one.
Intervention
If students are having trouble getting started on problem 3a, have them goback to page 45 which shows all the situations we have talked about, andchoose one of those to use for the story.
If you know the measurements of all three sides of a triangle, you canuse the Pythagorean theorem to find out whether the triangle is aright triangle. If a2 b2 ≠ c2, then the triangle is not a right triangle.
The Pythagorean theorem is used to find distances. Look carefully atthe following picture story.
3. a. Explain the picture story.
b. What is the length of segment AB?
Reasoning with RatiosE
B
A
?
B
3
4A
?
B
A
A
B
?
32 42
32
42

Section E: Reasoning with Ratios 48T
Hints and CommentsOverviewStudents read how they can find out whether atriangle is a right triangle. They also learn how thePythagorean theorem can be used to find distancesand use this knowledge to find missing side lengthsof right triangles.
About the Mathematics
Students should be able to explain why the formulaa2 b2 � c 2 works so that they can use it to solveproblems.
Planning
Students may read the text and work on problem 3 insmall groups. Discuss the results in class.
Comments About the Solutions
3. a. Use this problem to assess if students under-stand the Pythagorean theorem. They will needit to solve problems throughout the remainderof this section.
Solutions and Samples
3. a. Explanations will vary. Sample explanation:
The first picture shows a rectangular part of agrid, for which AB is a diagonal. The secondpicture shows how a right triangle can bemade, with AB as its longest side. The thirdpicture labels the lengths of the two shortersides: 3 units and 4 units. The last pictureshows squares drawn from each of the threesides of the right triangle. The areas of the twosmaller squares were found by squaring thesides. Since the area of the largest square of aright triangle is the same as the sum of the areasof the two smaller squares, we now know thearea of the largest square. By taking the squareroot of this area, we can find the length oflongest side of the triangle, the length of linesegment AB.
b. Segment AB is 5 units long, since 32 42 �9 16 � 25, and ���25 � 5.

49 Looking at an Angle
Reasoningwith Ratios
E
Assessment Pyramid
5b
Solve problems with righttriangle trigonometry ratios.
Notes4 Before they use acalculator, encouragestudents to estimate thesize of a square root, suchas ���52, by locating the twoperfect squares the squarefalls between (49 and 64).In this way, students willsee that a side length of���52 is shorter than 8, butlonger than 7. Since 49 <52 < 64, this can be writtenas 7 < ���52 < 8.
4d and 4f Some studentsmay find these problemsmore challenging since thelength of leg is missing,rather than the length ofthe hypotenuse.
5a Some students maywant to use a ratio table.
5b Students may useAppendix A on StudentBook pages 68–70instead of a calculator.
5c Students shouldestimate the square root,but will then need acalculator to find a moreprecise estimate of thesquare root.
Reaching All LearnersIntervention
Some students may find it difficult to solve these problems usingequations. It may be helpful to explain the following strategy instead:
4. Find the missing distances in the triangles below. Show your work.
a. b. c.
d. e. f.
EReasoning with Ratios
4
6
?
6
10?
5
12 ?2 ?
8
12
?
1
4 ?
1,000 meters
400meters
A B
C
The vulture does not have to fly at a glide ratio of 1:10. It can glide atmuch steeper angles, especially when diving for food.
5. a. What is the vulture’s glide ratio in the picture above?
b. Use your calculator to find the size of the glide angle.
c. Use the Pythagorean theorem to calculate the length of thevulture’s flight path (BC).
Side Length Area
4
6
52
16
36
52����

Section E: Reasoning with Ratios 49T
5. a. The glide ratio is 1:2.5. In a ratio table:
b. The glide angle is about 22°.
Sample calculation:
tan � � 0.4 so � is about 22°.
c. The vulture’s flight path is about 1,077 m.
Using the Pythagorean theorem:
4002 1,0002 � Path2
160,000 1,000,000 � Path2
1,160,000 � Path2
The path is ��������� � 1,077 m.
Solutions and Samples
4. a. The missing distance is about 7.2.
a2 b 2 � c 2
42 62 � c 2
16 36 � c 2
52 � c 2
���52 � c
c � 7.2
b. The missing distance is about 2.2.
a2 b 2 � c 2
12 22 � c 2
5 � c 2
��5 � c
c � 2.2
c. The missing distance is about 4.1.
a2 b 2 � c 2
12 + 42 � c 2
17 � c 2
���17 � c
c � 4.1
d. The missing distance is 8.
a2 b 2 � c 2
62 + b 2 � 100
36 + b 2 � 100
b 2 � 100 � 36
b 2 � 64
b � ���64 � 8
e. The missing distance is 13.
a2 b 2 � c 2
52 122 � c 2
25 144 � c 2
169 � c 2
����169 � c
c � 13
f. The missing distance is 2.
a2 b 2 � c 2
22 b 2 � (��8 )2
4 b 2 � 8
b 2 � 8 � 4
b 2 � 4
b � ��4 � 2
1,160,000
Hints and CommentsMaterialsAppendix A on Teacher’s Guide pages 61A–62
(Student Book pages 68–70);scientific calculator (one per student)
Overview
Students use the Pythagorean theorem to findmissing side lengths of right triangles. They alsouse this theorem to calculate the length of a vulture’sflight path.
Planning
You may have students work on problem 4individually and use it for informal assessment.Problem 5 can be completed in small groups.
Comments About the Solutions
4. You may use this problem to assess students’ability to use the Pythagorean theorem.
height (in m)
distance (in m)
400
1,000
4
10
2
5
1
2.5

50 Looking at an Angle
Reasoningwith Ratios
E
Notes6c Remind students toapply the Pythagoreantheorem.
6d You may wish to havestudents try to make thistriangle to prove why itwon’t work.You may need to point outthat in the drawing AB � 5cm, representing a lengthof 1,000 m in reality. Tofind the length of AC,students will need thetangent table; to find thelength of BC, they need toapply the Pythagoreantheorem.
7a Make sure studentsnote the scale they usedfor their drawing. (1 cmrepresents 1 m is anappropriate scale.)
7b This problemintroduces cosine, butstudents use a scaledrawing to measure thedistance from the wall.
Reaching All LearnersAccommodation
Help students draw problem 6a by having them draw segment AB first,and then making angle B 40°.
Intervention
You may want to discuss how arrow strings and reverse arrow strings canbe used to solve AC____
5 � 0.839:
If the glide angle is very small, lengths AB and BC will be like they arein problem 5. What happens if the glide angle is greater?
Consider a right triangle with an angle of 40°.
6. a. Use a ruler and a protractor to draw a right triangle ABC.Angle A is the right angle, angle B � 40°, and the length ofAB � 5 cm. AB represents a length of 1,000 m in reality.
b. Use your calculator or the appendix to find tan 40° andcalculate the length of AC in the drawing. Round the answerto whole centimeters.
c. Find the length of BC. Are AC and BC about the same length inthe drawing? In reality?
Nicole wants to draw a right triangle ABC in which angle A is the rightangle and angle B � 80°.
d. Explain why it is not possible to make this drawing in yournotebook. What is the length of BC in this triangle? In reality?
e. What is your conclusion about the lengths of AC and BC if thesize of the glide angle increases?
Directions for painters state that a ladder is placed safely against awall if the angle with the ground is about 70°. Consider a ladder thatis 10 m long.
7. a. Make a drawing to scale of this ladder where it is placed safelyagainst the wall. Show what you did to make the drawing.
b. About how far from the wall is this 10-m ladder?
Reasoning with RatiosE
The Ratios: Tangent, Sine, Cosine
B
Leg
C
LegA
hypotenuse
In right triangles, we have three sides: the hypotenuse (the ladder)and the legs of the right triangle (the height and distance) that helpdefine the glide ratio.
0.839� 5
5
AC____5

Section E: Reasoning with Ratios 50T
7. a.
Answers will vary. Sample response:
First, I made a drawing of a 70° angle. For theladder (BC ) I marked off 10 cm (1 cm in thedrawing stands for 1 m in reality). From thatpoint I drew a line straight down to the ground(AC ); this line represents the wall.
b. The ladder is about 3.5 m from the wall.Sample response:
I use the scale drawing I made in problem 7a.The distance between the ladder and the wall(AB ) is about 3.5 cm. 1 cm stands for 1 m inreality, so AB is in reality 3.5 m.
Solutions and Samples
6. a.
b. Tangent 40° � 0.839.AC____AB � 0.839; AC____
5 � 0.839; AC 5 � 0.839 � 4.195.
Side AC is in the drawing about 4 cm.
c. Using the Pythagorean theorem :
BC 2 � AB 2 AC 2.
BC 2 � 52 42 � 25 16 � 41.
BC 6.4 cm.
In the drawing AC is about 4 cm; in reality it isabout 4 � 200 � 800 m.
In the drawing BC is about 6.4 cm; in realitythis is about 6.4 � 200 � 1,280 m.
BC is longer than AC both in the drawing andin reality. AC is about two thirds of BC .
d. The drawing does not fit on a notebook page;the hypotenuse and the longer leg do not meet.
tan 80° � 5.671AC____AB � 5.671; AC____
5 � 5.671;
AC � 5 � 5.671 �
28.355 28.4 cm
BC 2 � AB 2 AC 2
BC 2 � 52 28.3552 �
25 804 � 829
BC 28.792 cm 28.8 cm
In the drawing, BC is about28.8 cm; in reality this isabout 5,758 m.
e. As the size of the glideangle (B ) increases,the length of sides ACand BC get closer.
C
A B
40
5 cm
BA
80°
Hints and CommentsMaterialsAppendix A on Teacher’s Guide pages 61A–62
(Student Book pages 68–70);calculator (one per student);protractor or compass card (one per student)
Overview
Students solve problems using the tangent ratio andthe Pythagorean theorem. The text at the bottom ofthe page is an introduction to sine and cosine on thefollowing page.
Planning
Students may work on problems 6 and 7 individuallyor in small groups. Discuss students’ answers, asneeded. Read the bottom of the page aloud in class.
C
A B
70°
Ladder10 m

51 Looking at an Angle
Reasoningwith Ratios
E
Notes
Read this page withstudents in class. Usethe student drawingfrom problem 7 on theprevious page to reviewthis notation.
Point out to studentsthat sine and cosinevalues are also includedin Appendix A on StudentBook pages 68–70.
Reaching All LearnersVocabulary Building
The adjacent side is the side which helps form the angle, NOT thehypotenuse!
Intervention
Use the mnemonic, SOH-CAH-TOA, to help students remember theformulas:
SOH (sin � opposite/hypotenuse)
CAH (cos � adjacent/hypotenuse)
TOA (tan � opposite/adjacent)
B
C
A
�
70°A B
C
10 m
eter
s
In addition to the tangent ratio, there are two other ratios whichdescribe a relationship between the sides of a right triangle.
One is the sine ratio, abbreviated sin �.
The other is the cosine ratio, abbreviated cos �.
Notice that for both the sine and the cosine ratios, the hypotenuse isthe “denominator.”
Refer back to your scale drawing of the ladder situation in problem 7where angle A � 70° and the length of the ladder is 10 m.
EReasoning with Ratios
B
C
A
�
horizontal distance of the ladder to the walllength of the ladder
cos � �side adjacent to �
�AB
hypotenuse AC
cos 70° �side adjacent to �
�AB
�hypotenuse AC
sin � �side opposite �
�BC
hypotenuse AC

Section E: Reasoning with Ratios 51T
Hints and CommentsOverviewIn addition to the tangent ratio, on this page studentslearn about the sine and cosine ratio.
About the Mathematics
The concept of tangent is slowly and carefully built inthis unit, eventually using the context of glide ratio asa model for the tangent concept. Formal notation isonly introduced after careful concept building.The introduction of sine and cosine can now be verystraightforward since the basic idea is the same. Thereare just other ratios that can be used, depending onwhat is known and what is needed (a particular sidelength or angle measure).
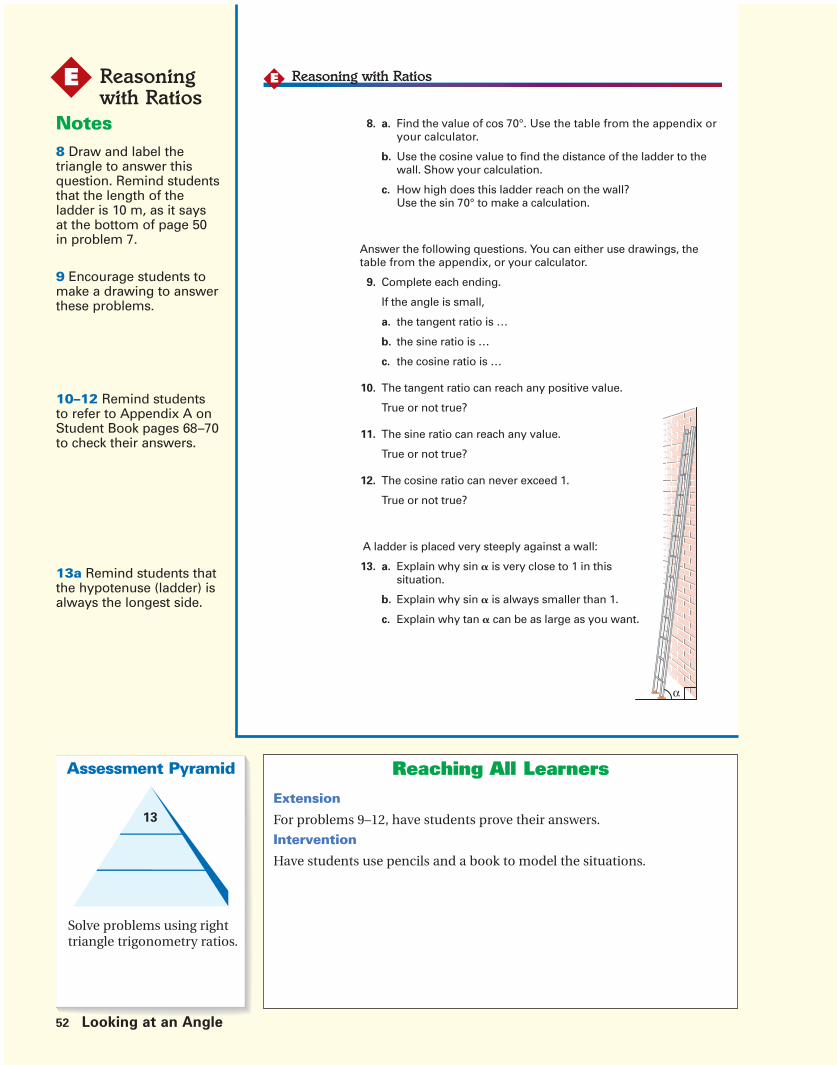
52 Looking at an Angle
Reasoningwith Ratios
E
Assessment Pyramid
13
Solve problems using righttriangle trigonometry ratios.
Notes8 Draw and label thetriangle to answer thisquestion. Remind studentsthat the length of theladder is 10 m, as it saysat the bottom of page 50in problem 7.
9 Encourage students tomake a drawing to answerthese problems.
10–12 Remind studentsto refer to Appendix A onStudent Book pages 68–70to check their answers.
13a Remind students thatthe hypotenuse (ladder) isalways the longest side.
Reaching All LearnersExtension
For problems 9–12, have students prove their answers.
Intervention
Have students use pencils and a book to model the situations.
8. a. Find the value of cos 70°. Use the table from the appendix oryour calculator.
b. Use the cosine value to find the distance of the ladder to thewall. Show your calculation.
c. How high does this ladder reach on the wall?Use the sin 70° to make a calculation.
Answer the following questions. You can either use drawings, thetable from the appendix, or your calculator.
9. Complete each ending.
If the angle is small,
a. the tangent ratio is …
b. the sine ratio is …
c. the cosine ratio is …
10. The tangent ratio can reach any positive value.
True or not true?
11. The sine ratio can reach any value.
True or not true?
12. The cosine ratio can never exceed 1.
True or not true?
A ladder is placed very steeply against a wall:
13. a. Explain why sin � is very close to 1 in thissituation.
b. Explain why sin � is always smaller than 1.
c. Explain why tan � can be as large as you want.
Reasoning with RatiosE
α

Section E: Reasoning with Ratios 52T
Hints and CommentsMaterialsAppendix A on Teacher’s Guide pages 61A–62
(Student Book pages 68–70);scientific calculator (one per student);
Overview
Students work on problems using tangent, sine, andcosine.
Planning
Students may work on problems 8–13 individuallyor in small groups. Discuss students’ answers, asneeded. In any case discuss students’ answers toproblems 8 and 9.
Comments About the Solutions
8. b. Refer back to problem 7b when discussingthis problem.
You may ask students to reflect on both answers.
Sample response:
I get a more precise answer by calculating(3.42 m) than by using the scale drawing(about 3.5 m).
Solutions and Samples
8. a. cos 70° � 0.342
b. cos 70° �distance of ladder to wall
length of the ladder
0.342 �distance of ladder to wall
10
10 � 0.342 � distance of ladder to wall � 3.42 m
c. sin 70° �height reached on wall
length of the ladder
0.940 �height reached on wall
10
10 � 0.940 � height reached on wall � 9.4 m.
9.
If the angle is small,
a. the tangent ratio is small.
b. the sine ratio is small.
c. the cosine ratio is close to 1.
10. True
11. Not true
12. True
13. Explanations may vary. Sample explanations:
a. Angle � is very large and close to 90°, whichmakes the height just a little smaller than thelength of the ladder. Since the sine ratio is theratio of two nearly identical lengths, the ratiois close to 1. This means sin � is almost 1 too.
b. The ladder (hypotenuse) will always be thelongest side. The height can never exceed thelength of the ladder.
c. The tangent ratio is the ratio of the heightreached on the wall to the horizontal distance.As the ladder moves closer to the wall andangle � gets larger and closer to 90°, tan �gets larger.
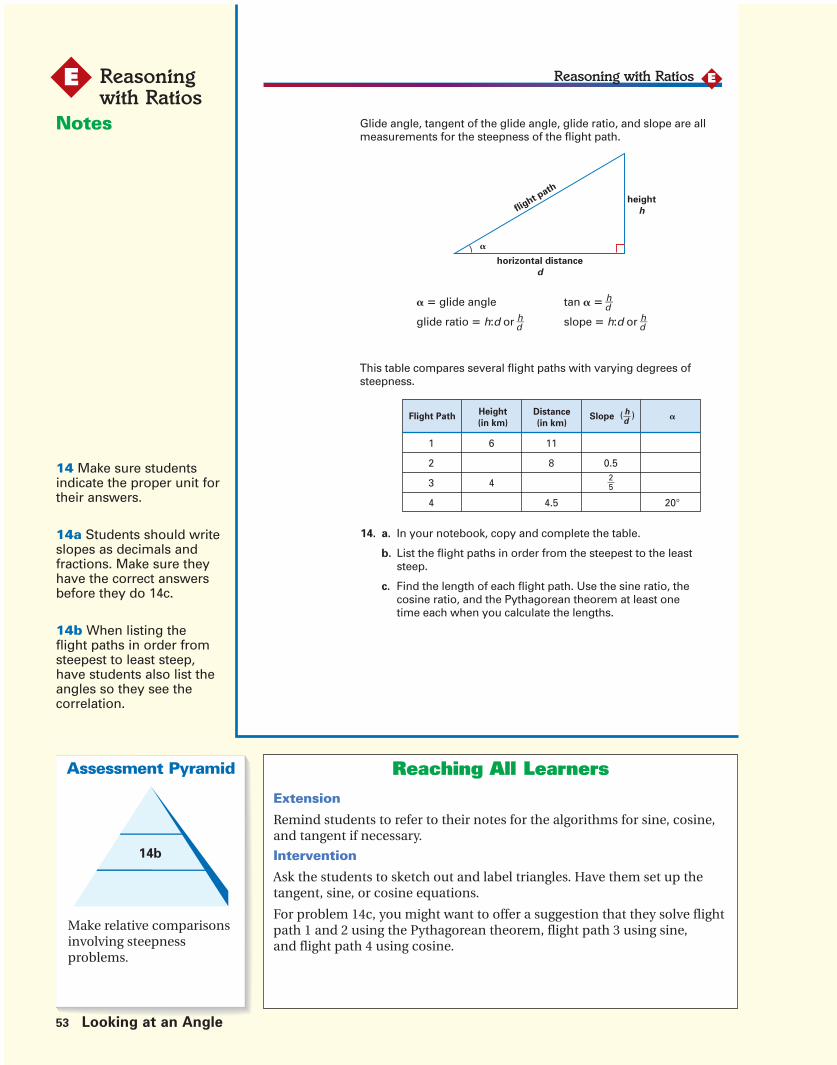
53 Looking at an Angle
Reasoningwith Ratios
E
Assessment Pyramid
14b
Make relative comparisonsinvolving steepnessproblems.
Reaching All LearnersExtension
Remind students to refer to their notes for the algorithms for sine, cosine,and tangent if necessary.
Intervention
Ask the students to sketch out and label triangles. Have them set up thetangent, sine, or cosine equations.
For problem 14c, you might want to offer a suggestion that they solve flightpath 1 and 2 using the Pythagorean theorem, flight path 3 using sine,and flight path 4 using cosine.
Glide angle, tangent of the glide angle, glide ratio, and slope are allmeasurements for the steepness of the flight path.
� � glide angle tan � � h��d
glide ratio � h:d or h��d slope � h:d or h��d
This table compares several flight paths with varying degrees ofsteepness.
14. a. In your notebook, copy and complete the table.
b. List the flight paths in order from the steepest to the leaststeep.
c. Find the length of each flight path. Use the sine ratio, thecosine ratio, and the Pythagorean theorem at least onetime each when you calculate the lengths.
EReasoning with Ratios
height
h
horizontal distance
d
flight p
ath
�
Flight PathHeight
(in km)
Distance
(in km)Slope �
hd
25
( )
1
2
3
6
4
4
11
8 0.5
4.5 20°
Notes
14 Make sure studentsindicate the proper unit fortheir answers.
14a Students should writeslopes as decimals andfractions. Make sure theyhave the correct answersbefore they do 14c.
14b When listing theflight paths in order fromsteepest to least steep,have students also list theangles so they see thecorrelation.

Section E: Reasoning with Ratios 53T
Flight Path 1 is about 12 km.
Using the sine ratio:
sin 29° � h__p � 0.485
6__p � 0.485
So 0.485p � 6
p = 6______0.485 � 12.4 or about 12
Flight Path 4 is about 4.8, or 5 km.
Using the cosine ratio:
cos 20° � d__p � 0.94
4.5____p � 0.94
So 0.94p � 4.5
p � 4.5_____0.94 � 4.8
Solutions and Samples
14. a.
Calculations:
Flight Path 1
tan � � 6___11
� � 28.6° or 29°.
Flight Path 2
Ratio of height to distance is 0.5 or 1__2 .
When d is 8, then h � 4.
tan � � 0.5
� � 26.6° or 27°.
Flight Path 3
Ratio table:
tan � � 2__5
� � 21.8° or 22°.
Flight Path 4
tan 20° � h_____4.5 .
0.364 � h_____4.5
h � 0.364 � 4.5
h � 1.64 or 1.6
Slope = h__d = 1.6____
4.5 � 0.36.
b. Steepest: flight path 1.
then: flight path 2
then: flight path 3
Least steep: flight path 4
c. Flight Path 2 is about 8.9 or 9 km.
Using the Pythagorean Theorem:
Flight path is p.
p2 � 42 � 82
p � ���80 � 8.9 or 9
Flight Path 3 is about 10.8 or 11 km.
Using the Pythagorean Theorem:
p2 � 42 � 102
p � ����116 ≈ 10.8 or 11
Height 2 4
Distance 5 10
Flight PathHeight
(in km)
Distance
(in km)Slope �
hd
25
611
( )
1
2
3
6
4
10
29°
27°
22°
1.6 0.36
4
4
11
8 0.5
4.5 20°
Hints and CommentsOverviewStudents review the different measures for steepnessthey have learned about in this unit. They apply thetangent concept as well as the concepts of sine,cosine, and the Pythagorean theorem to complete atable with flight paths of varying steepness.
About the Mathematics
Note that at the top of this page the term slope is alsoused as a measure of steepness. Students shouldunderstand that slope is the same as the ratio of theheight to the distance, or the glide ratio, or the tangentratio they learned about in this unit. Slope is also usedin the unit Graphing Equations. The term slope is alsoused in the table students will complete in problem 14.Students may think of slope as being the same asglide ratio.
Planning
Read the top of the page in class, paying attention tothe use of the term slope. Students may work onproblem 14 individually. You may want to discussstudents’ answers in class.
Comments About the Solutions
14. a. In order to compare the slopes of the differentflight paths, it would be best to convert theratios and fractions to decimals. You may wantto refer to page 36 for that matter.
b. Encourage students to explain their reasoning.Students by now should understand that thelarger the angle (or the larger the slope), thesteeper the flight path.
c. Students may round off their answers.

54 Looking at an Angle
Reasoningwith Ratios
E
Assessment Pyramid
1
Assesses Section E Goals
Reaching All LearnersAdvanced Learners
Encourage students to further investigate the relationship between the sineand cosine ratios by finding angle pairs for which the ratios for sine andcosine are equal. For example,
sin 30 cos 60sin 90 cos 0sin 10 cos 80sin 25 cos 65
Have students find other angle pairs and encourage students to develop anexplanation of why these angle pairs for sine and cosine have the same ratio.
Reasoning with RatiosE
In this unit, many different situations play a role—vision lines,shadows and light rays, steepness of ladders, glide paths, glideangle, and glide ratios. All situations involve a right triangle, whichplays a vital role.
The steepness of a ladder and the glide ratio can be expressed withthe mathematical ratio called the tangent ratio.
Right triangles were explored somewhat further.
● You made use of the Pythagorean theorem to find an unknownside’s length.
● You investigated two new ratios, the sine ratio and cosine ratio.
A pole 7 m long is placed against a wall at an angle of 45°.
1. How high is BC?
A
45°
B
C

Section E: Reasoning with Ratios 54T
Hints and CommentsOverviewStudents read the Summary, which reviews the mainconcepts covered in this section. Students use theCheck Your Work problems as self-assessment. Theanswers to these problems are also provided onStudent Book page 67.
After students complete Section E, you may assign ashomework appropriate activities from the AdditionalPractice section, located on Student Book page 60.After students have completed Section E, you mayuse the Unit Test with students as a culminatingassessment.
Solutions and SamplesAnswers to Check Your Work
1. BC 4.9, or 5.
Calculation:
sin 45° � BC___7
0.707 � BC___7
0.707 � 7 � BC
BC � 4.949 4.9, or 5

55 Looking at an Angle
Reasoningwith Ratios
E
Assessment Pyramid
2, 3, FFR
Assesses Section E Goals
Notes
Students may round offtheir answers as long asthey indicate that theanswers are approximations.
For Further Reflection
Make sure students’drawings are properlylabeled. You may want toencourage them to useletter labels of the sides fortheir overview.
Reaching All LearnersIntervention
Students may want to turn back to the pages describing the sine, cosine,and tangent ratios.
A roof is constructed according to this diagram:
2. a. How long should AD and DC be?
b. How large is angle A?
The road AC is 10 km long and angle A � 10°.
3. What is height BC at the end of the road?
Make a drawing of a right triangle, labeled ΔPQR. The angle measurement of ∠Q � 90°.
Make an overview of the side ratios—sine, cosine, and tangent—for this triangle.
A
10 km
B
C
A B
D
C
5
12 12

Section E: Reasoning with Ratios 55T
Hints and CommentsOverviewStudents continue using the Check YourWorkproblems as self-assessment.
Solutions and Samples
2. a. AC � BC � 13
Calculation, using the Pythagorean theorem:
AD2 � 52 � 122
AD2 � 25 � 144
AD2 � 169
AD � ����169 � 13
And since AD � DC, DC is also 13.
b. 23°.
Calculation:
tan ∠ A � 5____12
So ∠A � 22.6°, or 23°.
3. BC � 1.74 or 2.
Calculation:
sin 10° � BC___10
0.174 � BC___10
10 � 0.174 � BC
BC � 1.74, or 2
For Further Reflection
Sample response:
PQPR
sin �R � .
RQPR
cos �R � .
PQRQ
tan �R � .
P
QR

Additional Practice SolutionsStudent Page
56 Looking at an Angle Additional Practice Solutions Student Page
The drawings show two boat models made with 1-cm blocks. Imaginethat the boats are sailing in the direction shown by the arrows.
1. On graph paper or Student Activity Sheet 2, make side-view andtop-view drawings of each boat.
2. On your drawings, include vision lines for the captain, who canlook straight ahead and sideways, and shade in the blind area.
3. How many square units is the blind area of boat A? boat B?
4. On your side-view drawings of each boat, measure and label theangle between the water and the vision line.
5. On which boat is the captain’s view the best? Explain.
Additional Practice
Section Now You See It, Now You Don’tA
Captain
Boat A
Boat B
Captain

Section A. Now You See It,Now You Don’t
1. and 2. 3. The blind area of Boat A is 6 square units. Theblind area of Boat B is 18 square units.
4. The angle between the water and the visionline is 45° for Boat A and about 18° for Boat B.
5. The captain of Boat A has a better view.Explanations will vary. Sample explanations:
The captain whose boat has the smallest blindarea will have the best view. Boat A’s blind areais smaller (6 square units) than Boat B’s blindarea (18 square units). Therefore, the captainof Boat A has a better view.
The angle between the water and the visionline for Boat A is larger (45°) than the angle forBoat B (18°). Boat A has a vision line that issteeper, so its blind area is smaller, and itscaptain has a better view.
Additional Practice Solutions Looking at an Angle 56T
Additional Practice Solutions
Top View
Boat A
blindarea Side View
Top View
Boat B
blindarea Side View
Side View
45°
Boat A
Side View
Boat B
18°

Additional Practice SolutionsStudent Page
57 Looking at an Angle Additional Practice Solutions Student Page
Section Shadows and Blind SpotsB
1 m
1.5 m
ray o
f sunlig
ht
sti
ck
shadow
240 m
ray o
f sunlig
ht
he
igh
t
shadow
1. a. If the shadow of the pyramid is pointing northeast, what directionis the shadow of the stick pointing?
b. From what direction is the sunshining?
The picture to the left shows the pyramidand its shadow at the same time of day.The length of the pyramid’s shadow,measured from the center of the pyramid,is 240 m.
2. Compare the height of the stick andthe length of its shadow to find theheight of the pyramid. Explain yourreasoning.
The height of a pyramid can be determined bystudying the shadows caused by the sun.
Suppose that you put a stick into the groundnear a pyramid. As shown in the drawing, thelength of the stick above ground is 1 m, and itsshadow caused by the sun is 1.5 m long.

Additional Practice Solutions
Additional Practice Solutions Looking at an Angle 57T
Section B. Shadows andBlind Spots
1. a. The stick’s shadow is pointing in the samedirection as the pyramid’s shadow—northeast.
b. The sun is shining from the oppositedirection—southwest. Shadows producedby the sun point in the direction oppositethe position of the sun in the sky.
2. The pyramid is 160 meters high. Explanationswill vary. Sample explanations:
• The length of the stick’s shadow is 1.5times the stick’s height. Similarly, thelength of the pyramid’s shadow will be 1.5times the pyramid’s height. Since thepyramid’s shadow is 240 meters long,dividing 240 meters by 1.5 gives theheight of the pyramid: 240 1.5 � 160.So the pyramid is 160 meters high.
• There is a fixed ratio between the heightof an object and the length of its shadowat a certain moment in time. Using aratio table and a height of 160 meters:
• Using language:
For the pyramid the length of the shadow is240 m. So 240:1.5 gives the height of thepyramid, which is 160 m.
Object Height (in m)
Shadow Length (in m)
1
1.5
2
3
160
240
� 2 � 80
Object Height Shadow Length� 1.5
1.5

Additional Practice SolutionsStudent Page
58 Looking at an Angle Additional Practice Solutions Student Page
cliffglider I path
glider I
I path
200 m
50 m
1. Use a compass card or a protractor and a ruler to make side-viewdrawings to scale of the following ladders. Each ladder is leaningagainst a wall.
Ladder A
• The distance between the foot of the ladder and the wall is 3 m.
• The angle between the ladder and the ground is 60°.
Ladder B
• The distance between the foot of the ladder and the wall is 4 m.
• The ladder touches the wall at a height of 6 m.
2. Determine the height-to-distance ratio for each ladder.
3. What is the angle between ladder B and the ground?
4. Which ladder is steeper, ladder A or ladder B? Explain.
Use your calculator or the table in the appendix to solve the followingproblems.
1. a. If tan A � 1���20, what is the measurement of ∠A?
b. If tan B � 20, what is the measurement of ∠B?
Marco is comparing two hang gliders. He takes one test flight witheach glider from a cliff that is 50 m high. The following picture showsthe path for each flight. Note: The picture is not drawn to scale.
Additional Practice
Section Shadows and AnglesC
Section Glide AnglesD

Additional Practice Solutions
Additional Practice Solutions Looking at an Angle 58T
Section C. Shadows and Angles
1. In the sample drawings below, one centimeterrepresents one meter.
2. Ladder A 5.2:3 � 1.7:1 � 1:0.6 � 1.7
Ladder B 6:4 � 1.5:1 � 1:0.7 � 1.5
In order to find the height-to-distance ratio forLadder A, students need to measure the heightof the wall in their scale drawings.
3. About 56°
4. Ladder A is steeper than Ladder B.Explanations will vary. Sample explanation:
The steeper ladder will have a larger anglebetween its foot and the ground. Since theangle between the foot of the ladder and theground is larger for Ladder A (60°) than it isfor Ladder B (56°), Ladder A is steeper thanLadder B.
Section D: Glide Angles
1. a. About 3°
b. About 87°
(Note: Tan A and tan B have opposite h:dratios, 1___
20 and 20. That means that the sumof their angles, 3° 87°, must be 90°.However, due to rounding, students maynot get exactly 90 degrees.)
Ladder A Ladder B
3 m
5.2 m
4 m
6 m
1 m
Scale
60°

Additional Practice SolutionsStudent Page
59 Looking at an Angle Additional Practice Solutions Student Page
Additional Practice
The glide ratio of glider I is 1:20, and glider I travels 200 m fartherthan glider II.
2. What is the glide ratio of glider II?
3. In the picture below, the measurement of ∠D is 45° and themeasurement of ∠A is 30°. If the length of side BD is 10 cm, how long is side AB?
The following picture shows two cliffs that are 100 m apart. One cliffis 20 m high and the other is 30 m high. Imagine that a hang glidertakes off from the top of each cliff. The two hang gliders have thesame glide ratio and land at the same location.
4. How far from each cliff do the gliders land?
5. Suppose that a glider has a glide ratio of 5%.
a. What do you think a glide ratio of 5% means?
b. What is the glide angle for this glider?
A D B
C
30° 45°
100 m
cliffcliff
glider path glider p
ath
20 m 3
0 m

Additional Practice Solutions
Additional Practice Solutions Looking at an Angle 59T
2. The glide ratio for glider II is 1:16. Since theglide ratio of glider I is 1:20, glider I musttravel a distance that is 20 times the heightof the cliff; 20 � 50 meters � 1,000 meters.The difference between the distance traveledby glider I and that traveled by glider II is 200 m,so glider II travels 1,000 m � 200 m � 800 m.Therefore, glider II has a glide ratio of 50:800or 5:80, or 1:16.
3. Side AB is about 17.3 cm long. The tangent ofangle D is tan 45° � 1, so the height-to-distanceratio of side CB to side DB is 1:1. Since side DBis 10 cm long, that means the length of side CBis also 10 cm (10:10 is the same ratio as 1:1).Using the tangent table in Appendix A, youcan find that tan 30° � 0.577, so the height-to-distance ratio of side CB to side AB can befound by using a calculator and the followingratio table:
4. The 30-meter cliff is 1.5 times higher than the20-meter cliff (20 m � 1.5 � 30 m). Becausethe two gliders have the same glide ratio, theglider launched from the 30-meter cliff willtravel a distance that is 1.5 times farther thanthe distance traveled by the glider launchedfrom the 20-meter cliff.
To find the location where the gliders land,divide the distance between the two cliffs(100 m) into two parts that are in the ratio 1:1.5.The ratio 1:1.5 is equal to 2:3 � 4:6 � 40:60.Because 40 60 � 100, the glider on the lefthas to land 40 meters from the left cliff, andthe glider on the right has to land 60 metersfrom the right cliff.
5. a. Answers will vary. Sample response:
A 5% glide ratio means that the hang gliderhas a height to distance ratio of 5:100, or1:20.
b. About 3°. The glide angle � for a glider witha glide ratio of 1:20 is tan � � 1___
20 � 0.05.Using Appendix A, students can find that �is equal to about 3°.
Height of Side CB (in cm)
Distance of Side AB (in cm)
0.577
1
577
1,000
10
17.3
� 1,000 57.7

Additional Practice SolutionsStudent Page
60 Looking at an Angle Additional Practice Solutions Student Page
1. Make a drawing of a right triangle with an angle of 45°. Use thisdrawing to show that sin 45°� cos 45° .
2. Use the drawing from problem 1. Sides AB and BC are 1.
Use the Pythagorean theorem to find the value of sin 45°.
3. Complete the following table:
4. Explain the results of the table by comparing the values for sineand cosine.
Additional Practice
Section Reasoning with RatiosE
� sin � cos �
10°
20°
30°
40°
50°
60°
70°
80°

Additional Practice Solutions
Additional Practice Solutions Looking at an Angle 60T
4. Sample response:
I noticed that sin 10° � cos 80°, andsin 20° � cos 70°, so when two angles aretogether 90°, the sine of one angle equalsthe cosine of the other.
sin � � �BA
CC� � cos (90 � �)
A
45˚
B
C
� sin � cos �
10°
20°
30°
40°
50°
60°
70°
80°
0.174
0.342
0.5
0.643
0.766
0.866
0.940
0.985
0.985
0.940
0.866
0.766
0.643
0.5
0.342
0.174
A B
C
90 � �
�
Section E. Reasoning with Ratios
1.
sin �A � �BA
CC�
cos �A � �AA
BC�
But since �A � 45°: AB � BC and, therefore,sin �A � cos �A.
2. AB 2 BC 2 � AC 2
1 1 � AC 2
AC ���2 � 1.4
sin 45° � �11.4� � 0.7
3.

Appendices
61A Looking at an Angle Appendix A
Appendix A
Angle Degree Sine Cosine Tangent
0° 0.000 1.00 0.000
1° 0.017 1.00 0.017
2° 0.035 0.999 0.035
3° 0.052 0.999 0.052
4° 0.070 0.998 0.070
5° 0.087 0.996 0.087
6° 0.105 0.995 0.105
7° 0.122 0.993 0.123
8° 0.139 0.990 0.141
9° 0.156 0.988 0.158
10° 0.174 0.985 0.176
11° 0.191 0.982 0.194
12° 0.208 0.978 0.213
13° 0.225 0.974 0.231
14° 0.242 0.970 0.249
15° 0.259 0.966 0.268
16° 0.276 0.961 0.287
17° 0.292 0.956 0.306
18° 0.309 0.951 0.325
19° 0.326 0.946 0.344
20° 0.342 0.940 0.360
21° 0.358 0.934 0.384
22° 0.375 0.927 0.404
23° 0.391 0.921 0.424
24° 0.407 0.914 0.445
25° 0.423 0.906 0.466
26° 0.438 0.899 0.488
27° 0.454 0.891 0.510
28° 0.469 0.883 0.532
29° 0.485 0.875 0.554
30° 0.500 0.866 0.577

Appendices
Appendix A Looking at an Angle 61
Angle Degree Sine Cosine Tangent
31° 0.515 0.857 0.601
32° 0.530 0.848 0.625
33° 0.545 0.839 0.649
34° 0.559 0.829 0.675
35° 0.574 0.819 0.700
36° 0.588 0.809 0.727
37° 0.602 0.799 0.754
38° 0.616 0.788 0.781
39° 0.629 0.777 0.810
40° 0.643 0.766 0.839
41° 0.656 0.755 0.869
42° 0.669 0.743 0.900
43° 0.682 0.731 0.933
44° 0.695 0.719 0.966
45° 0.707 0.707 1.000
46° 0.719 0.695 1.036
47° 0.731 0.682 1.072
48° 0.743 0.669 1.111
49° 0.755 0.656 1.150
50° 0.766 0.643 1.192
51° 0.777 0.629 1.235
52° 0.788 0.616 1.280
53° 0.799 0.602 1.327
54° 0.809 0.588 1.376
55° 0.819 0.574 1.428
56° 0.829 0.559 1.483
57° 0.839 0.545 1.540
58° 0.848 0.530 1.600
59° 0.857 0.515 1.664
60° 0.866 0.500 1.732
61° 0.875 0.485 1.804
Appendix A

Appendices
62 Looking at an Angle Appendix A
Angle Degree Sine Cosine Tangent
62° 0.883 0.469 1.881
63° 0.891 0.454 1.963
64° 0.899 0.438 2.050
65° 0.906 0.423 2.145
66° 0.914 0.407 2.246
67° 0.921 0.391 2.356
68° 0.927 0.375 2.475
69° 0.934 0.358 2.605
70° 0.940 0.342 2.748
71° 0.946 0.326 2.904
72° 0.951 0.309 3.078
73° 0.956 0.292 3.271
74° 0.961 0.276 3.487
75° 0.966 0.259 3.732
76° 0.970 0.242 4.011
77° 0.974 0.225 4.332
78° 0.978 0.208 4.705
79° 0.982 0.191 5.145
80° 0.985 0.174 5.671
81° 0.988 0.156 6.314
82° 0.990 0.139 7.115
83° 0.993 0.122 8.144
84° 0.995 0.105 9.514
85° 0.996 0.087 11.43
86° 0.998 0.070 14.30
87° 0.999 0.052 19.08
88° 0.999 0.035 28.64
89° 1.00 0.017 57.29
90° 1.00 0.000
Appendix A

AssessmentAssessment

Assessment Overview
Assessment Overview
Goals Assessment Opportunities Problem Levels
• Understand the concepts of vision line, Quiz 1 Problems 1b, 2abangle, and blind spot. Test Problems 1, 2, 5
• Understand the concept of glide ratio Quiz 2 Problems 1, 3or tangent.
• Construct and measure vision lines and Quiz 1 Problems 1b, 2abblind spots (or light rays and shadows) in Test Problems 3, 5 Itwo- and three-dimensional representations.
• Measure angles. Quiz 1 Problems 1a, 3Test Problem 8
• Make scale drawings of situations. Quiz 2 Problem 3Test Problem 12
• Make relative comparisons involving Quiz 2 Problem 2steepness problems.
• Understand the relationship among Test Problems 9, 11, 12, 13steepness, angle, and height-to-distance
IIratio.
• Understand the ratio between an object Test Problems 6, 7and its shadow caused by the sun fordifferent times of the year.
• Use ratios to solve problems. Test Problems 4, 10
• Solve problems using right triangle Test Problems 9, 10, 13III
trigonometry ratios.
Unit assessments in Mathematics in Context include two quizzesand a Unit Test. Quiz 1 is to be used anytime after students havecompleted Section B. Quiz 2 can be used after students have com-pleted Section D. The Unit Test addresses most of the major goalsof the unit. You can evaluate student responses to these assessmentsto determine what each student knows about the content goalsaddressed in this unit.
Pacing
Each quiz is designed to take approximately 25 minutes to complete.The unit test is designed to be completed during a 45-minute classperiod. For more information on how to use these assessments, seethe Planning Assessment section on the next page.
64 Looking at an Angle Assessment Overview

Assessment Overview
About the Mathematics
These assessment activities assess the majority of the goals forLooking at an Angle. Refer to the Goals and Assessment Opportunitiessections on the previous page for information regarding the goalsthat are assessed in each problem. Some of the problems that involvemultiple skills and processes address more than one unit goal. Toassess students’ ability to engage in non-routine problem solving(a Level III goal in the Assessment Pyramid), some problems assessstudents’ ability to use their skills and conceptual knowledge in newsituations. For example, in Theresa’s blind spot problem on the UnitTest (Problem 4), students must use ratios and a map scale to decidewhether or not the time a friend walks through a blind area isreasonable.
Planning Assessment
These assessments are designed for individual assessment, howeversome problems can be done in pairs or small groups. It is importantthat students work individually if you want to evaluate each student’sunderstanding and abilities.
Make sure you allow enough time for students to complete the prob-lems. If students need more than one class session to complete theproblems, it is suggested that they finish during the next mathematicsclass or you may assign select problems as a take-home activity.Students should be free to solve the problems their own way. Calculatorsmay be used on the quizzes or Unit Test if students choose to use them.
If individual students have difficulties with any particular problems,you may give the student the option of making a second attemptafter providing him/her a hint. You may also decide to use one of theoptional problems or Extension activities not previously done in classas additional assessments for students who need additional help.
Scoring
Solution and scoring guides are included for each quiz and the UnitTest. The method of scoring depends on the types of questions oneach assessment. A holistic scoring approach could also be used toevaluate an entire quiz.
Several problems require students to explain their reasoning or justifytheir answers. For these questions, the reasoning used by students insolving the problems as well as the correctness of the answers, shouldbe considered in your scoring and grading scheme.
Student progress toward goals of the unit should be considered whenreviewing student work. Descriptive statements and specific feedbackare often more informative to students than a total score or grade.You might choose to record descriptive statements of select aspectsof student work as evidence of student progress toward specific goalsof the unit that you have identified as essential.
Assessment Overview Looking at an Angle 65

66 Looking at an Angle Quiz 1 Mathematics in Context
Looking at an Angle Quiz 1 Page 1 of 2
Name ____________________________________________ Date ______________________
Use additional paper as needed.
© E
ncy
clo
pæ
dia
Bri
tan
nic
a, In
c.
Th
is p
age
may
be
rep
rod
uce
d f
or
clas
sro
om
use
.
1. The picture below shows a cross section of a canyon.
The picture shows that in the morning ledge AB lies in the sun.
a. Measure the angle between the sun’s rays and the horizon.
(The angle is indicated in the picture with ?).
A while later, the sun’s rays have just reached C, but the riverbelow is still in the shadow.
b. Make a drawing representing this situation.
BA
C
?

Mathematics in Context Looking at an Angle Quiz 1 67
© E
ncy
clo
pæ
dia
Bri
tan
nic
a, In
c.
Th
is p
age
may
be
rep
rod
uce
d f
or
clas
sro
om
use
.
Page 2 of 2 Looking at an Angle Quiz 1
2.
This is a picture of a lamp casting a shadow of a ball onthe ground. The ball was deleted from the picture.
a. In the picture above, draw two possible positions forthe ball.
b. Is it possible to get this shadow if the ball is lying onthe ground? Explain.

68 Looking at an Angle Quiz 2 Mathematics in Context
Looking at an Angle Quiz 2 Page 1 of 2
Name ____________________________________________ Date ______________________
Use additional paper as needed.
© E
ncy
clo
pæ
dia
Bri
tan
nic
a, In
c.
Th
is p
age
may
be
rep
rod
uce
d f
or
clas
sro
om
use
.
1. The picture below shows a cross section of a canyon.
• The drawing is not to scale.
• The east rim is 100 meters lower than the west rim.
• A glider flies above point A, 50 meters above the rim.
• The canyon rims are, horizontally, 2 kilometers apart.
Can the glider with a glide ratio of 1:22 safely reach the east rim?Show your work.
A
West
East

Mathematics in Context Looking at an Angle Quiz 2 69
© E
ncy
clo
pæ
dia
Bri
tan
nic
a, In
c.
Th
is p
age
may
be
rep
rod
uce
d f
or
clas
sro
om
use
.
Page 2 of 2 Looking at an Angle Quiz 2
2. Excellent high-tech sail planes have a glide ratio betterthan 1:40. What is the glide angle of these sail planes andthe tangent of the glide angle?
3. For a ladder to be considered safe, it is important that thetangent of the angle between the ladder and the floor isbetween 3 and 4. What angle measures between the ladderand the floor are safe?

70 Looking at an Angle Unit Test Mathematics in Context
Looking at an Angle Unit Test Page 1 of 6
Name ____________________________________________ Date ______________________
Use additional paper as needed.
© E
ncy
clo
pæ
dia
Bri
tan
nic
a, In
c.
Th
is p
age
may
be
rep
rod
uce
d f
or
clas
sro
om
use
.
Use additional paper as needed.
Investigating the Mammoth Rocks
Two scientists, Jorge and Theresa, are studying in the southwestern partof the United States. They are investigating rock formations, deserts,plants, and animals. They are an adventurous pair—hiking in canyons,climbing rocks, and hang gliding are some of their favorite ways to exploreand investigate. Today they are working in Mammoth Rock Country.
Mammoth Rock Country
Shown below is a map of the area where they are working.
River
Lonely Tree Trail
Big Mammoth Rock
Little Mammoth Rock
Map of Mammoth Rock Country
B
A
N
0 200 400 600 800 1,000 m
Arch

Mathematics in Context Looking at an Angle Unit Test 71
© E
ncy
clo
pæ
dia
Bri
tan
nic
a, In
c.
Th
is p
age
may
be
rep
rod
uce
d f
or
clas
sro
om
use
.
Page 2 of 6 Looking at an Angle Unit Test
Shown below is a picture that was taken in Mammoth Rock Country.
1. Find a location on the map where the photographer may have beenstanding while taking this picture. Mark the spot with an “X” on themap on the previous page.
Jorge and Theresa have just climbed Little Mammoth Rock. Theresais at point A, about to take a hang glider flight. However, she willonly start the flight when Jorge has descended the rock and hasarrived at point B. Jorge is following the trail as he hikes. Theresawatches him from where she is sitting at point A. After a while, nearLonely Tree, Jorge disappears behind Big Mammoth Rock. Theresawaits and waits, but Jorge seems to stay out of sight forever. He hasbeen in the “blind area” for half an hour.
2. Outline the blind area behind the rock on the map on the previouspage.
3. How long is the part of the trail in that blind area? Make an estimateusing the scale line.

72 Looking at an Angle Unit Test Mathematics in Context
Looking at an Angle Unit Test Page 3 of 6
Name ____________________________________________ Date ______________________
Use additional paper as needed.
© E
ncy
clo
pæ
dia
Bri
tan
nic
a, In
c.
Th
is p
age
may
be
rep
rod
uce
d f
or
clas
sro
om
use
.
Use additional paper as needed.
Under normal circumstances, a person can walk about 2 or 3 kilometersper hour.
4. Is there a reason for Theresa to be worried? Explain your answer.
As Theresa waits for Jorge to reappear, she wonders if he is walking in the shadow of the rock or in the sun. She notices that the shadow ofLittle Mammoth Rock just reaches the bottom of Big Mammoth Rock.Theresa knows that Little Mammoth Rock is twice the height of BigMammoth Rock. She draws the shadow on the map. It looks like this:
5. Draw the shadow of Big Mammoth Rock in the picture above. Be precise in drawing the shadow’s length and direction.
River
Lonely Tree Trail
Big Mammoth Rock
Little Mammoth Rock
Shadow
B
A
N
0 200 400 600 800 1,000 m
Arch

Mathematics in Context Looking at an Angle Unit Test 73
© E
ncy
clo
pæ
dia
Bri
tan
nic
a, In
c.
Th
is p
age
may
be
rep
rod
uce
d f
or
clas
sro
om
use
.
Page 4 of 6 Looking at an Angle Unit Test
Below you see three top-view drawings of the arch and itsshadow at different times on one day.
6. In which order were these drawings made?
7. Draw the shadow of the arch at sunset in the picture below.Be precise in drawing the shadow’s length and direction.Explain why you drew the shadow that way.
N N N
Arch ArchArch
i ii iii
N
Arch

74 Looking at an Angle Unit Test Mathematics in Context
Looking at an Angle Unit Test Page 5 of 6
Name ____________________________________________ Date ______________________
Use additional paper as needed.
© E
ncy
clo
pæ
dia
Bri
tan
nic
a, In
c.
Th
is p
age
may
be
rep
rod
uce
d f
or
clas
sro
om
use
.
Use additional paper as needed.
Below is a sketch of a side view of the two rocks. The linerepresents the sun’s ray. The distance between the two rocksis 910 meters.
8. Measure the angle between the sun’s ray and the horizon witha compass card or protractor.
9. Compute the height of Little Mammoth Rock. Show your work.
Hours later, the rock’s shadow is six times longer than the heightof the rock.
10. Compute the angle between the sun’s ray and the horizon inthis situation. Write an explanation of how you found theanswer. Show your work.
Sun’s Ray
910 m

Mathematics in Context Looking at an Angle Unit Test 75
© E
ncy
clo
pæ
dia
Bri
tan
nic
a, In
c.
Th
is p
age
may
be
rep
rod
uce
d f
or
clas
sro
om
use
.
Page 6 of 6 Looking at an Angle Unit Test
Finally, Jorge reappears behind Big Mammoth Rock. He uses his walkie-talkie to tell Theresa that an injured hiker has been calling for help. Thehiker is on the other side of the river near the arch (see the map). He asksTheresa to fly in her hang glider across the river to the hiker in order tohelp him. Theresa tells Jorge that she is not sure she can reach that spot.Her hang glider has a glide ratio of 1:6.5.
11. Can Theresa reach the wounded hiker with her hang glider from LittleMammoth Rock? Show your work.
(Note: to solve this problem you need the height of the Little MammothRock you calculated in problem 9. If you haven't found an answer forproblem 9, you can use for problem 11 a height of 350 meters.)
The distance between Big Mammoth Rock and Little Mammoth Rock (AC )is 910 m. For the height of the Little Mammoth Rock you can use youranswer from problem 9, or you can use a height of 350 meters.
12. Find the length of AB using the Pythagorean theorem. Show your work.
13. Find the length of AB using sine or cosine. Show your work.
Sun’s Ray
AA CC
B

Looking at an Angle Quiz 1Solution and Scoring Guide
76 Looking at an Angle Quiz 1 Mathematics in Context
Possible student answer Suggested number Problem levelof score points
1. a. The angle is about 55°. 2 I
b. 3 I
2. a. Student answers may vary. See example: 3 I
b. Yes. See drawing: 2 I
Total score points 10
BA
C
(Award 1 score pointfor each correct
position of the ball, 1 score point for accuracy
of the drawing.)

Looking at an Angle Quiz 2Solution and Scoring Guide
Mathematics in Context Looking at an Angle Quiz 2 77
Possible student answer Suggested number Problem levelof score points
1. Student answers may vary. See example: 4 I
This sketch shows that the glider is at a point150 m higher than the point it needs to reach. It needs to cover a horizontal distance of 2,000 m.The glider has a glide ratio of 1:22. This meansthat for every meter height it can cover 22 mdistance. From a height of 150 m, it can covera distance of 22 � 150 m � 3,300 m. It needs tocover only 2,000 m. So the glider can easily reachthe east rim. (Students could also include thefollowing: Since the ratio 150:2,000 > 1:22, theglider can safely reach the east rim.)
2. Answers may vary. Example: 3 II
The glide ratio is better than 1:40 or, as a decimal,0.025. The tangent table shows that an anglebetween 1° and 2° (say 1.5°) would give a tangentof 0.025. If the glide ratio should be better than1:40, this means that the glide angle should besmaller than 1.5° and the tangent should besmaller than 0.025. The smaller the glide angle, thesmaller the tangent and the better the glide ratio.
3. A safe angle for the ladder is between 72° and 75°. 3 I
Answers may vary. Example:
The tangent table shows that:an angle of 71° gives a tangent of 2.904;an angle of 72° gives a tangent of 3.078.This means that the angle should be no smaller than 72°.
The tangent table also shows that:an angle of 75° gives a tangent of 3.732;an angle of 76° gives a tangent of 4.011.This means that the angle should be no bigger than 75°.
Total score points 10
West
East
50 m
100 m
150 m
2,000 m
(Award 3 points for a correct explanation,
1 point for a correct conclusion.)

Looking at an Angle Unit TestSolution and Scoring Guide
78 Looking at an Angle Unit Test Mathematics in Context
Possible student answer Suggested number Problem levelof score points
1. Answers will vary. Sample response: 1 I
2. 2 I
3. Answers will vary. Accept estimates from 1 I500–600 meters.
4. Answers and explanations will vary. 2 IIISample explanation:
Walking at 2 kilometers an hour means that a person can walk 1 kilometer in half an hour. Since that section of the trail is closer to 1__2 kilo-meter than to 1 kilometer, Theresa should begin to worry because he can walk that distance inabout 15 minutes. However, waiting 15 minutesmay feel like a very long time.
X
Lonely Tree Trail
Big Mammoth Rock
LittleMammothRock
B
A
N
0 200 400 600 800 1,000 m
Arch
River
Lonely Tree Trail
LittleMammothRock
B
A
N
0 200 400 600 800 1,000 m
Arch
Big Mammoth Rock
(Award 1 point for each correct vision line.)
(Award 1 point for a correct explanation,
1 point for a correct conclusion.)

Looking at an Angle Unit TestSolution and Scoring Guide
Mathematics in Context Looking at an Angle Unit Test 79
Possible student answer Suggested number Problem levelof score points
5. 2 I
Since Little Mammoth Rock is twice as tall asBig Mammoth Rock, its shadow must be twiceas long. Little Mammoth Rock’s shadow measuresabout 3.6 cm on the student page, so Big MammothRock’s shadow should be about 1.8 cm long.The shadow of Big Mammoth Rock should pointin the same direction as the shadow of LittleMammoth Rock.
6. The correct order of the pictures is ii, i, iii. 2 IIExplanations will vary.
Sample explanation:In picture i, the sun is shining from the south;in picture ii, it is shining from the southeast; andin picture iii, it is shining from the southwest.Since the sun rises in the east and sets in the west,the correct order of the pictures is ii, i, iii.
7. 2 II
The sun sets in the west. At sunset, the shadowof the arch will be very long and will point tothe east.
8. The angle is 23°. (Note: Accept 22°, 23°, or 24°) 2 I
River
Lonely Tree Trail
Big MammothRock
Little MammothRock
Shadow
B
A
N
0 200 400 600 800 1,000 m
Arch
(Award 1 point foreach correct shadow.An explanation isnot necessary.)
NArch
(Award 1 point fora correct answer,
1 point for acorrect explanation.)

Looking at an Angle Unit TestSolution and Scoring Guide
80 Looking at an Angle Unit Test Mathematics in Context
Possible student answer Suggested number Problem levelof score points
9. 386 meters 2 II/III
The angle of the sun’s ray is 23°. The tangent of 23° is equal to the height of the rock divided by the length of its shadow:
tan of 23° � 0.424 � �9h10� m
h � 0.424 � 910 m � 386 meters
Note: If the angle was measured at 22°, then the height is 368 meters. If the angle was measured at24°, then the height is 405 meters.
10. The angle between the sun’s ray and the ground 3 IIIis about 9.5°.
Some students may reason that since the shadow is six times longer than the height of the rock, the ratio of the height to the length of the shadow is h:d � 1:6, or 0.167.
Using the tangent table or calculator, students should find that a tangent of 0.167 corresponds to an angle of between 9° and 10°.
h � 386d � 6 � 386 � 2,316so 386 2,316 � 0.167
11. Yes. Strategies will vary. Sample strategy: 3 II
From Little Mammoth Rock to the arch isapproximately 1,800 meters. Theresa may use a ratio table to find out whether she can reach the injured hiker.
The ratio table shows that if Theresa launches herglider from a height of 300 meters, she can go1,950 meters. Since Little Mammoth is 386 metershigh, she will make it.
(Award 1 point for a correct answer,
1 point for correct student work.)
(Award 1 point for a correct estimate,
2 points for a correct explanation.)
1
6.5
Height (in m)
Distance (in m)
10
65
100
650
200
1,300
300
1,950
column 3� 10 � 10 � 2
(Award 1 point for a correct answer,
2 points for a correct explanation.)

Looking at an Angle Unit TestSolution and Scoring Guide
Mathematics in Context Looking at an Angle Unit Test 81
Possible student answer Suggested number Problem levelof score points
12. 9102 3862 � AB 2 3 I/II
828,100 148,996 � AB 2
977096 � AB 2
AB � 988 m
Using 350 m as height:
9102 3502 � AB 2
828,100 122,500 � AB 2
950,600 � AB 2
AB � 975 m
13. �A � 23° (see problem 8) 3 II/III
sin 23° � �BA
CB�
0.391 � �3A8B6
�
0.391 � AB � 386
AB � 386���0.391 � 987 m
Using 350 m:
0.391 � AB � 350
AB � 350���0.391 � 895 m
Total score points 28
(Award 1 point for a correct answer,
2 points for correctstudent work.)
(Award 1 point for a correct answer,
2 points for correctstudent work.)
If students do not have a correct measurement
for �A in problem 8, they should receive fullcredit if they used the
angle they found correctlyfor this problem.

Glossary
82 Looking at an Angle Glossary
GlossaryThe Glossary defines all vocabulary words indicated in this unit. It includesthe mathematical terms that may be new to students, as well as words havingto do with the contexts introduced in the unit. (Note: The Student Book has noGlossary. Instead, students are encouraged to construct their own definitions,based on their personal experiences with the unit activities.)
The definitions below are specific for the use of the terms in this unit.The page numbers given are from the Student Book.
alpha (�) (p. 28) the first letter of the Greek alphabet, used to representan angle
beta (�) (p. 28) the second letter of the Greek alphabet, used to representan angle
blind area (p. 10) an area that cannot be seen because something isblocking the view; a blind spot
blind spot (p. 10) an area that cannot be seen because something isblocking the view; a blind area
cosine of an angle (p. 51) in a right triangle, the ratio of the sideadjacent to the angle to the hypotenuse
gamma (�) (p. 28) the third letter of the Greek alphabet, used to representan angle
glide angle (p. 36) the angle a glider makes with the ground as it descends
glide ratio (p. 34) the ratio of how far a glider will drop in height (h) to thedistance (d ) it travels in a horizontal direction, or h:d
sine ratio (p. 51) in a right triangle, the ratio of the side opposite the angleto the hypotenuse
steepness (p. 26) the ratio of the height (h) to the distance (d ), or h:d
tangent of an angle (p. 37) in a right triangle, the ratio of the sideopposite the angle to the side adjacent to the angle, or height:distance
vision line (p. 6) an imaginary straight line from a person’s eye to an object

BlacklineMasters
BlacklineMasters

84 Looking at an Angle Letter to the Family
Letter to the Family
Dear Family,
Your child will soon begin the Mathematics in Context unitLooking at an Angle. Below is a letter to your child that describes the unit and its goals.
In one section of the unit, your child will study how the angle of thesun or the distance of a light source affects the length of a shadow.You and your child might examine the changes in the length of ashadow of a tree and the corresponding angle of the sun at differenttimes of the day. Your child then can modelwhat you observed outside by holding aflashlight at different angles to change the length of the shadow of a householdobject.
You and your child might also talk aboutthe blind spots that exist for the driver ofa car. While you move to different posi-tions around your parked car, your childcan sit in the driver’s seat and indicatewhen he or she cannot see you. Yourchild then can sketch diagrams of thecar’s blind spots.
We hope you enjoy these ways of “looking at an angle” with your child.
Sincerely,
The Mathematics inContext DevelopmentTeam
vi Looking at an Angle
Dear Student,
Welcome to Looking at an Angle!In this unit, you will learn about vision lines and blind areas. Have
you ever been on one of the top floors of a tall office or apartment
building? When you looked out the window, were you able to see the
sidewalk directly below the building? If you could see the sidewalk, it
was in your field of vision; if you could not see the sidewalk, it was in
a blind spot.
The relationship between vision lines and rays of light and the relationship betweenblind spots and shadows are some of thetopics that you will explore in this unit.Have you ever noticed how the length of a shadow varies according to the timeof day? As part of an activity, you willmeasure the length of the shadow of astick and the corresponding angle of thesun at different times of the day. You willthen determine how the angle of the sunaffects the length of a shadow.
Besides looking at the angle of the sun, youwill also study the angle that a ladder makeswith the floor when it is leaning against a walland the angle that a descending hang glidermakes with the ground. You will learn two different ways to identify the steepness of anobject: the angle the object makes with theground and the tangent of that angle.We hope you enjoy discovering the many ways of “looking at
an angle.”
Sincerely,The Mathematics in Context Development Team
shadow
sun rays
© E
ncy
clo
pæ
dia
Bri
tan
nic
a, In
c.
Th
is p
age
may
be
rep
rod
uce
d f
or
clas
sro
om
use
.

Student Activity Sheet 1 Looking at an Angle 85
Student Activity Sheet 1Use with Looking at an Angle, page 7.
Name _______________________________________
Bo
at A
Bo
at B
Bo
at C
Bo
at D
Cap
tain
Cap
tain
Cap
tain C
apta
in
© E
ncy
clo
pæ
dia
Bri
tan
nic
a, In
c.
Th
is p
age
may
be
rep
rod
uce
d f
or
clas
sro
om
use
.

Student Activity Sheet 2Use with Looking at an Angle,pages 8 and 56.
Name _______________________________________
86 Looking at an Angle Student Activity Sheet 2
© E
ncy
clo
pæ
dia
Bri
tan
nic
a, In
c.
Th
is p
age
may
be
rep
rod
uce
d f
or
clas
sro
om
use
.
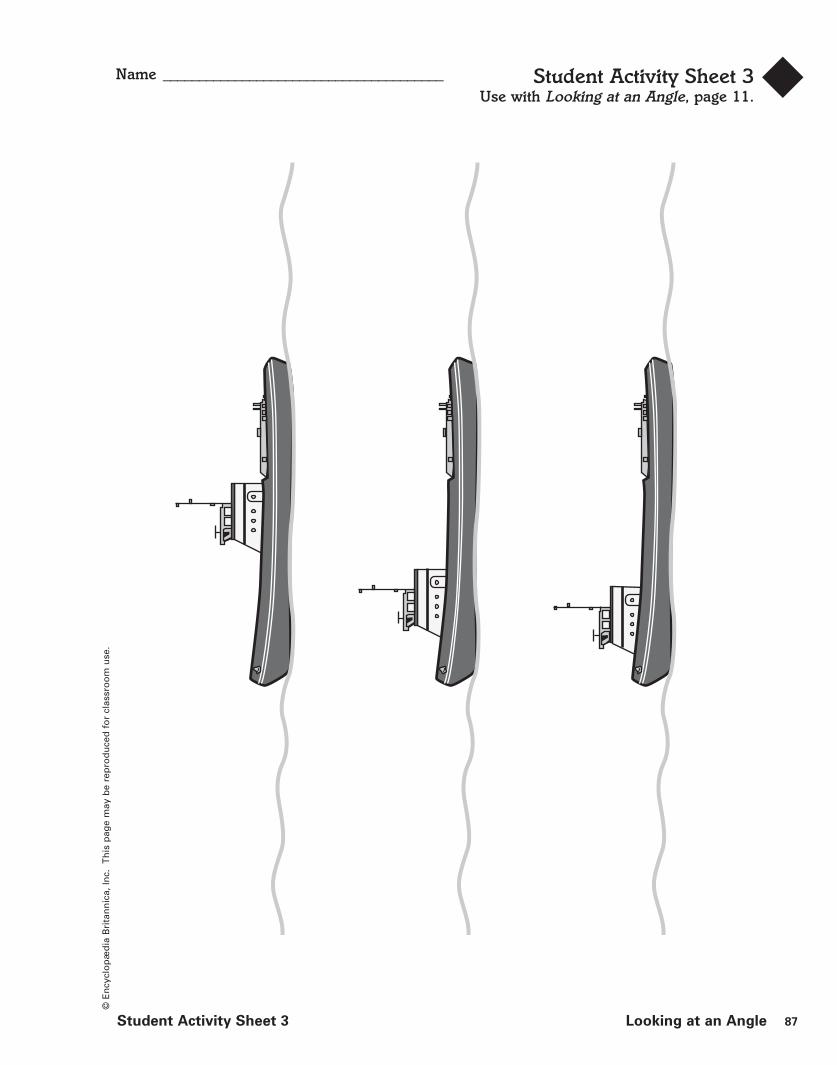
Student Activity Sheet 3Use with Looking at an Angle, page 11.
Name _______________________________________
Student Activity Sheet 3 Looking at an Angle 87
© E
ncy
clo
pæ
dia
Bri
tan
nic
a, In
c.
Th
is p
age
may
be
rep
rod
uce
d f
or
clas
sro
om
use
.

Student Activity Sheet 4Use with Looking at an Angle, page 16.
Name _______________________________________
88 Looking at an Angle Student Activity Sheet 4
© E
ncy
clo
pæ
dia
Bri
tan
nic
a, In
c.
Th
is p
age
may
be
rep
rod
uce
d f
or
clas
sro
om
use
.
Nam
e:
40
8070
6050
3020 10
fold
3
fold 2
fold 1
fold
4
fold 2

Student Activity Sheet 5Use with Looking at an Angle, page 19.
Name _______________________________________
Student Activity Sheet 5 Looking at an Angle 89
© E
ncy
clo
pæ
dia
Bri
tan
nic
a, In
c.
Th
is p
age
may
be
rep
rod
uce
d f
or
clas
sro
om
use
.

Student Activity Sheet 6Use with Looking at an Angle, page 21.
Name _______________________________________
90 Looking at an Angle Student Activity Sheet 6
© E
ncy
clo
pæ
dia
Bri
tan
nic
a, In
c.
Th
is p
age
may
be
rep
rod
uce
d f
or
clas
sro
om
use
.
Side View
Fro
nt V
iew
Top View

Student Activity Sheet 7Use with Looking at an Angle, page 21.
Name _______________________________________
Student Activity Sheet 7 Looking at an Angle 91
© E
ncy
clo
pæ
dia
Bri
tan
nic
a, In
c.
Th
is p
age
may
be
rep
rod
uce
d f
or
clas
sro
om
use
.

Student Activity Sheet 8Use with Looking at an Angle,pages 22 and 23.
Name _______________________________________
92 Looking at an Angle Student Activity Sheet 8
© E
ncy
clo
pæ
dia
Bri
tan
nic
a, In
c.
Th
is p
age
may
be
rep
rod
uce
d f
or
clas
sro
om
use
.
A
A
B

Student Activity Sheet 9Use with Looking at an Angle, page 24.
Name _______________________________________
Student Activity Sheet 9 Looking at an Angle 93
© E
ncy
clo
pæ
dia
Bri
tan
nic
a, In
c.
Th
is p
age
may
be
rep
rod
uce
d f
or
clas
sro
om
use
.
S
EN
W
S
EN
W
S
EN
W
S
EN
W
Picture A
Picture B
Picture C
Picture D

Student Activity Sheet 10Use with Looking at an Angle, page 26.
Name _______________________________________
94 Looking at an Angle Student Activity Sheet 10
© E
ncy
clo
pæ
dia
Bri
tan
nic
a, In
c.
Th
is p
age
may
be
rep
rod
uce
d f
or
clas
sro
om
use
.
Picture A
Picture B
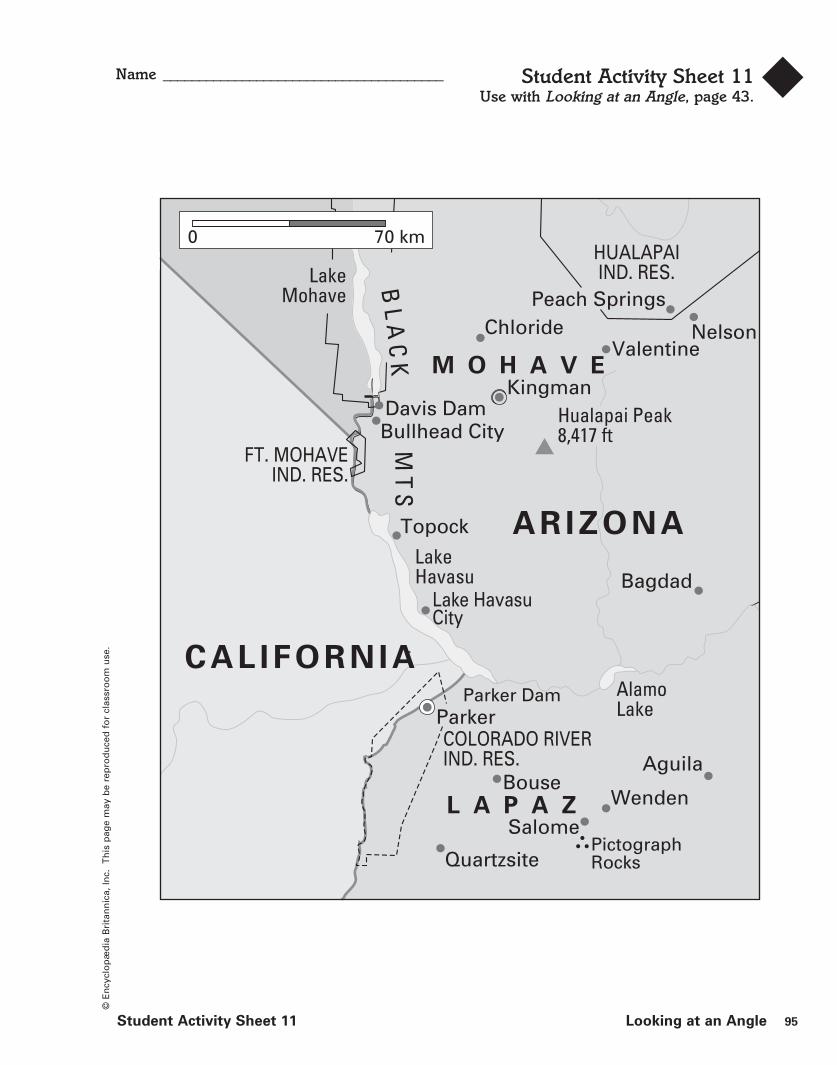
Student Activity Sheet 11Use with Looking at an Angle, page 43.
Name _______________________________________
Student Activity Sheet 11 Looking at an Angle 95
© E
ncy
clo
pæ
dia
Bri
tan
nic
a, In
c.
Th
is p
age
may
be
rep
rod
uce
d f
or
clas
sro
om
use
.
Davis DamBullhead City
KingmanHualapai Peak8,417 ft
ChloridePeach Springs
HUALAPAIIND. RES.Lake
Mohave
FT. MOHAVEIND. RES.
CAL IFORNIA
Lake HavasuCity
LakeHavasu
Parker DamParkerCOLORADO RIVERIND. RES.
AlamoLake
WendenBouse
PictographRocks
Salome
Quartzsite
ValentineNelson
Bagdad
Topock
L A P A Z
M O H A V E
BL
AC
KM
TS
0 70 km
ARIZONA
Aguila

Teaching Transparency: Large Compass Cards1
96 Looking at an Angle Teaching Transparency
N
S
EW
NE
NW
SW
SE
0 10 2030
40
5060
7080
90100
110120
130
140150
160170180190200210
220
230
240
250
26027
028
029
030
031
0
320330
340 350
N
S
EW
NE
NW
SWSE
0 10 2030
40
5060
7080
90100
110120
130
140150
160170180190200210
220
230
240
250
26027
028
029
030
031
0
320330
340 350
© E
ncy
clo
pæ
dia
Bri
tan
nic
a, In
c. T
his
pag
e m
ay b
e re
pro
du
ced
fo
r cl
assr
oo
m u
se.
1


