looking ahead as central banks look up issue flff second quarter fi5fl6 rathbones.com 3 equity...
TRANSCRIPT

In brief
Inflated expectationsConcerns that inflation is about to take off appear unjustified Trade warsUS tariffs could end up biting the hand that feeds the consumer
Portfolio ‘protectionism’How diversification can help returns through all conditions
Good value or value trap?UK equities look attractive across various valuation measures
Investors have started to worry about the prospect of rising rates, inflation and bond yields on stock market returns
Looking ahead as central banks look up
Issue 16 — Second quarter 2018

2 rathbones.com InvestmentInsights | Issue 16 | Second quarter 2018
The threat of higher inflation and rising interest rates spooked global stock markets in February and pushed up government bond yields. We expect the trend of rising yields to persist and be a dominant investment theme over the coming year, with implications for equities. In our lead article, we explore how far yields are likely to rise from here and how rapidly.
In the US, reports of jobs and wage growth have been stronger than expected recently, raising concerns that inflation could be about to pick up. However, we are not expecting a sharp change over the next few months, and the evidence suggests it’s unlikely that either a profoundly inflationary or deflationary environment will unfold over the longer term, as we set out on page 5.
Meanwhile, protectionism had gone quiet until early March when Donald Trump announced a spate of tariffs. If they’re carried through and trigger a wider trade war, tariffs could destroy many more jobs than they create. In our article on page 6 we look at President Trump’s history of protectionist leanings and what that might mean for the global economic outlook.
Elsewhere, 10-year gilt yields have been rising steadily since the start of 2018 to a high of 1.6% in February. For the first time in a while, they are looking like a viable alternative to holding cash in portfolios. In our penultimate article, on page 8, we also explore the importance of diversification in a multi-asset strategy and how alternative strategies can introduce sources of return that are uncorrelated with equities and bonds.
UK equities underperformed other major developed markets so far in 2018, extending a pattern that has been in place since the June 2016 vote to leave the European Union (EU). Following this poor run, we believe UK shares look attractive across various measures of value, as we set out on page 9.
I hope you enjoy this edition of Investment Insights. Please visit rathbones.com to explore our latest views on the issues shaping financial markets this year and beyond.
Julian ChillingworthChief Investment Officer
Foreword

rathbones.com 3InvestmentInsights | Issue 16 | Second quarter 2018
Equity markets and rising bonds yields
Looking ahead as central banks look up
In trying to find an answer, the first step is to establish the ‘neutral’ or ‘equilibrium’ real interest rate (which adjusts for inflation). The equilibrium real interest rate is the most important factor that determines bond yields. Changes in inflation and cyclical deviations in growth expectations as well as other factors, such as the impact of quantitative easing (QE), cause oscillations around the neutral real rate but it’s the neutral real rate that establishes an anchor around which bond yields are unlikely to stray too far.
One approach is to assume the neutral rate is related to potential GDP growth, which is the rate an economy can absorb without pushing inflation higher. If we estimate potential GDP growth at 2% then some statistical analysis tells us that this implies a neutral real rate of 0%. Adding 2% for inflation expectations (which is the average over the past 20 years) and an average spread of 1.25% for the 10-year Treasury yield over nominal interest rates gives an equilibrium 10-year yield of around 3.25%. The Laubach and Williams model used by Federal Reserve (Fed) economists, which applies more sophisticated techniques to the same simple concept, also estimates the neutral real rate at 0%.
In theory, real rates are dictated by desired net savings — if there is a greater desire to save than there is to invest, interest rates will fall to bring the two back into equilibrium (i.e. making saving less attractive relative to investing), and vice versa. Desired net savings are influenced by more than GDP growth: for example, a 2015 Bank of England paper estimated that as much as two-thirds of
the fall in real interest rates over the past three decades has been caused by other structural factors.
One major factor is demographics. Typically, people aged 30 to 65 are savers, while everyone else is a spender. In the past, the ratio of the two groups has had a close relationship with interest rates and bond yields (e.g. a higher ratio of savers to spenders puts downward pressure on interest rates and bond yields). Projecting the relative size of these two age groups over the next decade suggests an ‘equilibrium’ bond yield of between 2.75% and 3%.
Lastly, market expectations, which we can derive from interest rate and inflation swaps (a type of derivative contract), also suggest a neutral real rate of 0% (figure 1), and so an equilibrium bond yield of around 3.25%.
The next step is to ask whether bond yields are likely to stray beyond the 2.75%
to 3.25% equilibrium rate in the short term. With the 10-year Treasury already around 2.9%, this is a clear risk.
There are upside risks to inflation and inflation expectations from wages, fiscal stimulus and changes in the dollar. (You can read more about our view in the next article on page 5). However, we believe these factors won’t put an extraordinary amount of pressure on inflation this year.
Leading indicators of US economic activity, such as new orders in the non-manufacturing sector, are reaching new post-financial crisis highs. So the scope for growth expectations to put upward pressure on bond yields is limited, but not out of the question. The huge US Budget splurge could start to feed through. Tax cuts will put more money in the pockets of workers and investors which will encourage them to spend more. However, the Budget will do very little for the economy’s potential supply
The relationship between economic growth, inflation expectations and government bond yields is likely to be a dominant investment theme throughout 2018. Already this year financial markets have been spooked by the prospect of higher inflation and higher bond yields. The important question now is how far and how fast will yields rise from here?
Source: Datastream and Rathbones.
Figure 1: Implied real neutral interest ratesMarket expectations, which we can derive from interest rate and inflation swaps, suggest a neutral real rate of 0%, and an equilibrium bond yield of around 3.25%.
US EU
-2
-1
0
1
2
3
4
2017201620152014201320122011201020092008200720062005
%
4 rathbones.com InvestmentInsights | Issue 16 | Second quarter 2018
Equity markets and rising bonds yields
and, therefore, add marginally to upward inflation pressures too.
The long and shortAnother issue to consider is that the US Treasury will have to issue more bonds to pay for the boost in government spending. As a result, the bond term premium (the bonus investors traditionally receive for the added risk of holding bonds for a longer time) could rise due to changes in supply and demand.
Term premia are influenced by other economies’ central banks, and could also be pushed higher if the European Central Bank (ECB) and Bank of Japan (BoJ) end or taper their QE programmes sooner than expected. But given the still weak structural backdrop in Europe and Japan, term premia isn’t likely to increase dramatically via this channel in the near future.
The BoJ’s recent announcements suggest policymakers do not expect inflation to reach 2%. Meanwhile, the ECB’s latest macroeconomic projections suggest eurozone inflation will remain below its 2% target for its three-year forecast period. Given changes in the exchange rate since these were put together, the March release may show even weaker inflation projections. Against such a backdrop, it is difficult to see policymakers withdrawing their stimulus measures more aggressively.
Perhaps the biggest risk comes from the Fed itself. The bank’s closely watched ‘dot plot’ — which traces all voting and non-voting members’ estimates of interest rates for the next few years — suggests that nominal interest rates will rise to around 3% by the end of 2020 and beyond. Adding the average spread of the 10-year bond, it implies a Treasury yield above 4%.
This seems at odds with our calculation of the neutral rate and the model produced by the Fed’s own economists. Notably, it increases the risk of a monetary policy mistake somewhere down the line (such as the Fed increasing rates too far), which may start to put upward pressure on bond yields today.
Sensitive to higher ratesWe are confident that macroeconomic conditions will support equity markets this year. Yet we are also conscious
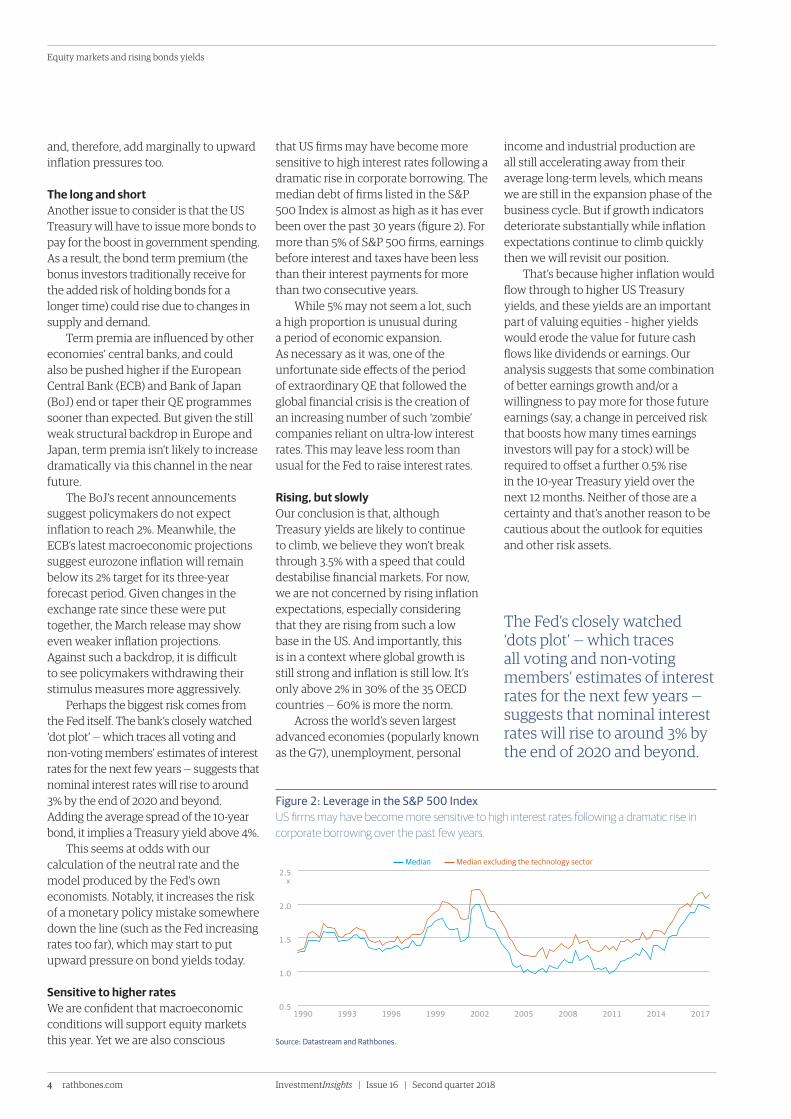
that US firms may have become more sensitive to high interest rates following a dramatic rise in corporate borrowing. The median debt of firms listed in the S&P 500 Index is almost as high as it has ever been over the past 30 years (figure 2). For more than 5% of S&P 500 firms, earnings before interest and taxes have been less than their interest payments for more than two consecutive years.
While 5% may not seem a lot, such a high proportion is unusual during a period of economic expansion. As necessary as it was, one of the unfortunate side effects of the period of extraordinary QE that followed the global financial crisis is the creation of an increasing number of such ‘zombie’ companies reliant on ultra-low interest rates. This may leave less room than usual for the Fed to raise interest rates.
Rising, but slowlyOur conclusion is that, although Treasury yields are likely to continue to climb, we believe they won’t break through 3.5% with a speed that could destabilise financial markets. For now, we are not concerned by rising inflation expectations, especially considering that they are rising from such a low base in the US. And importantly, this is in a context where global growth is still strong and inflation is still low. It’s only above 2% in 30% of the 35 OECD countries — 60% is more the norm.
Across the world’s seven largest advanced economies (popularly known as the G7), unemployment, personal
income and industrial production are all still accelerating away from their average long-term levels, which means we are still in the expansion phase of the business cycle. But if growth indicators deteriorate substantially while inflation expectations continue to climb quickly then we will revisit our position.
That’s because higher inflation would flow through to higher US Treasury yields, and these yields are an important part of valuing equities – higher yields would erode the value for future cash flows like dividends or earnings. Our analysis suggests that some combination of better earnings growth and/or a willingness to pay more for those future earnings (say, a change in perceived risk that boosts how many times earnings investors will pay for a stock) will be required to offset a further 0.5% rise in the 10-year Treasury yield over the next 12 months. Neither of those are a certainty and that’s another reason to be cautious about the outlook for equities and other risk assets.
Source: Datastream and Rathbones.
Figure 2: Leverage in the S&P 500 IndexUS firms may have become more sensitive to high interest rates following a dramatic rise in corporate borrowing over the past few years.
The Fed’s closely watched ‘dots plot’ — which traces all voting and non-voting members’ estimates of interest rates for the next few years — suggests that nominal interest rates will rise to around 3% by the end of 2020 and beyond.
0.5
1.0
1.5
2.0
2.5
2017201420112008200520021999199619931990
Median Median excluding the technology sector
x

rathbones.com 5InvestmentInsights | Issue 16 | Second quarter 2018
Inflated expectations
Source: Datastream and Rathbones.
Figure 3: A weak relationshipThe correlation between wages and inflation in the US is very weak, which is an unusual situation but not unprecedented.
Concerns that inflation is about to take off appear unjustified
The spectre of higher inflation and rising interest rates sent a shudder through global markets in February. It could still cause some sleepless nights over the rest of the year, but we don’t see anything too alarming on the horizon.
The fall in the value of the pound after the vote for Brexit pushed up the cost of imports and then domestic prices in the UK. As a result, the Consumer Prices Index (CPI) has been hovering around 3% for the past few months. Yet the sterling effect will fade away from the annual calculations soon and the inflation rate is likely to drop to around 2.5% by the middle of 2018, according to our estimates.
Around the rest of the world, inflation has remained subdued. Prices are rising at an annual rate of more than 2% in just over 30% of the 35 countries in the Organisation for Economic Co-operation and Development (OECD). Typically, the proportion of countries is around 60%. Notably, the six-month change in the annual rate of inflation is falling in many countries.
In the US, jobs and wage growth have been stronger than expected recently, raising concerns that inflation could be about to pick up. The stock market suffered a brutal sell-off in February because investors worried that the improving economy would prompt the Fed to ramp up interest rates faster than previously thought.
Concerns that inflation could accelerate have been compounded by President Donald Trump’s announcement of tariffs and the prospect of a global trade war. China and the EU both warned that they will retaliate, with incalculable consequences for the world economy.
Yet, excluding food, energy and housing, core inflation in the US is almost as low now as it has ever been. The services component of the US CPI measure, which reflects domestic inflation pressures more accurately, is still well below the pre-crisis average. Notably, the correlation between wages
and inflation has been weak for some time, and we believe the market has probably over-reacted to recent data (figure 3).
China’s producer price inflation is coming back down, although this could influence energy and food inflation more than core goods and services in the West.
Oil and the global economyThe cost of a barrel of oil can have a big impact on global inflation rates because it is the world’s most-traded commodity. Brent crude prices (a popular benchmark) have fallen slightly from a peak in January to below $70 despite ongoing agreements by members of the Organization of the Petroleum Exporting Countries (OPEC) to control production.
US shale producers have contributed to the situation by increasing output. According to the International Energy Agency, America could soon overtake Saudi Arabia and Russia to become the world’s biggest oil producer. Yet recent reports suggest growth has slowed and it appears unlikely that a new glut of shale oil will cause prices to fall sharply. As a result, oil prices are likely to have a limited impact on global inflation throughout 2018.
With the global economy enjoying synchronised economic growth, one
aspect puzzling economists is the ongoing combination of surprisingly low inflation and low unemployment. Possible reasons include the growth of the digital economy and the spread of automation across many industries. Low productivity growth is another cause for concern and some are asking whether digital distractions and the demographic shift in the workforce are to blame.
As we noted in our recent research report Under Pressure?, some of the structural forces acting on inflation are changing in interesting ways. But we’re not expecting a sharp rise or fall in inflation in the coming year, nor does the balance of evidence suggest a profoundly inflationary or deflationary environment will unfold in the long run either.
0
1
2
3
4
201720152013201120092007
Core CPI (excluding housing) Average hourly earnings (annual change)
%

6 rathbones.com InvestmentInsights | Issue 16 | Second quarter 2018
Trade wars
US tariffs could end up biting the hand that feeds the consumer
Until recently, protectionism had gone quiet in the press. But Donald Trump has never stopped playing the pugnacious attack dog of the anti-trade movement. Was the announcement on steel and aluminium tariffs just another bolt out of the blue from an unpredictable White House, or a more worrying predisposition to bite the hand that feeds American consumerism?
As other policies were prioritised last year, many investors convinced themselves that Mr Trump’s campaign-trail tirades against the perceived evils of trade were just for show and that he wouldn’t legislate for them. But we informed our clients of three strands of evidence to the contrary, and now, with tariffs against steel and aluminium and tweets about trade wars being “easy to win”, the risks are more obvious than ever.
Now, to be clear, we think it is too soon to declare the start of a global trade war. The tariffs aren’t going to be as indiscriminate as they first looked, with some of America’s allies exempted. We’re also waiting for the outcome of — and response to — an investigation by US Trade Representative Robert Lighthizer into alleged Chinese violations of intellectual property rights. But we want to make our position clear: nobody wins a global trade war.
So why should we be wary of assuming Trump’s anti-trade tirades were just for show? First, trade still featured heavily in the speeches he gave at rallies, which were rarely televised. His website continues to post updates about what he is doing to combat its perceived ills. And that’s quite sensible politics because his base is very anti-trade. What’s more, only a third of Republican-leaning Americans thought free trade had helped their financial situation and only half of all Democrat-leaning Americans, according to a Pew Institute survey from 2017. Former Presidents Richard Nixon and Ronald Reagan, and even George W Bush and Barack Obama, passed protectionist policies without any dent to their
credibility. Mr Trump is not constrained by his electorate.
Second, Mr Trump immediately made conspicuously anti-trade appointments when he took office. His Commerce Secretary, Wilbur Ross, and his Trade Representative, Mr Lighthizer, have dedicated most of their careers to lobbying for protectionist measures. Pro-trade moderates that had Mr Trump’s ear kept resigning or losing influence (Gary Cohn, his chief economic adviser, being the latest and most telling).
A calculated decisionWe’re sorry to disappoint anyone looking for a more sensational story, but the steel and aluminium tariffs were not a hot-headed decision, they were calculated. Mr Ross has spent the last nine months investigating whether imports of steel and aluminium posed a threat to American national security. The national security arguments may sound like sophistry given that most imports come from America’s allies, but that was calculated too – it’s the only basis for enacting protectionism without contravening World Trade Organization rules.
Third, the Trump administration has overseen myriad pieces of protectionist legislation too arcane to be reported in the national papers. According to the
independent Global Trade Alert initiative, US policy has moved sharply in favour of domestic firms: in the first half of 2017, US policy initiatives hit the commercial interests of G20 partners 26% more often than during the same period in 2016. At the same time the number of trade-liberalising legislations fell 49%. The reference year was not unusual; Trump has just ramped up a growing protectionist trend.
For sure, exports are a more important source of income and wealth in many other countries (exports to the US are a particularly large part of activity in Mexico, Taiwan and Malaysia), and the US is likely to be less scathed by a global trade war in the short run. But that’s a relativist assessment that doesn’t help the US consumer.
As well as being bad for consumers around the world, the prospect of a descent into a beggar-thy-neighbour global trade war is one of the biggest risks to investment returns over the next decade. Discontent with globalisation is widespread — we can see clearly in hindsight that it was a key influence in the Brexit vote and US presidential election — but we believe protectionism to be a very poor means of alleviating it.
Taken at face value, protectionist tariffs provide a large, easy-to-quantify gain to a small but visible and vocal number of people. But they simultaneously deliver a small, hard-to-quantify loss for every member of a large and silent majority. The aggregated impacts of those small losses invariably far outweigh the ostensible gains. Some real-world examples help illustrate this. Between 2009 and 2011, the US raised tariffs on imports of Chinese tyres from 4% to 39%, which President Obama claimed had saved over 1,000 workers from unemployment. But a detailed study by the independent and fiercely respected Peterson Institute for International Economics suggested that they came at a very high cost — at least $1 million per job ‘saved’. Source: The Trade Partnership and Rathbones.
Figure 4: Job creation and destructionA think tank has estimated the impact of Trump’s tariffs on US jobs.
Primary agriculture -285
Primary energy -669
Services -142,305
Manufacturing: iron and steel +29,998
Manufacturing: non-ferrous metals +3,466
Other manufacturing -36,076
Net job losses -145,871

rathbones.com 7InvestmentInsights | Issue 16 | Second quarter 2018
Trade wars
According to the US government’s own General Accounting Office, protecting US sugar growers and refiners during the 1990s benefited producers to the tune of $1bn, but cost consumers $1.9bn, or almost double. In the case of the ‘Trump tariffs’ on steel and aluminium, independent think tank The Trade Partnership has estimated that, taken at face value, the tariffs would add 33,464 jobs in the US metals industry, but cost 179,334 jobs throughout the rest of the economy — a net loss of 146,000 jobs (figure 4).
A nation of consumersThe benefit of trade is perhaps most easily understood at an individual level. Despite some of our ‘River Cottage’ escapist fantasies, most of us do not produce even a fraction of what we consume. We specialise in a certain activity, earn some income and use it to buy the things others can produce more efficiently (see our October 2016 research report Trade of the Century for more detail on the benefits of trade and high costs of protectionism).
Mr Trump’s March tweet that trade wars are easy to win is, for once, based on a little homework, but homework that would receive a rather low grade for taking an erroneously binary approach to history. Messrs Nixon and Reagan’s protectionism was met with appeasement: America’s trading partners agreed to appreciate their currencies against the dollar, which is exactly what Messrs Nixon and Reagan wanted all along. Appeasement averted a global trade war.
But America’s trading partners took a tactical defeat in order to achieve the strategic victory: the ongoing globalisation revolution. Now that globalisation has been achieved (global exports measured as a percentage of global GDP are no higher today than they were 10 years ago, while growth in trade has been less than the growth in GDP for most of the last decade), there’s
less incentive to appease and retaliatory tariffs are a more likely outcome — or perhaps a stronger dollar. Furthermore, the US consumer is not as important as it was in the 1970s or 1980s. US household consumption now accounts for 21% of global consumption (adjusted for purchasing power), down 5% over the last 20 years; 18% of Chinese exports go to the US, down from over 34% in 2005. The risk of a tit-for-tat trade war against the US is greater this time, and would still be systemically significant to financial markets (figure 5).
Moreover, any country that adopts an isolationist approach while the rest of the world continues to integrate will lose out over the long run. Supporting uncompetitive business in which one lacks comparative advantage — because you’ve burned the bridges of trade and co-operation — undermines investment and productivity. Growth in investment and productivity has already slowed considerably across the world, and slower growth means lower potential returns in financial markets.
Indeed, we may be seeing that view playing out in the currency markets already. The dollar has sold off since the tariffs were announced at the beginning of March. Are traders expecting a rerun of the 1970s and 1980s when Washington
used tariffs to get foreign partners to appreciate their currencies? Or are they thinking longer term: that a turn to isolationism presages the end of the dollar’s days as the global reserve currency? For if the US is reshoring its factories and production lines, if its households are no longer the consumer of last resort, if its commander-in-chief and most voters do not want it to be the free world’s defender of last resort, and if its governments are among the world’s most fiscally profligate, why would non-American institutions put all of their eggs in its basket?
Free trade has undoubtedly accelerated the broader process of ‘creative destruction’ and the corollary is greater disruption to working lives. To secure the benefits of trade for future generations, policies that soften the disruption and diffuse the more immediate spoils are badly needed. If they’re neglected, the nationalistic demagoguery of maverick, anti-establishment politicians could deliver shock results — to politicians and investors alike.
Source: comtrade.un.org.
Figure 5: Share of total steel exports (%)Trump’s tariffs are unlikely to have much impact on China, which exports less than 3% of its steel to the US.
0 2 4 6 8 10 12 14
MyanmarHong Kong
PakistanUSA
MalaysiaIndia
IndonesiaPhilippines
ThailandVietnam
Korea
%

8 rathbones.com InvestmentInsights | Issue 16 | Second quarter 2018
Portfolio ‘protectionism’
Source: Datastream and Rathbones.
Figure 6: 10-year UK gilt yieldsYields have returned to levels where gilts can once again be considered a viable alternative to holding cash.
How diversification can help returns through all conditions
Ten-year gilt yields rose steadily in the first two months of 2018 to a high of more than 1.6% (figure 6). They fell back slightly from late February, but even at these levels UK government bonds are once again looking like a viable alternative to holding cash in portfolios.
We have long believed that with yields so low, gilts offered little advantage over cash for a typical diversified portfolio and were vulnerable to capital losses.
But with 10-year gilt yields now at levels not seen since late 2016, the extra income compared with cash is starting to look reasonably attractive again. The downside for prices (which move inversely to yields) also looks more limited.
Despite our expectation that inflation will fall slightly over the medium term, real returns from gilts (yield minus inflation) will probably still be negative. Yet the total return should be higher than the interest from holding cash. Even if yields rose by another 0.3 of a percentage point and prices fell accordingly, our models suggest 10-year gilts would still generate a positive absolute return for the year ahead (i.e. not lose money if we ignore inflation).
In addition, bond markets appear to have priced in two rate hikes before the end of 2018, and we see little risk that rates will go up more than that, pushing gilt prices lower.
Importantly, gilts can help to protect multi-asset portfolios against an economic shock, which could result from a rise in global protectionism or the increased chance of a hard Brexit that excludes any trade deal with the European Union. The time appears ripe to reintroduce an allocation to gilts now that this insurance policy is being offered at more attractive yields.
Alternative strategiesIn addition to having sufficient liquidity, we believe a sensibly diversified portfolio should include securities that we classify as ‘diversifiers’. As the name implies, we expect these diversifiers to add returns to portfolios that do not track, or are
uncorrelated to, equities and bonds. We also expect them to generate a positive return over time, taking advantage of anomalies in the market that skilled managers can exploit.
Here we look at some of types of diversifiers, their role in multi-asset portfolios and some of the conditions that might be conducive to positive performance.
Long—short equity, where managers can make a profit when share prices rise and others fall, is one of the most popular diversifying strategies, though some funds in this category track equities fairly closely and we wouldn’t consider them as diversifiers. The average stock market correlations have fallen dramatically over the past 18 months, which in theory should create better conditions for identifying winners and losers. However, managers may not get their stock-picking right.
Event-driven funds seek to exploit pricing inefficiencies that may occur before or after a corporate event, such as an earnings call, bankruptcy, merger, acquisition or spin-off. President Donald Trump’s tax reforms could create some interesting opportunities for US companies as they begin to repatriate their foreign earnings.
Yet deal risk continues to be an important issue for event-driven strategies.
Many managers were affected when the US government challenged the proposed merger of AT&T and Time Warner. More recently, Mr Trump has prevented what would have been the biggest-ever tech deal by blocking Broadcom’s bid for Qualcomm, citing national security issues. Again, stock-picking is key to capturing returns from these anomalies.
Global macro managers invest according to economic and political conditions in various countries. Returns have been disappointing recently owing largely to the absence of volatility in currency markets. However, risks such as a hard Brexit, a global trade war, central banks raising rates too far or a divergence in interest rates between regions could create opportunities in the year ahead. However, these strategies may struggle in a scenario of continued synchronised global growth and low volatility.
Commodity trading advisers (CTAs) — also known as trend-following funds – use derivative contracts across all asset classes to generate returns from market trends. Performance from this group was particularly strong at the end of 2017 with managers able to capture gains from rising energy prices, rallying equities and significant currency moves. Short-term reversals in markets, such as the one experienced in February, can be difficult for CTAs.
0.5
1.0
1.5
2.0
2.5
3.0
3.5
201820172016201520142013
%

rathbones.com 9InvestmentInsights | Issue 16 | Second quarter 2018
UK equities look attractive across various valuation measures
UK stocks have underperformed other major developed markets so far in 2018, extending a pattern that has been in place since the June 2016 vote to leave the EU. A longer-term analysis also suggests Brexit isn’t the only thing weighing on UK companies, so why should investors be interested in UK equities now? We think investors are pricing in a fairly negative Brexit scenario, and see UK shares as offering fundamental value and opportunity in differing economic outlooks.
UK shares have underperformed the MSCI World Index significantly since the end of 2011. This has been due to a number of factors: the UK’s high exposure to sectors such as banking, oil and mining which have experienced periods of challenging trading; a relative lack of exposure to higher-growth areas such as technology; and more latterly concerns about the potential for Brexit to impact the UK economy.
On the day of the EU referendum, 23 June 2016, the closing price of the FTSE 100 was 14.4 times the expected earnings for the index over the next year (a ‘forward price/earnings’ or ‘PE’ of 14.4), compared with the S&P 500’s forward PE of 17.8. Since then, despite good growth in the FTSE 100’s earnings, its forward PE has fallen to 13.4. The S&P 500’s forward PE has meanwhile been fairly steady, and recently it was at 17.4, especially as technology giants like Amazon have prospered. This has widened the discount that UK shares trade on to 22% (figure 7).
Another good valuation measure is what is called projected free cash flow yield, which takes the amount of cash flow a business produces for its shareholders and divides it by the value of its shares. On this measure, the FTSE 100 has also become more attractive — rising from 4.8% at the time of the referendum to 6.6% today. Having been 4% less attractive than the S&P 500, it is now 28% more attractive.
Even if we adjust for the S&P 500’s
skew toward faster-growth and higher-valued technology shares, the FTSE 100 still looks relatively cheap. And this is true across sectors: in personal care and household goods, Unilever trades on a forward PE of 17.7 versus US peer Colgate-Palmolive on 21.3, and in energy Royal Dutch Shell is on 13 compared to 16.2 for US rival ExxonMobil.
The UK was already less expensive on some measures prior to the referendum, and has now become even cheaper to reflect uncertainty over Brexit. Overseas investors may also be put off by the prospect of hard-left UK government with Labour leader Jeremy Corbyn climbing in the polls (see our recent report Oh! Jeremy Corbyn).
If the UK exits the EU with no free-trade deal and there is a hit to trade and to economic growth overall, we think the adjustment mechanism will be the value of sterling. In this scenario, it would be very likely to fall. The FTSE 100 derives approximately 76% of its revenue (according to estimates by FTSE Russell) from outside the UK, so depreciation of sterling would boost foreign earners’ sterling profits and, therefore, their sterling share prices would improve.
The FTSE 100 looks cheap — but it is only attractive if we can be fairly sure its long-term investment returns will
be good. Our research suggests that sterling is significantly undervalued versus other currencies, and we expect that over the long term it will normalise, which should boost long-term returns to global investors from sterling-denominated equities.
The FTSE 100 should also deliver decent long-term earnings growth. Significant weightings to energy, mining and consumer staples give it the best exposure among Western markets to higher growth regions of the world, chiefly Asian emerging markets. Even though the domestic economic outlook is currently uncertain, we continue to see UK equities, and in particular the more outward-looking FTSE 100 index, as reasonably attractive.
Source: Datastream and Rathbones.
Figure 7: Relative attractionThe average price-earnings ratio of companies in the FTSE 100 has been falling steadily relative to the S&P 500 since the Brexit referendum.
Good value or value trap?
0.7
0.8
0.9
1.0
Mar 18Dec 17Sep 17Jun 17Mar 17Dec16Sep 16 Jun 16Mar 16

10 rathbones.com InvestmentInsights | Issue 16 | Second quarter 2018
Financial markets
The report of strong US jobs data and wage growth at the start of February fuelled concerns that interest rates may need to go up more than previously anticipated. US stock markets suffered a brutal sell-off as investors worried that the era of cheap money is coming to an end. Asian markets, which tend to track their US counterparts, finished down, and the FTSE All-Share also fell.
In anticipation of rising interest rates, US 10-year Treasury yields jumped to a four-year high of almost 3% (prices fell) and UK gilt yields also rose. Speculation mounted that the long run of gains in government bonds, which dates back to the 1980s, may be over. They have been in a downward trend since just before the election of President Donald Trump in November 2016.
Some analysts think Mr Trump’s tax package will require an increase in Treasury issuance, and higher yields will be required to persuade investors to purchase the bonds, especially as the Federal Reserve is no longer a buyer through its QE programme.
Inflation falls as the pound strengthensThe UK has had one of the highest rates of inflation across the developed world over the past year. The main reason is the Brexit-induced fall in the value of sterling, which pushed up the cost of imports. As the impact of a weaker pound fades from the calculations, the inflation rate is starting to fall back down.
The pound has been rising against the dollar, which has been weakening since the start of 2017. Before his inauguration, Mr Trump said the dollar was “too strong” and that American companies cannot compete because of it, particularly against the Chinese.
Gold prices have risen as renewed trade war fears between the US and China prompted safe-haven buying. Investors scurried to safety after Mr Trump moved towards long-promised anti-China tariffs, prompting a response from China and raising fears of a global trade war.
UK
Japan
eurozone
US
% annual change
-6
-4
-2
0
2
4
6
20162014201220102008
Source: Datastream and Rathbones.
GDP growth
Source: Datastream and Rathbones.
Inflation
Source: Datastream and Rathbones.
Sterling
Source: Datastream and Rathbones.
Equities
Source: Datastream and Rathbones.
Past performance is not a reliable indicator of future performance.
Government bonds
Source: Datastream and Rathbones.
Gold
UK
Japan
eurozone
US
% annual change
-1
0
1
2
3
4
20172016201520142013
euros
US dollars
€
1.2
1.3
1.4
1.5
1.6
1.7
1.8
20172016201520142013
1.0
1.1
1.2
1.3
1.4
1.5
1.6$
MSCI World Total Return Index (in sterling)
95
115
135
155
175
195
20172016201520142013
FTSE All Share Total Return
4 April 2013 = 100
UK
Germany
US
10-year yields (%)
-1
0
1
2
3
4
20172016201520142013
US dollars per troy ounce
1000
1200
1400
1600
20172016201520142013

rathbones.com 11InvestmentInsights | Issue 16 | Second quarter 2018
Important information
This document and the information within it does not constitute investment research or a research recommendation. Forecasts of future performance are not a reliable indicator of future performance.
The above information represents the current and historic views of Rathbones’ strategic asset allocation committee in terms of weighting of asset classes, and should not be classed as research, a prediction or projection of market conditions or returns, or of guidance to investors on structuring their investments.
The opinions expressed and models provided within this document and the statements made are, due to the dynamic nature of the items discussed, valid only at the point of being published and are subject to change without notice, and their accuracy and completeness cannot be guaranteed.
Figures shown above may be subject to rounding for illustrative purposes, and such rounding could have a material effect on asset weightings in the event that the proportions above were replicated by a potential investor.
Nothing in this document should be construed as a recommendation to purchase any product or service from any provider, shares or funds in any particular asset class or weighting, and you should always take appropriate independent advice from a professional, who has made an evaluation, at the point of investing.
The value of investments and the income generated by them can go down as well as up, as can the relative value and yields of different asset classes. Emerging or less mature markets or regimes may be volatile and subject to significant political and economic change. Hedge funds and other investment classes may not be subject to regulation or the protections afforded by the Financial Conduct Authority (FCA) or the Prudential Regulation Authority (PRA) regulatory regimes.
The asset allocation strategies included are provided as an indication of the benefits of strategic asset allocation and diversification in constructing a portfolio of investments, without provision of any views in terms of stock selection or fund selection.
Changes to the basis of taxation or currency exchange rates, and the effects they may have on investments are not taken into account. The process of strategic asset allocation should underpin a subsequent stock selection process. Rathbones produces these strategies as guidance to its investment managers in the construction of client portfolios, which the investment managers combine with the specific circumstances, needs and objectives of their client, and will vary the asset allocation accordingly to provide a bespoke asset allocation for that client.
The asset allocation strategies included should not be regarded as a benchmark or measure of performance for any client portfolio. Rathbones will not, by virtue of distribution of this document, be responsible to any person for providing the protections afforded to clients for advising on any investment, strategy or scheme of investments. Neither Rathbones nor any associated company, director, representative or employee accepts any liability whatsoever for errors of fact, errors or differences of opinion or for forecasts or estimates or for any direct or consequential loss arising from the use of or reliance on information contained in this document, provided that nothing in this document shall exclude or restrict any duty or liability which Rathbones may have to its clients under the rules of the FCA or the PRA.
We are covered by the Financial Services Compensation Scheme (FSCS). The FSCS can pay compensation to investors if a bank is unable to meet its financial obligations. For further information (including the amounts covered and the eligibility to
claim) please refer to the FSCS website fscs.org.uk or call 020 7892 7300 or 0800 678 1100.
Rathbone Investment Management International is the Registered Business Name of Rathbone Investment Management International Limited which is regulated by the Jersey Financial Services Commission. Registered office: 26 Esplanade, St. Helier, Jersey JE1 2RB. Company Registration No. 50503. Rathbone Investment Management International Limited is not authorised or regulated by the PRA or the FCA in the UK.
Rathbone Investment Management International Limited is not subject to the provisions of the UK Financial Services and Markets Act 2000 and the Financial Services Act 2012; and, investors entering into investment agreements with Rathbone Investment Management International Limited will not have the protections afforded by those Acts or the rules and regulations made under them, including the UK FSCS. This document is not intended as an offer or solicitation for the purchase or sale of any financial instrument by Rathbone Investment Management International Limited.
Not for distribution in the United States. Copyright ©2018 Rathbone Brothers Plc. All rights reserved. No part of this document may be reproduced in whole or in part without express prior permission. Rathbones and Rathbone Greenbank Investments are trading names of Rathbone Investment Management Limited, which is authorised by the PRA and regulated by the FCA and the PRA. Registered Office: Port of Liverpool Building, Pier Head, Liverpool L3 1NW. Registered in England No. 01448919. Rathbone Investment Management Limited is a wholly owned subsidiary of Rathbone Brothers Plc.
Our logo and logo symbol are registered trademarks of Rathbone Brothers Plc.

rathbones.com
Contact us
If you would like further information or to arrange an initial meeting, please contact us on 020 7399 0000 or email [email protected]
Head office 8 Finsbury Circus, London EC2M 7AZ 020 7399 0000
We also have offices at the following locations:
For ethical investment services:Rathbone Greenbank Investments0117 930 3000rathbonegreenbank.com
For offshore investment management services:Rathbone Investment Management International01534 740 500rathboneimi.com
@Rathbones1742
Rathbone Brothers PLC
Rathbone Brothers PLC
Aberdeen01224 218 180 rathbones.com/aberdeen Birmingham0121 233 2626 rathbones.com/birmingham
Bristol0117 929 1919 rathbones.com/bristol
Cambridge01223 229 229 rathbones.com/cambridge
Chichester 01243 775 373 rathbones.com/chichester
Edinburgh0131 550 1350 rathbones.com/edinburgh
Exeter01392 201 000 rathbones.com/exeter
Glasgow0141 397 9900 rathbones.com/glasgow
Kendal01539 561 457rathbones.com/kendal
Liverpool 0151 236 6666 rathbones.com/liverpool
Lymington 01590 647 657 rathbones.com/lymington
Newcastle0191 255 1440 rathbones.com/newcastle
Winchester01962 857 000 rathbones.com/winchester