longitudinal relationships between whole body and central adiposity on weight-bearing bone geometry,...
TRANSCRIPT
ORIGINAL ARTICLE
Longitudinal relationships between whole body and centraladiposity on weight-bearing bone geometry, density, and bonestrength: a pQCT study in young girls
Deepika R. Laddu & Joshua N. Farr & Monica J. Laudermilk & Vinson R. Lee &
Robert M. Blew & Craig Stump & Linda Houtkooper & Timothy G. Lohman & Scott B. Going
Received: 1 April 2013 /Accepted: 23 September 2013 /Published online: 10 October 2013# International Osteoporosis Foundation and National Osteoporosis Foundation 2013
AbstractSummary Longitudinal relationships between adiposity (totalbody and central) and bone development were assessed inyoung girls. Total body and android fat masses were positivelyassociated with bone strength and density parameters of thefemur and tibia. These results suggest adiposity may have site-specific stimulating effects on the developing bone.Introduction Childhood obesity may impair bone develop-ment, but the relationships between adiposity and bone remainunclear. Failure to account for fat pattern may explain theconflicting results.Purpose Longitudinal associations of total body fat mass(TBFM) and android fat mass (AFM) with 2-year changes inweight-bearing bone parameters were examined in 260 girlsaged 8–13 years at baseline. Peripheral quantitative computedtomography was used to measure bone strength index (BSI,square milligrams per quartic millimeter), strength–strain index(SSI, cubic millimeters), and volumetric bone mineral density
(vBMD, milligrams per cubic centimeter) at distal metaphysealand diaphyseal regions of the femur and tibia. TBFM and AFMwere assessed by dual-energy x-ray absorptiometry.Results Baseline TBFM and AFM were positively associatedwith the change in femur BSI (r =0.20, r =0.17, respectively)and femur trabecular vBMD (r =0.19, r =0.19, respectively).Similarly, positive associations were found between TBFM andchange in tibia BSI and SSI (r =0.16, r =0.15, respectively),and femur total and trabecular vBMD (r =0.12, r =0.14, respec-tively). Analysis of covariance showed that girls in the middlethirds of AFM had significantly lower femur trabecular vBMDand significantly higher tibia cortical vBMD than girls in thehighest thirds of AFM. All results were significant at p <0.05.Conclusions Whereas baseline levels of TBFM and AFM arepositive predictors of bone strength and density at the femurand tibia, higher levels of AFM above a certain level mayimpair cortical vBMD growth at weight-bearing sites. Futurestudies in obese children will be needed to test this possibility.NIH/NICHD #HD-050775.
Keywords Regional adiposity . Bone development . Girls .
Volumetric bonemineral density (vBMD) . Peripheralquantitative computed tomography (pQCT)
Introduction
Puberty is a critical period of development, marked by in-creases in bone and lean and fat masses. Obesity during thisperiod is associated with increased risk for metabolic comor-bidities, such as type 2 diabetes mellitus (T2DM) and cardio-vascular disease [1–3]. Overweight and obese children at agiven age are also overrepresented in the number of fracturecases [1, 2, 4].Whether this is due to a link between childhood
D. R. Laddu (*) : L. Houtkooper : S. B. GoingDepartment of Nutritional Sciences, University of Arizona, 1713 E.University Blvd. #93, Tucson, AZ 85721-0093, USAe-mail: [email protected]
J. N. FarrDivision of Endocrinology, Mayo Clinic, Rochester, MN, USA
V. R. Lee : R. M. Blew : T. G. Lohman : S. B. GoingDepartment of Physiological Sciences, University of Arizona,Tucson, AZ, USA
C. StumpFaculty of Medicine, Department of Endocrinology, University ofArizona, Tucson, AZ, USA
M. J. LaudermilkCore Performance, Phoenix, AZ, USA
Arch Osteoporos (2013) 8:156DOI 10.1007/s11657-013-0156-x
obesity and bone growth or some other factor, e.g., less agility,greater falls, and greater impact forces from a fall, is unclear[5–7]. Peak bone mass and bone strength achieved in adoles-cence or early adulthood are primary determinants of fracturerisk [8, 9], and both indices are dependent on maximizingbone density and strength during growth. Optimal bone de-velopment during puberty is critical and disturbances thatdisrupt normal bone development during this time can leadto suboptimal bone strength and possibly increased risk forosteoporotic fractures later in life.
The relationship between excess adiposity and bone inchildren is complex, and data are conflicting, suggesting apositive [10, 11], negative [2, 12], or null effect [13] of fatmass on bone mass and density. The relationship is multifac-torial; one reason for the conflicting findings may be variabil-ity in fat distribution, as different fat depots and ectopic fatlikely have different consequences for bone [14]. Indeed,recent studies suggest that increased visceral fat in childhoodmay impair skeletal growth [15, 16]. In support of this notion,some studies have shown that fractures occurring in childhoodare linked to alterations in metabolic parameters associatedwith deposition of visceral fat mass, which may serve as anearly sign of future skeletal insufficiency [17] and osteoporo-sis [18]. Some studies have shown that children with excessadiposity experience dissociation between weight gain andbone mineral accrual [11], suggesting a mismatch betweengains in bodymass and skeletal adaptations during growth [4].Body composition, as opposed to weight per se, may be thestrongest determinant of bone throughout life, as lean mass isa well-established determinant of bone mineral content, ge-ometry, and architecture [4]. The mismatch of bone strengthand mineral accrual to body weight may explain, in part, whythe incidence of fractures during puberty is higher in obesechildren compared to their normal-weight peers [4, 14, 19]. Inchildren, skeletal adaptations may depend on appropriategains in lean mass [20, 21] while fat mass may have noadditive or even a negative effect on bone mass [19, 22].
Few studies have prospectively analyzed the effects of softtissue composition on bone development and bone strength inchildren [15, 18, 19, 22, 23]. The purpose of this study was todetermine the relationships of total body and central adipositywith changes in volumetric bone mineral density (vBMD) andindices of bone strength in young girls. Past studies of bonedevelopment in children have been limited by the use of dual-energy x-ray absorptiometry (DXA) [2, 12, 22], which isconfounded by changes in bone dimensions during growthand cannot assess bone geometry, an important component ofbone strength and fracture risk. A unique feature of this studywas the use of peripheral quantitative computed tomography(pQCT), which provides estimates of volumetric BMD andbone structural features and can therefore capture modelingadaptations leading to architectural changes during growth[20]. To our knowledge, no studies have assessed the
longitudinal relationship between total and regional(abdominal) body fat and indices of bone strength from pQCTin peri-pubertal girls, a critical phase of bone development.Given that metabolic derangements associated with obesityare closely related with a central (abdominal) fat pattern [16],and because cross-sectional analyses have shown inverseassociations between fat mass and bone strength in younggirls [24] and adults [25], we hypothesized that higher levelsof total body fat and android fat would be inversely associatedwith gains in bone strength at weight-bearing bone sites inyoung girls.
Methods
Participants
The study was approved by the University of Arizona HumanSubjects Protection Committee and was conducted in accor-dance with the Helsinki Declaration. All guardians and par-ticipating girls (n =509) provided written informed consent.Details regarding recruitment and the baseline characteristicsof the sample have been published [26]. Individuals takingmedications known to affect bone metabolism or who hadbeen diagnosed with a medical condition, or disability thatlimited participation in physical exercise as defined by theCommittee on Sports Medicine and Fitness, were excluded[27]. Sample ethnicity was 23 % Hispanic and 77 % non-Hispanic, and sample race was 89 % white, 7 % Asian, 2 %black or African American, 0.3 % Latino, 0.7 % NativeHawaiian or other Pacific Islander, and 0.3 % other. Boneand soft tissue composition measures were available on 444girls [26] at baseline, after elimination of 65 pQCT scans dueto motion artifact. Of those girls, 260 girls had 2-year assess-ments of soft tissue composition and pQCT bone parametersand were included in the present analysis.
Anthropometry
Measures of body mass, standing height, sitting height, andbone lengths were obtained following standardized protocols[28]. Body mass was measured (nearest 0.1 kg) using acalibrated scale (Seca, Model 881, Hamburg, Germany).Standing and sitting heights were measured at full inhalation(nearest millimeter) using a calibrated stadiometer (ShorrHeight Measuring Board, Olney, MD). Femur and tibialengths (nearest millimeter) were measured on thenondominant leg. Femur length was measured from the prox-imal aspect of the patella to the inguinal crease. Tibia lengthwas measured from the proximal end of the medial border ofthe tibial plateau to the distal edge of the medial malleolus.Baseline coefficients of variation (CVs) for femur and tibialengths (n =444 girls) are 0.34 and 0.51 %, respectively [26].
156, Page 2 of 10 Arch Osteoporos (2013) 8:156
For each anthropometric variable, two measurements weretaken and averaged.
Physical maturation
Maturation was assessed using maturity offset over the moreconventional method of Tanner staging due to its reliance onobjective anthropometric measurements of linear growth. Ma-turity offset is based on estimated years from peak heightvelocity (PHV) using Mirwald's equation [29] which includesinteractions among anthropometric measures (i.e., height,weight, sitting height, leg length) and chronologic age toderive a maturity offset value. Positive maturity offset repre-sents years after PHV while a negative maturity offset repre-sents years before PHV. In Mirwald's sample, the maturityoffset equation for girls explained 89 % of the variance inyears from PHV [29]. Data regarding menarcheal status wasobtained via self-report.
Dietary assessment
As previously described [30], dietary fat and total caloricintake were assessed at baseline and 24-months using theHarvard Youth/Adolescent Questionnaire (YAQ) [31]. TheYAQ is a self-administered food-frequency questionnaire(FFQ) designed to assess usual dietary intake and dietarysupplement use during the previous year. Acceptable validityand reproducibility of the YAQ have been established [31].Participants completed the YAQ with assistance available.YAQs were reviewed and coded by trained study staff follow-ing standard coding procedures [31]. Nutrient analysis wascompleted by Channing Laboratories (Boston, MA).
Physical activity
Physical activity (PA) was assessed by the Past Year PhysicalActivity Questionnaire (PYPAQ) [32], a survey of all sportand leisure-time physical activity in which the respondentengaged at least ten times in the past year outside of physicaleducation class. The PYPAQ was slightly modified to includea more comprehensive list of 41 activities common to youth[33]. The modified questionnaire was administered in aninterview with the participant and guardian. Total PYPAQscore was computed using a modified equation from Sheddand colleagues [34], which incorporated weight-bearing load,frequency, and duration of each activity [33].
Bone and body composition assessment
pQCT-bone measures Changes in bone geometry, strength,and volumetric bone mineral density (vBMD) were assessedusing pQCT (XCT 3000, Stratec Medizintechnik GmbH,Pforzheim, Germany, Division of Orthometrix; White Plains,
NY, USA) at the 4 and 20 % femur and 4 and 66 % tibia sitesrelative to the respective distal growth plates on thenondominant limb. Bone parameters measured at distalmetaphyseal regions of the femur and tibia included trabecularvBMD (milligrams per cubic centimeter) and bone strengthindex (BSI, square milligrams per quartic millimeter); param-eters measured at diaphyseal regions included cortical vBMD(milligrams per cubic centimeter) and strength–strain index(SSI, cubic millimeters). BSI, calculated as the total area×totalvBMD2 [35], provides an estimate of the bone's ability towithstand compression, and SSI is used to estimate the bone'sability to resist torsion and bending forces. SSI is the integratedproduct of the geometric properties (i.e., section modulus) withthe material properties of bone: SSI (mm3)=∑i =1, n([(r2i×a)/rmax]×(cortical vBMD/ND)); section modulus is calculated as(r2i×a)/rmax, where a is the area of a voxel (square millime-ters), r is the distance of a voxel from the center of gravity(millimeters), and rmax is the maximum distance of a voxelfrom the center of gravity (millimeters). Thematerial propertiesof bone are calculated as the quotient of measured corticaldensity (cortical vBMD, milligrams per cubic centimeter) andnormal physiologic cortical density (ND, 1,200 mg/cm3).
Scout scans were performed to locate the distal growthplates, with the scanner programmed to find the sites of interestbased on skeletal lengths. Additional details regarding imageprocessing, calculations, and analysis are published elsewhere[36, 37]. CVs previously reported from our laboratory [36]were <1.1 % for vBMD, bone geometry, and indices of bonestrength (i.e., BSI and SSI). pQCT data acquisition and analy-ses followed guidelines provided by Bone Diagnostics, Inc.(Fort Atkinson, WI, USA). All scans were performed by asingle technician, while a separate investigator analyzed allscans (STRATEC software; version 6.0). The pQCT instrumentwas calibrated, and quality assurance procedures were com-pleted daily in order to ensure precision of measurements.
Dual-energy x-ray absorptiometry
Total body lean mass (TBLM), total body fat mass (TBFM),and abdominal (android) fat mass (AFM) were obtained fromwhole body DXA scans using the GE Lunar Prodigy (soft-ware version 5.60.003) fan-beam densitometer (GE LunarCorp, Madison, WI, USA). AFM is defined as the areaenclosed between a demarcation immediately above the iliaccrest to a second mark at 20 % of the total distance betweenthe iliac crest and the base of the skull. Subjects were posi-tioned following the standard manufacturer protocols. Allparticipants were scanned by a certified technician, and allanalyses were performed by a single technician. The unit wascalibrated daily. DXA CVs for precision in measuring softtissue composition in our laboratory have been previouslyreported [38].
Arch Osteoporos (2013) 8:156 Page 3 of 10, 156
Statistical analysis
Data were checked for outliers and normality using histo-grams, and skewness and kurtosis were calculated for allvariables. Changes in covariates (i.e., maturity offset, height,and TBLM), vBMD, and bone strength were defined as thedifference between baseline and 24-month measurements. Allchanges in bone variables were normally distributed; thus,transformations were not performed. Descriptive statisticswere calculated for the entire sample. Since no significantchanges in intakes of calories or fat, or physical activity, wereobserved, the average dietary intake values and physical ac-tivity (average PYPAQ score) were used as covariates. Asso-ciations were estimated from bivariate correlations usingPearson's r for continuous variables in order to determinesimple relationships between bone outcome variables andcovariates. Multiple linear regression analysis was used toregress changes in bone variables on baseline measures ofTBFM and AFM after controlling for baseline and the 2-yearchange in maturity offset, height, and TBLM, as well asaverage physical activity and calorie and fat intakes. Allregressions included maturity offset rather than age as previ-ous reports from our laboratory have shown it to have astronger relationship with bone parameters [36]. Maturationhas been previously assessed in our laboratory using twomethods: Tanner staging [39] and maturity offset [29]. Sepa-rate analyses were conducted with Tanner stage and maturityoffset as measures of maturation. In addition, we repeatedanalyses substituting maturity offset with menarcheal status.Results were similar (data not shown); thus, we report analy-ses with maturity offset over the more conventional method ofTanner staging and menarche due to its stronger associationwith bone parameters in this sample [36]. Linearity, normality,and homoscedasticity of residuals were assessed. Collinearitybetween covariates (criteria=VIF ≥10) was also evaluated,and covariates with the lowest VIF were included in themodel. All models were initially run with ethnicity and racein all models; however, since these variables did not contrib-ute to the variance explained by the model, they were notincluded in the final analyses. The effect of baseline TBFMandAFMon bone outcomeswas evaluated as separate modelsto determine whether the relationships between bone param-eters and abdominal soft tissue composition differed fromtheir relationships with TBFM. All models were repeated withthe 2-year change in TBFM or AFM included. Because inclu-sion of change in adiposity did not significantly improveexplained variance, the models presented herein include onlybaseline measures of TBFM and AFM.
Analysis of covariance (ANCOVA) was used to comparebone outcomes among tertiles of baseline TBFM and baselineAFM after adjusting for baseline and the 2-year change inmaturity offset and height, TBLM, plus average physicalactivity, calorie and fat intakes. Because of the differences in
units for pQCT bone outcome variables, data presented werenormalized to the highest tertile by setting the highest tertile to1.0. Bonferroni post hoc tests were used to adjust for multiplecomparisons among tertiles of baseline TBFM and AFM. Thelevel of significance was set at p <0.05 (two-tailed). All anal-yses were performed using the Statistical Package for theSocial Sciences for Windows, version 20.0 (SPSS, Chicago,IL, USA).
Results
Descriptive characteristics
Descriptive results for baseline and 2-year variables are pro-vided in Table 1. Based on baseline BMI, 3.5 % of the samplewas underweight (BMI<5th percentile), 75 % of the samplehad healthy weight (BMI 5th to 85th percentile), 13.5% of thesample was overweight (BMI 85th to 95th percentile), and7.7 % of the sample was obese (BMI>95th percentile) [40].At baseline, the average percent fat for the entire sample was27.6 % (range 8.5–50.9 %), and for each BMI category(underweight, normal weight, overweight, and obese) was18 % (range 8.5–22.4 %), 24.6 % (range 11.1–41.3 %),36.8 % (range 29.2–44.0 %), and 45 % (range 36.6–50.9 %), respectively. On average, at baseline, girls were1.2 years prior to PHV and ranged from 3.2 years beforePHV to 1.04 years post PHV. Average caloric (1,711±541 kcal) and fat (31 %±4.0 %) intakes met the dietaryrecommendations for girls of this age established by the2010 Dietary Guidelines for Americans [41]. As expected inhealthy growing girls, height, body weight, body mass index(BMI), femur length, tibia length, total body lean mass, totalbody and android fat and lean masses, percent fat, calf andthigh muscle densities, and femur and tibia bone strength anddensity indices all increased significantly (p <0.0001) frombaseline to 2 years.
Associations between body composition and bone changeoutcomes
As evident in Table 2, baseline TBFM and AFM were bothpositively correlated with changes in BSI and SSI atmetaphyseal and diaphyseal regions of the femur and tibia.Baseline TBFM was positively correlated with change in cor-tical vBMD at the femur and tibia and trabecular vBMD at thetibia. Baseline AFM was positively correlated with the changein cortical vBMD of the femur.
Results from the multiple linear regression analyses areprovided in Table 2, which shows the individual contribution(partial r) of TBFM andAFMwith changes in bone parametersafter controlling for covariates in comparison to the simplecorrelation (Pearson's r). Baseline measures of TBFM and
156, Page 4 of 10 Arch Osteoporos (2013) 8:156
AFM were both significantly and positively associated withchanges in trabecular vBMD (all p <0.002) at metaphysealregions of the femur. Positive associations were found betweenTBFM and changes in cortical vBMD of the femur andchanges in BSI of the femur and tibia. Similar trends werenoted for change in SSI at diaphyseal regions of the tibia. Bycontrast, no significant associations were observed betweenbaseline AFM and change in BSI of the tibia or changes inSSI of the femur or tibia. For all regression analyses, substitu-tion of TBFM by percent body fat gave similar results (data notshown).
Comparison of bone parameters across tertiles of bodycomposition
Estimated means (±SE) for the change in bone outcomeparameters were compared across tertiles of baseline TBFMand AFM using ANCOVA, after adjusting for baseline and 2-year change in maturity offset, height, total body lean mass,
plus average diet (calorie; fat intake) and physical activity. Nosignificant differences in bone parameters were observedamong tertiles of TBFM (all p >0.05).
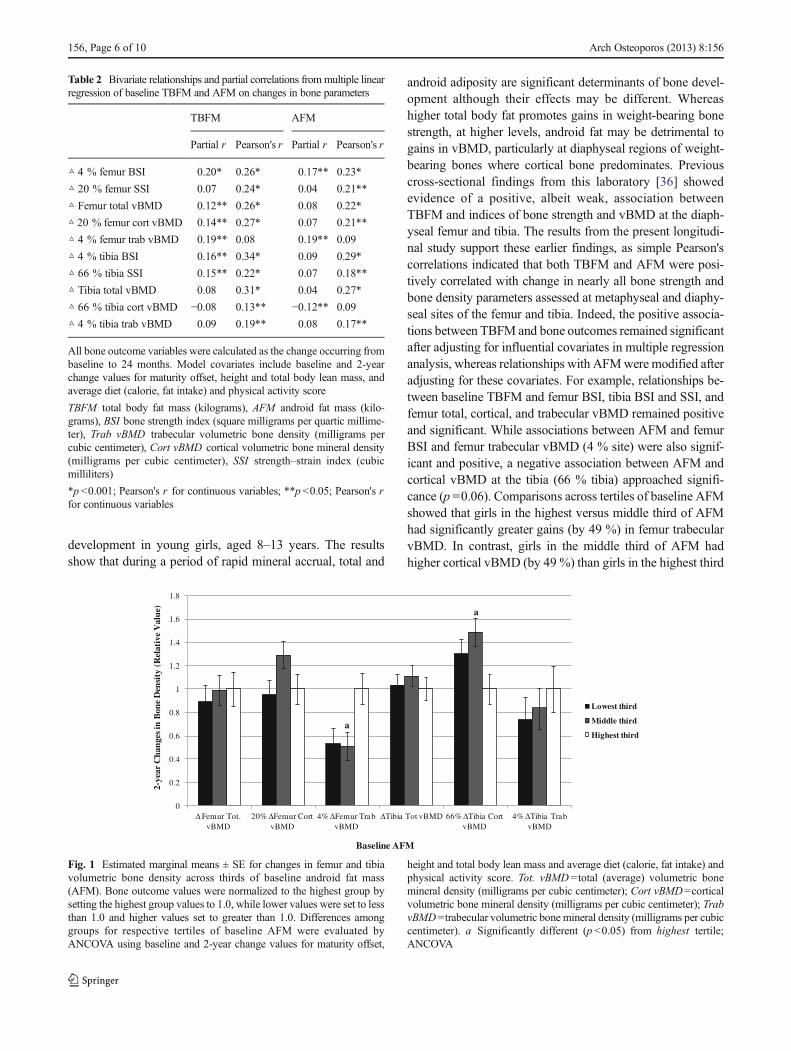
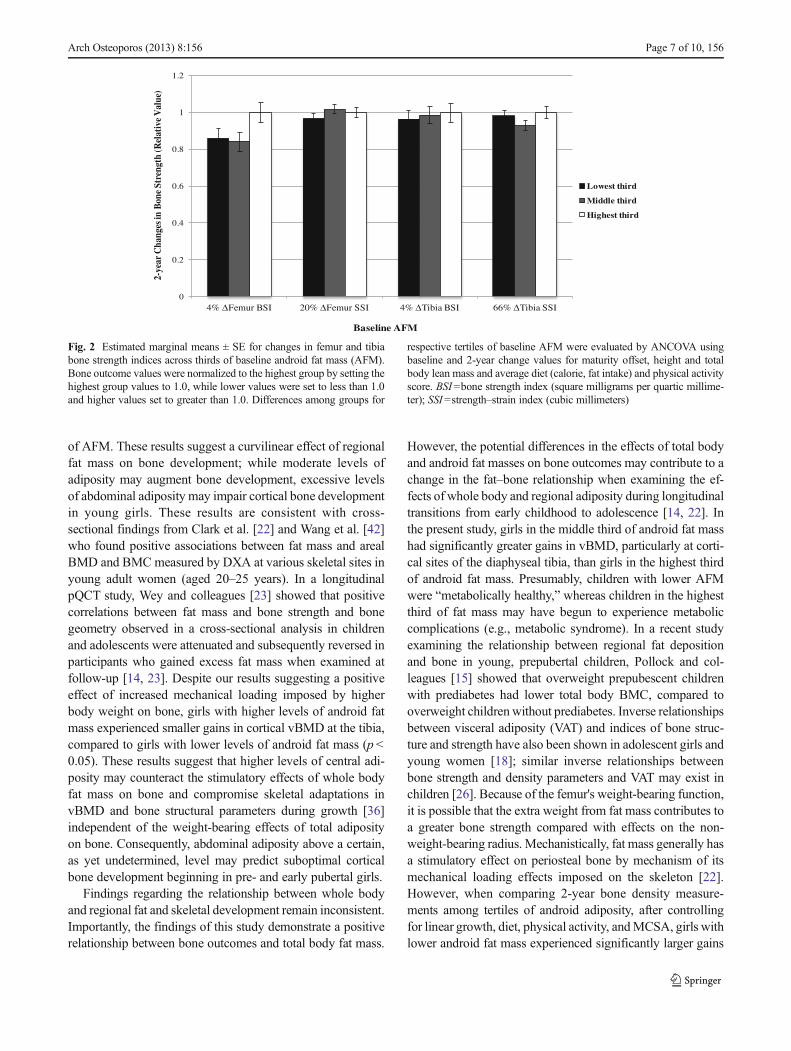
Figures 1 and 2 show the normalized adjusted means(±standard errors) for change in vBMD (Fig. 1) and bonestrength (Fig. 2) across tertiles of AFM. Change in corticalvBMDof the tibia (66% site) was significantly higher for girlsin the middle versus highest third of baseline AFM (p <0.05).By contrast, girls in the highest compared to the middle thirdof AFM gained significantly more trabecular vBMD at thefemur (p <0.01). No significant differences were observedamong tertiles of AFM and changes in bone strength indices(all p >0.05).
Discussion
In this longitudinal analysis, we investigated the effects oftotal body and abdominal fat mass (android fat) on bone
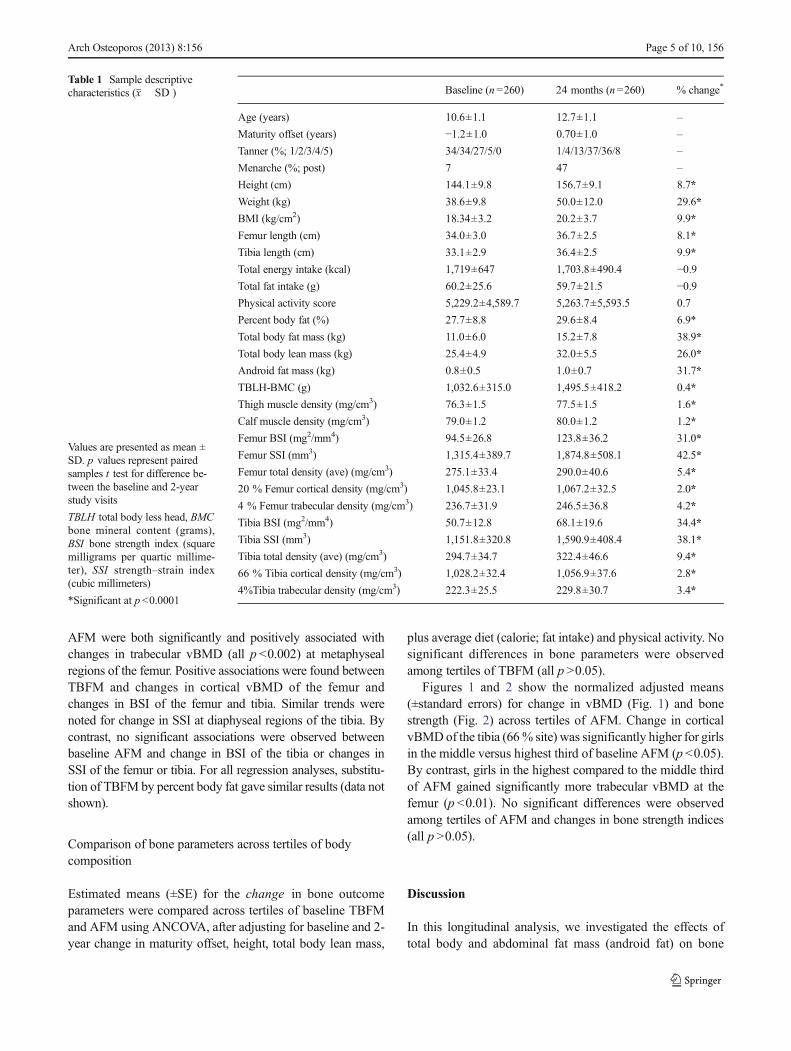
Table 1 Sample descriptivecharacteristics (x� SD )
Values are presented as mean ±SD. p values represent pairedsamples t test for difference be-tween the baseline and 2-yearstudy visits
TBLH total body less head, BMCbone mineral content (grams),BSI bone strength index (squaremilligrams per quartic millime-ter), SSI strength–strain index(cubic millimeters)
*Significant at p <0.0001
Baseline (n=260) 24 months (n =260) % change*
Age (years) 10.6±1.1 12.7±1.1 –
Maturity offset (years) −1.2±1.0 0.70±1.0 –
Tanner (%; 1/2/3/4/5) 34/34/27/5/0 1/4/13/37/36/8 –
Menarche (%; post) 7 47 –
Height (cm) 144.1±9.8 156.7±9.1 8.7*
Weight (kg) 38.6±9.8 50.0±12.0 29.6*
BMI (kg/cm2) 18.34±3.2 20.2±3.7 9.9*
Femur length (cm) 34.0±3.0 36.7±2.5 8.1*
Tibia length (cm) 33.1±2.9 36.4±2.5 9.9*
Total energy intake (kcal) 1,719±647 1,703.8±490.4 −0.9Total fat intake (g) 60.2±25.6 59.7±21.5 −0.9Physical activity score 5,229.2±4,589.7 5,263.7±5,593.5 0.7
Percent body fat (%) 27.7±8.8 29.6±8.4 6.9*
Total body fat mass (kg) 11.0±6.0 15.2±7.8 38.9*
Total body lean mass (kg) 25.4±4.9 32.0±5.5 26.0*
Android fat mass (kg) 0.8±0.5 1.0±0.7 31.7*
TBLH-BMC (g) 1,032.6±315.0 1,495.5±418.2 0.4*
Thigh muscle density (mg/cm3) 76.3±1.5 77.5±1.5 1.6*
Calf muscle density (mg/cm3) 79.0±1.2 80.0±1.2 1.2*
Femur BSI (mg2/mm4) 94.5±26.8 123.8±36.2 31.0*
Femur SSI (mm3) 1,315.4±389.7 1,874.8±508.1 42.5*
Femur total density (ave) (mg/cm3) 275.1±33.4 290.0±40.6 5.4*
20 % Femur cortical density (mg/cm3) 1,045.8±23.1 1,067.2±32.5 2.0*
4 % Femur trabecular density (mg/cm3) 236.7±31.9 246.5±36.8 4.2*
Tibia BSI (mg2/mm4) 50.7±12.8 68.1±19.6 34.4*
Tibia SSI (mm3) 1,151.8±320.8 1,590.9±408.4 38.1*
Tibia total density (ave) (mg/cm3) 294.7±34.7 322.4±46.6 9.4*
66 % Tibia cortical density (mg/cm3) 1,028.2±32.4 1,056.9±37.6 2.8*
4%Tibia trabecular density (mg/cm3) 222.3±25.5 229.8±30.7 3.4*
Arch Osteoporos (2013) 8:156 Page 5 of 10, 156
development in young girls, aged 8–13 years. The resultsshow that during a period of rapid mineral accrual, total and
android adiposity are significant determinants of bone devel-opment although their effects may be different. Whereashigher total body fat promotes gains in weight-bearing bonestrength, at higher levels, android fat may be detrimental togains in vBMD, particularly at diaphyseal regions of weight-bearing bones where cortical bone predominates. Previouscross-sectional findings from this laboratory [36] showedevidence of a positive, albeit weak, association betweenTBFM and indices of bone strength and vBMD at the diaph-yseal femur and tibia. The results from the present longitudi-nal study support these earlier findings, as simple Pearson'scorrelations indicated that both TBFM and AFM were posi-tively correlated with change in nearly all bone strength andbone density parameters assessed at metaphyseal and diaphy-seal sites of the femur and tibia. Indeed, the positive associa-tions between TBFM and bone outcomes remained significantafter adjusting for influential covariates in multiple regressionanalysis, whereas relationships with AFMwere modified afteradjusting for these covariates. For example, relationships be-tween baseline TBFM and femur BSI, tibia BSI and SSI, andfemur total, cortical, and trabecular vBMD remained positiveand significant. While associations between AFM and femurBSI and femur trabecular vBMD (4 % site) were also signif-icant and positive, a negative association between AFM andcortical vBMD at the tibia (66 % tibia) approached signifi-cance (p =0.06). Comparisons across tertiles of baseline AFMshowed that girls in the highest versus middle third of AFMhad significantly greater gains (by 49 %) in femur trabecularvBMD. In contrast, girls in the middle third of AFM hadhigher cortical vBMD (by 49 %) than girls in the highest third
Table 2 Bivariate relationships and partial correlations frommultiple linearregression of baseline TBFM and AFM on changes in bone parameters
TBFM AFM
Partial r Pearson's r Partial r Pearson's r
△ 4 % femur BSI 0.20* 0.26* 0.17** 0.23*
△ 20 % femur SSI 0.07 0.24* 0.04 0.21**
△ Femur total vBMD 0.12** 0.26* 0.08 0.22*
△ 20 % femur cort vBMD 0.14** 0.27* 0.07 0.21**
△ 4 % femur trab vBMD 0.19** 0.08 0.19** 0.09
△ 4 % tibia BSI 0.16** 0.34* 0.09 0.29*
△ 66 % tibia SSI 0.15** 0.22* 0.07 0.18**
△ Tibia total vBMD 0.08 0.31* 0.04 0.27*
△ 66 % tibia cort vBMD −0.08 0.13** −0.12** 0.09
△ 4 % tibia trab vBMD 0.09 0.19** 0.08 0.17**
All bone outcome variables were calculated as the change occurring frombaseline to 24 months. Model covariates include baseline and 2-yearchange values for maturity offset, height and total body lean mass, andaverage diet (calorie, fat intake) and physical activity score
TBFM total body fat mass (kilograms), AFM android fat mass (kilo-grams), BSI bone strength index (square milligrams per quartic millime-ter), Trab vBMD trabecular volumetric bone density (milligrams percubic centimeter), Cort vBMD cortical volumetric bone mineral density(milligrams per cubic centimeter), SSI strength–strain index (cubicmilliliters)
*p <0.001; Pearson's r for continuous variables; **p <0.05; Pearson's rfor continuous variables
0
0.2
0.4
0.6
0.8
1
1.2
1.4
1.6
1.8
Δ Femur Tot. vBMD
20% ΔFemur Cort vBMD
4% ΔFemur Trab vBMD
ΔTibia Tot vBMD 66% ΔTibia Cort vBMD
4% ΔTibia Trab vBMD
2-ye
ar C
hang
es in
Bon
e D
ensi
ty (
Rel
ativ
e V
alue
)
Baseline AFM
Lowest third
Middle third
Highest thirda
a
Fig. 1 Estimated marginal means ± SE for changes in femur and tibiavolumetric bone density across thirds of baseline android fat mass(AFM). Bone outcome values were normalized to the highest group bysetting the highest group values to 1.0, while lower values were set to lessthan 1.0 and higher values set to greater than 1.0. Differences amonggroups for respective tertiles of baseline AFM were evaluated byANCOVA using baseline and 2-year change values for maturity offset,
height and total body lean mass and average diet (calorie, fat intake) andphysical activity score. Tot. vBMD =total (average) volumetric bonemineral density (milligrams per cubic centimeter); Cort vBMD=corticalvolumetric bone mineral density (milligrams per cubic centimeter); TrabvBMD=trabecular volumetric bone mineral density (milligrams per cubiccentimeter). a Significantly different (p <0.05) from highest tertile;ANCOVA
156, Page 6 of 10 Arch Osteoporos (2013) 8:156
of AFM. These results suggest a curvilinear effect of regionalfat mass on bone development; while moderate levels ofadiposity may augment bone development, excessive levelsof abdominal adiposity may impair cortical bone developmentin young girls. These results are consistent with cross-sectional findings from Clark et al. [22] and Wang et al. [42]who found positive associations between fat mass and arealBMD and BMC measured by DXA at various skeletal sites inyoung adult women (aged 20–25 years). In a longitudinalpQCT study, Wey and colleagues [23] showed that positivecorrelations between fat mass and bone strength and bonegeometry observed in a cross-sectional analysis in childrenand adolescents were attenuated and subsequently reversed inparticipants who gained excess fat mass when examined atfollow-up [14, 23]. Despite our results suggesting a positiveeffect of increased mechanical loading imposed by higherbody weight on bone, girls with higher levels of android fatmass experienced smaller gains in cortical vBMD at the tibia,compared to girls with lower levels of android fat mass (p <0.05). These results suggest that higher levels of central adi-posity may counteract the stimulatory effects of whole bodyfat mass on bone and compromise skeletal adaptations invBMD and bone structural parameters during growth [36]independent of the weight-bearing effects of total adiposityon bone. Consequently, abdominal adiposity above a certain,as yet undetermined, level may predict suboptimal corticalbone development beginning in pre- and early pubertal girls.
Findings regarding the relationship between whole bodyand regional fat and skeletal development remain inconsistent.Importantly, the findings of this study demonstrate a positiverelationship between bone outcomes and total body fat mass.
However, the potential differences in the effects of total bodyand android fat masses on bone outcomes may contribute to achange in the fat–bone relationship when examining the ef-fects of whole body and regional adiposity during longitudinaltransitions from early childhood to adolescence [14, 22]. Inthe present study, girls in the middle third of android fat masshad significantly greater gains in vBMD, particularly at corti-cal sites of the diaphyseal tibia, than girls in the highest thirdof android fat mass. Presumably, children with lower AFMwere “metabolically healthy,” whereas children in the highestthird of fat mass may have begun to experience metaboliccomplications (e.g., metabolic syndrome). In a recent studyexamining the relationship between regional fat depositionand bone in young, prepubertal children, Pollock and col-leagues [15] showed that overweight prepubescent childrenwith prediabetes had lower total body BMC, compared tooverweight childrenwithout prediabetes. Inverse relationshipsbetween visceral adiposity (VAT) and indices of bone struc-ture and strength have also been shown in adolescent girls andyoung women [18]; similar inverse relationships betweenbone strength and density parameters and VAT may exist inchildren [26]. Because of the femur's weight-bearing function,it is possible that the extra weight from fat mass contributes toa greater bone strength compared with effects on the non-weight-bearing radius. Mechanistically, fat mass generally hasa stimulatory effect on periosteal bone by mechanism of itsmechanical loading effects imposed on the skeleton [22].However, when comparing 2-year bone density measure-ments among tertiles of android adiposity, after controllingfor linear growth, diet, physical activity, andMCSA, girls withlower android fat mass experienced significantly larger gains
0
0.2
0.4
0.6
0.8
1
1.2
4% ΔFemur BSI 20% ΔFemur SSI 4% ΔTibia BSI 66% ΔTibia SSI
2-ye
ar C
hang
es in
Bon
e St
reng
th (R
elat
ive
Val
ue)
Baseline AFM
Lowest third
Middle third
Highest third
Fig. 2 Estimated marginal means ± SE for changes in femur and tibiabone strength indices across thirds of baseline android fat mass (AFM).Bone outcome values were normalized to the highest group by setting thehighest group values to 1.0, while lower values were set to less than 1.0and higher values set to greater than 1.0. Differences among groups for
respective tertiles of baseline AFM were evaluated by ANCOVA usingbaseline and 2-year change values for maturity offset, height and totalbody lean mass and average diet (calorie, fat intake) and physical activityscore. BSI=bone strength index (square milligrams per quartic millime-ter); SSI=strength–strain index (cubic millimeters)
Arch Osteoporos (2013) 8:156 Page 7 of 10, 156
in cortical vBMD at the diaphyseal tibia, whereas girls in thehighest versus lowest third of android fat mass had signifi-cantly larger gains in trabecular vBMD of the diaphysealfemur. These findings suggest that high amounts of androidadiposity may negatively influence bone development inde-pendent of its contribution to weight-bearing effects, and areasconsisting predominantly of cortical bone seem to be affectedmore than trabecular bone. Although additional studies areneeded, these findings provide some evidence that bone de-velopment may depend on fat distribution independent of totaladiposity. Depending on its distribution, an increased fat massthat persists into adulthood may lead to skeletal impairmentalong with the better-known metabolic abnormalities (i.e.,type 2 diabetes).
Past investigations of the fat–bone relationship in youthhave been limited by their cross-sectional study designs, as thebone–adiposity relationship at a given age may not accuratelyreflect what occurs over time [2]. Further, longitudinal studiesof the effects of adiposity on bone have been limited by thefailure to account for fat pattern, as regional adiposity, espe-cially abdominal adipose tissue (VAT) and fat within skeletalmuscle, is strongly related to metabolic derangements thatmay impair bone [19, 20, 23]. To our knowledge, this is thefirst study that investigated the longitudinal relationship be-tween abdominal (android) fat and changes in bone structureand bone strength in children and adolescents.
The associations between body weight and fracture inchildren remain unclear. Previous findings by Kalkwarf et al.[43] showed no significant relationship between body com-position and fracture among cases and controls, and evidencefrom studies of fracture incidence in children and adolescentssupports this finding. In a review of risk factors for fractures,adiposity was associated with a higher incidence of fracture innormal-weight children (16 %) compared to overweight chil-dren (33 %) [5]. In contrast, Dimitri et al. [44] observed thatobese children had lower total body and regional bone massrelative to body size than nonobese children, and this effectwas significantly larger in obese children with prior history offracture. Similar results from a large observational follow-upstudy showed a negative association between percent body fatand fracture [45]. The results from the present study suggestthat greater abdominal adiposity may offset the positive ef-fects on cortical bone development at proximal weight-bearing bone sites, possibly by increased inflammation, met-abolic abnormalities, or other factors that may affect bone (i.e.,advanced glycation end products (AGEs)), thereby resultingin a greater risk of fractures later in life.
This study was not without limitations. For example, serumsamples were not available, and thus, control for differences inhormone levels (e.g., estrogen, IGF-1, GH) was not possible.While direct assessment of sex hormones would be preferable,we used maturity offset [29] as a practical and objectivesurrogate measure of maturation. Past studies have shown
maturity offset is significantly related to bone parameters[36], and in our own work, maturity offset is more highlyrelated to bone density and bone strength than Tanner stageand menarcheal status. A second limitation was the relativelysmall number of obese girls in our sample. Thus, it is possiblethat the fat–bone relationship was underestimated comparedto what would be found if a more obese population wasincluded in the study [14, 44]. Nevertheless, even in thissample of primarily normal-weight girls, we clearly showedthat higher levels of adiposity (total body and android fat)predicted lower cortical density. Also, our use of DXA mea-sures of android fat as a surrogate for visceral fat was alimitation since DXA android fat includes both subcutaneousand visceral adiposity. Given that visceral adiposity is morestrongly related to skeletal fragility and insufficiency in chil-dren [16, 18], using a more direct estimate of VAT, such asobtained from magnetic resonance imaging (MRI), may haveshown stronger associations between abdominal adiposity andbone strength and other bone development parameters. Previ-ous work in our laboratory showed strong correlations be-tweenMRI estimates of VATandDXA—android fat (r =0.78)supports its use as a reasonable surrogate of VAT. Lastly,pQCT measurements were limited to weight-bearing bones(femur and tibia). The relationship between fat mass and bonemay be different at weight-bearing versus non-weight-bearingskeletal sites. To our knowledge, no studies have prospective-ly assessed bone structure at both the radius and tibia inchildren. Fat mass may be positively associated with femoraland tibial bone size, but not related at the radius or eveninversely related. This might explain, in part, why obesechildren are overrepresented in distal forearm fracture cases[46]. Future prospective studies of both weight-bearing andnon-weight-bearing skeletal sites will be necessary to examinethe site-specific differences in the effects of fat on bone andwhether the relationships between total body and regionaladiposity and bone parameters relate differently to fracturerisk at specific skeletal sites.
A significant strength of this study was the use of pQCT formeasuring indices of bone strength, volumetric BMD, andstructural properties thereby avoiding the confounding ofgrowth [8, 26]. Unlike DXA, with pQCT, the contributionsof changes in bone mass, density, and geometry to changes inindices of bone strength can be accurately estimated in youngchildren. Also, our longitudinal design improves upon thelimitations of past cross-sectional studies by providing anopportunity to examine prospectively how overall adiposityand specific fat depots commonly associated with metaboliccomorbidities may lead to suboptimal bone development.Further, assessment of adiposity from fat mass rather thanbody mass index (BMI), which is used as a surrogate ofadiposity in development studies and clinical practice, pro-vides a more direct assessment of the relationship of adipositywith bone without the confounding of variation in other
156, Page 8 of 10 Arch Osteoporos (2013) 8:156
components of body composition. The control of diet andphysical activity, maturation reflected in PHV [29], and wholebody lean mass by direct analysis using DXA [2, 22] wasanother strength of the study.
Conclusion
In conclusion, our results demonstrated that after controllingfor growth, maturation, whole body lean mass, diet, and phys-ical activity, baseline measures of total body and android fatmasses were positively associated with changes in bonestrength and density at weight-bearing bone sites (femur andtibia). However, girls in the highest versus lowest thirds ofAFM experienced smaller gains in cortical vBMD growth atweight-bearing sites providing evidence that higher levels ofcentral adiposity may counteract the positive effects of totaladiposity, and this effect may vary by skeletal site. The findingssuggest that higher levels of abdominal adiposity during thepre- and early pubertal years may not only serve as an impor-tant risk factor for metabolic dysfunction but may also contrib-ute to suboptimal cortical bone development in girls. Futurestudies in obese children will be needed to test this possibility.
Acknowledgments The project described was supported by AwardNumber HD-050775 (SG) from the National Institute of Child Healthand Human Development. The content is solely the responsibility of theauthors and does not necessarily represent the official views of theNational Institute of Child Health and Human Development or theNational Institutes of Health. DRL is supported by the US Departmentof Agriculture (USDA) National Needs Fellowship: Graduate Training inNutritional Sciences (grant support NIH/NICHD #HD-050775).
Conflicts of interest None.
References
1. Goulding A, Jones IE, Taylor RW, Manning PJ, Williams SM (2000)More broken bones: a 4-year double cohort study of young girls withand without distal forearm fractures. J Bone Miner Res 15:2011–2018
2. Goulding A, Taylor RW, Jones IE, McAuley KA, Manning PJ,Williams SM (2000) Overweight and obese children have low bonemass and area for their weight. Int J Obes Relat Metab Disord 24:627–632
3. Pollock NK, Laing EM, Baile CA, Hamrick MW, Hall DB, LewisRD (2007) Is adiposity advantageous for bone strength? A peripheralquantitative computed tomography study in late adolescent females.Am J Clin Nutr 86:1530–1538
4. Ducher G, Bass SL, Naughton GA, Eser P, Telford RD, Daly RM(2009) Overweight children have a greater proportion of fat massrelative to muscle mass in the upper limbs than in the lower limbs:implications for bone strength at the distal forearm. Am J Clin Nutr90:1104–1111
5. Goulding A, Grant AM, Williams SM (2005) Bone and body com-position of children and adolescents with repeated forearm fractures.J Bone Miner Res 20:2090–2096
6. McGraw B, McClenaghan BA, Williams HG, Dickerson J, Ward DS(2000) Gait and postural stability in obese and nonobese prepubertalboys. Arch Phys Med Rehabil 81:484–489
7. D'Hondt E, Deforche B, De Bourdeaudhuij I, Lenoir M (2008)Childhood obesity affects fine motor skill performance under differ-ent postural constraints. Neurosci Lett 440:72–75
8. Faulkner RA, Bailey DA (2007) Osteoporosis: a pediatric concern?Med Sport Sci 51:1–12
9. Foley S, Quinn S, Jones G (2009) Tracking of bone mass fromchildhood to adolescence and factors that predict deviation fromtracking. Bone 44:752–757
10. Ellis KJ, Shypailo RJ, Wong WW, Abrams SA (2003) Bone mineralmass in overweight and obese children: diminished or enhanced?Acta Diabetol 40(Suppl 1):S274–S277
11. Goulding A, Taylor RW, Grant AM, Murdoch L, Williams SM,Taylor BJ (2008) Relationship of total body fat mass to bone areain New Zealand five-year-olds. Calcif Tissue Int 82:293–299
12. AckermanA, Thornton JC,Wang J, Pierson RN Jr, HorlickM (2006)Sex difference in the effect of puberty on the relationship between fatmass and bone mass in 926 healthy subjects, 6 to 18 years old.Obesity (Silver Spring) 14:819–825
13. Lazcano-Ponce E, Tamayo J, Cruz-Valdez A, Diaz R, Hernandez B,Del Cueto R, Hernandez-Avila M (2003) Peak bone mineral areadensity and determinants among females aged 9 to 24 years inMexico. Osteoporos Int 14:539–547
14. Dimitri P, Wales JK, Bishop N (2010) Fat and bone in children:differential effects of obesity on bone size and mass according tofracture history. J Bone Miner Res 25:527–536
15. Pollock NK, Bernard PJ,Wenger K, Misra S, Gower BA, Allison JD,Zhu H, Davis CL (2010) Lower bone mass in prepubertal overweightchildren with prediabetes. J Bone Miner Res 25:2760–2769
16. Russell M, Mendes N, Miller KK, Rosen CJ, Lee H, Klibanski A,Misra M (2010) Visceral fat is a negative predictor of bone densitymeasures in obese adolescent girls. J Clin Endocrinol Metab 95:1247–1255
17. Rosen CJ, Bouxsein ML (2006) Mechanisms of disease: is osteopo-rosis the obesity of bone? Nat Clin Pract Rheumatol 2:35–43
18. Gilsanz V, Chalfant J, Mo AO, Lee DC, Dorey FJ, Mittelman SD(2009) Reciprocal relations of subcutaneous and visceral fat to bonestructure and strength. J Clin Endocrinol Metab 94:3387–3393
19. Wetzsteon RJ, Petit MA, Macdonald HM, Hughes JM, Beck TJ,McKayHA (2008) Bone structure and volumetric BMD in overweightchildren: a longitudinal study. J Bone Miner Res 23:1946–1953
20. Petit MA, Beck TJ, Hughes JM, Lin HM, Bentley C, Lloyd T (2008)Proximal femur mechanical adaptation to weight gain in late adoles-cence: a six-year longitudinal study. J Bone Miner Res 23:180–188
21. Petit MA, Beck TJ, Shults J, Zemel BS, Foster BJ, Leonard MB(2005) Proximal femur bone geometry is appropriately adapted tolean mass in overweight children and adolescents. Bone 36:568–576
22. Clark EM, Ness AR, Tobias JH (2006) Adipose tissue stimulatesbone growth in prepubertal children. J Clin Endocrinol Metab 91:2534–2541
23. Wey HEBTB, Wey CL, Specker BL (2011) Cross-sectional versuslongitudinal associations of lean and fat mass with pQCT boneoutcomes in children. J Clin Endocrinol Metab 96:106–114
24. Janicka A,Wren TA, SanchezMM, Dorey F, Kim PS,Mittelman SD,Gilsanz V (2007) Fat mass is not beneficial to bone in adolescentsand young adults. J Clin Endocrinol Metab 92:143–147
25. Yerges-Armstrong LM, Miljkovic I, Cauley JA, Sheu Y, Gordon CL,Wheeler VW, Bunker CH, Patrick AL, Zmuda JM (2010) Adiposetissue and volumetric bone mineral density of older Afro-Caribbeanmen. J Bone Miner Res 25:2221–2228
26. Farr JN, Funk JL, Chen Z, Lisse JR, Blew RM, Lee VR, LaudermilkM, Lohman TG, Going SB (2011) Skeletal muscle fat content isinversely associated with bone strength in young girls. J Bone MinerRes 26:2217–2225
Arch Osteoporos (2013) 8:156 Page 9 of 10, 156

27. CoSMa F (2001) American Academy of Pediatrics: medical condi-tions affecting sports participation. Pediatrics 107:1205–1209
28. Lohman TGRA, Martorell RA (1988) Anthropometric standardiza-tion reference manual. Champaign, IL
29. Mirwald RL, Baxter-Jones AD, Bailey DA, Beunen GP (2002) Anassessment of maturity from anthropometric measurements. Med SciSports Exerc 34:689–694
30. Laudermilk MJ, Manore MM, Thomson CA, Houtkooper LB, FarrJN, Going SB (2012) Vitamin C and zinc intakes are related to bonemacroarchitectural structure and strength in prepubescent girls. CalcifTissue Int 91:430–439
31. Rockett HR, Breitenbach M, Frazier AL, Witschi J, Wolf AM, FieldAE, Colditz GA (1997) Validation of a youth/adolescent food fre-quency questionnaire. Prev Med 26:808–816
32. Aaron DJ, Kriska AM, Dearwater SR, Cauley JA, Metz KF, LaPorteRE (1995) Reproducibility and validity of an epidemiologic ques-tionnaire to assess past year physical activity in adolescents. Am JEpidemiol 142:191–201
33. Farr JN, Lee VR, Blew RM, Lohman TG, Going SB (2011) Quan-tifying bone-relevant activity and its relation to bone strength in girls.Med Sci Sports Exerc 43:476–483
34. Shedd KM, Hanson KB, Alekel DL, Schiferl DJ, Hanson LN, VanLoanMD (2007) Quantifying leisure physical activity and its relationto bone density and strength. Med Sci Sports Exerc 39:2189–2198
35. Kontulainen SA, Johnston JD, Liu D, Leung C, Oxland TR, McKayHA (2008) Strength indices from pQCT imaging predict up to 85% ofvariance in bone failure properties at tibial epiphysis and diaphysis. JMusculoskelet Neuronal Interact 8:401–409
36. Farr JN, Chen Z, Lisse JR, Lohman TG, Going SB (2010) Relation-ship of total body fat mass toweight-bearing bone volumetric density,geometry, and strength in young girls. Bone 46:977–984
37. Stratec Medizintchnik (2004) Stratec Medizintchnik XCT 3000 man-ual, software version 6.0. Pforzheim, Germany
38. Lohman TG, Chen Z (2005) Dual energy x-ray absorptiometry. InHeymsfield SB, Lohman TG, Wang Z-M, SB G (eds) Human bodycomposition, 2nd. edn. United States
39. Morris NMUR (1980) Validation of a self-administered instrument toassess stage of adolescent development. J Youth Adolesc 9:271–280
40. Kuczmarski RJ, Ogden CL, Guo SS, Grummer-Strawn LM, FlegalKM, Mei Z, Wei R, Curtin LR, Roche AF, Johnson CL (2002) 2000CDC growth charts for the United States: methods and development.Vital Health Stat 11:1–190
41. USDA (2010) 2010 Dietary guidelines for Americans. In USDA (ed)online: http://www.cnpp.usda.gov/dietaryguidelines.htm. Accessed17 Aug 2012
42. Wang MC, Bachrach LK, Van Loan M, Hudes M, Flegal KM,Crawford PB (2005) The relative contributions of lean tissue massand fat mass to bone density in young women. Bone 37:474–481
43. Kalkwarf HJ, Laor T, Bean JA (2011) Fracture risk in children with aforearm injury is associated with volumetric bone density and corticalarea (by peripheral QCT) and areal bone density (by DXA).Osteoporos Int 22:607–616
44. Dimitri P, Bishop N, Walsh J, Eastell R (2012) Obesity is a risk factorfor fracture in children but is protective against fracture in adults: aparadox. Bone 50:457–466
45. Wren TA, Shepherd JA, Kalkwarf HJ, Zemel BS, Lappe JM,Oberfield S, Dorey FJ, Winer KK, Gilsanz V (2012) Racial disparityin fracture risk between white and nonwhite children in the UnitedStates. J Pediatr 161:1035–1040
46. Skaggs DL, Loro ML, Pitukcheewanont P, Tolo V, Gilsanz V (2001)Increased body weight and decreased radial cross-sectional dimensionsin girls with forearm fractures. J Bone Miner Res 16:1337–1342
156, Page 10 of 10 Arch Osteoporos (2013) 8:156