longitudinal outcomes of cte participation
TRANSCRIPT

Jessica A. Brown
2016
Longitudinal Outcomes
of CTE Participation:
P-16+ Transitions in Texas and the
Rio Grande Valley
P O L I C Y B R I E F S U B M I T T E D T O T H E E R C A D V I S O R Y B O A R D

This policy brief is presented as part of the final requirements put forth by the ERC Advisory
Board as part of the agreement for data use. Data and reporting extend from the request granted
to the Rio Grande Valley Linking Economic and Academic Development (RGV LEAD) project
granted permission on 12/9/2013 and given an extension through 12/8/2017. The information in
this report comes from a PhD dissertation of the same name from The University of Texas at
Austin.
The research presented here utilizes confidential data from the State of Texas supplied by the
Texas ERC at The University of Texas at Austin. The author gratefully acknowledges the use of
these data. The views expressed are those of the author and should not be attributed to the Texas
ERC or any of the funders or supporting organizations mentioned herein. Any errors are
attributable to the author.

Longitudinal Outcomes of CTE Participation: P-16+ Transitions in Texas and the Rio Grande Valley
Executive Summary
Context
The jobs of tomorrow are here today. They require enhanced skill sets and higher levels of
education. Attainment has already fallen behind economic development, though. To fill these
gaps, policymakers have turned towards practices which lead to better transitions between high
school, higher education, and the workforce. This study looks at one such reform model. It
examines student outcomes associated with participation in Career and Technology Education
(CTE), specifically Tech Prep programming. The study explores the benefits of participation in
Tech Prep across P-16+ transitions in both Texas and the Rio Grande Valley (RGV)—an area
known for its unique context and widespread implementation of Tech Prep.
Focus
The purpose of this study is to understand the ways in which non-traditional academic models,
such as CTE Tech Prep, may be used to foster college and career transitions. The focus of
research explores the impacts of Tech Prep participation on longitudinal outcomes related to the
P-16+ pipeline. Specific questions guide research. These are:
(RQ1) What student- and school-level characteristics influence Tech Prep participation?
(RQ2) Relative to comparable students, what impact does Tech Prep participation have on high
school transitions, higher education enrollment, developmental remediation,
postsecondary attainment, and workforce participation?
Methods
Using data from the TEA (Texas Education Agency), THECB (Texas Higher Education
Coordinating Board), and TWC (Texas Workforce Commission), cohorts of high school students
graduated in 2009 and 2010 are tracked through four years of postsecondary access and five
years of workforce participation. Methods consist of Propensity Score Matching (PSM) of
students to control for selection bias. PSM includes a two-step process which first models the
predicted probability of all students enrolling in Tech Prep, and then matches Tech Prep to non-
Tech Prep students using a nearest neighbor sampling method. PSM creates a quasi-
experimental control group for comparison. Multilevel logistic regression is then used to
ascertain the odds of reaching each longitudinal outcome, including estimates of Tech Prep
participation and models associated with the five key P-16+ areas.
Findings
Analysis suggests Tech Prep participation is inclusive of a more diverse set of students than
traditional academic paths. Participation in Tech Prep during high school leads to gains across all
P-16+ transition points. Tech Prep increases opportunities to transition to higher education after
high school, providing stronger pathways to community college and greater access for
traditionally disadvantaged students. When combined with academic rigor, Tech Prep
participation works to improve enrollment and expands matriculation into four-year institutions.
Importantly, Tech Prep interacts with a number of student traits, increasing the likelihood of
postsecondary attainment. In addition, Tech Prep works to impact the odds of transitional and
post-postsecondary employment. RGV area comparisons indicate significant regional variation;
RGV is associated with greater odds of college readiness and higher rates postsecondary
enrollment.
Implications
Results are numerous and provide strong evidence for the efficacy of Tech Prep models in the
RGV, Texas, and beyond. Findings demonstrate the need for further, quantitative and qualitative
review as expansion and implementation grow. They inform on the utility of Tech Prep programs
as well as illustrate the possibilities of using longitudinal data to explore effects of educational
models on student outcomes.
Moreover, implications connect to the greater policy discussion. Knowledge gained from this
study offers insight into the current legislative stalemate over federal Perkins reauthorization and
CTE funding. Additionally, it provides useful guidelines for Texas as schools and districts work
to develop CTE programs in response to recent changes in graduation plans under House Bill 5.

TABLE OF CONTENTS
THE JOBS OF TOMORROW 6
POLICY CONTEXTS 6
FOCUS OF THE STUDY 8
RESEARCH DESIGN 9
METHODS 9
DATA 9
PROPENSITY SCORING 10
HIERARCHICAL LINEAR REGRESSION 10
SELECTED FINDINGS 12
WHAT INFLUENCES TECH PREP PARTICIPATION 12
P-16+ TRANSITIONS IN TEXAS 13
THE RIO GRANDE VALLEY 17
IMPLICATIONS FOR THE FUTURE 18
FUTURE EXPLORATION 19
CHALLENGES FOR PRACTITIONERS 19
IMPORTANCE OF CONTEXT 19
POLICY PRESSURES AND REFORM 20
FEDERAL LEGISLATION 20
STATE LEGISLATION 21
THE FUTURE OF REFORM 22
APPENDIX: REGRESSION TABLES 23
REFERENCES 41

Longitudinal Outcomes of CTE Participation: P-16+ Transitions in Texas and the Rio Grande Valley
The jobs, careers, and industries of tomorrow are no longer blueprints for the future. They are
here today (Organization for Economic Cooperation and Development [OECD], 2016). At the
same time, world markets have become increasingly interconnected, interdependent, and
competitive (Crist, Jacquart, & Shupe, 2002; Fletcher, Lasonen, & Hernandez, 2014; Ramsey,
1995). Global economies have shifted away from resource and manufacturing industries. Instead,
they now look towards information economies in which knowledge, technology, and services are
important drivers of growth and wealth (Castells, 2010; OECD, 2016). Innovative industries—
and their correspondingly novel career opportunities—call for increased skill sets and higher
levels of education (Carnevale, Smith, & Strohl, 2010). Facing greater competition and
enormous growth in previously undeveloped markets, America is now tasked with growing its
educated labor supply.
THE JOBS OF TOMORROW
The need for more—and better—educated employees is predicated on several factors inherent in
the workforce today. First, there is a growing shift in what job opportunities will be available to
young workers. Second, existing gaps in education and employment are expanding.
Today many prime-age workforce members, those ages 25-54, are working in jobs that require a
high school diploma or less (National Governor’s Association [NGA], 2014). These jobs are
quickly disappearing which will leave citizens unemployed or underemployed, stuck with low
and unlivable wages (Carnevale et al, 2010). The retirement of the baby boomer generation,
coupled with closures in previously popular industries, have shaped the forecast of replacement
positions as well (Fitzsimmons, 1999; Symonds, Schwartz, & Ferguson, 2011). Estimates project
that both replacement and new job opportunities will necessitate higher levels of educational
attainment. Forecasts predict two-thirds of positions in the next decades will require some form
of postsecondary education (Brown & Schwartz, 2014; Castellano, Stringfield, & Stone, 2003).
A quarter of anticipated jobs will require some higher education though not necessarily a four-
year degree (Carnevale et al, 2010). These include professions which demand either an industry
recognized certificate or associate’s degree.
A preponderance of research has shown that the lack of a high school degree in this current day
relegates a person to a lifetime of poorly paid, unskilled labor opportunities (Seidman & Ramsey,
1995). Further, low postsecondary attainment levels keep many more from experiencing high-
paid, middle class job opportunities (Carnevale et al, 2010; Castellano et al, 2003). Gaps between
disadvantaged, underserved populations extend inequity (Kao & Thompson, 2003; Ross et al,
2012; Lumina, 2015; U.S. Department of Labor [USDOL], 2015). Shifting economies in
combination with growing demand for skills and education in the future will only exacerbate
inequalities—unless appropriate interventions are implemented.
POLICY CONTEXTS
Growing requirements in the workforce ahead have forced many to rethink policy connections
between education and employment. Current policies do not sufficiently bridge barriers to
postsecondary education which keep certain students from gaining the necessary skills for the

jobs of tomorrow. To fill gaps and grow economies, policymakers have turned towards investing
in practices which lead to better transitions between high school, higher education, and the
workforce.
Commonly referred to as P-16+ pipelines, these are sets of initiatives which address disconnects
in education and attempt to integrate the system for greater effectiveness (Bailey, 2009;
Kleinman, 2001). P-16+ research concentrates on identifying which transitions in education have
negative impacts on student potential, and what interventions connect transition points to help
students reach greater attainment (Bragg & Durham, 2012; Callan, Finney, Kirst, Usdan, &
Venezia, 2006; McClafferty, Jarsky, McDonough, & Nunez, 2009; Mustian, Mazzotti, & Test,
2013). Reforms focus on targeted, comprehensive, and/or non-traditional methods of providing
educational services to students.
Career and Technical Education
Because traditional transitions and traditional approaches have not served all students well in the
past, educators have turned focus to diverse options to meet requirements for academic
achievement. These reforms meet college ready standards while also fulfilling student interests
and developing career skills for the future. Technical coursework has been an ideal area for this
type of reform implementation.
Vocational education historically focused on teaching skills at the detriment to academic content
(Brown & Schwartz, 2014; Dare, 2006). In addition, programs were often separated and tracked
away from academic paths and students, creating divisions which exacerbated gaps and
inequalities (Castellano et al, 2003; Dare, 2006). The press for an educated workforce has
demanded a new vocational learning platform. Through a series of reforms pushed by
policymakers and practitioners alike, vocational education has been reshaped within past
decades. Reform has promoted connections between technical content and growing workforce
demands, content and academic skills, and content with postsecondary alignment (Aliaga,
Kotamraju, & Stone, 2014).
The use of the term vocational education has fallen out of favor and been replaced with Career
and Technical Education (CTE). Along with a name change, programs and funding have
changed dramatically. The Carl D. Perkins Vocational and Technical Education Act (later the
Career and Technical Education Act) passed in 1984 and was reauthorized at various times from
1990-2006. Federal Perkins legislation was a response to concerns that secondary schools were
failing to develop students in the academic and technical skills needed for a 21st century
economy. Policy connected to changing market demands for increased technology and
information in a globalized, competitive workforce (Hershey, Silverberg, Owens, & Hulsey,
1998). Federal legislation was the basis for many changes to CTE including curricular
improvements, modernization of technical skills, and expansion of programming to a wider
population of students (Friedel, 2011).
CTE has become more integrated, rigorous, and complex, introducing technology and new career
paths (Ramsey, 1995). Courses and programs have—and are still—working to integrate core
academic standards alongside technical training (Stipanovic, Lewis, & Stringfield, 2012). Newly
designed CTE courses offer exposure to career planning and job exploration; they provide
industry exposure through hands-on experiences and mentoring (Hutchins & Akos, 2013;
Rojewski & Hill, 2014). Program participation translates to both workforce training and
postsecondary preparedness.

Studies have suggested the use of CTE may help with high school retention and graduation as
well as lead to a greater probability of enrollment and persistence in higher education (Allen,
2012; Brown, 2003; Neild & Byrnes, 2014; Zinth, 2014). In addition, students with CTE
backgrounds may be better prepared to take on higher paying jobs with or without further,
postsecondary training (Mane, 1999). For the first time, technical programs—those sneered at as
vocational education in the past—have been called upon to remedy gaps in educational
transitions and attainment.
Tech Prep Programs
Important to Perkins legislation and CTE reform, has been the creation of advanced CTE
programs—in more recent updates to legislation this is termed as Programs of Study (POS)
models. These CTE programs offer integrated academic content, technical skills and experiences,
and advanced opportunities through credit based transition models. Many advanced CTE
programs offer internships, on-the-job training, and/or certification possibilities through dual
credit courses. One such example is Tech Prep programming.
The goal of Tech Prep, or Technical Preparation Programming, programs is to create better
articulation between high school and higher education. Programs engage students in career
focused pathways, prepare students for college and careers, and allow for workplace exposure
and mentoring (Bragg, 2000). Tech Prep programs are part of a regimented CTE course plan;
they include a planned sequence of study in a defined field during high school which includes
postsecondary training and leaves the student with some form of higher education credential
upon completion (U.S. Department of Education [USDOE], 2016). Tech Prep programs involve
complex partnerships with high schools, higher education providers, and local industries to fully
implement and involve students in the curriculum. Partnerships are called regional consortia and
they work articulating courses and curriculum across varying institutions. Through program
implementation, Tech Prep models have the potential to create coherent transitions in the P-16+
pipeline while providing relevant and rigorous technical curriculum to all students.
Today Tech Prep programs are widespread. A survey of states in 2008 found that over half (29)
have active, comprehensive Tech Prep programs (Brush, 2008). Tech Prep has been shown to
equalize educational opportunities and expectations resulting in diminished academic tracking
and increased participation by all types of students (Dare, 2006; Fishman, 2015). Studies have
suggested the use of Tech Prep may help with high school retention and graduation (Cellini,
2006; Stone & Aliaga, 2005). Participation may also lead to a greater probability of enrollment
and persistence in higher education (Bailey & Karp, 2003; Bragg, 2006). These findings are
especially true for students at greater risk of dropping out and receiving an incomplete education
(Bragg, Loeb, Gong et al, 2002; Brown, 2003). CTE Tech Prep programs are seen as promising
reform models which can simultaneously inspire students to train at the postsecondary level
while also keeping traditionally low performing students interested in education long enough to
learn skills and content needed to secure a quality job (Cellini, 2006; Kim, 2014).
FOCUS OF THE STUDY
CTE Tech Prep has enormous potential in its design. The program is meant to be an attractive
and challenging pathway to high school completion and higher education attainment.
Practitioners today are expanding Tech Prep implementation and also working to provide

similar, advanced CTE programs using its program components. At this point in time it is
important to study the impacts of past CTE efforts in order to improve future endeavors.
RESEARCH DESIGN
The purpose of this study is to better understand the ways in which advanced CTE models, such
as Tech Prep, may be used to foster college and career transitions. The focus of research explores
the impacts of CTE Tech Prep participation on longitudinal outcomes related to the P-16+
pipeline. Given the need for more rigorous assessment within the current body of CTE research,
the design of this study aligns to criteria for research put forth by What Works Clearinghouse
(WWC) standards (Fritz et al, 2012; Nimon, 2012). Specifically, the research design works to
meet the evidence standards of strong, quasi-experimental studies of comparison groups (Gemici
& Rojewski, 2007; WWC, 2014). Methods include propensity score matching of students to
control for selection bias, and the multilevel modeling of logistic regression on a variety of
outcomes associated with Tech Prep participation. The outcome variables investigated
encompass high school transitions, higher education enrollment, developmental remediation,
postsecondary attainment, and workforce participation. Findings are explored and connected to
current contexts, CTE research, and education policies. They create multiple implications for
both policymakers and practitioners. The analytic strategies used in this study work together to
yield a rich set of findings which strengthen the connections between advanced CTE
participation and student success.
Research Questions
The study is an exploration of the longitudinal outcomes related to participation in advanced
CTE programming, Tech Prep. In addition, comparisons between the RGV LEAD (Rio Grande
Valley Linking Academic and Economic Development) consortium area and the rest of Texas
are investigated to identify impacts of implementation. For this study, one broad question covers
the intent of analyses. How do advanced CTE programs, such as Tech Prep programming, affect
student outcomes across the P-16+ pipeline? Specific questions guide research. These are:
RQ1. What student- and school-level characteristics influence Tech Prep participation?
RQ2. Relative to comparable students, what impact does Tech Prep participation have on high
school transitions, higher education enrollment, developmental remediation,
postsecondary attainment, and workforce participation?
METHODS
DATA
Information for the study comes from the Texas Education Research Center (ERC)
clearinghouse. The ERC hosts access to high quality, longitudinal data from the Texas Education
Agency (TEA), the Texas Higher Education Coordinating Board (THECB), and the Texas
Workforce Commission (TWC). Multiple data sets from all three state agencies are combined
using a unique identifier in order to track students over time and different educational settings.
Using this resource, high school graduate cohorts from 2009 and 2010 are matched against both
higher education and workforce information to ascertain information on selected student
outcomes. Data sets include information on student demographics and high school participation,
postsecondary enrollment and course taking behaviors, higher education graduation files, and

workforce participation and wages.1 Data collection and coding decisions for ERC data are
relatively similar to FETPIP (Florida Education and Training Placement Information)
methodologies. This State Longitudinal Data System (SLDS) provides information on students
over time and from several agency sources. Researchers in the CTE field have praised their
reporting methods and requirements as rigorous means of evaluating impact measures across
educational transition points (Bragg, 2000; Sambolt & Blumenthal, 2013).
PROPENSITY SCORING
Statistical procedures are used to control bias in observational characteristics which differ across
Tech Prep participants and other students. Limiting bias occurs through a process of matching
comparable students or groups. Propensity Score Matching (PSM) is employed to create a
control group for use in comparison to Tech Prep participation. PSM modeling creates a match
based on the predicted probability a student will enroll in the treatment; in this case CTE Tech
Prep programming (Rosenbaum & Rubin, 1983; 1984). PSM consists of two stages, 1) creating a
propensity score and 2) matching propensities to form a control and treatment group.
First, propensity scores are developed by determining the odds of enrollment in Tech Prep for all
students. Estimated propensity scores are calculated for each student as the probability of
treatment given a number of characteristics or covariates. The formula for propensity scores can
be explained as such: e(x) is the propensity score, P the probability, T = 1 the treatment indicator
with values of 1 for treatment and 0 for control, and X a set of observed covariates the treatment
is conditional upon (Thoemmes, 2012).
The model above estimates propensity scores which include both student and school-indicators
combined to create a balanced PSM sample (Guo & Fraser, 2010; Heckman, Lalonde, & Smith,
1999). The estimated probability of Tech Prep participation—the propensity score—is saved as a
variable for all students. Each student in the treatment group (Tech Prep participants) is matched
to a student not in the group. Using a nearest neighbor technique, a Tech Prep student is first
selected. Their propensity score is matched to a subject with the closest, or most similar,
propensity. That student enters the control group and is taken out of the pool of potential matches
(i.e., matching without replacement). The selection and matching process is repeated until there
are no longer untreated students which can be matched to a Tech Prep student (Austin, 2011;
Haviland, Nagin, & Rosenbaum, 2007).
The PSM model is calculated using probit regression then matched using the nearest neighbor
technique with no replacement and a caliper of (.001). It created a smaller sub-sample of the
original data, drawing only treatment and control matched cases. The PSM procedure resulted in
a parsimonious model, creating a balanced sample of treated and non-treated cases. Balancing
tests revealed the uneven distribution of student and school indicators diminished with the use of
PSM allowing for greater specificity in Tech Prep comparisons (Caliendo & Kopeinig, 2005;
West et al, 2014).
HIERARCHICAL LINEAR REGRESSION
Inferential analysis is conducted upon the sample created by the PSM procedure to explore
impacts of participation in Tech Prep compared to the matched control group. Outcomes are
1 Over 130 individual data files from the Texas ERC were merged to create the longitudinal data sample.

measured at varying points along the P-16+ pipeline. As students are nested within several
different structures and institutions, multilevel hierarchical modeling is applied for all statistical
procedures (Nimon, 2012; Stevens, 2009). This type of modeling, sometimes referred to as
Hierarchical Linear Modeling (HLM), allows for better statistical estimates as it takes into
consideration the clustering of students within schools. Models also consider the effect of such
clusters. Multilevel equations are able to control for the school a student attended when
identifying results, and also provide meaningful context based on estimates of campus
characteristics (Gelman & Hill, 2007; Raudenbush & Bryk, 2002).
Outcomes associated with P-16+ pipeline transitions are dichotomous in nature, with yes or no
outcomes. As such, statistical analysis employs the use of logistic regression which takes
restricted outcomes and forms odds out of the probability of a successful outcome, or a yes in a
yes/no situation. Each covariate in the model predicts the difference in the odds that the outcome
of interest will occur. Using predictor variables to formulate an odds estimate for the outcome of
interest, it may then be turned back into a probability of occurrence (Gelman, & Hill, 2007;
Stevens, 2009). In this way, equation models such as these will be fitted for each outcome of
interest.
In this equation, the dependent variable is the log odds of student i in high school j experiencing
the outcome of interest (e.g., enrollment, attainment, etc). The β terms are the estimates of the
impact of the student-level covariates ( ) on the log odds. Coefficients are recurrent; they
suggest the relationship between a student-level predictor ( , Tech Prep participation (
and the interaction between the two variables ( In the intercept, : represents
level-two school characteristics related to the outcome in the model, and represents high
school within-campus effects.
Base modeling starts with all student- and campus-level variables as well as all potential
interactions between Tech Prep and student-level indicators. When interactions are found to be
insignificant, the model is trimmed to only significant interactions and main effects. This form of
backwards modeling continues iterations until the best fitting model converges. Final models
contain all student- and campus-level effect estimates—regardless of significance—and
significant interaction estimates.
Analysis for the study is comprised of multilevel modeling of logistic regression on a selection
of 18 outcomes. The full sample of 2009 and 2010 cohorts is used to identify factors important to
Tech Prep participation (N=534,035). To explore the impacts of Tech Prep participation at
varying transition points on the P-16+ pipeline, the PSM sample is employed (n=232,268).
Special attention in modeling is given to the relationship between Tech Prep participation and
outcomes, Tech Prep in relation to other student characteristics, and membership within the RGV
LEAD area as a measure of consortia implementation. Outcome modeling is organized into
participation then the five P-16+ transition areas with additional sub-analysis:

Tech Prep Participation
Post-High School Transitions
Transitioning to Higher Education Within
a Year of High School Graduation
Transitioning to a Community College
Within a Year of High School Graduation
Transitioning to a University Within a
Year of High School Graduation
Transitioning to the Workforce Within a
Year of High School Graduation
Postsecondary Enrollment
Enrolling in Higher Education Within
Four Years of High School Graduation
Enrolling in a Community College Within
Four Years of High School Graduation
Enrolling in a University Within Four
Years of High School Graduation
Postsecondary Attainment
Earning a Higher Education Credential
Earning an Associate’s Degree
Earning a Bachelor’s Degree
Earning a Higher Education Certificate
Developmental Need
Participating in Developmental
Coursework While Enrolled in Higher
Education
Participating in Mathematics
Developmental Coursework While Enrolled
in Higher Education
Participating in Reading Developmental
Coursework While Enrolled in Higher
Education
Participating in Writing Developmental
Coursework While Enrolled in Higher
Education
Workforce Participation
Transitioning to the Workforce Within a
Year of Earning a Postsecondary Credential
Transitioning to the Workforce (Two Jobs)
Within a Year of Earning a Postsecondary
Credential
SELECTED FINDINGS
WHAT INFLUENCES TECH PREP PARTICIPATION
The first research question of the study—what student- and school-level characteristics influence
Tech Prep participation—is examined with the full data sample from 2009 and 2010 high school
graduation cohorts (see Table 1). Of individual student traits, gender is significantly related to
Tech Prep. Women are slightly more likely to participate; this is contraindicative to past research
which found greater participation with male students (Bragg et al, 2002). Hispanic students and
students of low-SES backgrounds are more likely to enroll in Tech Prep. This does follow
participation rates of other studied Tech Prep programs (Bragg et al, 2002; Brown, 2003; Stone
& Aliaga, 2005). Though individual students from disadvantaged groups are more likely to
participate, greater proportions of minority or low-SES students at the campus-level negatively
affect participation. This suggests that schools serving disadvantaged populations struggle to
provide Tech Prep opportunities to their students.
Students in special populations or special programs are less likely to engage in CTE Tech Prep.
LEP (Limited English Proficient), special education, and Gifted and Talented (GT) students all
have lower odds of participation. Negative associations indicate that the largest block of
participants come from students not enrolled in any sort of targeted support or enrichment
programs. To this end, Tech Prep is meeting the demand of providing opportunities for the
middle majority—students whom are neither high nor low achieving. As most of the middle
majority fails to enroll or complete postsecondary education, it is a positive indicator that Tech
Prep programs may be used to boost P-16+ attainment for these types of students (Bragg, 2000;
Cellini, 2006; Parnell, 1985). However, more recent changes to CTE guidelines and policies
press for wider enrollment by all types of students (Friedel, 2011). These findings indicate Tech
Prep in Texas is lacking inclusive CTE programming for all its students.
Like prior studies of Tech Prep participation, students enrolled in the program are more likely to
exhibit traits of academic achievement and rigor (Cellini, 2006). Tech Prep is associated with
passing Texas State accountability exams (i.e., TAKS [Texas Assessment of Knowledge and
Skills Test]) in both reading and mathematics. Moreover, positive associations are made between
Tech Prep and college-ready diploma plans in Texas, both RHSP (Recommended High School
Plan) and DAP (Distinguished Achievement Plan). Lastly, dual credit courses are positively
connected to Tech Prep participation, increasing the predicted probability of enrollment with
each additional course taken. These findings are similar to past studies which found CTE and
Tech Prep students are generally more successful, or at least similar, in high school achievements
when compared to traditional academic paths (Bailey & Karp, 2003; Cellini, 2006; Dare, 2006).
Specifically, past studies point to growth in math scores and higher levels of overall
achievement, comparable to gains accumulated while completing a RHSP or DAP degree (Kim,
2014; Stone & Aliaga, 2005).
Several campus-level indicators prove significant in the odds of Tech Prep participation. An
Acceptable state accountability rating has a positive impact on Tech Prep participation compared
to schools which failed to meet accountability requirements. Schools rated as Exemplary, the
highest accountability rating in Texas at the time of the study, do not have significant
differences. This indicates that the highest performing schools do just as well as Acceptable
campuses in supporting advanced CTE participation. Large schools—those with enrollments
over 750 students—correspond to a greater predicted enrollment in CTE Tech Prep than others.
This is perhaps due to the greater availability of programming or resources usually found at
larger schools (Lee & Loeb, 2000; Leithwood & Jantzi, 2009). And, lastly, RGV LEAD schools
have much larger odds of Tech Prep participation when compared to Texas schools as a whole.
This suggests differences between the RGV area and the state in implementation.
In all, findings suggest Texas models of Tech Prep draw in a more diverse student group
compared to the traditional academic population. Texas Tech Prep students are even slightly
more diverse compared to past research studies (Bragg et al, 2002; Stone & Aliaga, 2005).
Results show Tech Prep as a positive tool for both middle and high achieving campuses though
low achieving campuses, and those serving high proportions of disadvantaged students,
demonstrate less success with participation. The state, like many other implementers, has
typified difficulties in including special populations of students (Gottfried, Bozick, Rose, &
Moore, 2014). However, modeling suggests Tech Prep is a promising and viable program for P-
16+ interventions.
P-16+ TRANSITIONS IN TEXAS
The second research question explores the impacts of CTE Tech Prep participation on
longitudinal outcomes related to the P-16+ pipeline. These are calculated using a quasi-
experimental sample which has been propensity scored and matched to decrease selection bias.
The odds of each outcome occurrence are determined using multilevel logistic regression; in all,

17 models are presented which study specific impacts of student traits, academic indicators, and
campus characteristics (see Tables 2-18). Added to model equations are interactions between
student-level information and Tech Prep participation. Regression models are organized into five
key areas along the P-16+ pipeline.
High School Transitions
High school transitions refer to the year after high school graduation and include four models:
participating in any form of higher education, attending either a community college or university,
and transitioning to the workforce. Findings are viewed in Tables 2-5. Overall, students from
disadvantaged backgrounds and low achieving students are less likely to enter higher education,
and have slightly greater odds of working after high school. These models produce the largest
amount of Tech Prep interactions in connection with student traits. As an example, female
students in Tech Prep have a 66% predicted probability of enrolling in higher education after
high school while women in the control group only show a 54% likelihood of transition.
In keeping with prior studies, Tech Prep participation results in greater odds of enrollment in
higher education for students, particularly students from disadvantaged backgrounds (Bragg et
al, 2002; Brown, 2003). Student achievement and rigor also plays a role, especially in the
transition to the university level. In all, there are differences between postsecondary institution
types as students transition from high school to higher education. Students from disadvantaged
backgrounds and lower achievement groups (e.g., LEP, special education) are more likely to
enter community colleges than universities. These differences are often positively moderated by
Tech Prep participation. Significant interactions show Tech Prep has its best success in preparing
students for enrollment at two-year institutions rather than the university level. Several studies
have found that while Tech Prep is positively associated with enrollment in community colleges,
participants are somewhat less likely to enroll in four-year institutions (Bailey & Karp, 2003;
Bragg et al, 2002; Cellini, 2006). This suggests participation may divert students directly into
two-year institutions directly following high school at the expense of university enrollment. This
may be due to curriculum associated with the Tech Prep program or rather due to the
institutionalized structures of Tech Prep itself. Programs require partnerships between secondary
and postsecondary institutions. Partnership funds, staff, and programs may all work to push
students towards the partnering community college in order to continue a Tech Prep program or
enroll for a different course of study. Interactions with Tech Prep in this study do provide some
evidence that participation broadens opportunities and helps to increase successful transitions at
all levels.
There are few impacts Tech Prep has on the decision to enter the workforce within a year of high
school graduation. Only special education and the number of CTE courses interact with Tech
Prep to increase the odds of workforce participation. Findings provide evidence that CTE and
Tech Prep participation may help prepare special education students for career transitions
(Gottfried et al, 2014; Rabren, Carpenter, Dunn, & Carney, 2014). Other indicators suggest race
and ethnicity have a strong influence as to whether or not a student joins the workforce upon
completing their high school diploma.
Postsecondary Enrollment
Three models estimate the odds of enrollment in higher education up to four years after high
school graduation: overall, community college, and university attendance. Tables 6-8 illustrate

regression outputs. Many interactions between Tech Prep and student traits impact enrollment
over time; these provide for greater odds of postsecondary access for Tech Prep students.
Impacts are often the largest at the community college level. In cases where students have lower
odds of enrollment (e.g., days absent, LEP, special education), Tech Prep moderates the effect,
enhancing the odds of participation. For example, special education students in Tech Prep have a
53% predicted probability of postsecondary enrollment compared to special education students
in the control group with a lower chance at 40%. These findings suggest that participation in
Tech Prep increases enrollment for students less likely to attend higher education due to special
needs or decreased motivation (Gottfried et al, 2014; Stone & Aliaga, 2005)
There are increases to the odds of enrolling at the university level for Tech Prep students who
participated in dual credit and CTE courses while in high school. This suggests advanced
courses, and dual coursework in particular, may improve four-year matriculation patterns. The
patterns are consistent with research that links dual credit to positive postsecondary outcomes
(Allen, 2010; An, 2013; Hoffman et al, 2009; Kleiner & Lewis, 2009; Lerner & Brand, 2006).
Dual-CTE corresponds to a negative interaction, though. Findings suggest Texas CTE courses
require more consideration, building better connections to college and career readiness. Study
interactions with dual-CTE run counter to available research (Wonacott, 2002; Stipanovic et al,
2012).
Developmental Education
Developmental coursework, or DE, are split into four regression models: participation in any
form of DE, and participation in a math course, reading, and/or writing DE course (see Tables 9-
12). The majority of student traits positively impact odds of enrollment in DE; students from
disadvantaged backgrounds or those enrolled in special programs often have the highest odds of
participating in developmental remediation.
Participation with Tech Prep, in past research, has been linked with greater postsecondary
preparedness (Castellano et al, 2003; Plank, DeLuca, & Estacion, 2008). This study finds
positive relationships with readiness as well. Low-SES students who participated in Tech Prep
have lower odds—a 46% probability of developmental coursework—compared to low-SES
control peers with a probability of 55% developmental enrollment. Tech Prep interacts with
indicators of achievement and rigor as well. While increased achievement decreases the odds of
DE, participation in Tech Prep lowers the odds of DE even further. Indicators of achievement
which Tech Prep interacts with include: dual credit, CTE, dual-CTE, and college ready diplomas.
Tech Prep is associated with greater odds of DE participation in mathematics modeling
according to dual credit, CTE courses, and DAP diplomas. This indicates that Tech Prep students
with higher achievement according to these traits may still have deficiencies in college ready
math leading to non-credit bearing courses. Working in the transition year increases odds of
developmental enrollment. Tech Prep interacts with transition employment to decrease odds of
DE participation. Overall, Tech Prep programs have mostly positive impacts on college
readiness.
Postsecondary Attainment
Tables 13-16 show results for attaining a postsecondary credential including gaining any
credential, attaining an associate’s degree, earning a bachelor’s degree, and/or obtaining a higher
education certificate. These odds are calculated only for students who enrolled in higher

education. Many student traits impact attainment models without interacting with Tech Prep.
They most often have negative influences on the odds of obtaining a higher education credential,
particularly a bachelor’s degree. Students from traditionally disadvantaged backgrounds do have
somewhat greater odds of completing an associate’s degree.
Tech Prep increases the chances of attaining a higher education credential, especially given
indicators of academic achievement and rigor. Participation in Tech Prep interacts with gender,
dual credit, CTE, and college diploma type (e.g., RHSP and DAP) to strengthen the predicted
probability of earning a postsecondary credential. Tech Prep interacts with gender, special
education, GT, and CTE to increase the odds of attaining an associate’s degree. Positive
interactions between Tech Prep and absences, dual credit, and CTE are found in the bachelor’s
degree model, though Tech Prep has negative impacts in combination with diploma types.
Gender, CTE, and dual-CTE all positively interact with Tech Prep in the odds of obtaining a
higher education certificate.
Past research on Tech Prep either found modest impacts in gaining semester credit hours or no
relationship between the program and postsecondary attainment (Bragg, 2006; Neumark &
Joyce, 2001; Neumark & Rothstein, 2004). In this study, Tech Prep is positively associated with
a number of predictors, and participation expands the possibility of postsecondary attainment.
Specifically, Tech Prep students who transition to higher education the year after high school
have greater odds of attainment (e.g., an 86% predicted probability compared to 78% for non-
Tech Prep peers). Tech Prep helps women to earn a degree and enhances the impacts of CTE in
earning a credential at two- and four-year institutions. Students who are involved with the
program and also take rigorous coursework in high school (e.g., dual credit courses, college
ready diploma plans, etc.) are more likely to succeed in higher education than similar students in
the control group. These findings provide evidence that Tech Prep is a viable tool for success
beyond traditional academic tracks (Bragg, 2000).
Workforce Participation
CTE participation has previously been connected to greater workforce outcomes compared to
traditional academic students in both the year after high school graduation and seven years out
(Bishop & Mane, 2004; Castellano et al, 2003). Individual traits such as gender or degree
attained also relate to long term earning capacity in connection with CTE (Maguire, Starobin,
Laanan, & Friedel, 2012). This study finds similar trends in CTE Tech Prep participation. Tables
17-18 describe the odds of workforce participation within a year of completing a postsecondary
credential.
Several student traits positively impact the odds of working after the completion of a
postsecondary credential. Women have greater odds of employment as do students from each
ethnic group. Tech Prep participation is associated with lower proportions of women and higher
proportions of Black students who take on second jobs. Achievement is, for the most part, linked
to greater workforce participation. Working within the transition year after high school leads to a
greater probability of working within the transition year after higher education—larger odds still
for Tech Prep students(71-72% probability). Students with certificates are associated with the
highest probability of workforce participation followed by students with bachelor’s and
associate’s degrees (which share similar chances of employment). Tech Prep slightly increases
the odds of having a job after earning a bachelor’s degree.

Summary of Longitudinal Findings
Findings provide strong evidence for the efficacy of Tech Prep models in Texas and beyond.
Tech Prep participation increases opportunities to transition to higher education after high
school, providing stronger pathways to community college and greater odds for traditionally
disadvantaged students. When paired with increased rigor and CTE coursework, program
participation works to improve enrollment over time and expand matriculation into four-year
institutions.
Tech Prep has positive impacts on college readiness as well, decreasing the chances of
developmental remediation. Importantly, Tech Prep interacts with a number of student traits,
increasing the likelihood of postsecondary attainment at all levels. After postsecondary
graduation, Tech Prep moderates the odds of workforce participation. Tech Prep is shown to
have far reaching impacts on students long after they complete their high school careers. Impacts
vary across P-16+ transitions, institutions, and types of students. Findings suggest Tech Prep is a
valuable option to increase P-16+ transitions either for targeted populations or entire campuses.
THE RIO GRANDE VALLEY
The RGV area and RGV LEAD consortium are particularly important to the study. Its location
and makeup provide a microcosm to some of the most pressing demographic issues facing
educational attainment and postsecondary transitions. The RGV hosts a large percentage of
minority students, high amounts of poverty, traditionally low percentages of educational
attainment, and is geographically located in areas less likely to have access to postsecondary
pathways or workforce opportunities (Lumina, 2015; Ross et al, 2012; U.S. Census Bureau
[USCB], 2016). Outcomes learned from such an area would be of significant interest to national
models of intervention as well as other state and local reform interventions (Allen, 2012).
Findings from all multilevel logistic regressions show RGV LEAD areas vary significantly from
the rest of Texas. This suggests differences in implementation, especially when controlling for
the types of schools and types of students within the RGV area. Quantitative results fit with prior
qualitative reviews of Texas implementation which indicate variability across Texas consortia
(Brown, 2001; Waller & Waller, 2004). It also holds with the larger research surveys which find
variations between implementation consortia and models (D’Amico, Morgan, Katsinas, &
Friedel, 2015; Hershey et al, 1998).
First, RGV area students are more likely to participate in Tech Prep. Students from the RGV
LEAD consortium have 8.62 greater odds of enrollment compared to students from other Texas
areas. This is a huge advantage in the probability of participation, holding all else constant. RGV
LEAD is the single largest predictor of Tech Prep participation in a model with many significant
covariates.
When looking at transitions within a year of high school graduation, students from RGV LEAD
areas have greater odds of enrollment in all higher education models. These findings indicate
RGV is successful in transitioning students to all levels of postsecondary institutions—
community colleges and universities. When modeling postsecondary enrollment over time, RGV
LEAD is significantly related to all models. Students from RGV area high schools, overall and at
the university level, are more likely attend higher education. At the community college level,
RGV students are slightly less likely to enroll over time. These findings suggest that the RGV
consortium is doing its strongest work at pushing students towards four-year institutions.

RGV is not significantly related to DE participation overall and corresponds to a lower predicted
probability of math DE participation. This indicates students from RGV LEAD areas are just as
prepared as students from in and around Texas—if not better prepared in math—to take credit-
bearing courses upon entry to higher education. RGV negatively impacts the odds of completing
a postsecondary credential. When breaking down models into the type of credential, RGV LEAD
is negatively associated with the odds of earning an associate’s degree but has a slightly positive
relationship with the odds of earning a bachelor’s degree. These findings are somewhat
frustrating given that prior models in the study suggest RGV is linked to higher enrollment. The
positive associations between enrollments paired with negative connections with attainment
replicate prior studies. These show a limited impact of individual Tech Prep programs/models on
higher education completion (Neumark & Joyce, 2011). RGV LEAD students are associated
with lower odds of workforce participation upon high school graduation. In a similar manner,
students from the RGV consortium area have lower odds of employment after completing a
postsecondary credential. These findings suggest there are limitations to employment for RGV
students in multiple P-16+ transition points.
Overall, modeling shows RGV has further work to accomplish getting students enrolled and
through higher education to a postsecondary credential and career. Strengths to date include the
transitions of students to higher education within a year of completing high school, indicators of
college readiness shown by decreased need for developmental education, and increased pathways
for students into the university pipeline.
IMPLICATIONS FOR THE FUTURE
Tech Prep works towards preparing students for the jobs of tomorrow in the classrooms of today.
Programming is aimed at reducing persistent gaps in educational attainment through increasing
transition pathways to higher education. The need to assess the efficacy of these interventions is
vital to understanding their use and potential in the wider framework of educational reform.
Research to date has been limited and many in the field are aware of the lack of rigorous efforts
connecting programs to student outcomes (Rojewski et al, 2012).
The current study helps better inform past research and examine the impacts of such models in
preparing students for college and career outcomes. Given the specific coding used in Texas
data, this study is able to correctly identify students involved in CTE Tech Prep. Explicit
definitions provided in data are superior to past studies which have relied on self identification or
complicated coding definitions (Aliaga et al, 2014; Bragg et al 2002; Hershey et al, 1998;
Stipanovic et al, 2012). As such, it provides a more reliable estimate for Tech Prep comparisons.
In addition, the study includes the use of quasi-experimental matching methods to decrease
selection bias; these create comparison groups which control for student and school
characteristics (Bozick & Dalton, 2012; Lewis & Overman, 2008; Rojewski & Xing, 2013).
Modeling in the study goes beyond simplistic methods found in many practitioner evaluations of
programs (Fritz et al, 2012; Gemici & Rojewski, 2007; Rojewski et al, 2012). It utilizes
hierarchical methods to best identify impacts of Tech Prep, accounting for students nested within
schools (Cohen et al, 2003; Nimon, 2012). Multilevel models are able to control for the school a
student attended when identifying results, and also provide meaningful context based on
estimates of campus characteristics.
Findings from the current study add to research by replicating and extending associations
between Tech Prep and P-16+ outcomes. They find positive associations between participation

and postsecondary enrollment (Bailey & Karp, 2003; Bragg et al, 2002; Cellini, 2006). Tech
Prep participation increases opportunities to transition to higher education after high school,
providing stronger pathways to community college and greater odds for traditionally
disadvantaged students. When paired with increased rigor and CTE coursework, Tech Prep
participation works to improve enrollment over time and expands matriculation into four-year
institutions. Models show varied but favorable relationships between Tech Prep and
postsecondary attainment, differing from previous research (Neumark & Joyce, 2011). Findings
also suggest there is implementation variability in the state as RGV LEAD areas are linked,
specifically, to greater odds of enrollment (Brown, 2001; Waller & Waller, 2004). These results
display great complexity across longitudinal outcomes. They create a host of possibilities for
using Tech Prep as either a targeted or comprehensive P-16+ reform.
FUTURE EXPLORATION
Further study should follow students through even longer time points to assess postsecondary
outcomes at six year intervals, and identify enrollment in graduate studies as part of post-
postsecondary measures. Also, more detailed analysis of workforce participation is yet to be
completed. These should investigate salary differentials according to participation. One piece of
Tech Prep which was not measured in the study is the completion of a Tech Prep program (only
Tech Prep participation was included in the current study). Additional research should combine
high school and higher education data to identify the characteristics which impact Tech Prep
program completion, resulting in a higher education credential. The current study provides strong
evidence that Tech Prep participation has meaningful impacts on P-16+ transitions. Future
research into the Texas Tech Prep program, and similar advanced CTE models such as POS
(Programs of Study), will advance research and practice even more.
CHALLENGES FOR PRACTITIONERS
Information from this study works to inform future implementation efforts for Tech Prep but also
wider reform contexts. Findings may be linked to the focus of P-16+ alignment and articulation,
college and career readiness standards, and support for educational attainment in underserved
students. These connections are vital to current reforms in CTE which hope to expand Tech Prep
models to a more diverse selection of industries and students through similar CTE POS models.
Research suggests CTE courses and programs have—and are still—working to integrate core
academic standards alongside technical training (Stipanovic et al, 2012). Reforms focus on
incorporating academic rigor and vertical alignment between secondary and postsecondary
curriculum (Brown, 2001; Castellano et al, 2008). There have been improvements within Tech
Prep implementation. Curriculum content and standards are becoming more applied, but it is a
gradual process (Bragg, 2000; Bragg & Reger, 2002; Hershey et al, 1998). Findings from this
study suggest positive impacts of CTE Tech Prep but also persistent limitations and gaps in the
program, specifically in promoting widespread readiness at university levels and perseverance to
degree attainment. There is need for additional alignment and deeper, qualitative review of Tech
Prep in Texas to better understand what components may best work to foster success.
IMPORTANCE OF CONTEXT
Within the effort to implement enhanced CTE and Tech Prep, understanding the context of
reform is important. It allows for better crafted local policy and informed practitioners—those
able to understand what will work in their specific circumstances. The Valley area and RGV

LEAD consortium are included in this study to help better understand some of the contextual
implications of reform. RGV LEAD is a well developed example of regional consortia created
under federal Perkins legislation and other state policies. As such it is an ideal region to view the
impacts of Tech Prep through student participation. More importantly, the geographic area of the
RGV provides a unique context to study educational reform for disadvantaged students.
Findings suggest that Tech Prep is a viable P-16+ model, especially in the RGV area and
particularly for its underserved population of students. This study only tells part of the story
though. Models suggest that RGV LEAD implementation of Tech Prep differs from the state as a
whole and results in significantly greater odds of completing various P-16+ transitions. While
models control for individual characteristics and campus-level differences, these findings do not
indicate why RGV LEAD is associated with greater participation in Tech Prep or higher levels of
postsecondary enrollment.
To better understand RGV LEAD impacts and implementation, a breakdown of the P-16+
partnership and specific Tech Prep components should be explored. Barriers and challenges
should be compared to achievements in implementing Tech Prep over time. Within the study,
other comprehensive and targeted reform initiatives must be connected to implementation to
provide a full picture of the college ready improvements in the area. Bright areas—those schools
or districts with high levels of success in Tech Prep—should be highlighted to find best
practices. This type of qualitative review would provide a more complete picture of
implementation paired with the present quantitative findings. In addition, a study of
implementation would provide a roadmap for others looking to create or modify their own Tech
Prep programs.
POLICY PRESSURES AND REFORM
Requirements of existing accountability standards for academic achievement have put pressures
on schools to improve in all areas, including technical education (Anderson, 2008; Chadd &
Drage, 2006). Perkins IV legislation took steps towards requiring accountability practices by
imposing performance indicators for CTE Tech Prep, many of which educators thought would be
too burdensome given data restrictions between K-12 and higher education (Friedel, 2011; Klein
et al, 2014). Since then, CTE programs have expanded in size and scope. CTE is often combined
as part of comprehensive school reforms. Advanced CTE courses are now linked to initiatives
such as school choice and curriculum standards redesign (Asunda et al, 2015; Castellano et al,
2003; Ramsey, 1995). Further expansion and focus in CTE areas will only increase calls for
accountability and changes to both federal and state policy contexts (Fletcher et al, 2014;
Maguire et al, 2012).
The need for accurate information on the long-term impacts of CTE and Tech Prep participation
is greater than ever. Accountability practices have been reshaped under the ESSA (Every Student
Succeeds Act) reauthorization of ESEA (Elementary and Secondary Education Act). Upcoming
CTE legislation coupled with recently changed accountability standards will force practitioners
and policymakers to gather more information on current and potential programs that may impact
student success.
FEDERAL LEGISLATION
Future changes to both federal and state/local CTE policies are imminent. Federal legislators
have finally taken up the reauthorization of Perkins legislation (Klein, 2015; Boyd et al, 2015).

Hearings on Perkins reauthorization started soon after the passage of ESSA, and in September
2016 the House voted to pass a reauthorization of the legislation. Entitled the Strengthening
Career and Technical Education for the 21st Century Act, this bill has bipartisan support and
passed 405-5. The proposed legislation provides states and local education agencies (i.e., school
districts) greater freedom in CTE goals and accountability. It allows for flexibility in spending
and focuses federal dollars based on the number of students taking CTE (Ujifusa, 2016). This
differs from past versions of Perkins which proportioned monies based on CTE programs and
courses (Friedel, 2011).
A Republican-backed Senate version of Perkins reauthorization contains language which has
currently stalled passage of the legislation. It requires the Department of Education (DOE) to
cede most of its control over federal CTE dollars and reduces most, if not all, accountability
measures. Hearings on the bill have been cancelled in the Senate. Though unlikely, the earliest
reauthorization may occur is in the lame duck session between the 2017 election and
inauguration (Stratford, 2016; Ujifusa, 2016).
The two largest points of contention which as are yet to be determined in Perkins reauthorization
are the level of accountability which CTE courses and programs will face, and the number of
CTE courses which will define a student as CTE for funding purposes. Former Perkins
legislation—those which first outlined Tech Prep programming—required accountability in the
form of tracking longitudinal outcomes. This has proved difficult given existing data capacities
in education (Friedel, 2011; Klein et al, 2014). The argument for future legislation is whether to
fold CTE into existing accountability measures, much like current state accountability standards.
Or, to provide for greater flexibility and less accountability, as the ESEA reauthorization to
ESSA has brought about less accountability and oversight at the federal level (Stratford, 2016).
It is likely funding in Perkins reauthorization legislation will not be specific to programs, but
rather allotted to states and districts according to student participation. The number of courses
which define a student as a CTE participator or CTE concentrator (e.g., enrolled in an advanced
CTE program like Tech Prep) have not been finalized. Grouping requirements, the numbers of
courses needed to reach a specific level of CTE, and occupational/career markers all vary
between programs and states (Aliaga eta al, 2014; Cox et al, 2015; Meer, 2007; Stone & Aliaga,
2005). That considered, an average student today completes 3.6 CTE credits during their high
school career (Aliaga et al, 2014). This study found the average number of CTE courses for all
students at 5.26 and 5.98 for the PSM sample. This suggests Texas has greater than average
enrollment, perhaps supporting positive impacts found in the study as well as enhanced future
funding possibilities.
However the new Perkins legislation is codified, the current study helps to inform policy as it
describes longitudinal impacts of Tech Prep participation across a wide and diverse state. It is a
model for additional POS which include CTE and credit based curriculum in an effort to improve
P-16+ transitions. Further, it allows for greater planning for the future distributions of funds
across models and students in relation to CTE and advanced CTE participation.
STATE LEGISLATION
Federal policy contexts are not the only area in which this study may inform changes in CTE
policy. The state of Texas has increased CTE participation through reforms in its graduation
plans, or diplomas. Passed in 2013 (and implemented for incoming freshman in the 2014-2015
school year), House Bill 5 reshaped its RHSP and DAP graduation plans into the Foundation

High School Program (FHSP). This new diploma plan involves basic courses, has possible
advanced features, and requires students to select an endorsement program (Education Service
Center 20 [ESC20], 2016). Endorsements include core and elective courses which result in the
selection of a career cluster. These new graduating requirements have pushed CTE to the
forefront of reform as all students are required take a greater number of CTE courses in
fulfillment of their career cluster. Further, it has increased opportunities to expand Tech Prep
programs and similar CTE POS, which fulfill endorsement requirements while also providing
dual enrollment opportunities.
Findings from this study are particularly important as they show Tech Prep as a promising tool to
bridge gaps in P-16+ transitions while also fulfilling new diploma requirements. Interactions
between Tech Prep and previous iterations of college ready degrees (e.g., RHSP, DAP) impact
student outcomes in several models. These outcomes, as well as other findings, inform new
graduation policies. Results from the study can be used to plan and implement FHSP diploma
programs while also increasing college readiness in other areas linked to CTE and Tech Prep.
THE FUTURE OF REFORM
The jobs, careers, and industries of tomorrow are upon us today. Attainment has already fallen
behind economic development, though. An incomplete education will not provide students with
the skills needed in current or future economies (Carnevale et al, 2010; Castellano et al, 2003).
To fill gaps, reforms must bridge transitions between high school, higher education, and the
workforce.
The growth of CTE and advanced CTE (i.e., Tech Prep), which utilize career-based curriculums
paired with credit based transitions, are a promising tool to meet academic and labor demands.
These strategies offer an additional pathway to higher education beyond the traditional route of
academic/college preparation. They have the potential to engender success in a wider selection of
students, those students who often fail to enroll and succeed in traditional pathways (Dare, 2006;
Parnell, 1985). This study adds to the greater discussion on P-16+ transition models by providing
valuable information as to the long-term impacts of CTE programs. Results are numerous and
provide strong evidence for the efficacy of Tech Prep models in the RGV, Texas, and beyond.
This study allows policymakers and practitioners alike to search out best practices using the
detailed impact models and interactions studied. These may lead to comprehensive reforms
and/or targeted Tech Prep models to reach certain students. Findings inform on the utility of
Tech Prep programs as well as illustrate the possibilities of using longitudinal data to explore
effects of educational models on student outcomes. Additionally, the exploration of outcomes for
students participating in advanced CTE across a large state with a diverse student population
provides helpful insight into the proficiencies and challenges faced by all states and local levels.
Longitudinal outcomes and measures may help shape greater CTE policy reform as well as
accountability policies or performance indicators across the broader educational spectrum. The
analytic strategies used in this study work together to yield a rich set of findings which
strengthen the connections between advanced CTE participation and student success.

APPENDIX: REGRESSION TABLES
Table 1. Odds of Participating in a Tech Prep Program in High School
Coefficient SD
FIXED EFFECTS
Intercept, γ00 -3.063 0.095
Student (Level 1), β1j…
Grad Year (2009), γ10 -0.102** 0.009
Days Absent, γ20 -0.002** 0.000
Gender (Female), γ30 0.047** 0.008
Low-SES, γ40 0.104** 0.009
Black, γ50 0.018 0.022
Hispanic, γ60 0.146** 0.020
White, γ70 -0.004 0.019
LEP, γ80 -0.648** 0.028
Special Education, γ90 -0.085** 0.016
Gifted & Talented, γ100 -0.354** 0.014
Met Exit Math, γ110 0.198** 0.012
Met Exit Reading, γ120 0.097** 0.018
Dual Credit, γ130 0.068** 0.003
RHSP Diploma, γ140 0.163** 0.013
DAP Diploma, γ150 0.173** 0.018
School (Level 2), β0j
RGV, γ01 2.154** 0.298
Percent Low-SES, γ02 -0.005** 0.002
Percent White, γ03 0.019** 0.002
Rated Acceptable, γ04 0.115** 0.031
Rated Exemplary, γ05 -0.011 0.029
Small School, γ06 -0.042 0.080
Large School, γ07 0.251** 0.084
Variance SD
RANDOM EFFECTS
Institution (Intercept), u0j 4.674 0.216 Note. **p<.01, *<.05
Students=534,035 High Schools=1,776

Table 2. Odds of Transitioning to Higher Education
Within a Year of High School Graduation
Coefficient SD Coefficient SD
FIXED EFFECTS
Intercept, γ00 -1.698** 0.070
Student (Level 1), β1j… Interactions
Grad Year (2009), γ10 0.066** 0.010
Days Absent, γ20 -0.027** 0.001 TPxAbsent, γ200 -0.004** 0.001
Gender (Female), γ30 0.177** 0.013 TPxSex, γ210 0.102** 0.019
Low-SES, γ40 -0.344** 0.012
Black, γ50 0.100* 0.038 TPxBlack, γ220 -0.167** 0.053
Hispanic, γ60 -0.400** 0.035 TPxHisp, γ230 -0.204** 0.049
White, γ70 -0.132** 0.034 TPxWhite, γ240 -0.246** 0.049
LEP, γ80 -0.447** 0.054 TPxLEP, γ250 -0.264** 0.076
Special Education, γ90 -0.320** 0.028 TPxSPED, γ260 0.236** 0.038
Gifted & Talented, γ100 0.289** 0.026 TPxGT, γ270 0.084* 0.036
Tech Prep, γ110 0.406** 0.068
Met Exit Math, γ120 0.358** 0.014
Met Exit Reading, γ130 0.444** 0.034 TPxRead, γ280 -0.120* 0.047
Dual Credit, γ140 0.253** 0.006 TPxDC, γ290 0.017* 0.008
CTE, γ150 0.014** 0.002
Dual CTE, γ160 -0.146** 0.011
RHSP Diploma, γ170 0.953** 0.020 TPxRHSP, γ300 -0.103** 0.024
DAP Diploma, γ180 1.172** 0.024
Transition Work, γ190 0.797** 0.010
School (Level 2), β0j
RGV, γ01 0.446** 0.065
Percent Low-SES, γ02 -0.002* 0.001
Percent White, γ03 -0.001 0.001
Rated Acceptable, γ04 0.065 0.037
Rated Exemplary, γ05 -0.006 0.031
Small School, γ06 -0.122** 0.039
Large School, γ07 0.159** 0.039
Variance SD
RANDOM EFFECTS
Institution (Intercept), u0j 0.172 0.010
Note. **p<.01, *<.05 Students=232,268, High Schools=1,704

Table 3. Odds of Transitioning to a Community College
Within a Year of High School Graduation
Coefficient SD Coefficient SD
FIXED EFFECTS
Intercept, γ00 -1.693** 0.071
Student (Level 1), β1j… Interactions
Grad Year (2009), γ10 0.086** 0.010
Days Absent, γ20 -0.010** 0.001 TPxAbsent, γ200 -0.003* 0.001
Gender (Female), γ30 0.138** 0.013 TPxSex, γ210 0.046* 0.018
Low-SES, γ40 -0.184** 0.011
Black, γ50 -0.102* 0.038 TPxBlack, γ220 -0.197** 0.051
Hispanic, γ60 -0.003 0.035 TPxHisp, γ230 -0.152** 0.046
White, γ70 -0.020 0.034 TPxWhite, γ240 -0.153** 0.046
LEP, γ80 -0.199** 0.054 TPxLEP, γ250 -0.289** 0.076
Special Education, γ90 -0.165** 0.027 TPxSPED, γ260 0.206** 0.035
Gifted & Talented, γ100 -0.557** 0.025 TPxGT, γ270 0.136** 0.034
Tech Prep, γ110 0.324** 0.064
Met Exit Math, γ120 -0.023 0.014
Met Exit Reading, γ130 0.271** 0.034 TPxRead, γ280 -0.109* 0.046
Dual Credit, γ140 0.032** 0.004
CTE, γ150 0.053** 0.002 TPxCTE, γ290 -0.027** 0.003
Dual CTE, γ160 0.051** 0.009
RHSP Diploma, γ170 0.459** 0.016
DAP Diploma, γ180 -0.225** 0.028 TPxDAP, γ300 0.149** 0.030
Transition Work, γ190 0.733** 0.010
School (Level 2), β0j
RGV, γ01 0.112 0.072
Percent Low-SES, γ02 0.001 0.001
Percent White, γ03 0.002** 0.001
Rated Acceptable, γ04 0.028 0.036
Rated Exemplary, γ05 -0.074* 0.030
Small School, γ06 -0.075 0.041
Large School, γ07 0.062 0.041
Variance SD
RANDOM EFFECTS
Institution (Intercept), u0j 0.217 0.011
Note. **p<.01, *<.05 Students=232,268, High Schools=1,704

Table 4. Odds of Transitioning to a University
Within a Year of High School Graduation
Coefficient SD Coefficient SD
FIXED EFFECTS
Intercept, γ00 -5.165** 0.104
Student (Level 1), β1j… Interactions
Grad Year (2009), γ10 0.028* 0.012
Days Absent, γ20 -0.037** 0.001 TPxAbsent, γ200 -0.004* 0.002
Gender (Female), γ30 0.069** 0.016 TPxSex, γ210 0.054* 0.023
Low-SES, γ40 -0.255** 0.015
Black, γ50 0.143** 0.029
Hispanic, γ60 -0.815** 0.027
White, γ70 -0.358** 0.026
LEP, γ80 -1.128** 0.092
Special Education, γ90 -1.002** 0.051
Gifted & Talented, γ100 0.632** 0.024 TPxGT, γ220 0.080* 0.033
Tech Prep, γ110 -0.003 0.025
Met Exit Math, γ120 1.162** 0.029
Met Exit Reading, γ130 0.975** 0.057
Dual Credit, γ140 0.220** 0.005 TPxDC, γ230 0.026** 0.008
CTE, γ150 -0.038** 0.003 TPxCTE, γ240 0.029** 0.004
Dual CTE, γ160 -0.116** 0.017 TPxDCTE, γ250 -0.088** 0.019
RHSP Diploma, γ170 1.706** 0.039
DAP Diploma, γ180 2.396** 0.042
Transition Work, γ190 0.227** 0.017 TPxTRWK, γ260 -0.114** 0.024
School (Level 2), β0j
RGV, γ01 0.621** 0.098
Percent Low-SES, γ02 -0.002 0.001
Percent White, γ03 -0.005** 0.001
Rated Acceptable, γ04 0.069 0.051
Rated Exemplary, γ05 0.139** 0.038
Small School, γ06 -0.181** 0.057
Large School, γ07 0.220** 0.056
Variance SD
RANDOM EFFECTS
Institution (Intercept), u0j 0.404 0.023
Note. **p<.01, *<.05 Students=232,268, High Schools=1,704

Table 5. Odds of Transitioning to the Workforce
Within a Year of High School Graduation
Coefficient SD Coefficient SD
FIXED EFFECTS
Intercept, γ00 -0.321** 0.055
Student (Level 1), β1j… Interactions
Grad Year (2009), γ10 0.018 0.013 TPxGrad, γ200 -0.041* 0.018
Days Absent, γ20 0.013** 0.001
Gender (Female), γ30 0.036** 0.009
Low-SES, γ40 -0.036** 0.011
Black, γ50 0.650** 0.025
Hispanic, γ60 0.695** 0.023
White, γ70 0.868** 0.023
LEP, γ80 -0.763** 0.034
Special Education, γ90 -0.370** 0.024 TPxSPED, γ210 0.144** 0.032
Gifted & Talented, γ100 -0.100** 0.016
Tech Prep, γ110 0.132** 0.014
Met Exit Math, γ120 -0.101** 0.014
Met Exit Reading, γ130 0.073** 0.022
Dual Credit, γ140 -0.018** 0.004
CTE, γ150 0.029** 0.002 TPxCTE, γ220 -0.028** 0.003
Dual CTE, γ160 0.015 0.009
RHSP Diploma, γ170 -0.144** 0.016
DAP Diploma, γ180 -0.447** 0.022
Transition HE, γ190 0.791** 0.010
School (Level 2), β0j
RGV, γ01 -0.267** 0.045
Percent Low-SES, γ02 0.000 0.001
Percent White, γ03 0.003** 0.001
Rated Acceptable, γ04 0.063 0.034
Rated Exemplary, γ05 -0.123** 0.027
Small School, γ06 0.086* 0.031
Large School, γ07 -0.081* 0.029
Variance SD
RANDOM EFFECTS
Institution (Intercept), u0j 0.072 0.005
Note. **p<.01, *<.05 Students=232,268, High Schools=1,704
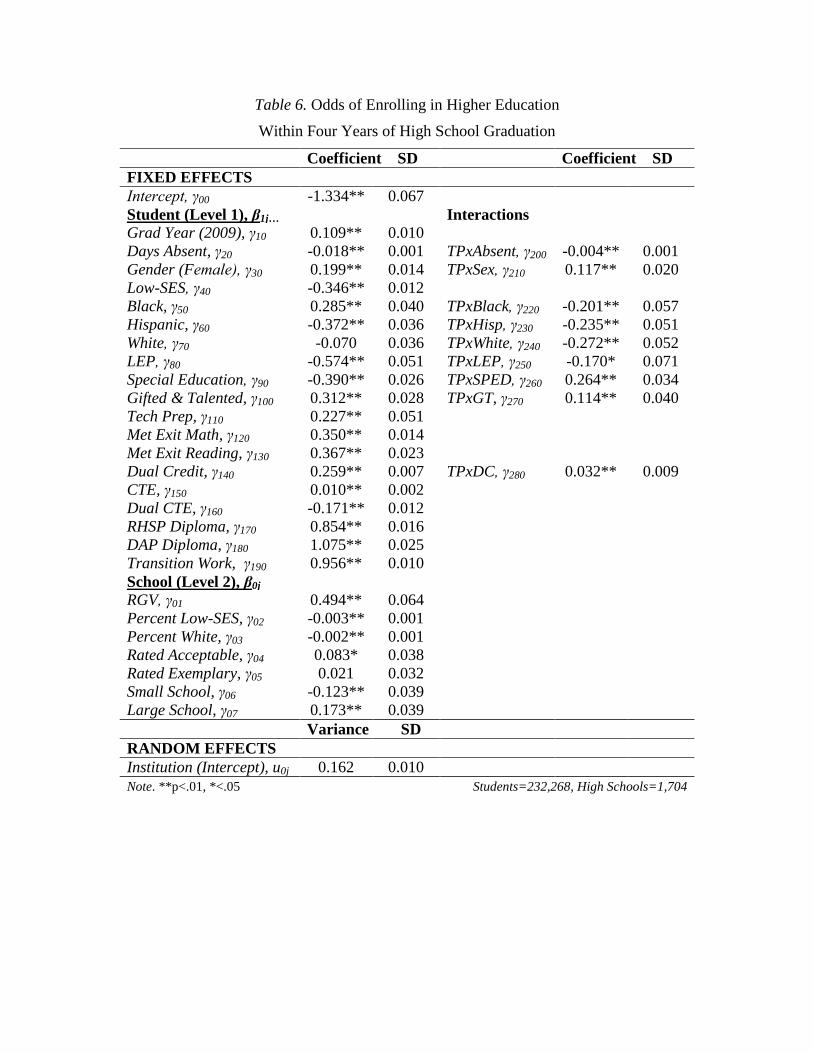
Table 6. Odds of Enrolling in Higher Education
Within Four Years of High School Graduation
Coefficient SD Coefficient SD
FIXED EFFECTS
Intercept, γ00 -1.334** 0.067
Student (Level 1), β1j… Interactions
Grad Year (2009), γ10 0.109** 0.010
Days Absent, γ20 -0.018** 0.001 TPxAbsent, γ200 -0.004** 0.001
Gender (Female), γ30 0.199** 0.014 TPxSex, γ210 0.117** 0.020
Low-SES, γ40 -0.346** 0.012
Black, γ50 0.285** 0.040 TPxBlack, γ220 -0.201** 0.057
Hispanic, γ60 -0.372** 0.036 TPxHisp, γ230 -0.235** 0.051
White, γ70 -0.070 0.036 TPxWhite, γ240 -0.272** 0.052
LEP, γ80 -0.574** 0.051 TPxLEP, γ250 -0.170* 0.071
Special Education, γ90 -0.390** 0.026 TPxSPED, γ260 0.264** 0.034
Gifted & Talented, γ100 0.312** 0.028 TPxGT, γ270 0.114** 0.040
Tech Prep, γ110 0.227** 0.051
Met Exit Math, γ120 0.350** 0.014
Met Exit Reading, γ130 0.367** 0.023
Dual Credit, γ140 0.259** 0.007 TPxDC, γ280 0.032** 0.009
CTE, γ150 0.010** 0.002
Dual CTE, γ160 -0.171** 0.012
RHSP Diploma, γ170 0.854** 0.016
DAP Diploma, γ180 1.075** 0.025
Transition Work, γ190 0.956** 0.010
School (Level 2), β0j
RGV, γ01 0.494** 0.064
Percent Low-SES, γ02 -0.003** 0.001
Percent White, γ03 -0.002** 0.001
Rated Acceptable, γ04 0.083* 0.038
Rated Exemplary, γ05 0.021 0.032
Small School, γ06 -0.123** 0.039
Large School, γ07 0.173** 0.039
Variance SD
RANDOM EFFECTS
Institution (Intercept), u0j 0.162 0.010
Note. **p<.01, *<.05 Students=232,268, High Schools=1,704

Table 7. Odds of Enrolling in a Community College
Within Four Years of High School Graduation
Coefficient SD Coefficient SD
FIXED EFFECTS
Intercept, γ00 -1.906** 0.071
Student (Level 1), β1j… Interactions
Grad Year (2009), γ10 0.206** 0.012
Days Absent, γ20 0.012** 0.001
Gender (Female), γ30 0.179** 0.011
Low-SES, γ40 -0.076** 0.014
Black, γ50 -0.232** 0.036 TPxBlack, γ210 -0.085* 0.034
Hispanic, γ60 -0.060* 0.030
White, γ70 -0.141** 0.029
LEP, γ80 -0.286** 0.045
Special Education, γ90 -0.064* 0.024
Gifted & Talented, γ100 -0.496** 0.019
Tech Prep, γ110 0.020 0.020
Met Exit Math, γ120 -0.201** 0.018
Met Exit Reading, γ130 0.052 0.028
Dual Credit, γ140 -0.065** 0.004
CTE, γ150 0.042** 0.003 TPxCTE, γ220 -0.030** 0.004
Dual CTE, γ160 0.078** 0.010
RHSP Diploma, γ170 -0.007 0.020
DAP Diploma, γ180 -0.699** 0.026
Transition HE, γ190 3.092** 0.017
Transition Work, γ200 0.560** 0.012 TPxTRWK, γ230 0.154** 0.023
School (Level 2), β0j
RGV, γ01 -0.164* 0.070
Percent Low-SES, γ02 0.000 0.001
Percent White, γ03 0.000 0.001
Rated Acceptable, γ04 0.011 0.043
Rated Exemplary, γ05 -0.076* 0.034
Small School, γ06 -0.053 0.042
Large School, γ07 0.067 0.042
Variance SD
RANDOM EFFECTS
Institution (Intercept), u0j 0.195 0.011
Note. **p<.01, *<.05 Students=232,268, High Schools=1,704

Table 8. Odds of Enrolling in a University
Within Four Years of High School Graduation
Coefficient SD Coefficient SD
FIXED EFFECTS
Intercept, γ00 -5.980** 0.095
Student (Level 1), β1j… Interactions
Grad Year (2009), γ10 0.030* 0.012
Days Absent, γ20 -0.029** 0.001 TPxAbsent, γ210 -0.006** 0.002
Gender (Female), γ30 0.064** 0.012
Low-SES, γ40 -0.214** 0.015
Black, γ50 0.041 0.032
Hispanic, γ60 -0.751** 0.030
White, γ70 -0.378** 0.029
LEP, γ80 -0.540** 0.076
Special Education, γ90 -0.758** 0.040
Gifted & Talented, γ100 0.567** 0.027 TPxGT, γ220 0.101* 0.037
Tech Prep, γ110 0.007 0.023
Met Exit Math, γ120 0.923** 0.024
Met Exit Reading, γ130 0.752** 0.048
Dual Credit, γ140 0.195** 0.006 TPxDC, γ230 0.050** 0.009
CTE, γ150 -0.040** 0.003 TPxCTE, γ240 0.022** 0.004
Dual CTE, γ160 -0.135** 0.018 TPxDCTE, γ250 -0.073** 0.020
RHSP Diploma, γ170 1.319** 0.032
DAP Diploma, γ180 1.984** 0.036
Transition HE, γ190 3.250** 0.021
Transition Work, γ200 -0.160** 0.018 TPxTRWK, γ260 -0.101** 0.025
School (Level 2), β0j
RGV, γ01 0.683** 0.088
Percent Low-SES, γ02 -0.006** 0.001
Percent White, γ03 -0.005** 0.001
Rated Acceptable, γ04 -0.003 0.050
Rated Exemplary, γ05 0.180** 0.037
Small School, γ06 -0.164** 0.053
Large School, γ07 0.198** 0.051
Variance SD
RANDOM EFFECTS
Institution (Intercept), u0j 0.309 0.018
Note. **p<.01, *<.05 Students=232,268, High Schools=1,704

Table 9. Odds of Participating in Developmental Coursework
While Enrolled in Higher Education
Coefficient SD Coefficient SD
FIXED EFFECTS
Intercept, γ00 -0.602** 0.098
Student (Level 1), β1j… Interactions
Grad Year (2009), γ10 0.094** 0.013
Days Absent, γ20 0.007** 0.001
Gender (female), γ30 0.227** 0.013
Low-SES, γ40 0.182** 0.022 TPxSES, γ220 -0.091** 0.027
Black, γ50 0.395** 0.037
Hispanic, γ60 0.648** 0.035
White, γ70 0.200** 0.034
LEP, γ80 0.482** 0.080
Special Education, γ90 0.407** 0.035
Gifted & Talented, γ100 -1.099** 0.026
Tech Prep, γ110 -0.235** 0.067
Met Exit Math, γ120 -0.937** 0.036 TPxMath, γ230 0.187** 0.048
Met Exit Reading, γ130 -0.260** 0.042
Dual Credit, γ140 -0.194** 0.008 TPxDC, γ240 -0.051** 0.012
CTE, γ150 0.051** 0.003 TPxCTE, γ250 -0.037** 0.004
Dual CTE, γ160 0.127** 0.021 TPxDCTE, γ260 0.064* 0.024
RHSP Diploma, γ170 -0.417** 0.036 TPxRHSP, γ270 0.165** 0.047
DAP Diploma, γ180 -1.465** 0.049 TPxDAP, γ280 0.358** 0.063
Transition HE, γ190 0.315** 0.020
Transition Work, γ200 0.284** 0.021 TPxTRWK, γ290 -0.082** 0.029
CCR Standard, γ210 1.788** 0.019 TPxCCR, γ300 0.085** 0.026
School (Level 2), β0j
RGV, γ01 -0.140 0.077
Percent Low-SES, γ02 0.005** 0.001
Percent White, γ03 -0.002* 0.001
Rated Acceptable, γ04 0.045 0.051
Rated Exemplary, γ05 -0.102* 0.040
Small School, γ06 0.008 0.049
Large School, γ07 0.044 0.048
Variance SD
RANDOM EFFECTS
Institution (Intercept), u0j 0.222 0.013
Note. **p<.01, *<.05 Students=157,209, High Schools=1,634

Table 10. Odds of Participating in Mathematics Developmental Coursework
While Enrolled in Higher Education
Coefficient SD Coefficient SD
FIXED EFFECTS
Intercept, γ00 -1.248** 0.088
Student (Level 1), β1j… Interactions
Grad Year (2009), γ10 0.106** 0.013
Days Absent, γ20 0.006** 0.001
Gender (female), γ30 0.265** 0.013
Low-SES, γ40 0.152** 0.021 TPxSES, γ220 -0.100** 0.026
Black, γ50 0.358** 0.036
Hispanic, γ60 0.633** 0.034
White, γ70 0.223** 0.034
LEP, γ80 0.120 0.066
Special Education, γ90 0.161** 0.031
Gifted & Talented, γ100 -1.014** 0.026
Tech Prep, γ110 0.119** 0.028
Met Exit Math, γ120 -0.711** 0.022
Met Exit Reading, γ130 -0.028 0.038
Dual Credit, γ140 -0.174** 0.008 TPxDC, γ230 -0.032** 0.010
CTE, γ150 0.047** 0.003 TPxCTE, γ240 -0.031** 0.004
Dual CTE, γ160 0.160** 0.013
RHSP Diploma, γ170 -0.264** 0.025
DAP Diploma, γ180 -1.291** 0.043 TPxDAP, γ250 0.204** 0.046
Transition HE, γ190 0.310** 0.020
Transition Work, γ200 0.265** 0.020 TPxTRWK, γ260 -0.073* 0.028
CCR Math Standard, γ210 1.622** 0.014
School (Level 2), β0j
RGV, γ01 -0.365** 0.078
Percent Low-SES, γ02 0.003* 0.001
Percent White, γ03 -0.002* 0.001
Rated Acceptable, γ04 0.044 0.049
Rated Exemplary, γ05 -0.090* 0.040
Small School, γ06 -0.016 0.049
Large School, γ07 0.090 0.048
Variance SD
RANDOM EFFECTS
Institution (Intercept), u0j 0.232 0.014
Note. **p<.01, *<.05 Students=157,209, High Schools=1,634

Table 11. Odds of Participating in Reading Developmental Coursework
While Enrolled in Higher Education
Coefficient SD Coefficient SD
FIXED EFFECTS
Intercept, γ00 -2.575** 0.124
Student (Level 1), β1j… Interactions
Grad Year (2009), γ10 0.043* 0.020
Days Absent, γ20 -0.003* 0.002 TPxAbsent, γ220 -0.005* 0.002
Gender (female), γ30 0.147** 0.019
Low-SES, γ40 0.270** 0.023
Black, γ50 0.155* 0.058
Hispanic, γ60 0.299** 0.056
White, γ70 -0.361** 0.057
LEP, γ80 0.580** 0.075
Special Education, γ90 0.633** 0.037
Gifted & Talented, γ100 -1.431** 0.060
Tech Prep, γ110 -0.215** 0.065
Met Exit Math, γ120 -0.759** 0.035 TPxMath, γ230 0.149** 0.048
Met Exit Reading, γ130 -0.500** 0.042
Dual Credit, γ140 -0.681** 0.022
CTE, γ150 0.039** 0.005 TPxCTE, γ240 -0.041** 0.006
Dual CTE, γ160 0.593** 0.027
RHSP Diploma, γ170 -0.348** 0.032
DAP Diploma, γ180 -1.174** 0.058
Transition HE, γ190 0.536** 0.041 TPxTRHE, γ250 0.137* 0.058
Transition Work, γ200 0.091** 0.022
CCR Read Standard, γ210 2.958** 0.022
School (Level 2), β0j
RGV, γ01 0.001 0.099
Percent Low-SES, γ02 0.014** 0.001
Percent White, γ03 0.004** 0.001
Rated Acceptable, γ04 -0.205** 0.068
Rated Exemplary, γ05 -0.096 0.063
Small School, γ06 0.066 0.069
Large School, γ07 -0.063 0.066
Variance SD
RANDOM EFFECTS
Institution (Intercept), u0j 0.360 0.024
Note. **p<.01, *<.05 Students=157,209, High Schools=1,634

Table 12. Odds of Participating in Writing Developmental Coursework
While Enrolled in Higher Education
Coefficient SD Coefficient SD
FIXED EFFECTS
Intercept, γ00 -1.872** 0.112
Student (Level 1), β1j… Interactions
Grad Year (2009), γ10 -0.058** 0.019
Days Absent, γ20 -0.002* 0.001
Gender (female), γ30 -0.114** 0.018
Low-SES, γ40 0.271** 0.021
Black, γ50 0.161** 0.053
Hispanic, γ60 0.229** 0.052
White, γ70 -0.242** 0.052
LEP, γ80 0.470** 0.069
Special Education, γ90 0.522** 0.035
Gifted & Talented, γ100 -1.383** 0.056
Tech Prep, γ110 -0.060 0.032
Met Exit Math, γ120 -0.582** 0.024
Met Exit Reading, γ130 -0.450** 0.039
Dual Credit, γ140 -0.659** 0.024 TPxDC, γ220 -0.056* 0.023
CTE, γ150 0.037** 0.005 TPxCTE, γ230 -0.034** 0.006
Dual CTE, γ160 0.619** 0.027
RHSP Diploma, γ170 -0.373** 0.030 TPxDAP, γ240 0.252* 0.089
DAP Diploma, γ180 -1.330** 0.078
Transition HE, γ190 0.153** 0.026
Transition Work, γ200 0.061** 0.020
CCR Write Standard, γ210 2.265** 0.027 TPxCCRW, γ250 0.082* 0.036
School (Level 2), β0j
RGV, γ01 -0.001 0.088
Percent Low-SES, γ02 0.011** 0.001
Percent White, γ03 0.002* 0.001
Rated Acceptable, γ04 -0.096 0.064
Rated Exemplary, γ05 -0.070 0.058
Small School, γ06 0.039 0.062
Large School, γ07 -0.022 0.060
Variance SD
RANDOM EFFECTS
Institution (Intercept), u0j 0.275 0.019
Note. **p<.01, *<.05 Students=157,209, High Schools=1,634

Table 13. Odds of Enrolled Students Earning a Higher Education Credential
Coefficient SD Coefficient SD
FIXED EFFECTS
Intercept, γ00 -3.620** 0.110
Student (Level 1), β1j… Interactions
Grad Year (2009), γ10 -0.010 0.013
Days Absent, γ20 -0.054** 0.001
Gender (female), γ30 0.608** 0.019 TPxSex, γ220 -0.134** 0.026
Low-SES, γ40 -0.105** 0.017
Black, γ50 -0.662** 0.035
Hispanic, γ60 -0.140** 0.031
White, γ70 0.000 0.029
LEP, γ80 0.316** 0.077
Special Education, γ90 -0.026 0.042
Gifted & Talented, γ100 0.251** 0.019
Tech Prep, γ110 0.744** 0.094
Met Exit Math, γ120 0.575** 0.046 TPxMath, γ230 -0.214** 0.059
Met Exit Reading, γ130 0.034 0.051
Dual Credit, γ140 0.112** 0.005 TPxDC, γ240 0.023** 0.007
CTE, γ150 -0.008* 0.003 TPxCTE, γ250 0.022** 0.004
Dual CTE, γ160 -0.039** 0.011
RHSP Diploma, γ170 0.557** 0.050 TPxRHSP, γ260 -0.263** 0.063
DAP Diploma, γ180 1.183** 0.055 TPxDAP, γ270 -0.400** 0.068
Transition HE, γ190 1.251** 0.042 TPxTRHE, γ280 -0.167** 0.058
Transition Work, γ200 -0.195** 0.014
Developmental Ed., γ210 -0.555** 0.015
School (Level 2), β0j
RGV, γ01 -0.122* 0.057
Percent Low-SES, γ02 -0.003** 0.001
Percent White, γ03 0.001 0.001
Rated Acceptable, γ04 -0.038 0.051
Rated Exemplary, γ05 0.064 0.033
Small School, γ06 -0.047 0.040
Large School, γ07 0.095* 0.037
Variance SD
RANDOM EFFECTS
Institution (Intercept), u0j 0.090 0.007
Note. **p<.01, *<.05 Students=157,209, High Schools=1,634
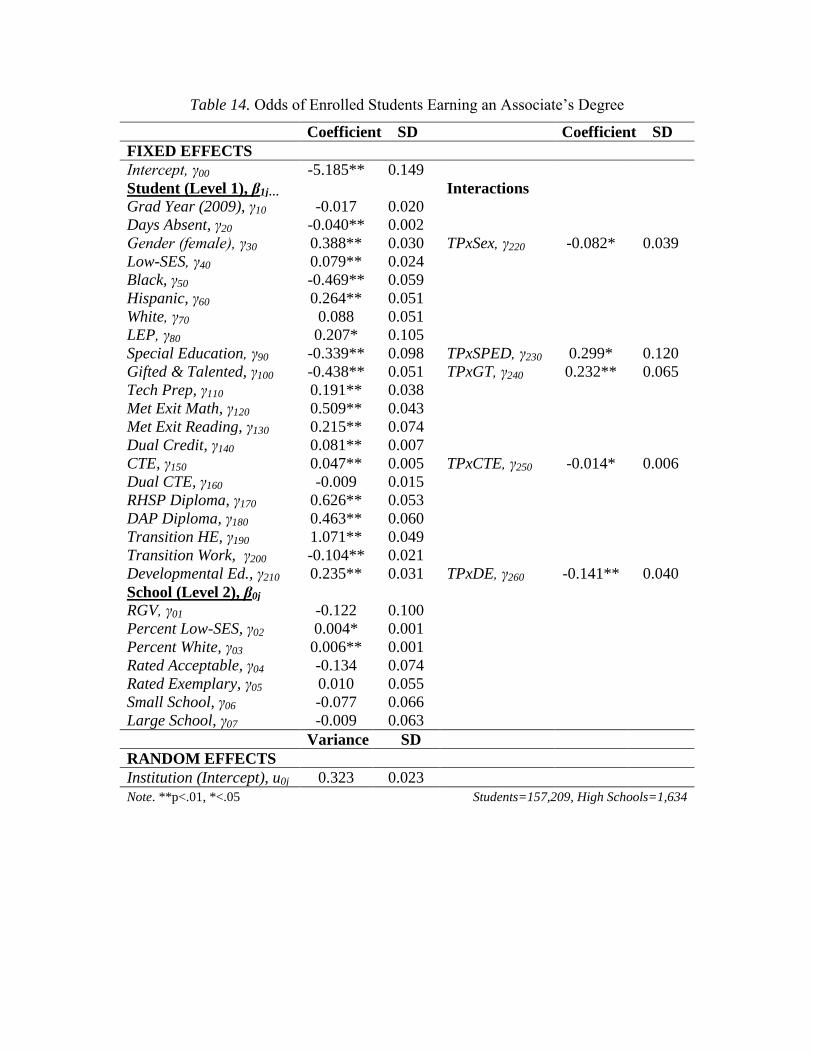
Table 14. Odds of Enrolled Students Earning an Associate’s Degree
Coefficient SD Coefficient SD
FIXED EFFECTS
Intercept, γ00 -5.185** 0.149
Student (Level 1), β1j… Interactions
Grad Year (2009), γ10 -0.017 0.020
Days Absent, γ20 -0.040** 0.002
Gender (female), γ30 0.388** 0.030 TPxSex, γ220 -0.082* 0.039
Low-SES, γ40 0.079** 0.024
Black, γ50 -0.469** 0.059
Hispanic, γ60 0.264** 0.051
White, γ70 0.088 0.051
LEP, γ80 0.207* 0.105
Special Education, γ90 -0.339** 0.098 TPxSPED, γ230 0.299* 0.120
Gifted & Talented, γ100 -0.438** 0.051 TPxGT, γ240 0.232** 0.065
Tech Prep, γ110 0.191** 0.038
Met Exit Math, γ120 0.509** 0.043
Met Exit Reading, γ130 0.215** 0.074
Dual Credit, γ140 0.081** 0.007
CTE, γ150 0.047** 0.005 TPxCTE, γ250 -0.014* 0.006
Dual CTE, γ160 -0.009 0.015
RHSP Diploma, γ170 0.626** 0.053
DAP Diploma, γ180 0.463** 0.060
Transition HE, γ190 1.071** 0.049
Transition Work, γ200 -0.104** 0.021
Developmental Ed., γ210 0.235** 0.031 TPxDE, γ260 -0.141** 0.040
School (Level 2), β0j
RGV, γ01 -0.122 0.100
Percent Low-SES, γ02 0.004* 0.001
Percent White, γ03 0.006** 0.001
Rated Acceptable, γ04 -0.134 0.074
Rated Exemplary, γ05 0.010 0.055
Small School, γ06 -0.077 0.066
Large School, γ07 -0.009 0.063
Variance SD
RANDOM EFFECTS
Institution (Intercept), u0j 0.323 0.023
Note. **p<.01, *<.05 Students=157,209, High Schools=1,634

Table 15. Odds of Enrolled Students Earning a Bachelor’s Degree
Coefficient SD Coefficient SD
FIXED EFFECTS
Intercept, γ00 -7.302** 0.232
Student (Level 1), β1j… Interactions
Grad Year (2009), γ10 -0.033 0.018
Days Absent, γ20 -0.069** 0.002 TPxAbsent, γ220 -0.011** 0.003
Gender (female), γ30 0.779** 0.018
Low-SES, γ40 -0.342** 0.025
Black, γ50 -0.389** 0.045
Hispanic, γ60 -0.405** 0.039
White, γ70 0.033 0.035
LEP, γ80 -0.754** 0.251
Special Education, γ90 -0.837** 0.111
Gifted & Talented, γ100 0.553** 0.022
Tech Prep, γ110 0.283 0.146
Met Exit Math, γ120 1.200** 0.085
Met Exit Reading, γ130 0.805** 0.155
Dual Credit, γ140 0.153** 0.006 TPxDC, γ230 0.038** 0.008
CTE, γ150 -0.058** 0.005 TPxCTE, γ240 0.029** 0.006
Dual CTE, γ160 -0.139** 0.015
RHSP Diploma, γ170 1.117** 0.115 TPxRHSP, γ250 -0.407* 0.147
DAP Diploma, γ180 2.016** 0.117 TPxDAP, γ260 -0.414* 0.149
Transition HE, γ190 1.933** 0.056
Transition Work, γ200 -0.265** 0.018
Developmental Ed., γ210 -1.498** 0.027
School (Level 2), β0j
RGV, γ01 0.220* 0.077
Percent Low-SES, γ02 -0.013** 0.001
Percent White, γ03 -0.006** 0.001
Rated Acceptable, γ04 -0.014 0.074
Rated Exemplary, γ05 0.092* 0.042
Small School, γ06 -0.011 0.055
Large School, γ07 0.296** 0.051
Variance SD
RANDOM EFFECTS
Institution (Intercept), u0j 0.152 0.013
Note. **p<.01, *<.05 Students=157,209, High Schools=1,634

Table 16. Odds of Enrolled Students Earning a Higher Education Certificate
Coefficient SD Coefficient SD
FIXED EFFECTS
Intercept, γ00 -3.515** 0.199
Student (Level 1), β1j… Interactions
Grad Year (2009), γ10 -0.011 0.031
Days Absent, γ20 -0.021** 0.002
Gender (female), γ30 -0.142* 0.050 TPxSex, γ220 -0.172* 0.063
Low-SES, γ40 0.020 0.038
Black, γ50 -0.312* 0.122
Hispanic, γ60 0.586** 0.110
White, γ70 0.497** 0.110
LEP, γ80 0.596** 0.113
Special Education, γ90 0.321** 0.065
Gifted & Talented, γ100 -0.673** 0.065
Tech Prep, γ110 0.456** 0.048
Met Exit Math, γ120 0.040 0.052
Met Exit Reading, γ130 -0.241** 0.075
Dual Credit, γ140 -0.144** 0.014
CTE, γ150 0.101** 0.008 TPxCTE, γ230 -0.034** 0.010
Dual CTE, γ160 0.331** 0.043 TPxDCTE, γ240 0.109* 0.041
RHSP Diploma, γ170 -0.286** 0.055
DAP Diploma, γ180 -0.681** 0.075
Transition HE, γ190 0.082 0.049
Transition Work, γ200 0.064 0.034
Developmental Ed., γ210 -0.359** 0.033
School (Level 2), β0j
RGV, γ01 -0.189 0.129
Percent Low-SES, γ02 0.015** 0.002
Percent White, γ03 0.011** 0.002
Rated Acceptable, γ04 0.016 0.107
Rated Exemplary, γ05 -0.187* 0.083
Small School, γ06 0.060 0.084
Large School, γ07 -0.437** 0.083
Variance SD
RANDOM EFFECTS
Institution (Intercept), u0j 0.487 0.038
Note. **p<.01, *<.05 Students=157,209, High Schools=1,634

Table 17. Odds of Transitioning to the Workforce
Within a Year of Earning a Postsecondary Credential
Coefficient SD Coefficient SD
FIXED EFFECTS
Intercept, γ00 -0.222 0.208
Student (Level 1), β1j… Interactions
Grad Year (2009), γ10 0.006 0.028
Days Absent, γ20 -0.003 0.002
Gender (female), γ30 0.106** 0.029
Low-SES, γ40 0.056 0.039
Black, γ50 0.569** 0.072
Hispanic, γ60 0.564** 0.057
White, γ70 0.397** 0.052
LEP, γ80 -0.003 0.173
Special Education, γ90 -0.231* 0.098
Gifted & Talented, γ100 -0.019 0.050 TPxGT, γ250 -0.166* 0.071
Tech Prep, γ110 -0.192** 0.055
Met Exit Math, γ120 0.132 0.076
Met Exit Reading, γ130 0.245* 0.117
Dual Credit, γ140 0.013 0.007
CTE, γ150 0.013* 0.005
Dual CTE, γ160 -0.040* 0.020
RHSP Diploma, γ170 -0.068 0.086
DAP Diploma, γ180 -0.267** 0.091
Transition HE, γ190 0.090 0.073
Transition Work, γ200 0.885** 0.039 TPxTRWK, γ260 0.265** 0.056
Developmental Ed., γ210 0.078* 0.039
Associate, γ220 0.314** 0.044
Bachelor, γ230 0.393** 0.056 TPxBD, γ270 0.193** 0.059
Certificate, γ240 0.552** 0.058
School (Level 2), β0j
RGV, γ01 -0.184* 0.068
Percent Low-SES, γ02 0.004** 0.001
Percent White, γ03 0.003** 0.001
Rated Acceptable, γ04 0.104 0.097
Rated Exemplary, γ05 0.027 0.051
Small School, γ06 0.011 0.069
Large School, γ07 -0.046 0.058
Variance SD
RANDOM EFFECTS
Institution (Intercept), u0j 0.031 0.009
Note. **p<.01, *<.05 Students=39,874, High Schools=1,399

Table 18. Odds of Transitioning to the Workforce (Two Jobs)
Within a Year of Earning a Postsecondary Credential
Coefficient SD Coefficient SD
FIXED EFFECTS
Intercept, γ00 -1.950** 0.171
Student (Level 1), β1j… Interactions
Grad Year (2009), γ10 -0.010 0.022
Days Absent, γ20 0.003 0.002
Gender (female), γ30 0.283** 0.033 TPxSex, γ250 -0.140** 0.046
Low-SES, γ40 0.037 0.031
Black, γ50 0.570** 0.076 TPxBlack, γ260 0.221* 0.082
Hispanic, γ60 0.430** 0.054
White, γ70 0.274** 0.052
LEP, γ80 0.064 0.145
Special Education, γ90 -0.195* 0.083
Gifted & Talented, γ100 -0.067* 0.031
Tech Prep, γ110 -0.046 0.054
Met Exit Math, γ120 0.065 0.060
Met Exit Reading, γ130 0.087 0.102
Dual Credit, γ140 0.010 0.006
CTE, γ150 0.005 0.004
Dual CTE, γ160 -0.008 0.016
RHSP Diploma, γ170 -0.113 0.065
DAP Diploma, γ180 -0.280** 0.069
Transition HE, γ190 0.048 0.059
Transition Work, γ200 0.673** 0.035 TPxTRWK, γ270 0.151** 0.050
Developmental Ed., γ210 0.038 0.029
Associate, γ220 0.279** 0.034
Bachelor, γ230 0.318** 0.037
Certificate, γ240 0.514** 0.041
School (Level 2), β0j
RGV, γ01 -0.094 0.052
Percent Low-SES, γ02 0.003** 0.001
Percent White, γ03 0.003** 0.001
Rated Acceptable, γ04 -0.114 0.074
Rated Exemplary, γ05 -0.044 0.039
Small School, γ06 0.002 0.050
Large School, γ07 -0.022 0.044
Variance SD
RANDOM EFFECTS
Institution (Intercept), u0j 0.011 0.005
Note. **p<.01, *<.05 Students=39,874, High Schools=1,399

REFERENCES
Aliaga, O. A., Kotamraju, P., Stone, J. R.. (2014). Understanding participation in secondary
career and technical education in the 21st century: Implications for policy and practice.
The High School Journal, 97(3), 128-158. doi:10.1353/hsj.2014.0002
Allen, L. (2012). Back on track through college in the Rio Grande Valley: From dropout
recovery and postsecondary success. Washington DC: Jobs For The Future.
An, B. P. (2013). The impact of dual enrollment on college degree attainment: Do low-ses
students benefit? Educational Evaluation and Policy Analysis, 35(1), 57-75.
doi:10.3102/0162373712461933
Anderson, S. (2008). Math infusion in agricultural education and career and technical education
in rural schools. Rural Educator [H.W. Wilson - EDUC], 30(1), 1.
Asunda, P. A., Finnell, A. M., & Berry, N. R. (2015). Integration of the common core state
standards into CTE: Challenges and strategies of career and technical teachers. Career
and Technical Education Research, 40(1), 48-62. doi:10.5328/cter40.1.48
Austin, P. S. (2011). An introduction to propensity score methods for reducing the effects of
confounding variables in observational studies. Multivariate Behavior Research, 46(3),
399-424. doi:10.1080/00273171.2011.568786
Bailey, T. (2009). Bridging the high-school divide. In Ladd, H. F., & Fiske, E.B. (Eds.)
Handbook of Research in Education Finance and Policy (pp. 724-737). New York, NY:
Routledge.
Bailey, T. R., & Karp, M. M (2003). Promoting college access and success: A review o f credit-
based transition programs. Washington DC: U.S. Department of Education, Office of
Vocational and Adult Education.
Bishop, J. H., & Mane, F. (2004). The impacts of career-technical education on high school labor
market success. Economics of Education Review, 23(4), 381-402.
doi:10.1016/j.econedurev.2004.04.001
Boyd, R. E., Martin, S. A., Davenport, A. F. Smith, A. B. (2015, November 2) Speaker Ryan’s
education outlook; CTE reauthorization; Department publishes cash
management/REPAYE final rules. Chicago, IL: The National Law Review. Retrieved
online from: http://www.natlawreview.com/article/speaker-ryan-s-education-outlook-cte-
reauthorization-department-publishes-cash
Bozick, R., & Dalton, B. (2013;2012;). Balancing career and technical education with academic
coursework: The consequences for mathematics achievement in high school. Educational
Evaluation and Policy Analysis, 35(2), 123-138. doi:10.3102/0162373712453870
Bragg, D. D. (2000). Maximizing the benefits of Tech‐Prep initiatives for high school students.
New Directions for Community Colleges, 2000(111), 23-30. doi:10.1002/cc.11103
Bragg, D. D. (2006). Transitions to college: Academic pathways from high school to the
community college. Journal of Applied Research in the Community College, 13(2), 117.
Bragg, D. D., & Durham, B. (2012). Perspectives on access and equity in the era of (community)
college completion. Community College Review, 40(2), 106-125.

Bragg, D. D., Loeb, J. W., Gong, Y., Deng, C-P., Yoo, J., & Hill, J. L. (2002). Transition from
high school to college and work for tech prep participants in eight selected consortia. St.
Paul, MN: National Research Center for Career and Technical Education, University of
Minnesota. Retrieved from:
http://www.nccte.org/publications/infosynthesis/r%26dreportrTransition-
Bragg%20ALL.pdf
Bragg, D., & Reger, W. (2002). New lessons about tech prep implementation: Changes in eight
selected consortia since reauthorization o f the federal tech prep legislation in 1998. St.
Paul, MN: University of Minnesota, National Research Center for Career and Technical
Education.
Brown, B.L. (2003). The benefits of career and technical education. Trends and issues alert.
Clearinghouse on Adult, Career, and Vocational Education, 49.
Brown, C. H. (2001). Two‐Year colleges and tech prep partnerships: A Texas perspective. New
Directions for Community Colleges, 2001(115), 51-62. doi:10.1002/cc.30
Brown, C. G., & Schwartz, R. (2014). College prep for all? Education Next, 14(3), 56-60.
Brush, M. (2008). 50 state comparison: Career/technical education: Tech prep or similar focus
(2+2). Denver, CO: Education Commission of the States
Caliendo, M., & Kopeinig, S. (2005, May). Some practical guidance for the implementation of
propensity score matching (IZA DP No. 1588). Berlin, Germany: Forschungsinstitut zur
Zukunft der Arbeit Institute for the Study of Labor.
Callan, P. M., Finney, J. E., Kirst, M. W., Usdan, M. D., & Venezia, A. (2006). Claiming
common ground: State policymaking for improving college readiness and success. San
Jose, CA: National Center for Public Policy and Higher Education.
Carl D. Perkins Career and Technical Education Act of 2006, PL209-270
Carl D. Perkins Vocational and Applied Technology Act of 1990, PL101-392
Carl D. Perkins Vocational and Technical Education Act of 1998, PL10S-332
Carl D. Perkins Vocational Education Act of 1984, PL98-524
Carnevale, A.P., Smith, N., & Strohl, J. (2010). Help wanted: Projections of jobs and education
requirements through 2018. Washington DC: Center on Education and the Workforce.
Castellano, M., Harrison, L., & Schneider, S. (2008). State secondary career and technical
education standards: Creating a framework from a patchwork of policies. Career and
Technical Education Research, 33(1), 25-44. doi:10.5328/CTER33.1.25

Castellano, M., Stringfield, S., & Stone, J. R. (2003). Secondary career and technical education
and comprehensive school reform: Implications for research and practice. Review of
Educational Research, 73(2), 231-272. doi:10.3102/00346543073002231
Castells, M. (2010). The rise of the network society: The information age: Economy, society, and
culture volume I (2nd Ed.). Malden, MA: Wiley-Blackwell.
Cellini, S. R. (2006). Smoothing the transition to college? The effect of tech-prep programs on
educational attainment. Economics of Education Review, 25(4), 394-411.
doi:10.1016/j.econedurev.2005.07.006
Chadd, J., & Drage, K. (2006). No child left behind: Implications for career and technical
education. Career and Technical Education Research, 31(2), 79-99.
doi:10.5328/CTER31.2.79
Cohen, J., Cohen, P., West, S. G., & Aiken, L. S. (2003). Applied multiple regression/correlation
analysis for the behavioral sciences (3rd ed.). NJ: Erlbaum.
Cox, E. D., Hernández-Gantes, V. M., & Fletcher, J., Edward C. (2015). Student participation in
career academies within a school district: Who participates, what makes a difference?
Career and Technical Education Research, 40(1), 11-27. doi:10.5328/cter40.1.11
Crist, C., Jacquart, M., & Shupe, D. A. (2002). Improving the performance of high school
students: Focusing on connections and transitions taking place in Minnesota. Journal for
Vocational Special Needs Education, 24(2-3), 41.
D'Amico, M. M., Morgan, G. B., Katsinas, S. G., & Friedel, J. N. (2015). State director views on
community college workforce development. Career and Technical Education Research,
39(3), 191-211. doi:10.5328/cter39.3.191
Dare, D. E. (2006). The role of career and technical education in facilitating student transitions to
postsecondary education. New Directions for Community Colleges, 2006(135), 73-80.
doi:10.1002/cc.249
Educational Service Center 20. (2016). House Bill 5. San Antonio, TX: Author. Retrieved from:
http://www.esc20.net/default.aspx?name=ais_sup.HB5
Fishman, D. (2015). School reform for rural America: Innovate with charters, expand career and
technical education. Education Next, 15(3), 8.
Fitzsimmons, J. (1999). Maine technical college system: "building bridges". Community College
Journal of Research and Practice, 23(3), 227-241. doi:10.1080/106689299264864
Fletcher Jr, E. C., Lasonen, J. L., & Hernandez, V. M. (2014). “We don't just make cookies”:
Practitioners' perspectives on the viability of career and technical education in the united
states. Career and Technical Education Research, 39(1), 55-78. doi:10.5328/cter39.1.55
Friedel, J. N. (2011). Where has vocational education gone? The impact of federal legislation on
the expectations, design, and function of vocational education as reflected in the
reauthorization of the Carl D. Perkins career and technical education act of 2006.
American Educational History Journal, 38(1-2), 37.

Fritz, C. O., Morris, P. E., & Richler, J. J. (2012). Effect size estimates: Current use, calculations,
and interpretations. Journal of Experimental Psychology: General. 141(1), 2-18.
doi:10.1037/a0024338
Gelman, A., & Hill, J. (2007). Data analysis using regression and multilevel/hierarchical
models. New York, NY: Cambridge University Press.
Gemici, S., & Rojewski, J. W. (2007). Evaluating research in career and technical education
using scientifically-based research standards. Career and Technical Education Research,
32(3), 143-159. doi:10.5328/CTER32.3.143
Gottfried, M. A., Bozick, R., Rose, E., & Moore, R. (2014). Does career and technical education
strengthen the STEM pipeline? comparing students with and without disabilities. Journal
of Disability Policy Studies, 1-13. doi:10.1177/1044207314544369
Guo, S., & Fraser, M. (2010). Propensity score analysis: Statistical methods and applications.
Thousand Oaks, CA: Sage Publications.
Haviland, A., Nagin, D. S., & Rosenbaum, P. R. (2007). Combining propensity score matching
and group-based trajectory analysis in an observational study. Psychological Methods,
12, 247-267.
HB5. 83rd
Legislative Session of the Texas State Legislature. (2013).
Heckman, J., LaLonde, R., & Smith, J. (1999). The economics and econometrics of active labor
market programs. In O. C. Ashenfelter & D. Card (Eds.), Handbook of Labor Economics
(pp. 1865-2097). Amsterdam: Elsevier.
Hershey, A.M., Silverberg, M.K., Owens, T., & Hulsey, L.K. (1998). Focus for the Future: The
Final Report of the National Tech-Prep Evaluation. Princeton, NJ: Mathematica Policy
Research, Inc.
Hutchins, B. C., & Akos, P. (2013). Rural high school youth's access to and use of
School‐to‐Work programs. The Career Development Quarterly, 61(3), 210-225.
doi:10.1002/j.2161-0045.2013.00050.x
Kao, G., & Thompson, J. S. (2003). Racial and ethnic stratification in educational achievement
and attainment. Annual Review of Sociology, 29, 417-442.
Kim, J. (2014). Relationship of tech prep and dual credit to college readiness and retention.
College Student Journal, 48(3), 337.
Kleiman, N.S. (2001, June). Building a highway to higher ed: How collaborative efforts are
changing education in America. New York: The Center for an Urban Future.
Klein, A. (2015, October 21). Congress set to begin work on career and technical education
programs. Education Week. Retrieved online from:
http://blogs.edweek.org/edweek/campaign-k-
12/2015/10/congress_set_to_begin_work_on_.html
Klein, S., Richards, A., White, R., Staklis, S., Alfeld, C., Dailey, C.R., Charner, I., & Poliakoff,
A. (2014). Evaluation of the implementation of the Carl D. Perkins Career and Technical
Education Act of 2006: Finance, accountability, and programs of study. Research
Triangle Park, NC: RTI International.

Kleiner, B., & Lewis, L. (2009). Dual enrollment of high school students at postsecondary
institutions: 2002-2003. Washington DC: U.S. Department of Education.
Lee, V., & Loeb, S. (2000). School size effect in Chicago elementary schools: Effects on
teachers’ attitudes and students’ achievement. American Educational Research Journal,
37, 3–31.
Leithwood, K. & Jantzi, D. (2009). A review of empirical evidence about school size effects: A
policy perspective. Review of Education Research, 79(1), 464-490.
Lerner, J.B., & Brand, B. (2006). The college ladder: Linking secondary and postsecondary
education for success for all students. Washington DC: American Youth Policy Forum.
Lewis, M. V., & Overman, L. (2008). Dual and concurrent enrollment and transition to
postsecondary education. Career and Technical Education Research, 33(3), 189-202.
doi:10.5328/CTER33.3.189
Lumina Foundation. (2015). A stronger nation through higher education: Ten-year time horizon
brings Goal 2025into sharp focus. Indianapolis, IN: Author.
Maguire, K. J., Starobin, S. S., Laanan, F. S., & Friedel, J. N. (2012). Measuring the
accountability of CTE programs: Factors that influence postcollege earnings among
community college students. Career and Technical Education Research, 37(3), 235-261.
doi:10.5328/cter37.3.235
Mane, F. (1999). Trends in the payoff to academic and occupation-specific skills: The short and
medium run returns to academic and vocational high school courses for non-college
bound students. Economics of Education Review, 18, 417-437.
McClafferty Jarsky, K., McDonough, P. M., & Núñez, A. (2009). Establishing a college culture
in secondary schools through P-20 collaboration: A case study. Journal of Hispanic
Higher Education,8(4), 357-373.
Mustian, A., Mazzotti, V. L., & Test, D. W. (2013). Disseminating evidence-based practices in
secondary transition. Journal of Positive Behavior Interventions, 15(4), 197-204.
Meer, J. (2007). Evidence on the returns to secondary vocational education. Economics of
Education Review, 26, 559-573. doi:10.1016/j.econedurev.2006.04.002
National Governor’s Association. (2014). America works: Education and training for
tomorrow’s jobs. Washington DC: Author.
Neild, R.C., & Byrnes, V. (2014). Impacts of career and technical schools on postsecondary
outcomes: A case study of a large urban school district. Baltimore, MD: Center for
Social Organization of Schools, Everyone Graduates Center—Johns Hopkins University.
Neumark, D., & Joyce, M. (2001). Evaluating school-to-work programs using the new NLSY.
Journal of Human Resources, 36(4), 666–702.
Neumark, D., & Rothstein, D., 2004. School-to-career programs and transitions to employment
and higher education. Unpublished manuscript.
Nimon, K. (2012). To aggregate or not and potentially better questions for clustered data: The
need for hierarchical linear modeling in CTE research. Career and Technical Education
Research, 37(3), 213-233. doi:10.5328/cter37.3.213

Organization for Economic Cooperation and Development (2014). Education at a glance 2014.
Paris, France: Author. Retrieved from: http://www.oecd.org/edu/United%20States-
EAG2014-Country-Note.pdf
Parnell, D. (1985). The Neglected Majority. Washington DC: American Association of
Community Colleges, 1985.
Plank, S. B., DeLuca, S., & Estacion, A. (2008). High school dropout and the role of career and
technical education: A survival analysis of surviving high school. Sociology of
Education, 81(4), 345-370. doi:10.1177/003804070808100402
Rabren, K., Carpenter, J., Dunn, C., & Carney, J. S. (2014). Actions against poverty: The impact
of career technical education. Career Development for Exceptional Individuals, 37(1),
29-39. doi:10.1177/2165143414522091
Ramsey, K. A. (1995). The new vocationalism in urban school reform. Education and Urban
Society, 27(3), 260-273. doi:10.1177/0013124595027003003
Raudenbush, S. P., & Bryk, A. (2002). Hierarchical Linear Models, 2nd
ed. Thousand Oaks,
California: Sage.
Rojewski, J. W., & Hill, R. B. (2014). Positioning research and practice in career and technical
education: A framework for college and career preparation in the 21st century. Career
and Technical Education Research, 39(2), 137-150. doi:10.5328/cter39.2.137
Rojewski, J. W., & Xing, X. (2013). Treatment of Race/Ethnicity in career-technical education
research. Career and Technical Education Research, 38(3), 245-256.
doi:10.5328/cter38.3.245
Rojewski, J. W., Lee, I. H., & Gemici, S. (2012). Use of "t"-test and ANOVA in career-technical
education research. Career and Technical Education Research, 37(3), 263-275.
doi:10.5328/cter37.3.263
Rosenbaum, P., & Rubin, D. (1983). The central role of propensity score observational studies
for causal effects. Biometrika, 70, 41-55. doi:10.1093/biomet/70.1.41.
Rosenbaum, P.R., & Rubin, D.B. (1984). Reducing bias in observational studies using
subclassification on the propensity score. Journal of the American Statistical Association,
79(387), 516-524).
Ross, T., Kena, G., Rathburn, A., KewalRamani, A., Zhang, J., Kristapovich, P., & Manning, E.
(2012). Higher education: Gaps in access and persistence study (NCES 2012-046).
Washington DC: National Center for Education Statistics.
Sambolt, M., & Blumenthal, D. (2013). Promoting college and career readiness: A pocket guide
for state and district leaders. Washington DC: American Institutes for Research.
Seidman, P. F., & Ramsey, K. A. (1995). Vocational education and school reform: New
connections from school to work: 1. Education and Urban Society [H.W. Wilson -
EDUC], 27, 235.
Stevens, J. (2009). Applied Multivariate Statistics for the Social Sciences (5th ed.). New York:
Routledge.

Stipanovic, N., Lewis, M. V., & Stringfield, S. (2012). Situating programs of study within
current and historical career and technical educational reform efforts. International
Journal of Educational Reform, 21(2), 80.
Stone, J. R., Aliaga, O. A. (2005). Career and technical education and school-to-work at the end
of the 20th century: Participation and outcomes. Career and Technical Education
Research, 30(2), 125-144.
Stratford, M. (2016, September 20). Career education bill breaks down in Senate. Politico.
Retrieved from: http://www.politico.com/tipsheets/morning-education/2016/09/career-
education-bill-breaks-down-in-senate-216421
Symonds, W. C., Schwartz, R. B., & Ferguson, R. (2011). Pathways to prosperity: Meeting the
challenge of preparing young Americans for the 21st century. Cambridge, MA: Harvard
University.
Thoemmes F.J. (2012). Propensity score matching in SPSS. Ithaca, NY: Cornell University.
Retrieved from: https://www.human.cornell.edu/hd/qml/upload/Thoemmes_2012.pdf
U.S. Census Bureau. (2016). Quick facts. Washington DC: U. S. Department of Commerce.
Retrieved from: http://www.census.gov/quickfacts/table/PST045215/00
U.S. Department of Education: Office of Career, Technical, and Adult Education. (2016). Tech
prep education. Retrieved from:
http://www2.ed.gov/about/offices/list/ovae/pi/cte/techprep.html
U.S. Department of Labor Bureau of Labor and Statistics. (2015). Labor force characteristics by
race and ethnicity, 2014 (Report 1057). Washington DC: Author.
Ujifusa, A. (2016, October 5). Storm clouds loom over push for ed-tech law’s renewal.
Education Week, 36(7), 18-19.
Waller, S. K., & Waller, L. (2004). Texas tech prep environmental scan of partner opinions: An
assessment of effectiveness. Community College Journal of Research and Practice,
28(7), 625-635. doi:10.1080/10668920390253862
West, S.G., Cham, H., Thoemmes, F., Renneberg, B., Schulze, J., & Weiler, M. (2014).
Propensity scores as a basis for equating groups: Basic principles and application in
clinical outcome research. Journal of Consulting and Clinical Psychology, 82(5), 906-
919.
What Works Clearinghouse. (2014). Procedures and standards handbook (version 3.0).
Washington DC: The U.S. Department of Education.
Wonacott, M.E. (2002). Dropouts and career and technical education. Myths and realities.
Clearinghouse on Adult, Career, and Vocational Education, 23.
Zinth, J.D. (2014). CTE dual enrollment: A strategy for college completion and workforce
investment. Denver, CO: Education Commission of the States.