long term services and supports: changes sweep … term services and supports: changes sweep the...
TRANSCRIPT
Long Term Services and Supports: Changes Sweep
the Nation
Susan C. Reinhard, RN, PhD, FAAN
Geriatric Grand RoundsInstitute on Aging
Little Rock, ArkansasOctober 25, 2006
Goals
• Highlight national trends in how and where older adults get long term services and supports.
• Emphasize changes across settings and the national context for Arkansas.
• Challenge interdisciplinary critical thinking about the future of what older adults need and how we can be part of the solutions.

In a Bob Hope Lifetime, We Have Changed
• 30 years more of longevity is good, not bad news.
• Older adults are a natural resource--maybe our only growing natural resource.
• “Vital Aging” includes social connections as well as physical and mental health.
• The “care” solutions we created over the past 50 years are not what we ourselves desire.
• How can we open our professional mindsets to true paradigm changes?
Drivers of Change
• Advocates pushing for Home and Community-Based Care
• States seeking to manage costs to support more people
• State and community innovations leading the way
National Policy
For the first time ever, the Centers for Medicare & Medicaid Services (CMS) and the Administration on Aging (AOA) are partnering…
and they are prodding the states to do more to help people live in their homes and communities.
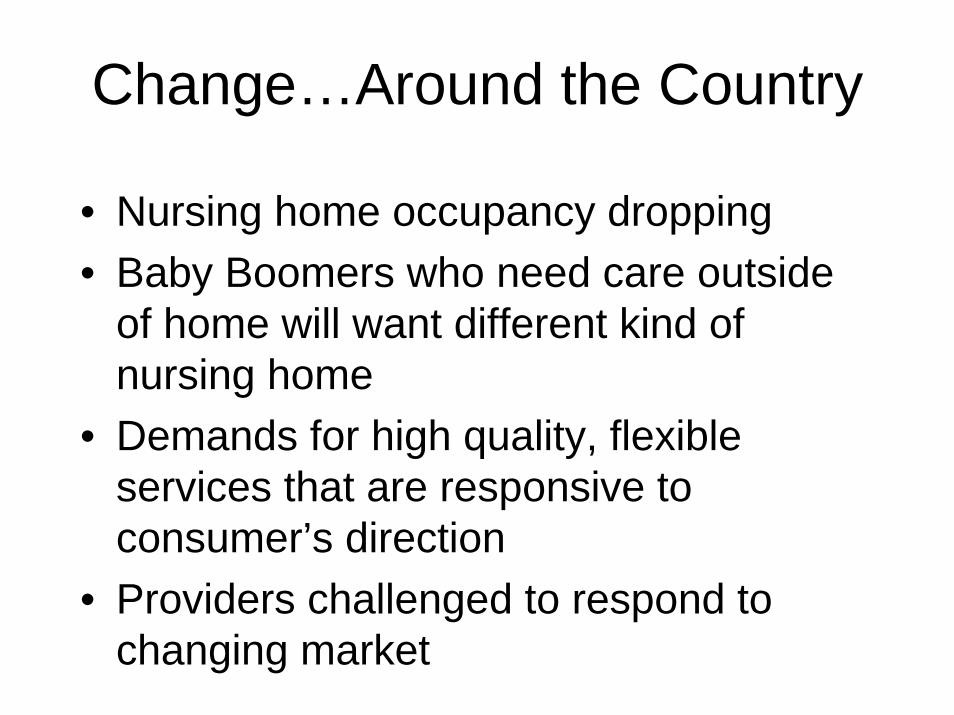
Change…Around the Country
• Nursing home occupancy dropping • Baby Boomers who need care outside
of home will want different kind of nursing home
• Demands for high quality, flexible services that are responsive to consumer’s direction
• Providers challenged to respond to changing market
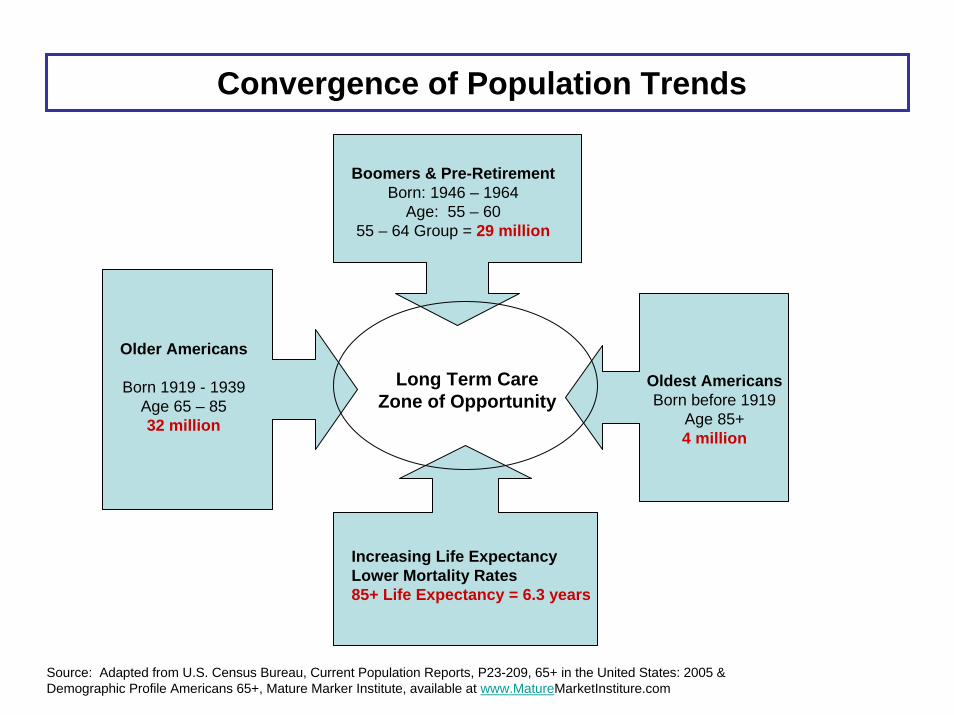
Convergence of Population Trends
Boomers & Pre-RetirementBorn: 1946 – 1964
Age: 55 – 6055 – 64 Group = 29 million
Older Americans
Born 1919 - 1939Age 65 – 8532 million
Oldest AmericansBorn before 1919
Age 85+4 million
Increasing Life ExpectancyLower Mortality Rates85+ Life Expectancy = 6.3 years
Long Term CareZone of Opportunity
Source: Adapted from U.S. Census Bureau, Current Population Reports, P23-209, 65+ in the United States: 2005 & Demographic Profile Americans 65+, Mature Marker Institute, available at www.MatureMarketInstiture.com

Adapted from U.S. Census Bureau, 2004 "U.S. Interim Projections by Age, Sex, and Internet Release Date: March 18, 2004. Available at http://www.census.gov/ipc/www/usinterimproj/. Found on April 6, 2006.
Population Projection of Persons Age 65 - 84 & 85 Years and Older: 2000 - 2050
0
10,000
20,000
30,000
40,000
50,000
60,000
70,000
80,000
90,000
100,000Th
ousa
nds
..85+ 4,267 6,123 7,269 9,603 15,409 20,861
..65-84 30,794 34,120 47,363 61,850 64,640 65,844
2000 2010 2020 2030 2040 2050

AK
HI AL
AZAR
CA CO
CT
DE
FL
GA
ID
IL IN
IA
KSKY
LA
ME
MD
MAMI
MN
MS
MO
MT
NENV
NH
NJ
NM
NY
NC
ND
OH
OK
OR
PA
RI
SC
SD
TN
TX
UT
VT
VA
WA
WV
WIWY
13.5% to 17.0% (12)
13.1% to 13.4% (7)12.4% to 13.0% (9)
11.8% to 12.3% (10)
6.2% to 11.7% (12)
65+ Percent of Total Population for 50 States based on 2003 Population Estimates
Source : US Census Bureau , Census Population Estimates . Table compiled by the U .S. Administration on Aging , .
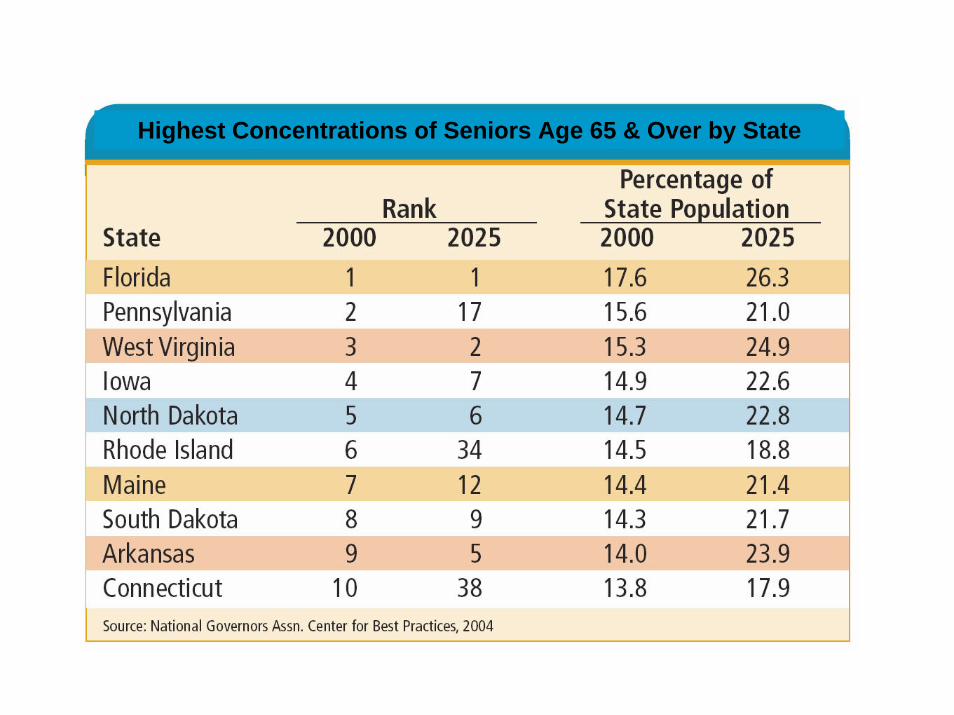
Highest Concentrations of Seniors Age 65 & Over by State
AK
HI AL
AZAR
CA CO
CT
DE
FL
GA
ID
IL IN
IA
KSKY
LA
ME
MD
MAMI
MN
MS
MO
MT
NENV
NH
NJ
NM
NY
NC
ND
OH
OK
OR
PA
RI
SC
SD
TN
TX
UT
VT
VA
WA
WV
WIWY
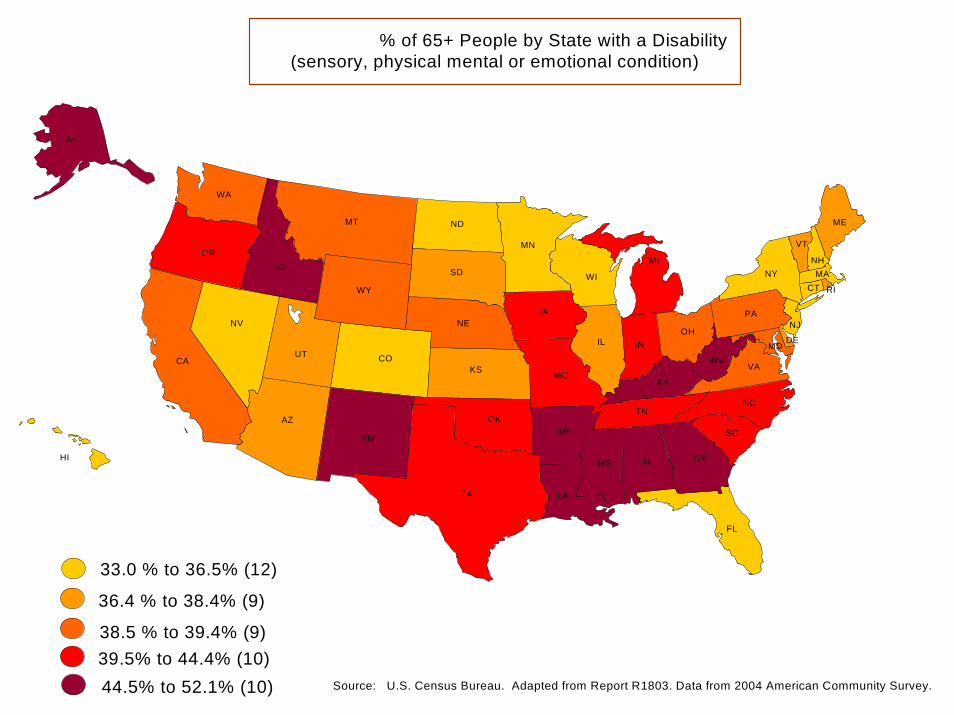
Figure 1- 10: % of 65+ People by State with a Disability(sensory, physical mental or emotional condition)
Source: U.S. Census Bureau. Adapted from Report R1803. Data from 2004 American Community Survey.
36.4 % to 38.4% (9)
38.5 % to 39.4% (9)39.5% to 44.4% (10)44.5% to 52.1% (10)
33.0 % to 36.5% (12)
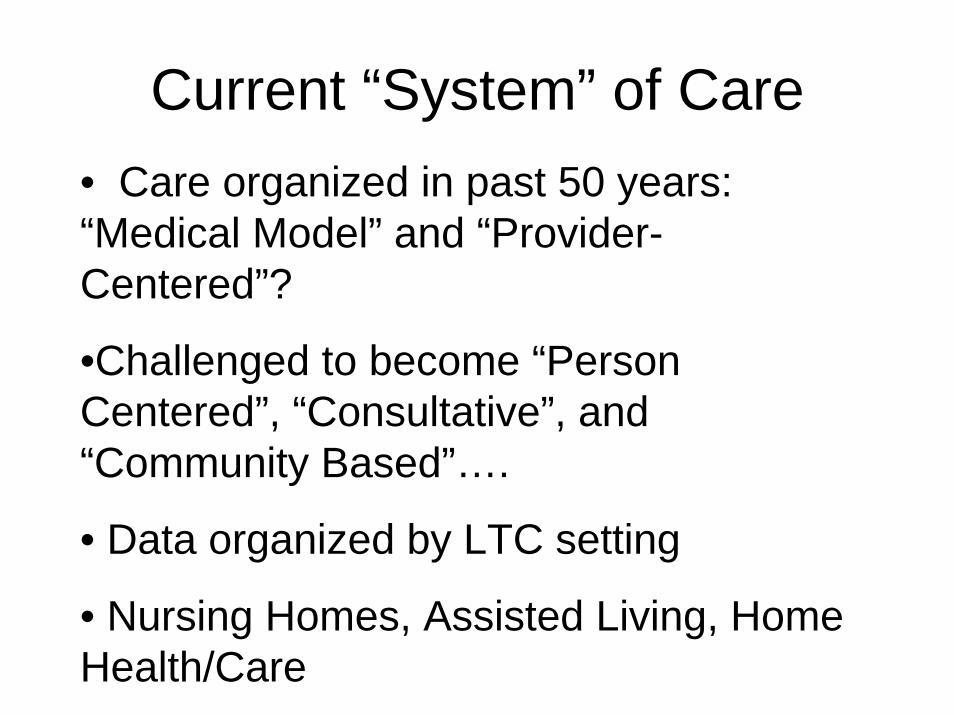
Current “System” of Care• Care organized in past 50 years: “Medical Model” and “Provider-Centered”?
•Challenged to become “Person Centered”, “Consultative”, and “Community Based”….
• Data organized by LTC setting
• Nursing Homes, Assisted Living, Home Health/Care
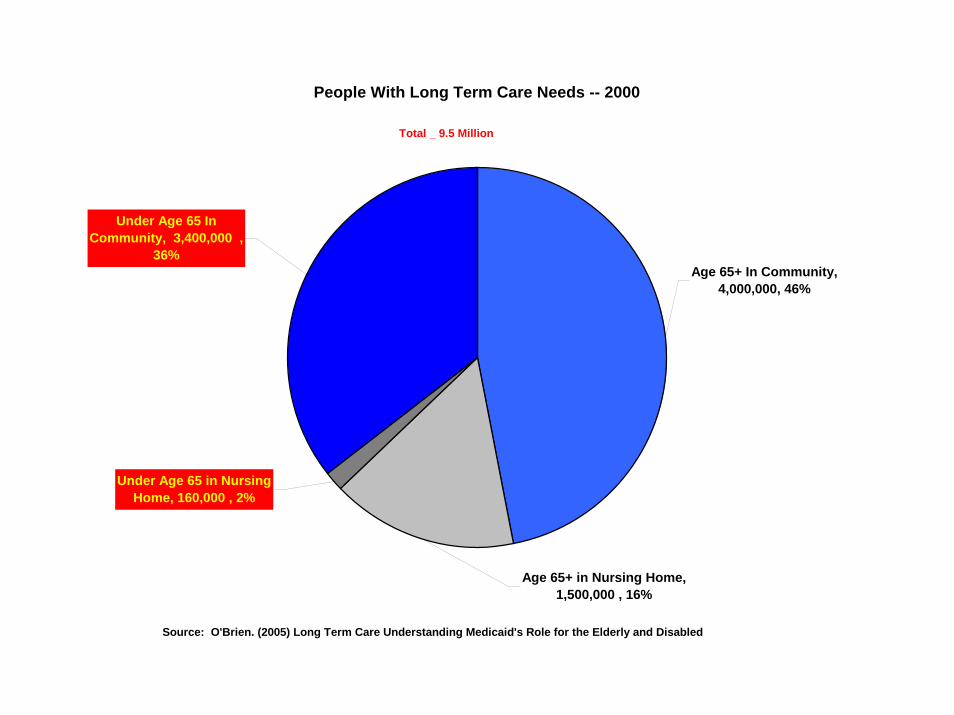
Age 65+ In Community, 4,000,000, 46%
Age 65+ in Nursing Home, 1,500,000 , 16%
Under Age 65 in Nursing Home, 160,000 , 2%
Under Age 65 In Community, 3,400,000 ,
36%
Total _ 9.5 Million
Source: O'Brien. (2005) Long Term Care Understanding Medicaid's Role for the Elderly and Disabled
People With Long Term Care Needs -- 2000

Figure 2 – 7
Source: Long Term Care: Understanding Medicaid’s Role for the Elderly and DisabledBy Ellen O’Brien for The Kaiser Commission on Medicaid and the Uninsured, November 2005
National Spending on Long-Term Care, 2003($ in Billions)
Medicare$32.4 , 18%
Out of Pocket$35.5 , 20%
Private Insurance$15.7 , 9%
Other Private$5.4 , 3%
Medicaid$86.3 , 47%
Other Public$4.6 , 3%
Total = $181.9 billion
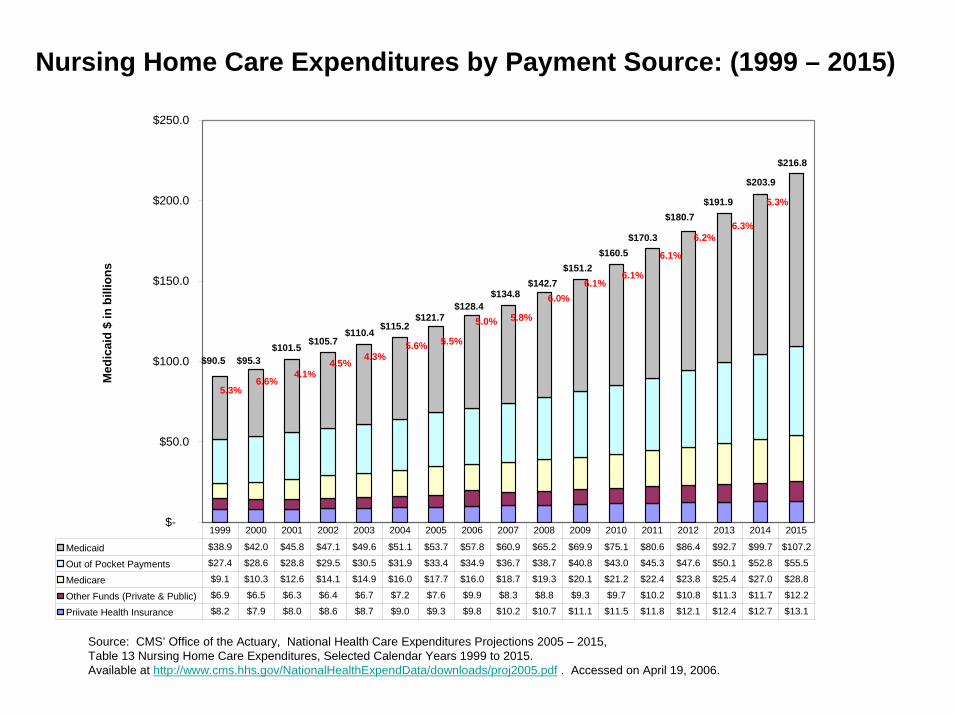
Nursing Home Care Expenditures by Payment Source: (1999 – 2015)
$-
$50.0
$100.0
$150.0
$200.0
$250.0M
edic
aid
$ in
bill
ions
Medicaid $38.9 $42.0 $45.8 $47.1 $49.6 $51.1 $53.7 $57.8 $60.9 $65.2 $69.9 $75.1 $80.6 $86.4 $92.7 $99.7 $107.2
Out of Pocket Payments $27.4 $28.6 $28.8 $29.5 $30.5 $31.9 $33.4 $34.9 $36.7 $38.7 $40.8 $43.0 $45.3 $47.6 $50.1 $52.8 $55.5
Medicare $9.1 $10.3 $12.6 $14.1 $14.9 $16.0 $17.7 $16.0 $18.7 $19.3 $20.1 $21.2 $22.4 $23.8 $25.4 $27.0 $28.8
Other Funds (Private & Public) $6.9 $6.5 $6.3 $6.4 $6.7 $7.2 $7.6 $9.9 $8.3 $8.8 $9.3 $9.7 $10.2 $10.8 $11.3 $11.7 $12.2
Priivate Health Insurance $8.2 $7.9 $8.0 $8.6 $8.7 $9.0 $9.3 $9.8 $10.2 $10.7 $11.1 $11.5 $11.8 $12.1 $12.4 $12.7 $13.1
1999 2000 2001 2002 2003 2004 2005 2006 2007 2008 2009 2010 2011 2012 2013 2014 2015
$90.5 $95.3$101.5 $105.7
$110.4 $115.2$121.7
$128.4$134.8
$142.7
$160.5
$216.8
$170.3
$180.7
$151.2
$203.9
$191.9
6.6%
4.3%
4.1%5.3%
4.5%
6.0%
5.8%
6.1%
5.0%
5.6% 5.5%
6.1%
6.2%6.3%
6.1%
6.3%
Source: CMS’ Office of the Actuary, National Health Care Expenditures Projections 2005 – 2015, Table 13 Nursing Home Care Expenditures, Selected Calendar Years 1999 to 2015. Available at http://www.cms.hhs.gov/NationalHealthExpendData/downloads/proj2005.pdf . Accessed on April 19, 2006.
87.4% 87.4%86.3%
86.0% 85.9%
85.6%
85.5%
82.7%
1.26
1.28
1.30
1.32
1.34
1.36
1.38
1997 1998 1999 2000 2001 2002 2003 2004
Num
ber o
f Res
iden
ts --
Mill
ions
(bar
)
81.0%
82.0%
83.0%
84.0%
85.0%
86.0%
87.0%
88.0%
Occ
upan
cy R
ate
% (l
ine)
1,36
8,32
0
1,33
5,21
6
1,30
2,31
5
1,31
4,37
8
1,31
1,46
5
1,34
6,68
6
1,35
1,15
9
1,34
5,03
4
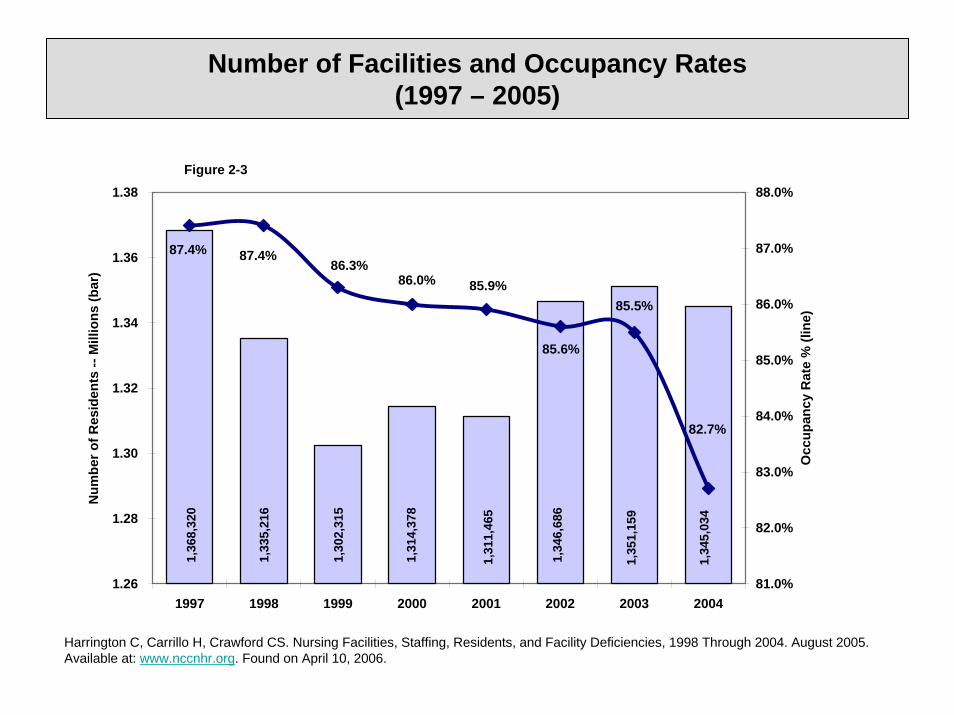
Figure 2-3
Harrington C, Carrillo H, Crawford CS. Nursing Facilities, Staffing, Residents, and Facility Deficiencies, 1998 Through 2004. August 2005. Available at: www.nccnhr.org. Found on April 10, 2006.
Number of Facilities and Occupancy Rates (1997 – 2005)

AK
HI AL
AZAR
CA CO
CT
DE
FL
GA
ID
IL IN
IA
KSKY
LA
ME
MD
MAMI
MN
MS
MO
MT
NENV
NH
NJ
NM
NY
NC
ND
OH
OK
OR
PA
RI
SC
SD
TN
TX
UT
VT
VA
WA
WV
WIWY
Percent of the State Population Aged 65 and Over Residing in a Nursing Home: 2000
6% or more
5% to 5.9% 4.5% to 4.9%
3.5% to 4.4%
Under 3.5%
United States4.4%
Source: Adapted from 2000 U.S. Census Bureau, Table P12 and Census 2000 NursingHome Highlights found in 65+ in the United States, 2005 page 163

“Institutional Bias”
• “People in nursing homes today are too frail to live in the community. Only a few of them can really leave.”
• Fact: For every person in a nursing home who needs assistance with 3 or more activities of daily living, there are 1.83 people living in the community who have the same level of disability.
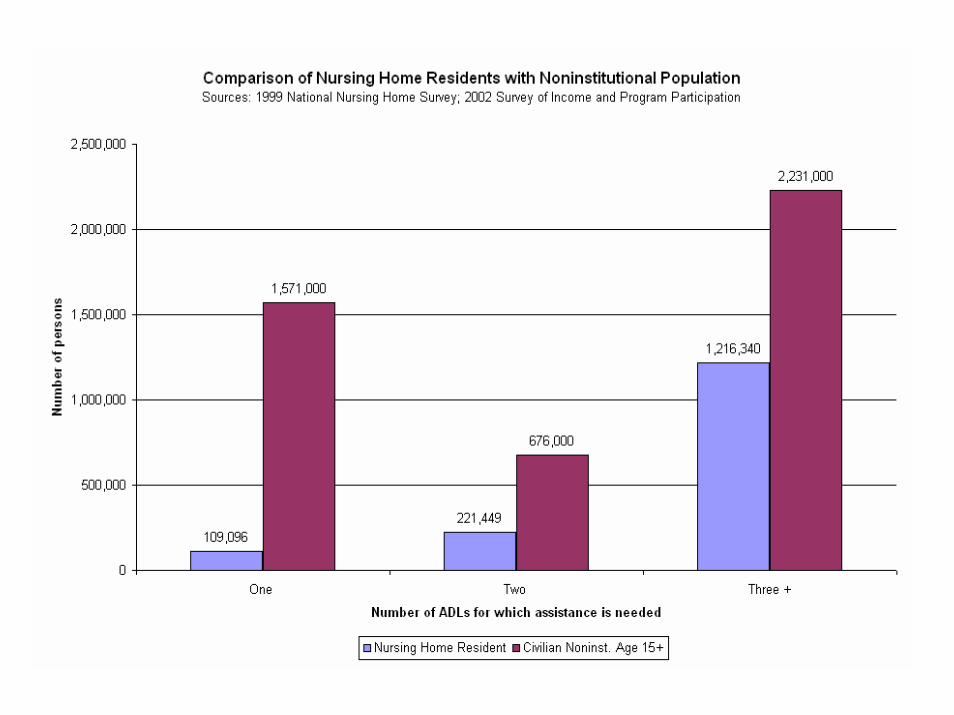

For Every Person in A Nursing Home…
• There are “disability twins” in the community (together, they are actually triplets).
• Oregon serves 77% of those who “should” be served in a nursing home in their homes and communities.
• It is not about the disability or frailty, it is about the available supports and public policy.

People in Nursing Homes Need Information about LTC Options
• Crucial for consumers, their families and the professionals who collaborate with them.
• People enter a nursing home for many reasons; many can leave.
• Without information and help, many people in nursing homes cannot make an informed decision about where to receive services outside of an institution.

States are either Leading or Following…but most are Moving
• Listening to older adults and people with disabilities.
• Balancing public dollars spent on long term care (living).
• Informing people about their options.• Emphasizing the “critical pathways” to a
nursing home admission.• Assertively reaching out to people in
nursing homes to help them return home.
Financing
• Money Follows the Person = financing for services and supports moves with the person to the most appropriate and preferred setting. – Global budgeting – Texas MFP– $1.75 billion CMS demonstration starting
• Rebalancing = reduced reliance on institutional options, increased community options.
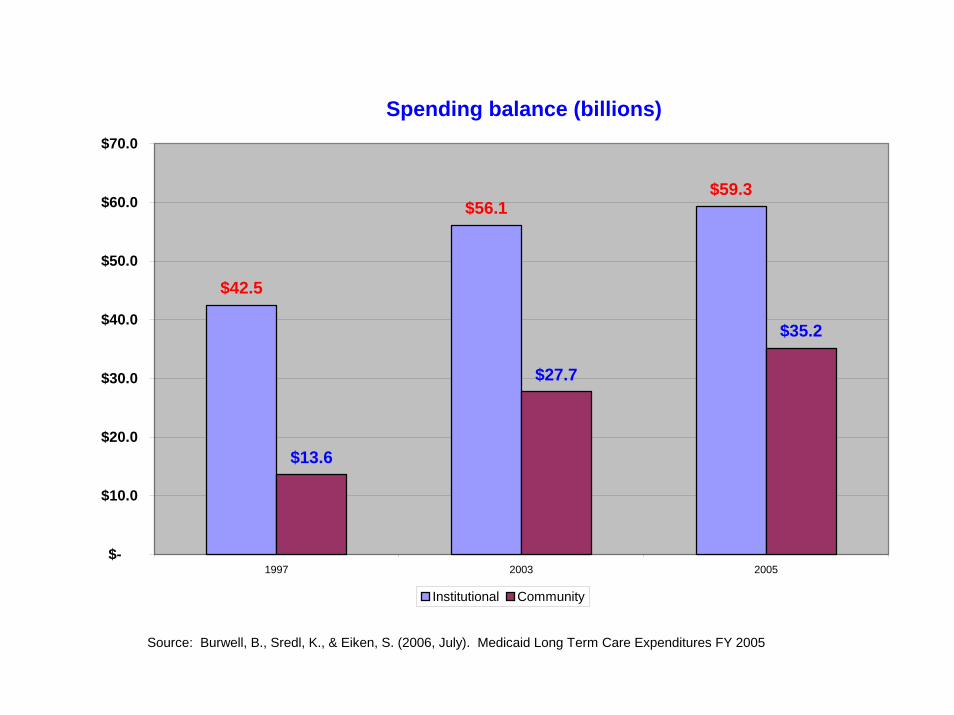
$42.5
$56.1$59.3
$13.6
$27.7
$35.2
$-
$10.0
$20.0
$30.0
$40.0
$50.0
$60.0
$70.0
1997 2003 2005
Institutional Community
Spending balance (billions)
Source: Burwell, B., Sredl, K., & Eiken, S. (2006, July). Medicaid Long Term Care Expenditures FY 2005


Medicaid Spending Balance 2004: Elders and adults with disabilities
51% 50%
39% 38%
29%26%
22% 20%
11%
55%
9%
36%
0%
10%
20%
30%
40%
50%
60%N
M, O
R
AK
WA
CA
ID, N
C
MN
CO
WI
MA IL
AL,
FL
IN, P
A
2004Does not include some state plan services, state general revenue, OAAand other programs

Balancing Study States
21%
32%
50%
36%38%
7%
55%
11%
0%
10%
20%
30%
40%
50%
60%
AR FL MN NM PA TX VT WA
2004

AK
HI AL
AZAR
CA CO
CT
DE
FL
GA
ID
IL IN
IA
KSKY
LA
ME
MD
MAMI
MN
MS
MO
MT
NENV
NH
NJ
NM
NY
NC
ND
OH
OK
OR
PA
RI
SC
SD
TN
TX
UT
VT
VA
WA
WV
WIWY
Medicaid Long-Term Care Expenditures Ranked by Proportion of Medicaid Spending for Nursing Home / Institutional Care
75.5 % or more
70.1% to 75% 60.1% to 70%
49% to 60%
29% to 50%
United States64.5%
DC
Source: Adapted from O’Brien, E., “Long-Term Care: Understanding Medicaid’s Role for the Elderly and Disabled, November 2005, The Kaiser Foundation
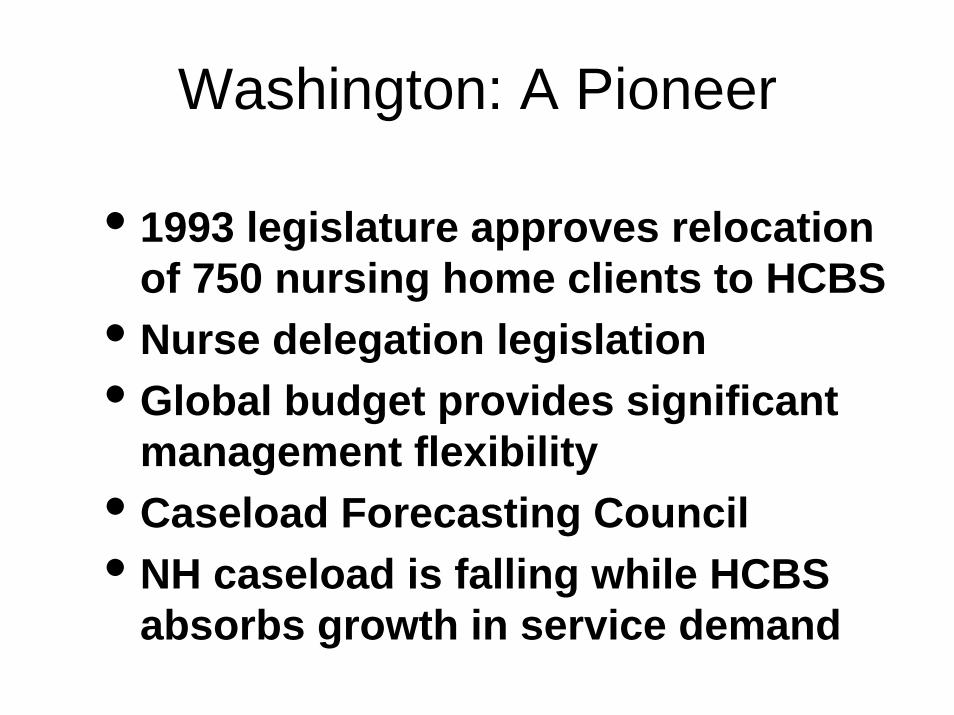
Washington: A Pioneer
• 1993 legislature approves relocation of 750 nursing home clients to HCBS
• Nurse delegation legislation • Global budget provides significant
management flexibility• Caseload Forecasting Council • NH caseload is falling while HCBS
absorbs growth in service demand

Washington: NF Caseload Trends
10000
11000
12000
13000
14000
15000
16000
1997 1998 1999 2000 2001 2002 2003 2004 2005 2006
NFFigures for July each year
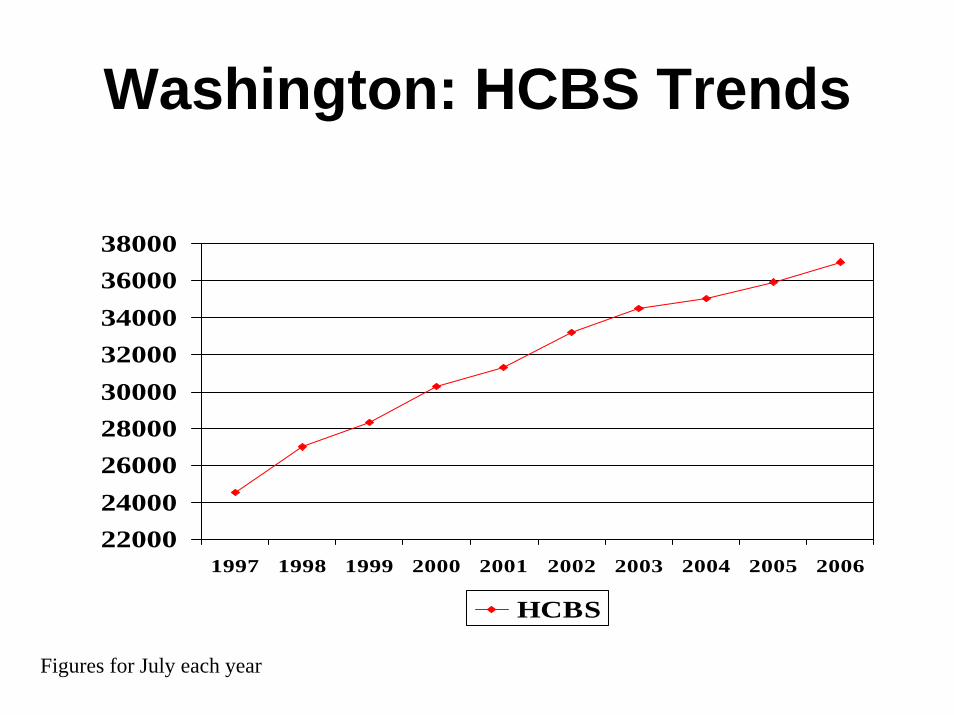
Washington: HCBS Trends
220002400026000280003000032000340003600038000
1997 1998 1999 2000 2001 2002 2003 2004 2005 2006
HCBS
Figures for July each year
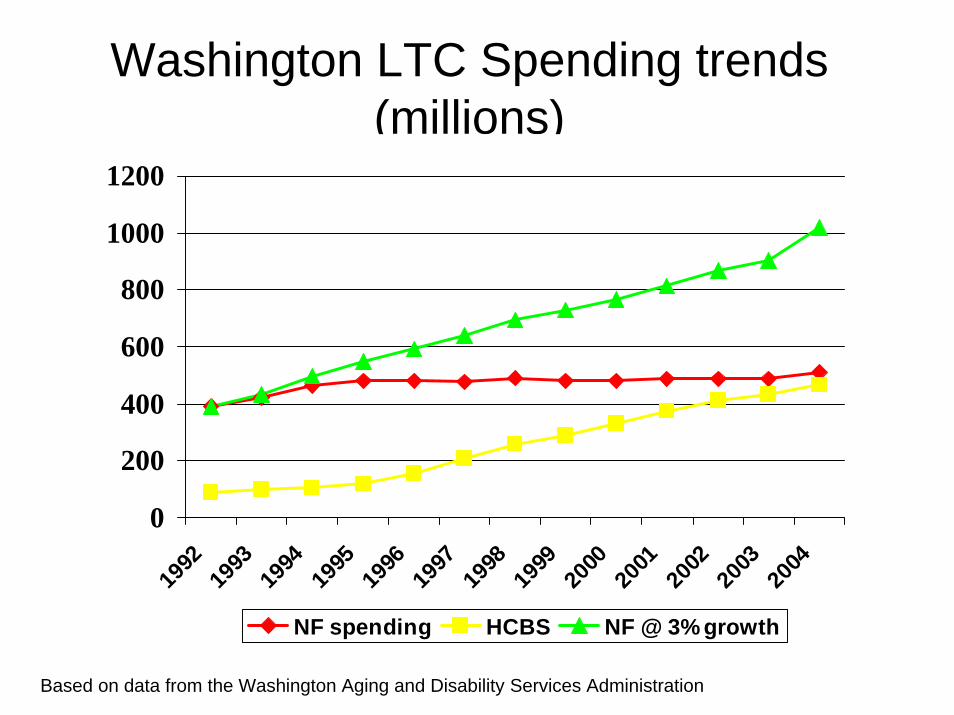
Washington LTC Spending trends (millions)
0
200
400
600
800
1000
1200
1992
1993
1994
1995
1996
1997
1998
1999
2000
2001
2002
2003
2004
NF spending HCBS NF @ 3% growth
Based on data from the Washington Aging and Disability Services Administration
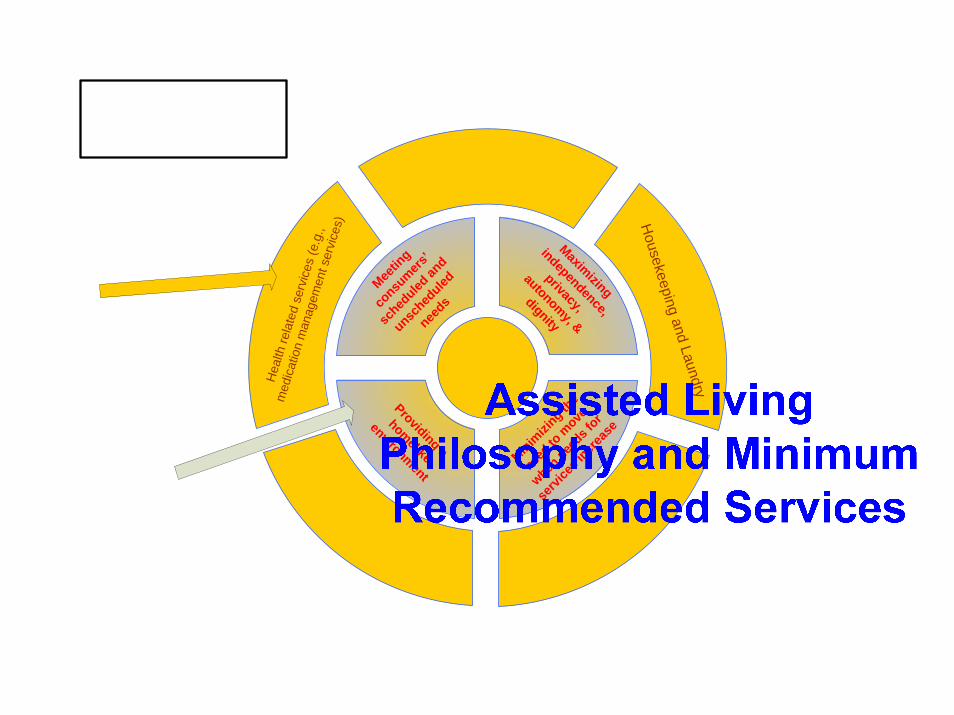
Hea
lth re
late
d se
rvic
es (e
.g.,
med
icat
ion
man
agem
ent s
ervi
ces)
Minimizi
ng the
need to
move
when nee
ds for
servi
ces i
ncreas
e
Maximizing
independence,
privacy,
autonomy, &
dignity
Housekeeping and Laundry
Meetin
g
consu
mers’
sched
uled an
d
unsched
uled
needs
Providing a
homelike
environment

Varying Levels of Care Offered In ALF Settings
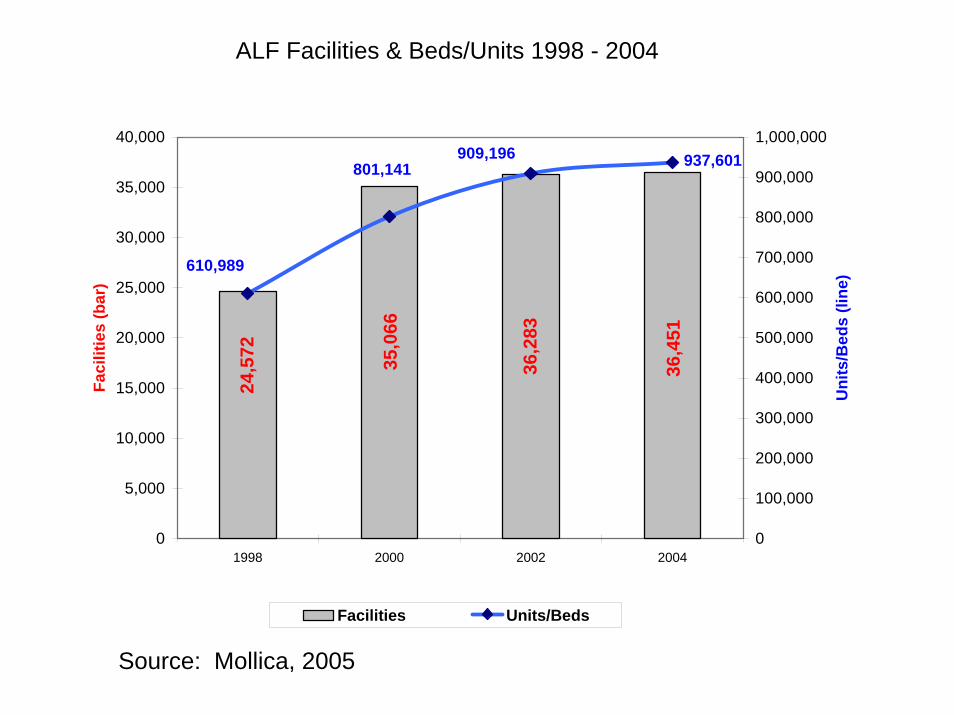
Source: Mollica, 200536
,451
36,2
83
35,0
66
24,5
72
937,601909,196801,141
610,989
0
5,000
10,000
15,000
20,000
25,000
30,000
35,000
40,000
1998 2000 2002 2004
Faci
litie
s (b
ar)
0
100,000
200,000
300,000
400,000
500,000
600,000
700,000
800,000
900,000
1,000,000
Uni
ts/B
eds
(line
)
Facilities Units/Beds
ALF Facilities & Beds/Units 1998 - 2004

A Comparison of ADL Dependence

Mental Health Conditions Among ALF Residents

Medical Conditions Among ALF Residents
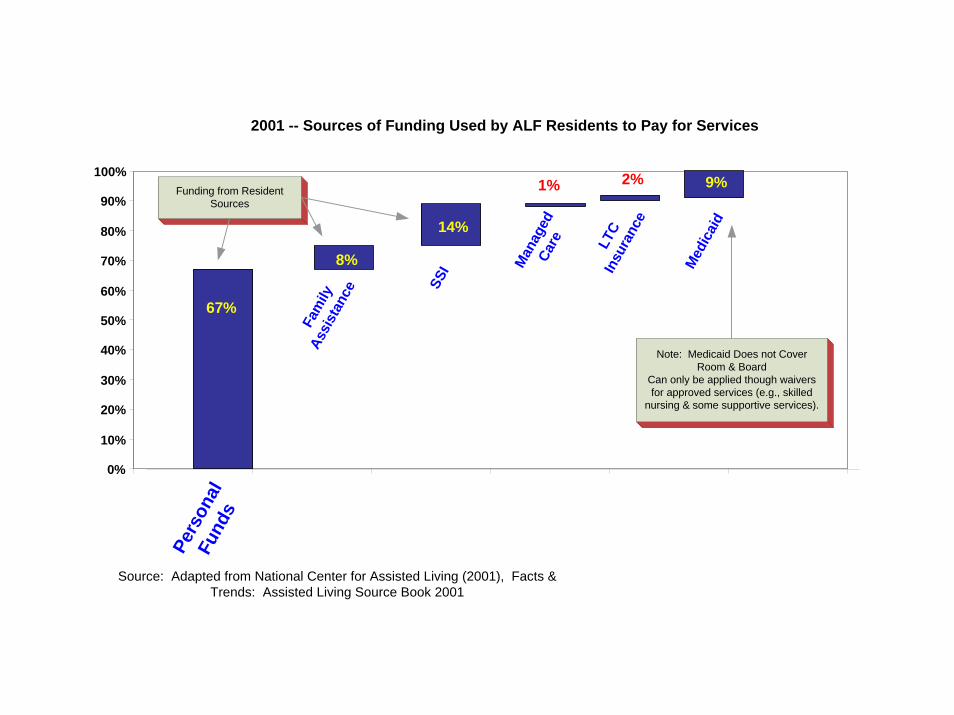
2001 -- Sources of Funding Used by ALF Residents to Pay for Services
67%
8%
14%
9%1% 2%
0%
10%
20%
30%
40%
50%
60%
70%
80%
90%
100%Pe
rson
al
Fund
s
Fam
ily
Assi
stan
ce SSI M
edic
aid
Man
aged
Car
e LTC
Insu
ranc
e
Funding from Resident Sources
Source: Adapted from National Center for Assisted Living (2001), Facts & Trends: Assisted Living Source Book 2001
Note: Medicaid Does not Cover Room & Board
Can only be applied though waivers for approved services (e.g., skilled
nursing & some supportive services).

AK
AL
AZAR
CA CO
CT
DE
FL
GA
ID
IL IN
IA
KSKY
LA
ME
MD
MAMI
MN
MS
MO
MT
NENV
NH
NJ
NM
NY
NC
ND
OH
OK
OR
PA
RI
SC
SD
TN
TX
UT
VT
VA
WA
WV
WIWY
States With Regulations for Alzheimer’s & Dementia Care - 2005
Source: Carlson, E., Critical Issues in Assisted Living: Who’s In, Who’s Out, and Who’s Providing the Care. National Senior Citizens Law Center with Support from The Harry and Janette Weinberg Foundation. May 2005
DC
States WITH Rules for Alzheimer’s/Dementia Care
States with NO Rules for Alzheimer's / Dementia
Care

Range of Psychotropic and Antidepressant Used by ALF Residents
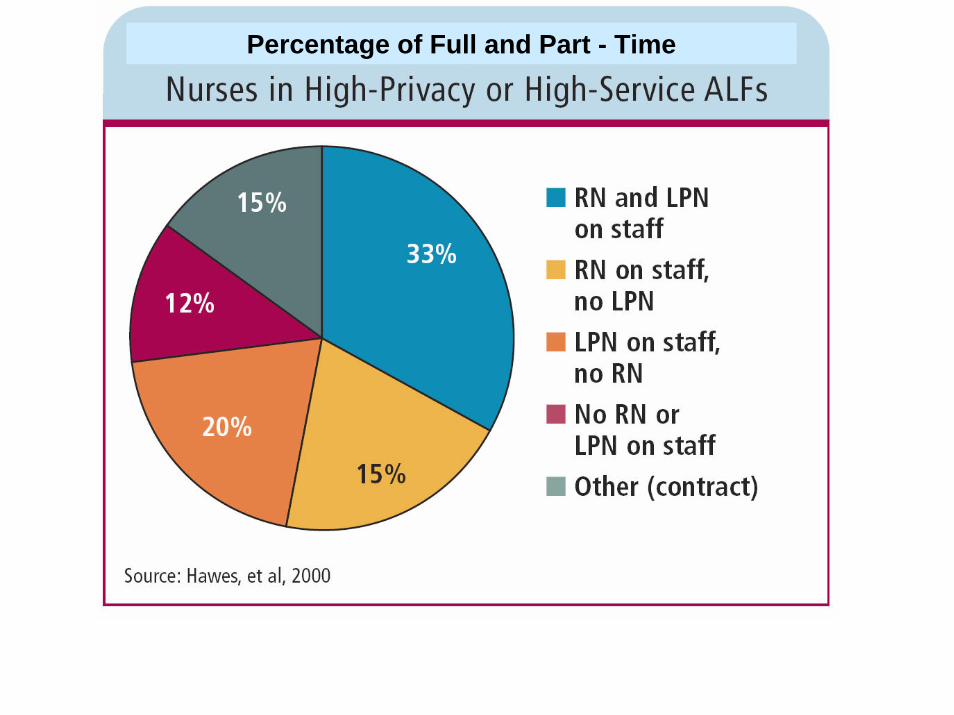
Percentage of Full and Part - Time
AK
AL
AZAR
CA CO
CT
DE
FL
GA
ID
IL IN
IA
KSKY
LA
ME
MD
MAMI
MN
MS
MO
MT
NENV
NH
NJ
NM
NY
NC
ND
OH
OK
OR
PA
RI
SC
SD
TN
TX
UT
VT
VA
WA
WV
WIWY
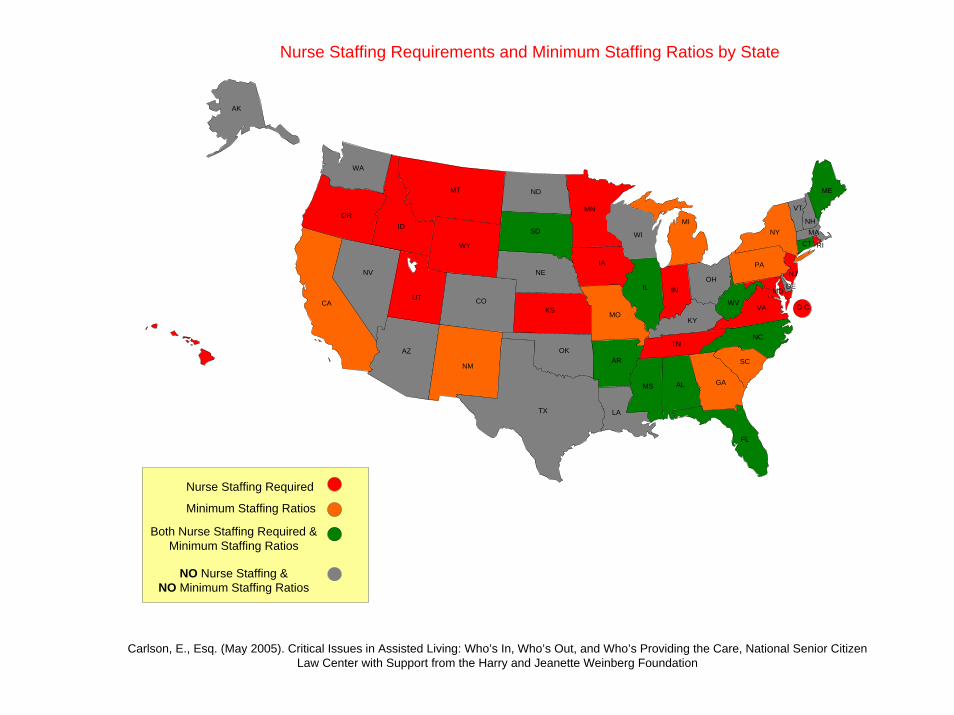
Nurse Staffing Requirements and Minimum Staffing Ratios by State
Carlson, E., Esq. (May 2005). Critical Issues in Assisted Living: Who’s In, Who’s Out, and Who’s Providing the Care, National Senior Citizen Law Center with Support from the Harry and Jeanette Weinberg Foundation
D.C.
Nurse Staffing Required
Minimum Staffing Ratios
Both Nurse Staffing Required & Minimum Staffing Ratios
NO Nurse Staffing & NO Minimum Staffing Ratios


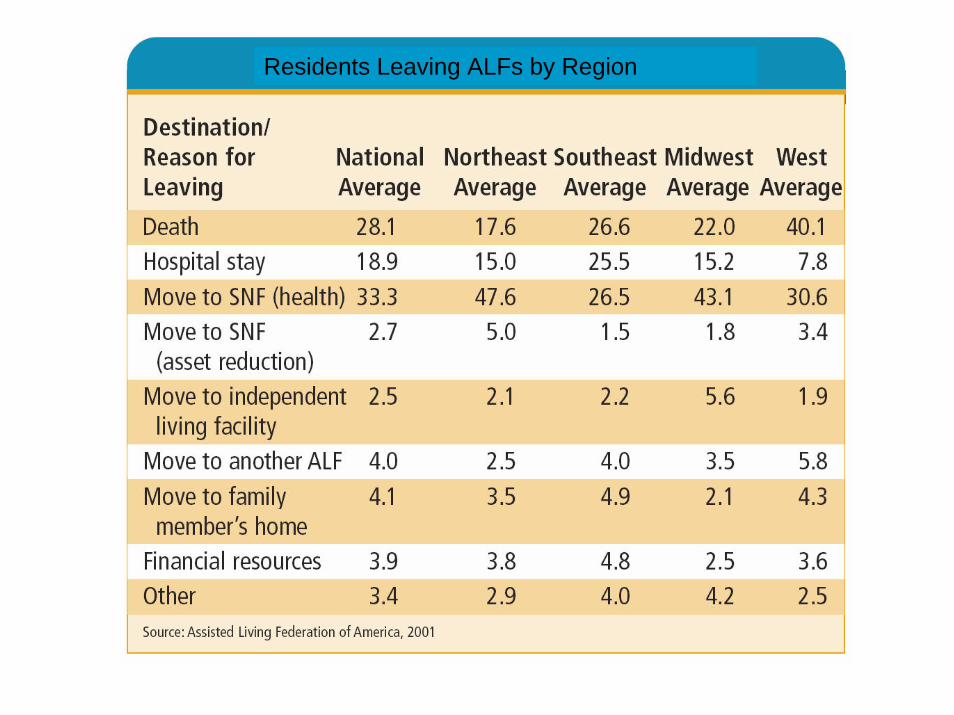
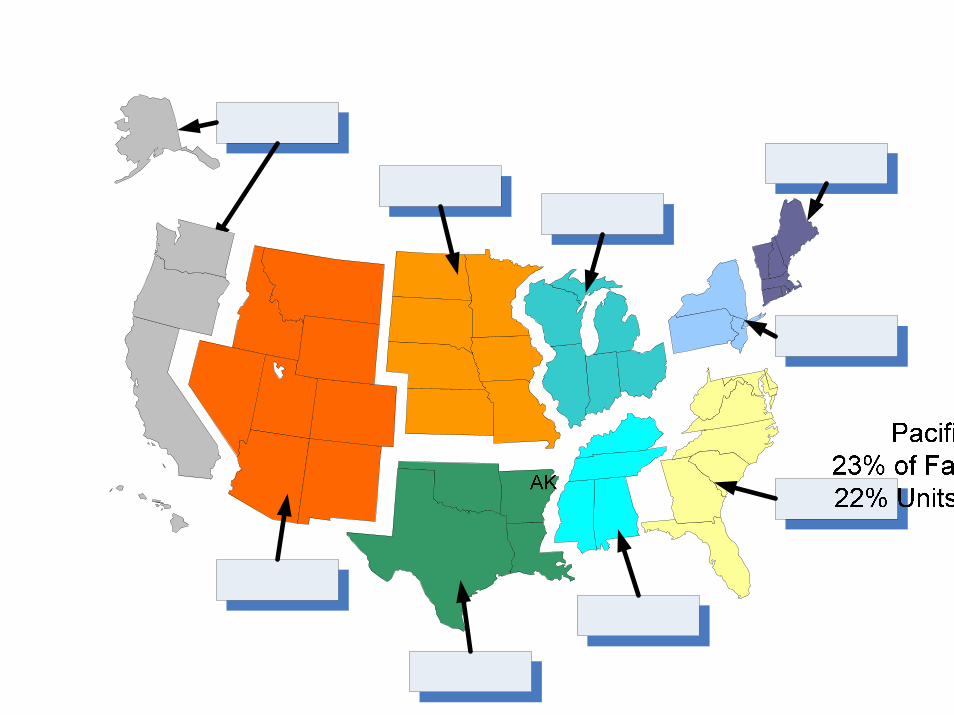
Residents Leaving ALFs by Region

Home Health Industry Spending 2001 (N = $45.3 billion)
Durable Medical Equipment,
Infusion Therapy,
Respiratory Therapy
Home Health Agencies,
6%
10%
10%
74%
Source: Centers for Medicare & Medicaid Services. Home Health Care Industry Market Update: Home Health. September 22, 2003. Available at: www.cms.hhs.gov.

Home Healthcare Expenditures 1999 - 2015
$-
$20.0
$40.0
$60.0
$80.0
$100.0
$120.0
Out of Pocket PaymentsMedicaidMedicareOther Funds (Private & Public)Priivate Health Insurance
Out of Pocket Payments $6.1 $5.3 $5.4 $4.9 $4.8 $4.9 $5.2 $5.5 $5.8 $6.2 $6.5 $6.8 $7.1 $7.4 $7.6 $7.9 $8.1
Medicaid $5.9 $6.8 $8.4 $10.0 $11.8 $13.7 $16.3 $17.7 $19.7 $22.0 $24.5 $27.2 $30.2 $33.3 $36.6 $40.2 $44.1
Medicare $8.3 $8.7 $10.0 $11.7 $13.8 $16.4 $18.9 $20.8 $22.3 $24.0 $25.6 $27.3 $29.1 $31.1 $33.3 $35.6 $38.0
Other Funds (Private & Public) $3.4 $2.8 $2.6 $2.6 $2.5 $3.0 $3.1 $3.5 $3.6 $3.7 $3.9 $4.2 $4.3 $4.5 $4.8 $4.9 $5.2
Priivate Health Insurance $7.9 $7.0 $5.8 $5.1 $5.2 $5.2 $5.4 $5.6 $5.9 $6.2 $6.5 $6.8 $7.2 $7.5 $7.7 $8.0 $8.3
1999 2000 2001 2002 2003 2004 2005 2006 2007 2008 2009 2010 2011 2012 2013 2014 2015
$ in Billions
31.6 30.632.2
34.338.1
43.2
48.953.
57.3
62.167.0
72.3
77.983.8
90.0
96.6
103.7
Source: Adapted from National healthcare Expenditure Data 1999 – 2015. Available at www.cms.hhs.gov
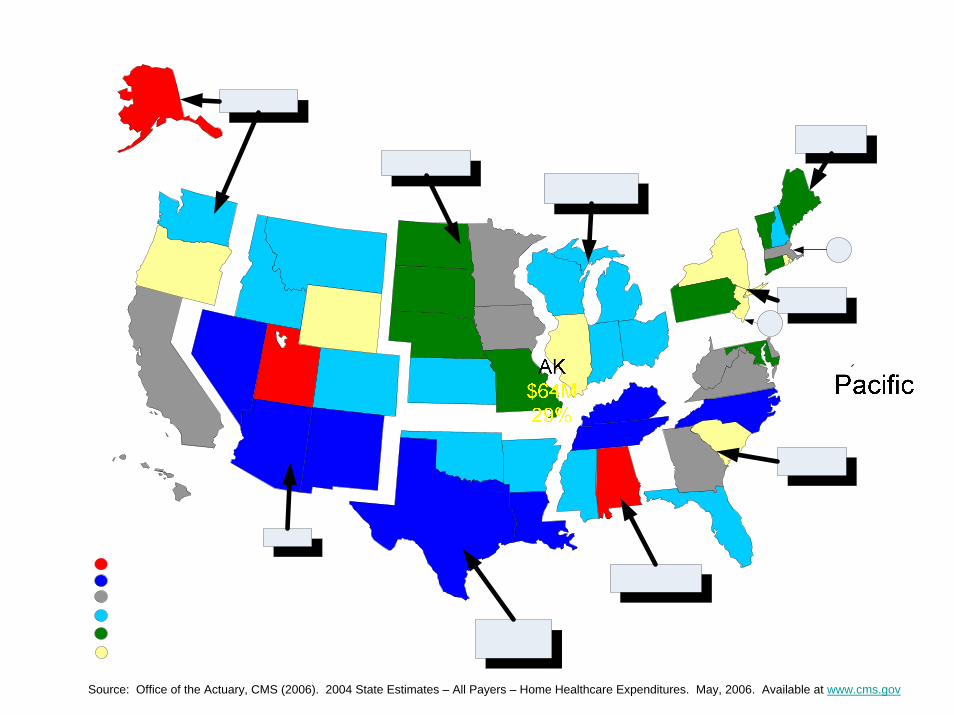
Source: Office of the Actuary, CMS (2006). 2004 State Estimates – All Payers – Home Healthcare Expenditures. May, 2006. Available at www.cms.gov
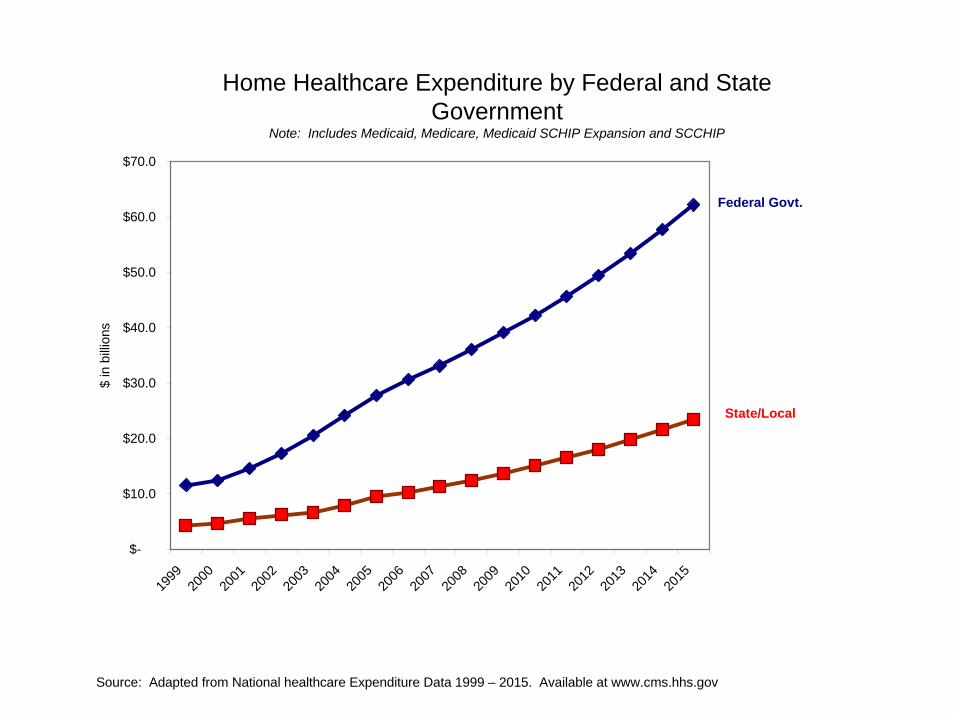
Home Healthcare Expenditure by Federal and State Government
Note: Includes Medicaid, Medicare, Medicaid SCHIP Expansion and SCCHIP
$-
$10.0
$20.0
$30.0
$40.0
$50.0
$60.0
$70.0
1999
2000
2001
2002
2003
2004
2005
2006
2007
2008
2009
2010
2011
2012
2013
2014
2015
$ in
billi
ons
Federal Govt.
State/Local
Source: Adapted from National healthcare Expenditure Data 1999 – 2015. Available at www.cms.hhs.gov
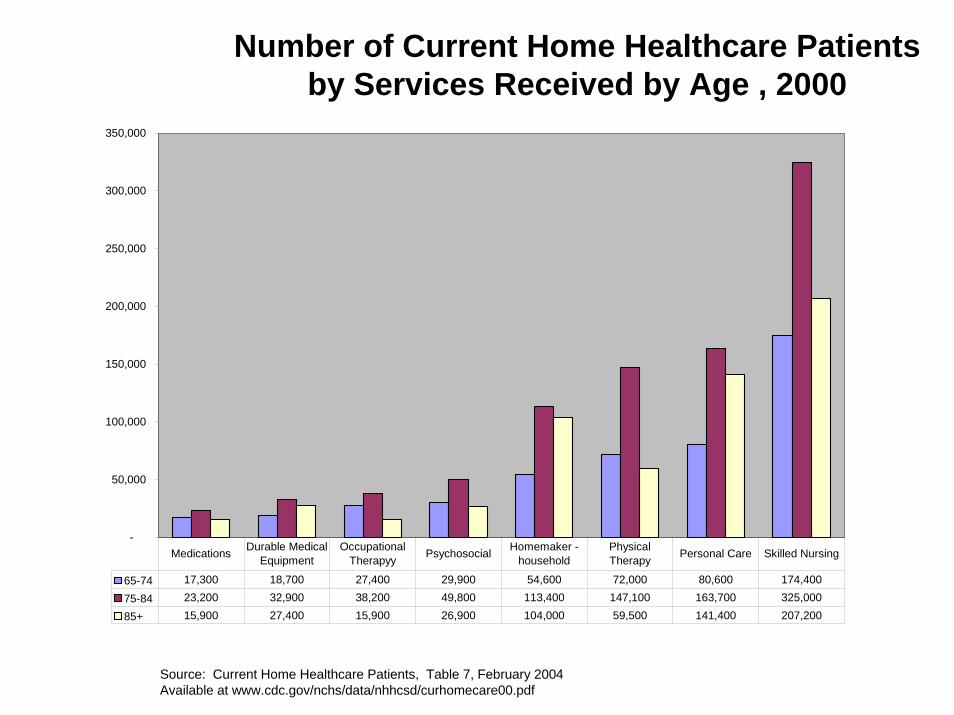
Number of Current Home Healthcare Patients by Services Received by Age , 2000
-
50,000
100,000
150,000
200,000
250,000
300,000
350,000
65-74 17,300 18,700 27,400 29,900 54,600 72,000 80,600 174,400
75-84 23,200 32,900 38,200 49,800 113,400 147,100 163,700 325,000
85+ 15,900 27,400 15,900 26,900 104,000 59,500 141,400 207,200
Medications Durable Medical Equipment
Occupational Therapyy Psychosocial Homemaker -
householdPhysical Therapy Personal Care Skilled Nursing
Source: Current Home Healthcare Patients, Table 7, February 2004Available at www.cdc.gov/nchs/data/nhhcsd/curhomecare00.pdf

31.4%
16.0%
15.9%
14.1%
11.6%
8.5%
7.4%
7.0%
6.3%
5.2%
4.6%
4.5%
3.7%
0.0% 5.0% 10.0% 15.0% 20.0% 25.0% 30.0% 35.0%
Circulatory Diseases
Heart Disease
Injury and Poisoning
Diseases of MusculoskeletalSystem and Connective Tissue
Disease of the Respiratory System
Endocrine, Nutritional, & MetabolicDiseases and Immunity Disorders
Diseases of the Skin andSubcutaneous Tissue
Neoplasms
Diabetes Mellitus
Diseases of Digestive System
Disease of the GenitourinarySystem
Essential Hypertension
Pneumonia, Organism Uspecified
Medicare Home Health Utilization by Principal Diagnosis, 1999
Source: National Association of Home Care & Hospice, Updated 2004. Available at www.nahc.org

Number of & Type of Home Health Workers , 2002(Note: U.S Department of Labor Bureau of Labor Statistics – Excludes Hospital Based and Public Agencies)
Social Workers, 6,4711%
Other, 172,183 26%
Occupational Therapists , 5,1781%
Home Care Aids, 317,888 , 47%
Physical Therapy Staff, 13,514
2%
LPNs, 48,5427%
RNs, 111,32416%
Source: National Association of Home Care & Hospice, Updated 2004. Available at www.nahc.org

Proportion of Positions in Home Health Workforce 2003
Physical Therapists
5%
Home Health Aides
38%Other, 8%
Social Workers2%
Professional Nurses
33%
Vocational Nurses
12%Occupational
Therapists2%
Source: Centers for Medicare & Medicaid Services. Home Health Care Industry Market Update: Home Health. September 22, 2003. Available at: www.cms.hhs.gov.
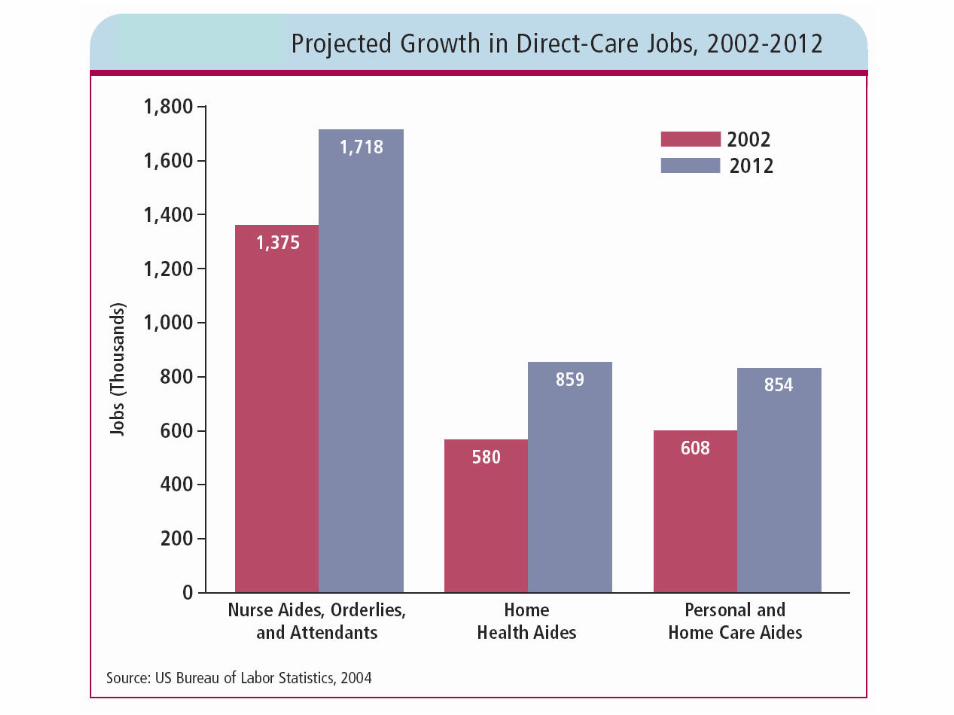

Figure 4 - 12
97%96%
84% 82%74%
70%68%
64%60%
28%
0%
10%
20%
30%
40%
50%
60%
70%
80%
90%
100%
Therapeutic Activities
Personal Assistance
Meals
Social Services
Health-related Services
Medication Management
Transportation
Personal Care Services
Caregiver Support G
roups
Rehabilitation Therapy
Percentage of Adult Day Centers that Provide Spcific Servcie
Source: Adapted from AARP Public Policy Institute, Fact Sheet, Adult Day Services (2004)

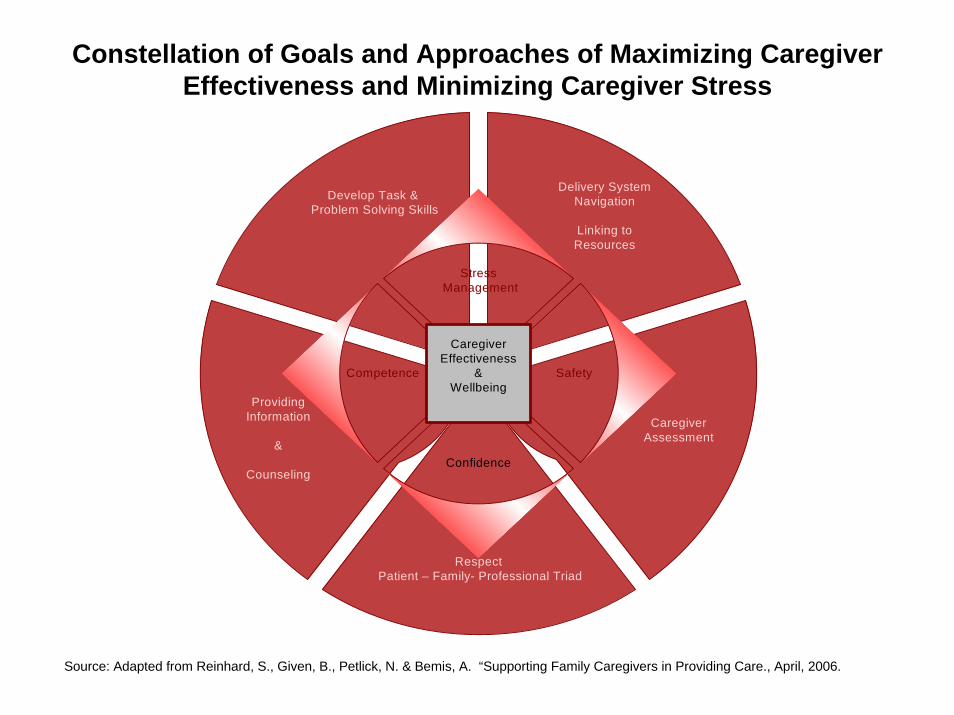
Constellation of Goals and Approaches of Maximizing Caregiver Effectiveness and Minimizing Caregiver Stress
Providing Information
&
Counseling
Respect Patient – Family- Professional Triad
Delivery System Navigation
Linking to Resources
Develop Task & Problem Solving Skills
Competence
Stress Management
Caregiver Assessment
Safety
Confidence
CaregiverEffectiveness
&Wellbeing
Source: Adapted from Reinhard, S., Given, B., Petlick, N. & Bemis, A. “Supporting Family Caregivers in Providing Care., April, 2006.

Level of Reliance of Informal Care Relative to Formal Care
84%
57%
9%
36%
7% 7%
0%
20%
40%
60%
80%
100%
120%
55 - 64 65+
Perc
ent (
%)
Informal Care Only Informal and Formal Care Formal Care Only
Source: AARP – Beyond 50 2003 A Report to the Nation on Independent Living and Disability. www.aarp.orgBased on 1994 National Health Interview Survey, National Long Term Care Survey by AARP Public Policy Institute) and The Characteristics of Long-Term Care Uses by AHRQ
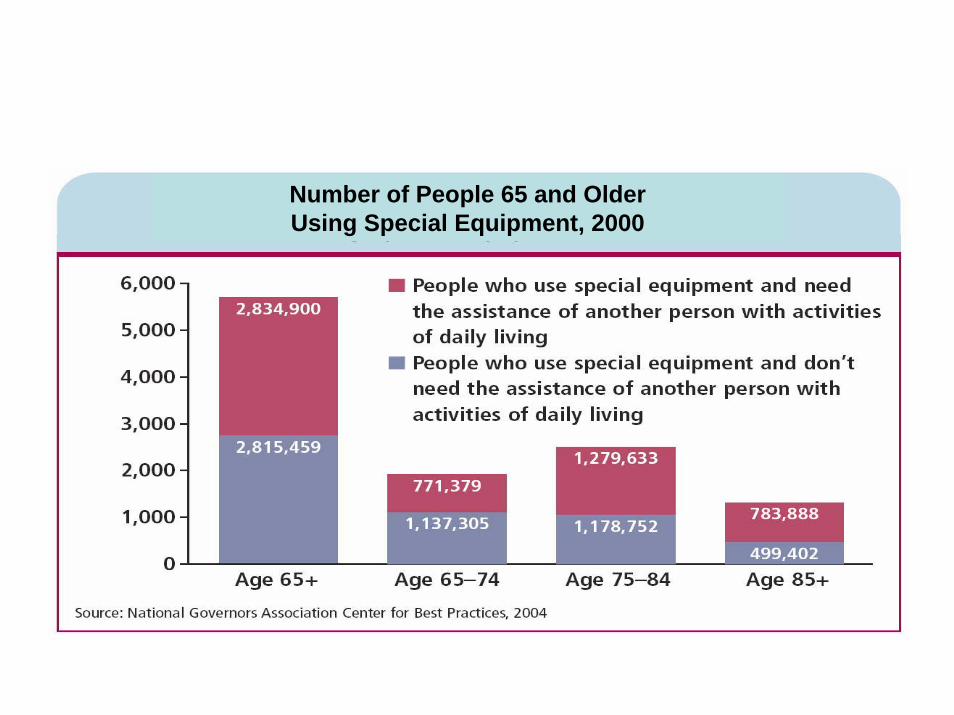
Number of People 65 and OlderUsing Special Equipment, 2000

Community Living for ALL AGES is the Public Policy Goal• Ageism is rampant.
• Professionals, especially those who specialize in geriatrics, need to combat prevailing myths.
• People of all ages want to avoid institutionalization.
•People of all ages seek more control over their lives, including services.

74%
10%
16%
66%
12%
22%
83%
8%
9%
86%
9%
5%
0%
10%
20%
30%
40%
50%
60%
70%
80%
90%
100%
All 50 + 50 -64 65-74 75 +Age
Strongly Agree Somewhat Agree Disagree/No Opinion.
Response to – “What I’d really like is to stay in my current residence as long as possible.”
Seniors Desire to Stay in Residence (2004 Survey) Most Strongly Agee – On Desire to Stay in Current Residence as Long as Possible
(N=1005)
Source: AARP, Beyond 50.05 A Report to the Nation on Livable Communities (2005)

Percent of 50 and Older Reporting Availability of Features in Their Homes Supporting Independent Living in Their Residence
% Reported Having Feature
24%33% 34%
37%46%
56%60% 63%
81%85%
94%
0%
10%
20%
30%
40%
50%
60%
70%
80%
90%
100%
Lever
Door Han
dlesBath
room A
ids
Entrance
With
out Step
s
Wider Doorw
ays f
or Acc
esibilit
y
Public Sidew
alk O
utside o
f Home
Half-bath
on the M
ain Lev
el
Non Slip Floor S
urface
s
Attach
ed G
arage o
r Cove
red Park
ing
Bedro
om on the M
ain Lev
el
Full Bath
on the M
ain Lev
el
Drivew
ay / P
arkingsp
ace I
mmediat
ely O
utside H
ome

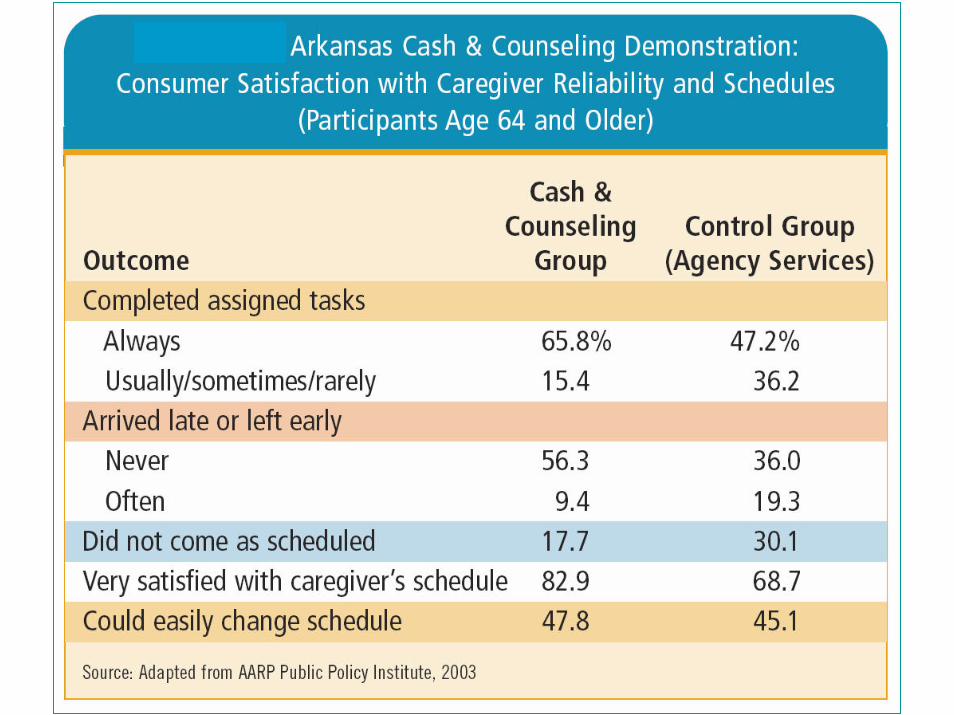
Older Adults Do Seek More Control over LTL Services
• Programs with high percentage of older adults show they like having control over services, schedules, and worker selection.
• California serves 200,000 people and 77% are over 65 years.
• Arkansas similar--72% older adults, with 41% surrogates (family caregivers).
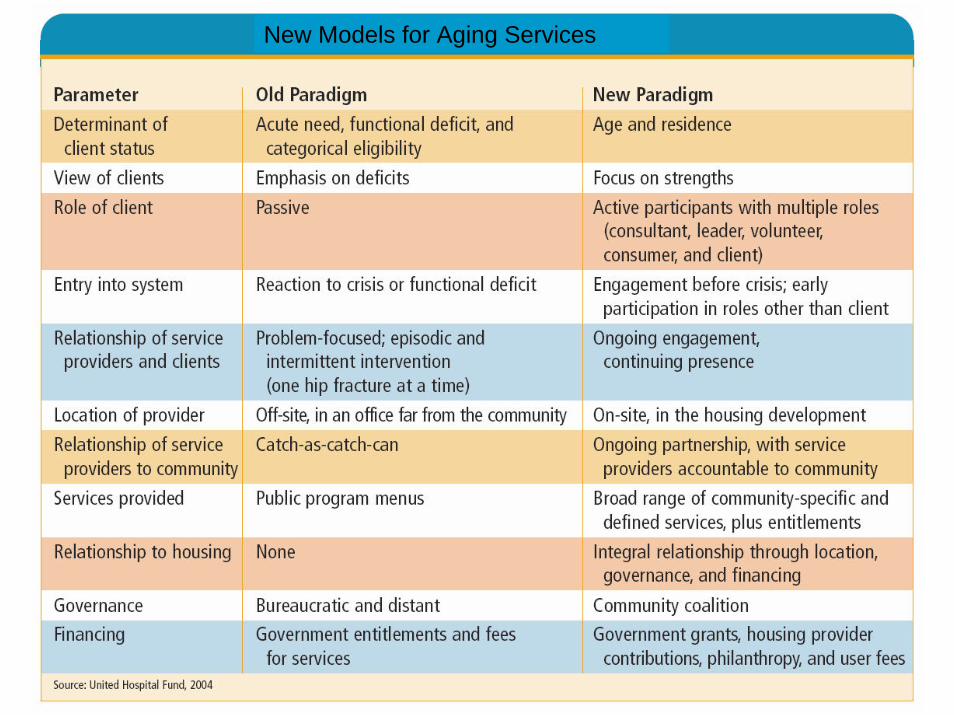
New Models for Aging Services
Re-Design of Communities to Promote Independence of Older Adults
• Build community capacity to support independence and well being
• Communities that are “friendly” to older adults become more friendly to all
• Capitalize on the wisdom and social assets of older adults
Re-Designing Communities
Think broadly--physical spaces, land use, transportation, employment, volunteerism, health, education, cultural and social opportunities…..

25% of Our Lives Spent in Retirement
• People not flocking to age segregated environments
• Want to be engaged in their communities
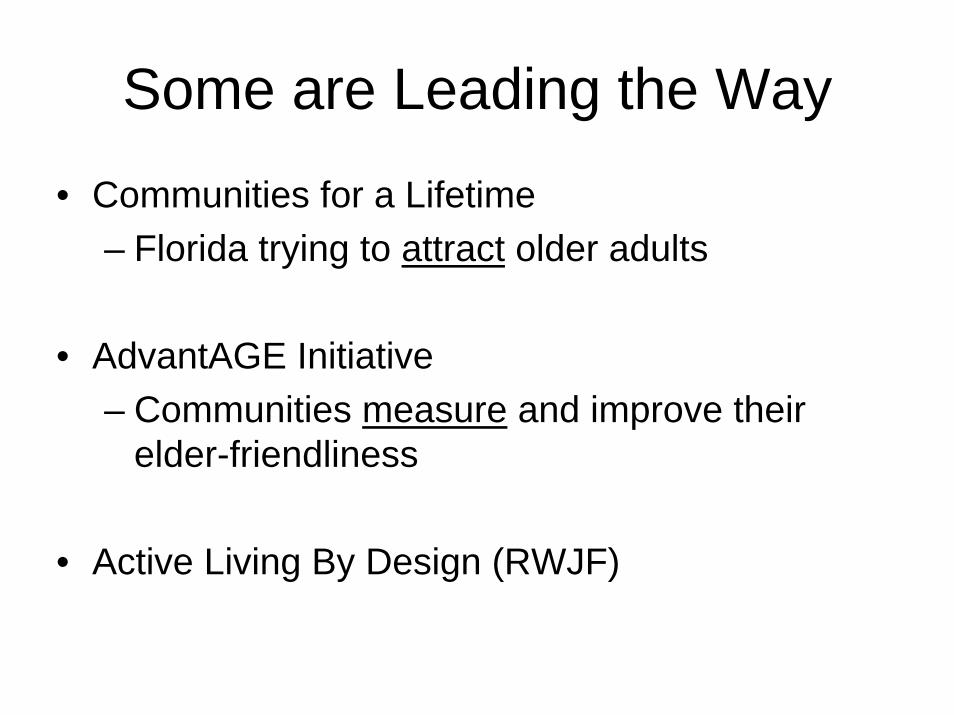
Some are Leading the Way
• Communities for a Lifetime– Florida trying to attract older adults
• AdvantAGE Initiative– Communities measure and improve their
elder-friendliness
• Active Living By Design (RWJF)
The AdvantAge® InitiativeRecommended Elements of an Elder Friendly Community
Source: Adapted from Visiting Nurse Service of New York, Center for Home Care Policy & Research


Susan C. Reinhard, RN, PhD, FAANProfessor and Co-Director
Rutgers Center for State Health Policy