long term prognosis of multiple sclerosis in untreated ... · long-term prognosis of multiple...
TRANSCRIPT

Long-term Prognosis of Multiple Sclerosis in Untreated Patients and
Patients Treated with First Generation Immunomodulators
Helen Tedeholm
Department of Clinical Neuroscience and Rehabilitation
Institute of Neuroscience and Physiology
The Sahlgrenska Academy
2014

2
Long-term Prognosis of Multiple Sclerosis in Untreated Patients and Patients Treated with First Generation Immunomodulators © Helen Tedeholm 2014 Correspondence: [email protected] ISBN 978-91-628-9220-3 Printed in Gothenburg, Sweden 2014 Ineko AB, Gothenburg Keywords: multiple sclerosis, long-term prognosis, predictors, therapy, immunomodulators, historical controls Available online: http://hdl.handle.net/2077/36905

3
"You are not defeated when you lose. You are defeated when you quit"
-Paulo Coelho

4
5
ABSTRACT
The course of multiple sclerosis (MS) is extremely variable. A limited number of demographic and clinical variables at MS onset were described to predict time to the onset of irreversible disability. However, there is no general consensus concerning the power and long-term range of these predictors. Although pivotal trials of interferon beta and glatirameracetate in relapsing-remitting MS demonstrated a reduced relapse rate, it is not clear whether the onset of secondary progression is postponed by means of treatment. Long-term randomized control trials are of several reasons not possible to accomplish. The only option is observational studies.
In this thesis the long-term prognosis was determined in a 50-year follow-up in the geographically and temporally defined “Gothenburg Incidence Cohort” (onset 1950-64, n=305). A Kaplan-Meier survival analysis showed that the median time to secondary progression was 14 years, to EDSS 6 (gait with a cane) 25 years and EDSS7 (wheelchair bound) 48 years. A score of combined onset predictors provided an estimate of the time to disability with a hazard ratio in the order of magnitude 2-4 (paper I). Further, we investigated whether first generation immunomodulating drugs in the relapsing remitting phase delay the time to secondary progression. We explored the predictors as tools to adjust for imbalance between treated patients and historical controls. We compared the time to secondary progression between treated patients from the Swedish National MS Registry (disease onset 1995–2004, n = 730) and untreated patients from the Gothenburg Incidence Cohort (n = 186) within a 12-year survival analysis. The treated patients exhibited a significant longer time to secondary progression than the historical controls (HR: men, 0.32, p=0.002; women, 0.53, p=0.02) (paper II). In order to obtain an individual prediction of the risk of secondary progression we investigated predictors associated with relapses throughout the course. We used Poisson regression to estimate the individual current risk of secondary progression at any point during the relapsing-remitting course. The average annual risk of secondary progression was 4.6 %. An algorithm including current age, a severity score of the last attack and the time elapsed since the attack predicted the yearly risk of secondary progression within the range 0.1-15%. This convenient algorithm is now web-based (http://msprediction.com) and may be used for stratification of patients in future studies (paper III).

6
SAMMANFATTNING Sjukdomsförloppet vid MS är svårt att förutsäga och varierar kraftigt mellan olika individer. Några demografiska och kliniska faktorer vid MS-debuten har visat sig att vara prediktiva för tiden till funktionsnedsättning. Hur starka dessa prediktorer är och hur långt prediktionen sträcker sig är oklart. Trots att randomiserade studier har visat att behandling med interferon beta och glatirameracetat har effekt i skovfasen saknas bevis för att långtidsbehandlingen också fördröjer den senare övergången till den sekundärprogressiva fasen som innebär ökande funktionsnedsättning. Randomiserade långtidsstudier är omöjliga att utföra av flera skäl. Den enda möjligheten att utvärdera långtidseffekten är genom observationsstudier. Syftet var att fastställa långtidsprognosen i en geografiskt- och tidsavgränsad kohort. Vi utförde en 50 års uppföljning av MS-patienter som var göteborgare vid debuten 1950-64 (den göteborgska incidenskohorten, n=305). Överlevnadsanalysen visade att mediantiden till sekundärprogression var 14 år, 25 år till EDSS6 (stöd vid 100 meters gångsträcka) och 48 år till EDSS7 (rullstolsbunden). En score av kombinerade prediktorer från debutskovet möjliggör en uppskattning av en upp till fyrfaldig riskökning för funktionsnedsättning (paper I). Vidare undersöktes om första generationens immunomodulerande behandling vid skovformad MS fördröjer tiden till sekundärprogression. Prediktorerna ifrån debutskovet användes som verktyg för att justera för olikheter mellan behandlade patienter och historiska kontroller. Tiden från debut till sekundärprogression jämfördes mellan behandlade patienter från Svenska MS registret (MS-debut 1995-2004, n=730) och obehandlade kontroller ifrån Göteborgs Incidens kohort (n=186) i en 12-års överlevnadsanalys. Risken för sekundärprogression var signifikant lägre hos de behandlade patienterna jämfört med de historiska kontrollerna (32 % hos män, 53 % hos kvinnor) (paper II) För att uppnå en individuell prediktion undersöktes därefter prediktorerna ifrån alla skov under förloppet fram till sekundärprogression. Den individuella aktuella risken för sekundärprogression vid vilken som helst vald tidpunkt i skovfasen beräknades med Poisson regression. Den genomsnittliga årliga risken för sekundärprogression var 4.6 %. En algoritm uppbyggd av aktuell ålder, score för svårighetsgrad av senaste attacken, samt tid sedan senaste attack predikterade den årliga risken för sekundärprogression i storleksordningen 0.1-15 %. Denna användarvänliga algoritm är nu web-baserad (http://msprediction.com) och kan komma att användas för stratifiering av patienter i framtida studier (paperIII).

7

8
LIST OF PAPERS This thesis is based on the following studies, referred to in the text by their Roman numerals (I-III)
I. Tedeholm H, Skoog B, Lisovskaja V, Runmarker B, Nerman O, Andersen O. The outcome spectrum of multiple sclerosis: disability, mortality and a cluster of predictors.
submitted manuscript
II. Tedeholm H, Lycke J, Skoog B, Lisovskaja V, Hillert J, Dahle C, Fagius J, Fredrikson S, Landtblom A-M, Malmeström C, Martin C, Piehl F, Runmarker B, Stawiarz L, Vrethem M, Nerman O and Andersen O. Time to secondary progression in patients with multiple sclerosis who were treated with first generation immunomodulating drugs.
Multiple Sclerosis Journal. 2012; 19(6): 765–774.
III. Skoog B, Tedeholm H, Runmarker B, Odén A, Andersen O. Continuous prediction of secondary progression in the individual course of multiple sclerosis. Multiple Sclerosis and Related Disorders. 2014; 3(5): 584–592
.

9
TABLE OF CONTENTS ABBREVATIONS ........................................................................................... 11 1 INTRODUCTION ......................................................................................... 13
1.1 History ................................................................................................. 13 1.2 Epidemiology ...................................................................................... 13 1.3 Etiology ............................................................................................... 14 1.4 Diagnosis ............................................................................................. 15 1.5 Natural Course ..................................................................................... 17 Clinically isolated syndrome ....................................................................... 17 Radiologically isolated syndrome ............................................................... 17 1.6 Subtypes of MS ................................................................................... 18 Relapsing-remitting ..................................................................................... 18 Secondary progressive ................................................................................ 19 Primary progressive .................................................................................... 19 Progressive relapsing .................................................................................. 20 1.7 Pathophysiology of MS ....................................................................... 20 Pathogenesis of RRMS ............................................................................... 20 Pathogenesis of progressive MS ................................................................. 20 1.8 Symptoms ............................................................................................ 21 1.9 Quantifying disability in MS ............................................................... 22 1.10 Natural history and prognosis of MS .................................................. 23 Age –related maximum ............................................................................... 24 Demographic and clinical predictors .......................................................... 25 1.11 Treatment of multiple sclerosis ........................................................... 26 1.12 Survival analysis .................................................................................. 27 Censoring .................................................................................................... 27 Kaplan-Meier .............................................................................................. 27 Multivariate analysis ................................................................................... 29 Cox proportional hazard model ................................................................... 29

10
Poisson regression ....................................................................................... 30 2 AIMS ......................................................................................................... 31 3 PATIENTS AND METHODS ......................................................................... 32
The Gothenburg incidence cohort ............................................................... 32 The Swedish multiple sclerosis register ...................................................... 33 3.1 Patients included, paper I-III ............................................................... 34 3.2 Study design and statistics ................................................................... 34
4 RESULTS .................................................................................................... 35 5 DISCUSSION .............................................................................................. 39
5.1 Qualities of the patient materials ......................................................... 39 Gothenburg incidence cohort ...................................................................... 39 The material from the Swedish MS register (SMSreg) ............................... 40 5.2 Descriptions of the natural course and prognosis ................................ 41 Towards a consensus on the natural history of MS ..................................... 41 Demographic and clinical onset predictors ................................................. 41 5.3 Strategies for prediction ...................................................................... 43 The range of prediction ............................................................................... 43 A novel strategy for prediction ................................................................... 44 Application of the prediction score ............................................................. 45 5.4 Observational studies of therapeutic effects ........................................ 46 Long-term follow up studies ....................................................................... 47 The use of historical controls ...................................................................... 48
6 CONCLUSION ............................................................................................. 51 7 FUTURE PERSPECTIVES ..................................................................... 53
Validation and application of the prediction score ..................................... 53 ACKNOWLEDGEMENT .................................................................................... 54 REFERENCES .................................................................................................. 55

11
ABBREVIATIONS
ACTH
BBB
CI
CIS
CNS
CSF
DIS
DIT
EAE
EBV
EDSS
FDA
CDMS
DMD
GIC
HLA
HR
IgG
LTFU
Adrenocorticotropic hormone
Blood-brain barrier
Confidence interval
Clinically isolated syndrome
Central nervous system
Cerebrospinal fluid
Dissemination in space
Dissemination in time
Experimental allergic encephalomyelitis
Epstein Barr virus
Expanded Disability Status Scale
U.S Food and Drug Administration
Clinically defined MS
Disease modifying drugs
Gothenburg incidence cohort
Human leukocyte antigen
Hazard ratio
Immunoglobulin G
Long-term follow-up

12
MRI
MS
NMO
PP
PPMS
PR
PRMS
RCT
ROS
RR
RRMS
SmsReg
SP
SPMS
Magnetic resonance imaging
Multiple Sclerosis
Neuromyelitis optica
Primary progressive
Primary progressive MS
Progressive Relapsing
Progressive Relapsing MS
Randomized controlled trial
Reactive oxygen species
Relapsing-remitting
Relapsing-remitting MS
Swedish MS register
Secondary progression
Secondary progressive MS

13
1 INTRODUCTION
1.1 History Descriptions of persons with suspected Multiple sclerosis (MS) date back as early as the Middle Ages.1 The first pathological report and comprehensive clinical description of patients with intermittent episodes of neurologic dysfunction was published by Professor Jean-Martin Charcot (1825-1893).2 Charcot documented and illustrated histological findings of lesions in the Central nervous system (CNS) and thereby coining the definition of ‘la sclerose en plaques disseminées’ or multiple sclerosis upon examination of a young woman’s brain.1 In 1942 Kabat and co-workers demonstrated an increase in oligoclonal immunoglobulin in the cerebrospinal fluid of patients with MS and thus provided evidence of an inflammatory nature of the disease.3 Just before World War II, an animal model of MS was developed out of research on adverse effects of vaccines containing nervous tissue. This animal model, called experimental allergic encephalomyelitis (EAE), would later become an important model for studying the immunology of MS. In fact, it paved the way to modern theories of “autoimmunity”- the process whereby the body generates an immunologic attack against itself. Later on, several large population–based MS twin studies demonstrated a genetic basis. The contemporary opinion is that genes determine part of the MS risk in combination with environmental factors.4-7
1.2 Epidemiology Disease occurrence is often described as prevalence and incidence. The prevalence estimates the number of individuals who have a disease at a given point in time in a population, whilst the incidence is a measure of number of individuals that contract a disease during a defined time period in a given population. Prevalence and incidence can be used to reveal temporal and demographic differences in the distribution of disease, and provide essential information for health service planning. The most striking epidemiologic observation of MS is the uneven distribution across populations around the world. It has been observed that the prevalence of MS tends to be higher at higher degrees of latitude in both hemispheres,8, 9 although this trend has been attenuating over time. Several interpretations of the global distribution were

14
presented. Recently evidence that challenges the conventional idea of latitudinal gradient in Europe and North America was presented.10 It was reported that MS is particularly prevalent in areas where white people live, in high-income countries, and in temperate zones.11 Europe is considered a high prevalence region for MS,12 containing more than half of the global population of people diagnosed with MS.13 In Sweden 2008 the number of patients with MS was 17,485 and prevalence was 188.9/100,000. This is among the highest nationwide MS prevalence estimates reported. The female to male MS ratio was 2.35:1 and the risk of MS increases with increasing northerly latitude for both men and women.14
The prevalence and incidence of MS has probably increased over time. The annual MS incidence in Rochester, US, was reported to be constant (approximately 3.6/100,000) for several decades,15 however the annual incidence for 1975-84 had increased to 6.2-6.3.16 Several studies suggested that this change resulted primarily from an increase in the incidence of MS among women leading to higher male to female sex ratios of MS.10, 17, 18 Data from one recent study, describing a high incidence (10,2/100 000) in Sweden, do not support the increase of female/male sex ratio.19 The proposed higher sex ratios of MS indicate the existence of an environmental influence on the risk of MS. Female lifestyle in western nations, for example cigarette smoking, birth control and later childbirth, have changed over recent decades and these should be the focus of epidemiologic studies.10 However, an increase in benign cases was reported,20 which might implicate more female cases. Nevertheless, prevalence can be indicative of several other factors beyond the true frequency of MS. Increased survival time due to early diagnosis with the revised diagnostic criteria, availability of medical facilities and better treatment, will lead to an increased prevalence, which does not necessarily indicate a higher risk of MS. Hence; incidence is a better estimate than prevalence to identify increases in population disease risk.10
1.3 Etiology MS has a complex etiology that involves both genetic and environmental factors and that both make a significant contribution to causation. The strongest increase, up to three-fold, is associated with the allele HLA-DR15. In addition, there are now 110 detected genes known to affect the risk of developing MS, each having a very weak contribution. A majority of these

15
are coding proteins important for the immune system.21 The relative contribution of the genetic factors to the risk of developing MS can be estimated from twin studies. Several environmental and life-style factors also are associated with the risk of MS. Of these, Epstein-Barr virus (EBV) infection is among the strongest.22 There is solid evidence that EBV infection is a precondition for MS. In addition, there is a dose dependent relationship between the presymptomatic level of EBV specific antibodies and the risk of MS. In a recent meta-analysis, the combined relative risk of MS for a past history of infectious mononucleosis was 2.17.23 Other risk factors are smoking, childhood obesity and vitamin D deficiency. Increased risk of MS in individuals with vitamin D deficiency, associated with low sun exposure, has been proposed to explain the strong latitude gradient in MS prevalence.24
1.4 Diagnosis A general principle for Diagnostic criteria for multiple sclerosis (MS) is evidence of lesions in CNS disseminated in space (DIS) and time (DIT). This implies more than one episode involving multiple areas of the CNS (brainstem, spinal cord or optic nerves).
Originally The Poser criteria25 were established as guidelines for use in clinical trials of MS, but these also became widely applied in clinical practice. The Poser criteria (table1) included clinical evidence that may be supported by paraclinical evidence of lesions found with evoked potential techniques, as well as laboratory supported oligoclonal bands or increased immunoglobulin G (IgG) in cerebrospinal fluid (CSF). Magnetic resonance imaging (MRI) was not included as it was only in its earliest state.
In 2001 revised diagnostic criteria for MS were published by an International Panel, the McDonald Criteria.26 In the McDonald Criteria MRI was included into the diagnosis scheme. The McDonald Criteria, using MRI, have resulted in earlier diagnosis of MS27, 28 allowing for better counseling of patients and earlier treatment. Magnetic resonance imaging (MRI) of the CNS and CSF analysis can support, supplement, or even replace some clinical criteria. These criteria, revised 200529 and 2010,30 enable patients with a single clinical episode to be diagnosed with MS. The advantage of MRI is its high reproducibility and sensitivity in detecting activity in the disease. Disease activity is more than 10-fold more frequent than clinical relapse 31

16
Category Attacks (n)
Clinical evidence (n)
Paraclinical evidence (n) **
CSF OB/lgG*
Clinically definite MS
2 2
2 1 and 1
Laboratory supported MS
2 1 or 1 +
1** 2 +
1** 1 and 1 +
Clinically probable MS
2
1**
1
2
1** 1 and 1
*Oligoclonal band or raised IgG index ** Not applied in the present study Table 1. Diagnostic criteria according to Poser25

17
1.5 Natural Course MS can follow very different patterns and the clinical course and symptoms vary widely. The natural history and natural course in MS is probably more thoroughly described than for any other chronic autoimmune disorder.32-36 There are two different active components in the symptomatology:
- An attack or relapse was defined as an episode of focal neurological disturbance lasting more than 24 hr without an alternate explanation, and with a preceding period of clinical stability lasting at least 30 days.37 It develops over days or weeks with subsequent complete or incomplete remission.
- An insidious and steadily progressive course with or without occasional relapses, minor remissions or plateaus.38
Clinically isolated syndrome
A first clinical presentation of a disease with characteristics of inflammatory demyelination that could be MS, but has not yet fulfilled criteria of dissemination in time is referred to as the 'clinically isolated syndrome’ (CIS).39, 40 CIS is an attack, which is isolated in time (monophasic), and clinically it is often also isolated in space, but may be polyfocal. Such an episode is usually the start of a relapsing-remitting course, but may be the only manifestation during a lifetime (defined as “CIS only” in this thesis). The proportion of patients with CIS reported to convert to clinically definite MS (CDMS) varies between 30 and 75%.41, 42
Radiologically isolated syndrome Recently, reports of asymptomatic individuals with subclinical findings on MRI of the brain suggestive of demyelinating lesions have been published.43 These patients were not suspected of having MS and they underwent brain MRI investigating for various other medical problems. These asymptomatic finding have been proposed to be termed ‘radiologically isolated syndrome‘(RIS). Ten of 44 of these individuals developed MS within 5 years.44

18
1.6 Subtypes of MS The disease was classified according to four different clinical subtypes (figure 1), Relapsing-remitting (RR), Secondary progressive (SP), Primary-progressive (PP) and progressive relapsing (PR).38 The SPMS course may develop after a period with RR course. Recently the International Advisory Committee on Clinical Trials of MS recommended that the term relapsing-progressive should be removed, as the term was believed to be indistinct and overlapping with other subtypes of MS.45 There is a striking difference in prognosis as expressed in time to disability between attack onset and a progressive onset.33
Figure 1. Clinical subtypes of MS according to Lublin and Reingold 1996
Relapsing-remitting About 85% of patients with multiple sclerosis have disease onset with an attack.32, 46 In relapsing-remitting MS (RRMS) the disease exhibits attacks or relapses followed by periods of recovery and stable disease.38 The attacks or relapses vary in frequency and severity, with a stable baseline between relapses. The relapse frequency was shown to decrease spontaneously with time.47 The recovery or remission can be complete or incomplete with residual symptoms. Attacks alone lead only to low or moderate levels of

19
sustained long-term disability,48 whereas the development of progressive disease is strongly associated with a worsening of all stages of disability.49, 50 Most RRMS patients have only moderate disability, and permanently disabling attacks of MS are rare.46, 51 Some experimental data have shown that inflammation may have a neuroprotective effect.52 It was recently suggested that the term, worsening, be used instead of progressing when referring to a RRMS patient whose disease is advancing due to relapses and/or incomplete relapse recovery.45 The RR phase usually carries on for several years, but eventually the majority of patients enter the secondary progressive phase (SPMS).53
Secondary progressive SPMS is characterized by a progressive course as defined.38 In most cases, SPMS is clinically diagnosed retrospectively by a history of gradual deterioration after an initial RR disease course. There are no MRI, histologic or immunologic criteria to determine the point of transition from RRMS to SPMS.45
The development of secondary progressive MS (SPMS) is a critical change in the disease course.54 Patients with SPMS have an unfavorable prognosis with an unremitting, worsening of neurological functions. The continued rate of SP was predictable from its initial phase, but unpredictable from the preceding RR disease course.32 35, 55 Once the clinical threshold of irreversible disability has been reached, the patient deterioration is not affected by relapses, either those that occur before the onset of the progressive phase or those that occur during this phase.35, 50
Primary progressive Approximately 15 % of the patients start with the insidious and steadily progressive course from onset, defined as PPMS.33, 34 In comparison to disease onset marked by an attack, primary progression begins later in life and proportionally affects more men.56, 57 In PPMS the pathophysiology is driven less by inflammatory demyelinating lesions, while axonal degeneration and cortical atrophy are more prominent.56 Some evidence suggests that PPMS represents a distinct less inflammatory disease entity.53

20
Progressive relapsing Progressive relapsing MS (PRMS) is the least common form of MS. During periods without clinical attacks the progression continues. However, the rate of progression has been found to be essentially similar in both PPMS and PRMS.32
1.7 Pathophysiology of MS The pathological features of MS are inflammation, demyelination, remyelination and neurodegeneration, occuring either focally or diffusely throughout the white and grey matter in the CNS.58 These features are present in all subtypes of MS, although they vary over time both quantitatively and qualitatively between and within the subtypes. MS is an autoimmune disease mediated by T cells, B cells, macrophages and activated microglia. Activation of auto reactive T cells in the peripheral circulation may enhance their movement across the blood-brain barrier (BBB). The T cells entering the CNS become reactivated and then form inflammatory lesions that include activated macrophages and microglia. This leads to destruction of myelin sheaths and oligodendrocytes.59
Pathogenesis of RRMS Major progress has been made in understanding disease mechanisms in RRMS. Relapses continue to occur throughout the RRMS phase due to new focal white matter lesions.60 The symptoms that occur during a relapse of MS seem to be related to slowed or blocked axonal conduction.61 Relapses are predominately driven by the inflammatory process, but in parallel, there is extensive axonal damage.62
Pathogenesis of progressive MS
Mechanisms have been suggested to explain the pathogenesis of progressive MS.63 In progressive MS, the disease is still driven by the inflammatory process, it has been demonstrated that lesions in the subpial cortical layer are abundant64 and inflammation becomes partly compartmentalized and thereby ‘trapped’ behind an intact BBB.65, 66 Reactive oxygen species (ROS), oxidative damage and the associated mitochondrial injury are suggested to
21
play an important role in the tissue degeneration. In cortical lesions there is microglial proliferation but no T-cell activation59 In progressive MS the pathology shifts from new and active white matter lesions to slow expansion of preexisting lesions. This slow expansion leads to pronounced cortical demyelination and is associated with diffuse damage throughout the normal-appearing white and grey matter.64, 67 Widespread loss of tissue volume is also seen in the normal-appearing cortex.68 Focal lesions and diffuse global changes result in extensive brain atrophy with dilatation of the ventricles. New methods including fMRI indicate that neuronal damage can initially be compensated by remyelination and neural plasticity.69 However, after several years of disease the patients have reached a threshold where functional compensation may be exhausted and continued axonal damage and loss in CNS will consequently lead to progressive neurological disability.58 While the axonal pathology of RRMS may be stationary,70 the pathology of SP includes slow expansion of pre-existing lesions, which then become sites of axonal injury. 53
1.8 Symptoms In RRMS new symptoms or the worsening of old symptoms are caused by an attack or relapse. Fluctuations in symptoms or exacerbation of symptoms with fever, heat, or infection are not considered true attacks. They are often referred to as pseudo-exacerbations.71 One example is transient blurred vision (Uhtoff's phenomenon). Typically, a pseudo- exacerbation results from an increase in body temperature. However, it can also result from exhaustion or stress. The increased body temperature may have external causes (e.g. the sun) or internal causes (e.g. fever or hormonal changes). Symptoms will subside when body temperature drops. (Wingerchuk and Rodriguez 2006)
Another type of temporary neurological symptoms is the paroxysmal attacks, frequently reported in MS. Most common among these are L´hermitte's sign, trigeminal neuralgia, paroxysmal ataxia, and seizures.72, 73 The symptoms are fleeting, lasting from seconds up to 2 minutes. Paroxysmal symptoms start abruptly and are short in length. However they can recur from a few times a day to a few times an hour. These symptoms persist for a few days up to several months, but will eventually disappear. MS is clinically characterized by a variety of impairments that may include vision problems, difficulty in walking, fatigue, weakness, spasticity, imbalance, sensory loss, pain,

22
cognitive changes, depression, and bladder or bowel dysfunction.74 Attacks commonly include optic neuritis, acute brain stem lesion with diplopia or vertigo and acute focal myelopathy. Symptoms vary from person to person and from one exacerbation to another. Cognitive impairment occurs in an estimated 30% to 70% of the patients.75 It is reported that physicians are significantly more likely than the patients to rate physical functioning and physical role limitations as important, whereas patients are significantly more likely to rate mental health and emotional role limitations as important.76
The most common presentation in PPMS is a pyramidal syndrome with progressive paraparesis. The main symptoms, commonly symmetrical, are affected mobility, with weakness, spasticity. Neuropsychological deficits are more extensive in patients with SPMS, an incidence of 7% of cognitive deficit cases in primary progressive multiple sclerosis as compared with 53% in patients with secondary progressive multiple sclerosis of similar physical disability have been described.77 The psychological functioning of the two progressive groups was compared. It was found that PPMS patients appeared to show overall better psychological functioning and were less depressed.78
1.9 Quantifying disability in MS Disability in MS is commonly quantified by using a clinician-measured scale, the Expanded Disability Status Scale (EDSS).79 The EDSS comprises 20 grades from 0 (normal) to 10 (death due to MS) progressing in a single-point step from 0–1 and in 0,5 point steps upward, and is based on the combination of functional-system scores (EDSS 0-3,5) and the patient's degree of mobility, or the degree of help in the activities related to daily living (EDSS 4-9,5). Death in MS is recorded as EDSS 10. The functional system scores measures function within individual neurological systems including pyramidal, cerebellar, brainstem, sensory, bowel and bladder, visual, and higher cerebral. The EDSS score of 6.0 refers to people with MS who requires assistance (e.g. cane, crutch or brace) to walk about 100 meters. An EDSS score of 7.0 signifies the patient is unable to walk even with aid, and is thus essentially restricted to a wheelchair.79 The EDSS scale measures disease progression predominantly by focusing on deficits in ambulation, but does not assess many of the other disease aspects that significantly impact a patient’s quality of life.
23
1.10 Natural history and prognosis of MS Information on the untreated long-term outcome of MS in terms of progression and disability is increasingly important since new but potentially hazardous therapies may radically modify the course of MS.80, 81 The course and prognosis of MS has been described in several large natural history studies. The first comprehensive description of the proportion of patients converting to the secondary progressive phase was based on a geographically defined patient material from Sweden.82 Descriptions of prognosis were based upon crude observed data only, gathered from patients who had reached the outcome criteria at the time of the survey. However, methods of case identification and follow-up have improved. Survival analysis was introduced. Patients with a primary progressive course were separated from attack onset patients.46, 55, 83 Censoring was not applied in studies using age at disability endpoints.84, 85 A recent study demonstrated the large difference in results depending on whether or not censoring was applied or not.48 Most natural history studies were geographically defined. However, a further development was the incidence cohort,33 a term coined by a group of Rochester epidemiologists to indicate follow-up of optimal population samples,86 Detailed prediction from several onset or early attacks was accomplished by using a comprehensive database,87 These cohort studies, defined by established MS criteria, are not suitable for prediction from the first attack, when the diagnosis25 is not known. The pre-conditions for survival analysis would be violated. A proposal to compensate for this was to include monophasic cases in the cohort and accept monophasic course as an outcome.35 It has been established that the rate of secondary progression is independent of the previous course.32, 35 MS was characterized as an age-dependent disease, which had a two-fold meaning: Older age at onset implies a worse prognosis, and the cumulative risk of secondary progression is independent of previous relapses. This is supported by the similar age at onset of primary and secondary progression and the similar outcome of primary progressive course and progressive-relapsing course.50

24
Age – related maximum
The relationship between age at onset, current age, and the risk of reaching SP was analyzed. The risk of secondary progression has a maximum that occurs soon after onset with higher age, but a longer time after onset in patients with a low onset age (figure 2). 87 The same relationship between age at onset and age at irreversible disability was reported in a natural history study. 84
Figure 2. Hazard function of the yearly risk of transition to SP shows an age-related maximum, Subgroups according to onset age 87
25
Demographic and clinical predictors
A limited number of demographic and clinical variables at onset have been identified to predict time from onset of MS to the onset of irreversible disability.33, 49, 88-90 However, the prognostic values of demographic and early clinical factors concerning long-term outcome varies between studies. Male sex is commonly believed to be a risk factor for poor prognosis in RRMS,35,
91-94 but the evidence is pointing in different directions.90, 95, 96 Older age at onset was reported to associate with a worse prognosis in a majority of studies.35, 91, 92, 94 Numerous studies have shown that it takes longer time to reach irreversible disability with complete recovery from the first attack.35, 75,
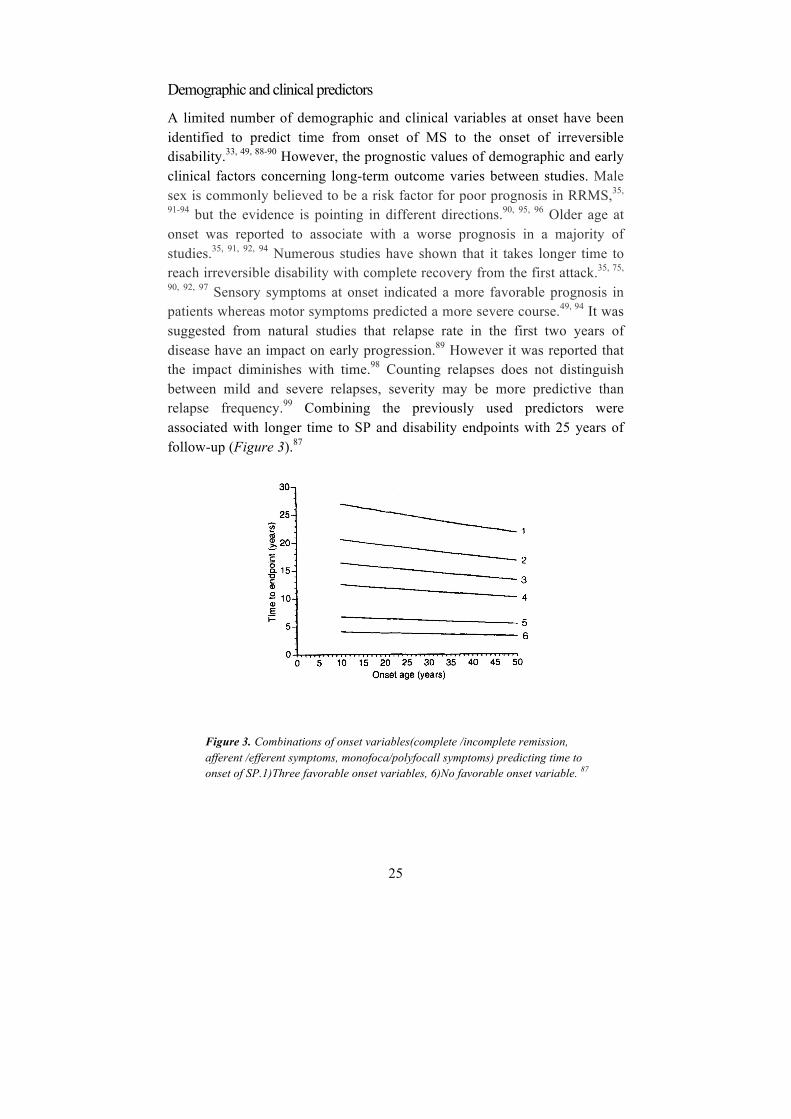
90, 92, 97 Sensory symptoms at onset indicated a more favorable prognosis in patients whereas motor symptoms predicted a more severe course.49, 94 It was suggested from natural studies that relapse rate in the first two years of disease have an impact on early progression.89 However it was reported that the impact diminishes with time.98 Counting relapses does not distinguish between mild and severe relapses, severity may be more predictive than relapse frequency.99 Combining the previously used predictors were associated with longer time to SP and disability endpoints with 25 years of follow-up (Figure 3).87
Figure 3. Combinations of onset variables(complete /incomplete remission, afferent /efferent symptoms, monofoca/polyfocall symptoms) predicting time to onset of SP.1)Three favorable onset variables, 6)No favorable onset variable. 87

26
1.11 Treatment of multiple sclerosis For most of the 20th century, multiple sclerosis was considered untreatable.100 Historically, treatment of relapses was the first approach to MS treatment in general. Since the 1950’s, treatment of exacerbations has been based on the use of Adrenocorticotropic hormone (ACTH) and corticosteroids.101 Corticosteroid therapy shortens the duration of the relapse and accelerates recovery,102 but whether the overall degree of recovery is improved, or the long-term course is altered is not known.103 Major progress has been made during the past three decades in understanding disease mechanisms in RRMS. This has led to effective anti-inflammatory and immunomodulating treatments that reduce relapse severity, relapse frequency and MRI indices of gadolinium enhancing lesions as well as T2 lesion burden.104-106 Today there are various MS treatment options available that have been shown to reduce relapse rate and to delay disease progression.107-109 It was proposed that the term “progression” due to residuals symptoms after relapses is exchanged by the term “worsening”.45 Interferon beta and glatiramer acetate have been used since the 1990’s. These medications, commonly termed first generation immunomodulating drugs or first line treatment, are all self-injection treatments and differ both in their mechanism of action and side effects. These drugs have demonstrated a relative decrease in annualized relapse rate ranging from 18-34% as well as having an impact on MRI parameters.104-106, 110 To date, the U.S Food and Drug Administration (FDA) have approved 10 disease-modifying drugs (DMD), with various routes of administration and mechanisms of action. The new medications have demonstrated an improved efficacy with 31-68% decrease in annualized relapse rate and impact on MRI parameters.111-115 These drugs are considered second-line treatment due to the improved efficacy but carry a greater risk of serious side effects. The goal of disease-modifying treatment is to reduce the early clinical and subclinical disease activity.116, 117
However, no established treatment significantly impacts the progressive course of MS. Effects seen in the progressive phase are limited to prevention of relapses.118 Therapeutic options in progressive MS, without superimposed relapses, are currently limited to symptomatic treatment and physiotherapy.53

27
1.12 Survival analysis In medical research time-to-event outcomes are common. The “event” can be death or any event of interest. The survival time starts from a defined point to the occurrence of death or another given event, referred to as the dependent variable.119 Survival analysis can be used to describe survival of a single group of patients or to compare different groups of patients and can take the form of life tables, survival curves and measures of relative risk.119, 120
Censoring
Censoring is an important issue in survival analysis, representing a particular type of missing data. Censoring is said to be present when information on time to a possible outcome event is not available for all study participants. If a patient had not suffered the event when the study was terminated, that patient is lost to follow up or drop out of the study, that patient is considered censored. After the first patient is censored the survival curve becomes an estimate. Thus, the grater the number of censored cases in a study, the less reliable is the survival curve.120 There is an important assumption that the censoring is random and non–informative. If dropout is related to outcome, censoring may bias the result.119
Kaplan-Meier
The Kaplan-Meier estimate is one of the most widely used techniques in survival analysis. It is a simple way of computing, at different points in time, the number of remaining patients and the cumulative number of events that have occurred up to that point. The Kaplan-Meier plot is a plot of the survival function against time. In the plot the two survival curves for each group of interest are produced. The plot is a step function in which the estimated survival probabilities are constant and only decreases at each event. Figure 4 and 5 shows an example of the survival of patients (fictitious data). Some survival times are censored, and these are labeled with an asterisk. The lower the curve is, the worse the survival experience is for that group. When comparing groups in a survival plot it is possible to formally test whether the difference is statistically significant. The most commonly applied method is the log-rank test. Kaplan-Meier analysis is easy to use and interpret, but the method has its limitations. Differences between groups can be seen and their

28
statistical significance can be tested, however no effect size is quantified. Where there are imbalances between groups, as are likely to occur in non-randomized studies, these cannot be adjusted for using Kaplan–Meier estimates.
Figure 4. Kaplan-Meier curve generated by SPSS from the data of 18 patients (fictitious data, p value 0.043). Note that steps occur in outcome events, but censoring does not influence the level of the curve.
Figure 5. Kaplan-Meier results generated by SPSS
Time10.008.006.004.002.00.00
Cum
Sur
viva
l
1.0
0.8
0.6
0.4
0.2
0.0
Survival Functions
1.00-censored.00-censored1.00.00
Group
KM Time BY Group /STATUS=status(1) /PRINT TABLE MEAN /PLOT SURVIVAL /TEST LOGRANK /COMPARE OVERALL POOLED.
Kaplan-Meier
Page 3
Survival Table
Group Time Status Estimate Std. Error.00 1
23456789
1.00 123456789
2.000 .00 . . 0 83.000 1.00 .875 .117 1 75.000 1.00 .750 .153 2 65.000 .00 . . 2 57.000 .00 . . 2 48.000 1.00 .563 .199 3 3
10.000 1.00 .375 .203 4 210.000 .00 . . 4 110.000 .00 . . 4 0
1.000 1.00 .889 .105 1 82.000 1.00 . . 2 72.000 1.00 .667 .157 3 63.000 1.00 .556 .166 4 54.000 1.00 .444 .166 5 45.000 1.00 .333 .157 6 36.000 1.00 .222 .139 7 28.000 1.00 .111 .105 8 1
10.000 .00 . . 8 0
Means and Medians for Survival Time
Group
Meana Median
Estimate Std. Error95% Confidence Interval
Estimate Std. Error95% Confidence Interval
Lower Bound Upper Bound Lower Bound Upper Bound.001.00Overall
8.125 1.062 6.044 10.206 10.000 2.160 5.766 14.2344.556 .944 2.705 6.406 4.000 1.491 1.078 6.9226.245 .809 4.659 7.832 6.000 1.435 3.187 8.813
a.
Overall Comparisons
Chi-Square df Sig.Log Rank (Mantel-Cox) 4.093 1 .043
Page 2

29
Multivariate analysis One important and common question in medicine is whether there is a statistical relationship between a dependent or outcome variable (Y), and independent or predictor variables (Xi). There is a need for adjusted comparison of the survival experience of the different groups that also takes confounders into account.121 Such multivariate survival models are extensively used in the medical literature. In non-randomised observational studies multivariate survival analyses have had the greatest impact.119 A multivariate model is a way to reduce imbalance between groups and confounding in observational studies. Multivariate analyses are methods that simultaneously adjust for several variables to estimate the independent effect of each one. However, they proved useful and popular, they may also be misleading since there is no limit to the amount of data that can be included in the analyses and this is condensed into very few numbers. If nothing but the adjusted results are presented in a multivariate model, as is common practice, readers have no chance of understanding why the estimates turned out as they did. It is therefore essential that the construction of multivariate models is carefully documented and presented, and that the models are plausible122 The most commonly used multivariate methods are the Cox proportional hazards model, the logistic regression model, and the linear regression model.
Cox proportional Hazard Model
The Cox Proportional hazards model123 is a commonly used method for analyzing survival time data in medical research. The model is based on the assumption of a constant relationship between the dependent variable and the independent explanatory variable, the assumption of proportional hazards. This means that the hazard functions for any two individuals at any point in time are proportional. This assumption could be tested by plotting ʹ′log-minus-log plotsʹ′ and should be reported when using Cox analysis.124 The hazard is usually denoted by h (t), and is the probability that an individual will experience an event within a small time interval, given that the individual has survived up to the beginning of that interval. The model assumes that the impact of combined significant variables is multiplicative.119 For example, if women are at twice the risk of an adverse event and if patients who are overweight are also at twice the risk, then female patients

30
who are overweight would have quadrupled the risk overall. The output from the Cox model is the Hazard Ratio (HR). The HR is an expression of the hazard or chance of events occurring in the treatment arm as a ratio of the hazard of the events occurring in the control arm. Where the HR is >1, this indicates that there is an increased risk of an event associated with that variable.
Poisson Regression
Many researchers are familiar with the Cox proportional hazards model. However, this does not allow for the fact that the predictive ability of a variable changes with time, and the model does not provide continuous hazard functions. Poisson regression is a useful alternative to the Cox proportional hazard model and has been exploited when analysing cohort survival data in various studies.125 The model provides an efficient method for dealing with cumulative time-dependent covariates. It thus allows risk to depend on multiple time scales, for example attained age, elapsed time since exposure or calendar time. In a Poisson regression analysis, estimates of a continuous hazard function are performed.126

31
2 AIMS
I. To determine the long-term prognosis of multiple sclerosis regarding the proportion of patients progressing and disabled at selected duration or age and to evaluate the predictive power of demographic and clinical onset characteristics.
II. To evaluate whether patients treated with first generation immuno-modulating drugs exhibit a longer time to the onset of secondary progression than historical controls.
III. To investigate the predictive power of characteristics associated with successive relapses and estimate the individual current risk of secondary progression at any point during the relapsing-remitting course,

32
3 PATIENTS AND METHODS
The Gothenburg Incidence Cohort The Gothenburg Incidence Cohort (GIC) is a population-based incidence cohort of 305 residents of Gothenburg with disease onset between 1950 and 1964. A prevalence study was initiated simultaneously in the same geographical area. The Department of Neurology, Sahlgrenska University Hospital was the only neurological service for the pre-defined catchment area, the city of Gothenburg (n = 400,000).33, 35, 127-131. A record of Gothenburg patients with acute optic neuritis was obtained from the Department of Ophthalmology at the Sahlgrenska University Hospital and included in the cohort. Fifty % of patients with initial RRMS were seen at onset and 72% of patients were seen within 3 years of their initial symptoms. A few patients who were ascertained during the 1970’s were included in the GIC as their onset was determined to be 1950-64. The research team consistently prioritized the requirements for an incidence cohort and accepted combined retrospective-prospective recordings. Time to the endpoints reached, secondary progression or EDSS6, did not differ between cases seen at onset and the 1950-64 onset cases who were traced and included at their second event or later.33 There was no difference between the incidence rates for patients with MS diagnosis according to Poser in the three 5-year incidence periods 1950-54, 1955-59, 1960-64, (4.3, 4.2, 4.3/100,000/year) or for “CIS only” (1.1, 1.3, 0.9/100,000/year).129 Very few patients from the incidence cohort were lost during 50 years of follow-up; censoring was mainly from death in other diseases or study termination by 2012 (Table 1, paper I). Personal follow-up examinations continued to 2012. The number of patients in the incidence cohort was 309 in previous reports from the GIC127,
131 and 305 in the present study. The diagnoses were changed in four patients, one with recurring neuromyelitis optica (NMO) confirmed at autopsy, one with polyfocal microvascular disease detected at autopsy, one with severe bilateral optic neuritis considered to be a Leber’s disease, and one with a disabling polyneuropathy (probably Charcot-Marie-Tooth’s) precluding the evaluation of a concomitant mild MS. In the GIC, 212 had an initial relapsing-remitting course and MS diagnosis according to Poser, 42 had a clinically isolated syndrome unequivocally suggestive of MS but with no further neurological disease activity. Forty-four patients had primary

33
progressive MS according to Poser. A further 7 patients with a primary progressive course not strictly fulfilling the Poser criteria were excluded for the present study (n = 298). The frequency of neurological examinations performed by the research team during this first 25-year period of follow-up was published33 The number of team examinations in 227 patients surviving year 25 was 815, in addition to routine examinations.
The Swedish Multiple Sclerosis Register The Swedish Multiple Sclerosis Register (SMSreg) (http://www.msreg.net) was established in 1996 in order to promote MS research and the quality of MS care. It was one of the national quality registries in the Swedish health and medical services (http://www.kvalitetsregister.se). This register was web-based from 2001. Basic demographic data, clinical data from onset attack, type of course, including an obligatory statement whether transition to a progressive course had occurred and year possible transition as well as relapses and treatment were registered. Notably, definitions on predictive features of the onset attack and relapses were adapted from those demonstrated in the GIC described previously. These predictors were included as four concise yes–no queries in the SMSreg user interface (Monosymptomatic optic neuritis? Pure afferent symptoms other than optic neuritis? Complete remission after one year? Monofocal symptoms?)
34
3.1 Patients included, paper I-III
Paper I: We included 212 patients with an initial relapsing-remitting course, 44 with a primary progressive course fulfilling diagnostic criteria according to Poser and 42 patients with a monophasic course after a clinically isolated syndrome were included (n=298).
Paper II: RRMS patients from the GIC with onset predictors recorded (n=186) (figure 1, paper II), and patients from the SMSreg (n=730) treated with first generation immunomodulating drugs and (onset between 1995 and 2004).
Paper III: RRMS patients from the GIC with a distinct second attack at least one calendar year before progression or censoring (n = 157) (fig1, paper III).
3.2 Study design and statistics Paper I: We conducted a 50-year longitudinal follow-up of the GIC to secondary progression or disability endpoint EDSS6, EDSSS7 or EDSS10 (death in MS) using Kaplan-Meier survival estimates and Cox multivariate analysis. Patients were followed until endpoint or censoring mainly due to death in MS or study termination by 2012. The majority of survivors (n = 43) were examined individually in the year 2012.
Paper II: We included a cohort of contemporary RRMS patients treated with first generation immunomodulators, obtained from the Swedish National MS Registry (disease onset between 1995 and 2004, n = 730) and a historical population-based incidence cohort (onset 1950–64, n = 186). We analyzed the difference in time to SP within a 12-year survival analysis, using a Kaplan-Meier and Cox regression analysis including both materials. Paper III: Data regarding predictors of all distinct attacks occurring during the RRMS phase (n = 749) and demographics from patients (N = 157) with at least one distinct second attack were included as covariates in a Poisson regression analysis with SP as outcome. The resulting hazard function from the regression analysis expressed the current risk of secondary progression and was termed prediction score (table 1, paper III). This formula calculating the prediction score was introduced into an Excel sheet and enabled calculation of individual continuous prediction of secondary progression (figure 3, paper III).
35
4 RESULTS
Paper I: Paper I: A Kaplan-Meier estimate in the attack onset patients with MS diagnosis according to Poser (n=212) showed that the median time from onset to SP was 14 years, to EDSS6 25 years, and EDSS7 48 years. The corresponding times for attack onset patients including CIS only (n=254) was 18 years to SP, 30 years to EDSS7 and more than 50 years to EDSS10.
After 50 years, 14% of the attack onset patients with MS diagnosis according to Poser remained non-progressive, 22% were progressive but ambulatory, 16% were disabled (non-ambulatory), 48% had died from MS (including 12% with a combined cause of death). Twenty-six % of the attack onset patients including CIS only remained non-progressive, 18% were progressive but ambulatory, 13% were disabled, and 42% had died from MS.
The cumulative risk of reaching EDSS6 increased to 50% at age 55 and 80% at age 80. Age at onset had no predictive power in women, while the risk of disability showed a 3 – 6% yearly increment in men. A severity score based on a cluster of previously reported clinical predictors provided hazard ratio estimates. These were in the range of 1.6-2.3 per step in the severity score (0-2) for secondary progression, EDSS6, EDSS7, and EDSS10 in women and 0.99-1.49 in men. The prognostic power of the severity score (used across 5 decades) to the disability endpoints was secondary to the risk of secondary progression. In patients who had not reached endpoint before a the cut-off point 15 years, at the mean time to secondary progression, the severity score at onset did not contribute further to the prediction (second cox analysis in figure 6).

36
Figure 6. Stratified Kaplan-Meier estimate of time to secondary progression in three subgroups according to their severity score 0, 1 or 2 in their onset attack. Two Cox regression analyses of the severity score are presented, one showing significant prediction for the first part of the follow-up, to a cut-off at the mean time to secondary progression, and one showing the absence of significance for the second part after the cut-off point. It was not possible to construct a Cox model covering the whole 50-year follow-up.
Paper II: Results: An overview of the prevalence of the different onset factors in the two cohorts showed that there was no difference in gender in the proportion of male or female patients (p = 0.245) or concerning onset age among the contemporary or historical patients (p = 0.581). We found that the proportion of patients with a complete remission after onset attack was higher in the contemporary cohort (75% vs. 68%, p=0.04). Conversely, the proportion of patients having monofocal symptomatology at onset was higher in the historical cohort (93% versus 80%, p=0.001). There was no significant difference in the proportion of patients with dominant afferent onset (63% versus 71%, p=0.149) (figure 2, paper II). When combining the clinical

37
predictors into a severity score, there was not any marked difference in the composition of the groups (table 2, paper II). After adjusting for onset features, as well as the therapy initiation time, the DMD-treated patients still exhibited a longer time to SP than the controls (Figure 7, hazard ratios: men, 0.32, p=0.002; women, 0.53, p=0.02).
Figure 7. Design of study of long-term effects of first generation DMD administrated in the relapsing-remitting phase, separating the spontaneous course from the therapy-induced deviation. DMD are known to reduce the relapse rate. Onset predictors evaluated the severity of the spontaneous course. The treatment effect was evaluated by the postponement of the transition to secondary progression in treated patients compared with the historical controls, adjusted for severity by the predictors from onset.
Paper III: During the 50-year follow-up, 118/157 patients showed transition to SP. The isolated age-dependent hazard function for SP showed a maximum at around 30 years. After testing several potential predictors in the Poisson regression analysis, significant prediction of SP was obtained with a model including only current age, the severity grade of the most recent relapse, and the time passed since that relapse. The hazard function calculated from this model was termed the ”MS prediction score”. When a relapse with a high severity grade occurred, the MS prediction score increased abruptly, while a high score decreased in the event of a relapse with low severity.

38
This allowed a convenient identification of patients with periods of high (>15%) to low (<0.1%) risk of secondary progression. This algorithm is now web-based (http://msprediction.com) and may be used for stratification of patients in future studies (figure 8).
Figure 8. Web-based tool for identification of patients with high and low risk of secondary progression. Individual data on age, and time and features of the most recent relapse are entered. An estimate of the individual current risk of SP will be displayed. (http://msprediction.com)

39
5 DISCUSSION
5.1 Qualities of the patient materials
Gothenburg Incidence Cohort
The original ”incidence cohort” was based on a strictly defined epidemio-logical area, Olmsted County (approximately 150,000 inhabitants) where more than 99% of inhabitants consented to their hospital records being used for research. The concept ”incidence cohort” indicated a material that is both strictly population-based and temporally defined. It facilitates reproducible designs. It was coined by a group of epidemiologists at the Mayo clinic, presenting a number of such studies in several disorders, including optic neuritis.86, 132. This theoretically is an optimal way of creating a representative sample of a population.133, 134
One main asset of the present 50-year follow-up study is its pre-defined incidence cohort basis, residents of Gothenburg with onset of MS 1950-64. The GIC is a prospectively defined epidemiological material rather than a clinic-based material. Without the temporal definition there is a risk of bias from convenience sampling.135 Outcomes may be extremely variable depending on the mode of recruitment. Convenience sampling from hospital patient series may result in loss of extremely mild and severe cases.136 On the other hand, there will be less recruitment bias in an incidence cohort, considered to be the most representative type of patient material fulfilling recently proposed requirements for historical cohorts.137 The GIC ascertained 254 (study I) patients with acute onset including 42 patients with CIS and no further symptoms and a subset (n = 212) adhering to the Poser criteria.25 A weakness when prediction is based on onset patients with MS diagnosis according to Poser is that prediction from CIS (when the MS diagnosis is not yet established) violates the preconditions for survival analysis by including outcome data in the predictors. Thus, the estimated survival time to outcome typically tends to be too short, as mentioned in 1.10. All classical natural history studies are subject to this criticism.33, 97, 138 One way of counteracting this fallacy is to use a patient material which includes both CIS only and RRMS with MS diagnosis according to Poser (n = 254), and consider “CIS

40
only” as one of the possible outcomes.35 However, the diagnostic reliability will probably be slightly less in CIS only patients, and the “CIS only” material may be less complete without the safeguard of retrospective case ascertainment. We proceeded with two variants of the cohort, one corresponding to the classical natural history studies and one including the monophasic “CIS only” patients. We believed that this would approach the contemporary situation where 50-70% of patients with CIS have asymptomatic MRI findings (unavailable in the present study),139 and tend to be diagnosed as MS according to the McDonald criteria. As both these strategies have advantages and drawbacks we included both strategies (n=212 and n=254) in this study. However we used the n=254 subset for prediction and the n=212 subset for comparability with other CDMS materials.
The material from the Swedish MS register (SMSreg) The contemporary cohort from the Swedish MS registry was not strictly population-based. We gave priority to the quality requirement, that the treating neurologist signed each patient record individually. The national SMSR covered approximately 58% of patients during the present incidence period. Only 17 out of the 38 centers, including Gothenburg, agreed to provide us with individually reviewed and signed data. Our final sample was representative of the SMSR data, in terms of the gender ratio and age. The signature requirement was aimed to ensure that the primary outcome parameter, transition to SP, was correct. Thereby, the data quality was equivalent to that of a randomized trial; however, as it favored the recruitment of patients with complete information, there was likely to be a “data density bias” that may have led to the loss of general representative-ness. This type of bias is not uncommon in registry studies. For instance, many studies require a certain number of EDSS records for inclusion. Also, they may assign the day of a visit as the day of disability onset.140-142 During the recruitment period indication for treatment with first generation DMD there was an official requirement for at least two relapses during the preceding two years. Hence, the material from the SMS was a sample of relatively active patients.

41
SP as outcome variable We selected SP as an effective dependent (outcome) variable, with its main asset being that it is, in itself, a determinant of the subsequent disease course.143, 144 That immunohistological (introduction 1.7) changes occur with SP is a further argument for selecting it as an endpoint. However, this transition is probably not sudden, and its timing remains unknown. Our present findings may support the notion that high activity during a relatively short pre-transitional phase is of importance for the transition to the progressive phase. We used the first functional system affected to indicate the onset of SP. In a few cases this was some years prior to the onset of SP in the motor system, commonly used to indicate SP.
5.2 Descriptions of the Natural Course and Prognosis
Towards a consensus on the natural history of MS The median time from onset to EDSS6 in the present study (paper I), 30 years, which is longer than that reported in a cohort first presented in 1989 (18 years).46 The delay to the disability endpoints in the present study was similar to those found in a recent Canadian study. In their cohort, the disability progression in MS was found to be slower than previously reported; with 27.9 years to EDSS6.145 Thus we seem to be closer to a consensus on the long-term prognosis of MS.
Demographic and Clinical Onset predictors
Age It has been proposed that MS is an age-dependent disease.32 This statement seems to have a two-fold meaning. a) Lower age at onset is a predictor of longer time to disability; b) The risk of being disabled is associated with increasing age, partially counteracting the effect of age at onset. Studies of the age at transition to secondary progression did not identify any clinical onset predictors beyond gender and age at onset.145-147 Furthermore, the rate of secondary progression or the course after EDSS4 is independent of the individual antecedent clinical course. SP will usually have started at EDSS 4,
42
although insidious progression may start at a lower EDSS level, particularly in single attack progressive cases. While the data on the independence of the progression rate from the previous course are robust,35 the data on age at onset of SP may be described by using different models. Two large materials used a distribution estimate. The median age at transition to SP was reported to be between 50 and 60 years of age85 or 38 years.32 One recent study reported age-related disability outcomes with or without censored cases. At age 75, 98% of cases had reached SP ignoring the censored patients, or 62% with censored cases taken into consideration.48 Censoring was not reported in detail; however, this seems to be the most favourable long-term time to SP reported. In our study the median age at SP using distribution estimates was approximately 42 years. Using survival analysis (including censored cases), 80-90% (depending on the mode of censoring) had reached SP at 75 years of age. Thus, the prognosis was slightly more favourable than in the previous studies. Gender Females were often described as having a more favourable MS prognosis than men. However, concerning long-term prognosis, a study using stratification of the course revealed that the difference in outcome was mainly due to a higher proportion of males with primary progressive course, while no significant gender difference was found among RRMS onset patients.33 In the present study, gender was not an independent predictor; however, it had an impact through an important interaction. Age at onset did not influence the outcome in women in general but it did in men: The younger men had a better prognosis regarding risk of SP than younger women, while men with later onset had a clearly worse outcome.
Initial relapse frequency In a large natural history study, the first two years was predictive of subsequent disability milestones, whereas, the attack frequency from the third year after onset had a reverse effect.46 A “Window of opportunity” of therapy by reducing the initial relapse frequency was discussed. But the idea of delaying the development of disability was discouraged due to the lack of predictive capacity of the total (year 0-5) relapse frequency.89 A higher relapse frequency was reported in female RRMS patients.148 In studies from the GIC, no predictive power was demonstrated from the attack frequency as

43
a continuous variable during the first 5-year period,33 while a small subgroup with a very high attack frequency had a worse prognosis.35 Early relapse frequency was not included as a predictor in the present study as we expected complex interactions with severity score and gender would be expected.
The cluster of clinical onset predictors The fact that the predictive capacity of the severity score is stronger than its three separate components may, hypothetically, be related to the neuroanatomical concept of ”safety factor”. This is an expression of the fact that in most functional systems the number of neuron channels is higher than critically needed for normal function. A handful of casuistic reports suggested that this redundancy is greater in motor systems,149 although this relationship was found to be more complex in an experimental study.150 However, a safety factor was essentially absent in the visual system.151 Therefore, the unfavourable parameters of the score may indicate a larger lesion. In addition, variation in synaptic plasticity may underlie different capacity for restitution.152 This may explain a negative association between remission and age found in the present study.
5.3 Strategies for prediction
The range of prediction
Relapses within the first 10-years increase the risk of EDSS6 over the short term (first 10 years from onset). While, the long-term impact (more than 10 years from onset) was minimal either for early or late relapses.98 However their comparison with patients without relapses provides limited information. We found that age at onset was a significant 50-year predictor for the transition to SP for a much longer range, throughout the 50-year follow-up, although with a relative limitation: If SP had not occurred on average 15 years after onset, the onset characteristics did not provide any further predictive information. Similarly, in the case of the 50-year predictive power of the combined onset characteristics, the severity score had a similar limitation: if endpoint or censoring had not occurred before 15 years for SP (figure 4), 25 years for EDSS6, 30 years for EDSS 7, and 35 years for

44
EDSS10, - cut-off points selected as the average time to outcomes – no further predictive information was added.
A novel strategy for prediction
We recorded a moderate predictive effect of a series of demographic and clinical characteristics from the clinically isolated syndrome (CIS), from CDMS onset, or from a point in the course approximately 5 years after onset.33, 35, 153 Although confirmed in studies of varying length,154, 155 there is no general consensus on the power of these predictors. Several tools, to assist clinicians and patients, have been developed in recent years. 156-158 A web-based tool for personalized prediction of long-term disease course called “the Evidence-Based Decision Support Tool in Multiple Sclerosis” provides long-term predictions based on the data from a large natural history cohort; it used disease course, age at first MS symptom, number of attacks in the first 2 years, first inter-attack interval and/or time to EDSS 3 as predictors and transition to secondary progression or EDSS milestones as end-points. Its prediction had the same range of precision as prediction by neurology specialists, although more consistent.159, 160 Recently Veloso proposed an web-based decision tool, where results of longitudinal studies157, 161, 162 were combined with previous natural history studies and disease prognostic factors, in order to provide clinicians with an easy to use tool concerning individual long term disability prediction and individual treatment effect. Age at onset, gender, disease duration, symptoms at onset, MRI at baseline, EDSS at year one, number of mild and severe relapses during the first two years year one are recorded. Outcome is risk of SP after 10, 20 years and later. This tool does not provide any continuous prediction.158
The present study (paper III) is the first to show that a few clinical characteristics readily available throughout the course are strong and independent predictors. This needs to be confirmed in another patient cohort. An unexpected observation was that mild attacks during periods with high baseline risk (evaluated from age and attack history) reduced the immediate risk of SP, a finding that may seem counterintuitive. Although the specific immunopathological background remains to be clarified, it is known that the

45
recurrent process of inflammation with BBB damage also induces anti-inflammatory and reparative processes.163
Recently, a more effective strategy was implemented in other areas of medicine where continuous prediction was based on repeated assessments. This method has been extensively applied for evaluation of the risk of hip fracture, and for the time relationship between a hyperglycemia indicator and subsequent diabetic retinopathy.164-166 The Fracture Risk Assessment Tool, a web-based algorithm that gives repeated estimates of the 10-year probability of major osteoporotic fractures, has reached world-wide application.167
In the present study (paper III) we found that prognosis based on classical predictors was far more powerful when they were repeatedly ascertained during the course, when they were derived from onset attack. After testing a number of conceivable predictors we found that a score based on only three characteristics had independent predictive capacity: current individual age, a descriptor of the severity of the most recent attack, and the time elapsed since that attack. These three pieces of information were combined to determine the continuous hazard function for transition to SP, termed the “prediction score”. This function had a clinically relevant distribution scale with a significant proportion of patient time even at the extremes of the scale, <0.01 or > 0.15 transition events per patient year. Thus, the prognostic information beyond the average of 0.046 yearly SP events for the total present material is clinically meaningful, providing the momentary risk (events per time unit). Previous studies on prediction in MS (including paper I and II) used the Cox proportional hazards model.35, 46, 97 However, this does not allow the predictive ability of variables to describe a maximum of the age related hazard; it only provides hazard ratios, not continuous hazard functions, and ratios are not very useful for advice to individual patients. The continuous hazard functions estimated by the Poisson regression models used here are responsive to both positive and negative prognostic indicators.
Application of the prediction score
The prediction score wizard could help to evaluate the risk of SP in untreated patients and, possibly with some re-calculation of parameters in another material, also in DMD treated patients. It is not excluded that near-significant

46
factors (gender) in the present analysis should be included in future application of the prediction score.
In treating RRMS, one strategy is to start with induction therapy. Another is to wait until escalation or induction is indicated by certain criteria 168. In the latter scenario, a modified prediction score may standardize the indication for induction therapy, defining periods of high risk of progressive deterioration. Furthermore, the prediction score can be used to adjust for imbalances in non-randomized trials. It could be used as a tool to assess statistical power of in register studies. Using the prediction score, a trial will achieve the same statistical power (80%) with patients selected for a moderately high risk of progression (>0.1 onset events per year) as with twice the number of unselected patients (Table 3, paper III).
5.4 Observational studies of therapeutic effects
Disease-modifying drugs (DMD) have shown short-term efficacy in RRMS in RCTs 104-106, 110, however they did not show any efficacy in SPMS. It has not been proven whether they can reduce the risk of onset of SP. Evidence-based medicine classified different types of studies into grades of evidence 169. Well-designed and properly executed randomized controlled trials (RCTs) provide the most reliable evidence on the efficacy of healthcare interventions.170 Establishing the long-term benefit of treatment has been challenging.171, 172 Observational studies, including cohort and case-control, fall into intermediate levels.173 Proper randomization reduces selection bias at trial entry, balancing both known and unknown prognostic factors, and is the crucial component of high quality RCTs.174 However, RCTs have defined groups of patients based on certain inclusion and exclusion criteria, and may have limited generalizability. In general RCTs are not equipped for evaluating long-term effects of treatment in chronic diseases such as MS. It is unrealistic to expect that any randomized trial in MS will ever be performed to evaluate the long-term capacity of immunomodulating therapy to prevent SP. The secondary progression is an important event but difficult to observe with RCTs.175 It is not ethical or realistic to continue a placebo arm when the treatment have demonstrated short-term efficacy. Moreover many patients will not consent and clinicians will not recommend that patients undergo a

47
prolonged placebo-exposure in this circumstance.172 Despite methodological challenges, non-randomized observational study-design are still required in evaluating long-term treatment for several reasons.176
Long-term follow up studies
Several long-term follow-up (LTFU) studies were conducted in direct continuation of the RCTs of first generation DMDs. These LTFUs reported clinical benefits of long-term treatment,107, 108 however there was considerable loss of patients in these studies. A variant of LTFU took advantage of the conventional 2-year time lag before the onset of active therapy in the placebo group in an RCT. This design revealed a superior outcome in the group with early treatment.109, 172
Several studies using propensity score, a method designed to compensate for differences in subgroups in non-randomized studies, have demonstrated long-term effects of first generation DMDs.172, 177, 178 Whether the propensity score has any significance depends on its predictive capacity.179 Moreover, the pre-treatment segments of the treated patients should be included in the untreated group to avoid immortal time bias.180 At variance with these results, a study based on a large database in British Columbia found that interferon beta therapy during a 5-year period provides no significant effect on the time to reach EDSS6 (walking with a cane). They found an unfavorable course in their treated patients, as compared to a contemporary untreated one, with a HR = 1.30; however, the authors acknowledge that this could result from an indication bias. However, the findings in the historical cohort showed a tendency in the same direction as our historical cohort, with a nearly significant period effect (HR = 0.77; CI 0.58–1.02)140 in the same direction as our “period effect” (HR of 0.32 men and 0.53 women). The difference in magnitude of the HR may depend on the ability of adjustment. We had the availability of a database with more detailed predictors. It was not possible to completely disentangle the therapeutic effect from other factors, including the admixture of mild cases; however, we observed this difference between treated and historical control patients over the entire severity spectrum, and this was related to the treatment initiation time. The effect was so large that the possible inclusion of mild cases would need to be of the same magnitude as the total historical cohort.

48
The use of historical controls
In observational studies using historical controls measuring treatment efficacy in MS is complicated by the fact that some factors appear to change and be unstable over time.181 Biases could arise as a result of changes in care of patients over time, differences in inclusion and exclusion criteria, confounding environmental factors, or the evolution of diagnosing diseases. However, we are not aware of any essential difference in the care of patients with light to moderate neurological deficit at the Sahlgrenska University Hospital during the last decades, at least no changes that could influence the deficit.
Several studies found that the course in contemporary patients is becoming milder.20, 182, 183 However our inclusion criteria for our treated patients were determined by the official indication for immunomodulating therapy, which was at least two relapses over the last two years, indicating patients with a rather active disease.
Changes in the criteria can produce spurious improvements in stage-specific prognosis, even though the outcome of individual patients has not changed. This ‘stage migration’ is commonly referred to as ‘Will Rogers Phenomenon’. For example, when new diagnostic imaging procedures demonstrated metastases that had formerly been silent and unidentified, this improved the prognosis both in cases with localized cancer and in cases with metastases and thus resulted in a stage migration.184 The switch in diagnostic criteria between the Poser and McDonald criteria in the early 2000s made an earlier diagnosis possible and can be the potential for bias when using historical controls.185 The “Will Rogers phenomenon” is considered one of the most important biases limiting the possibility of using historical control groups in experimental treatment trials. Such a bias can only be avoided if the diagnostic criteria to be used in the new trial are strictly the same as those used for the historical controls in the original trials.181 This source of bias is not relevant for the present study as both treated and historical controls in our study were defined by the Poser criteria (paper II). Furthermore the definitions secondary progression and clinical predictors were uniform as these definitions were adopted into SMS from the GIC.186
49
It was further stated that to avoid or reduce susceptibility bias in observational studies, adjustment for baseline differences is important.187 It will never be possible in an observational study to obtain the same degree of evidence as in an RCT. Rather it is a question of how well an adjustment between treated and historical controls was performed. In the present study (paper II) we analyzed the difference in time to SP between a contemporary cohort treated with first generation DMDs and historical controls derived from the GIC. We included all the available covariates in the Cox proportional hazards analysis. All covariates used were demonstrated in the GIC.33 The onset covariate for complete remission of the onset attack was amply confirmed in other studies.97, 141, 155, 188, 189
The aim of including those factors into the models was to adjust for imbalances in severity and prognosis. Our adjustment makes the two populations more comparable. There was only a moderate difference between the GIC and SMSreg materials as evaluated from the onset predictors (Figure 2, paper II). This argued against the explanation that longer time to SP was due to inclusion of more benign cases. There was no trend toward a more benign disease course in the successive three 5-year periods of the GIC: 1950–1954, 1955–1959 and 1960–1964.33 No change occurred in the prognosis between two prevalence materials from 1991–2000,190 and no change occurred in the long-term course, with onset between 1975–1995 in British Columbia, Canada.141 Thus, these three studies provided no evidence for a gradual, spontaneous change of MS disease towards a more benign symptomatology or trajectory during the decades before the advent of DMMs. However, the incidence in recent epidemiological studies in Sweden was higher, 6.4/100,000/year,191 than previously reported from the Gothenburg area, 5.3/100,000/year.192 Recently even higher figures were reported, 2001 to 2008 the incidence was estimated at 10.2 per 100,000.19
The patient characteristics behind this increase in prevalence are not clear. Probable factors are the changed diagnostic criteria, increased survival, greater awareness of possibility of treatment and detection of atypical cases by MRI. It is uncertain how much the increased prevalence and incidence influences the course of the patients in this study. Probably the patients receiving the first generation DMD during the first years when these drugs were available were typical cases with distinct focal neurological symptoms.
50
One caveat is the diminishing mortality in MS (and in other disorders), which have, very probably, reduced the proportion reaching EDSS10 today compared with the proportion presented in this study. A study from the Danish MS register showed that the total mortality (MS and non-MS) diminished significantly over successive decades,193 probably due to progress in a wide sector of health care.. We have not been able to find any reports describing this change in MS specific mortality. It is in the category >EDSS7 that we have seen the most dramatic advances in MS health care, spearheaded by the percutaneous endoscopic gastrostomy and the low-friction bladder catheter. Neurorehabilitation could improve motor, cognitive and other performance although without changing the EDSS level.194 We therefore contend that the relationships we found between the disability categories below EDSS7 are not validated by these long-range health care changes. Concerning confounding environmental factors, such as smoking and D-vitamin deficiency, they were too incomplete to be included in this study.

51
6 CONCLUSION The course of MS is extremely variable and capricious, and it has been questioned whether it is at all possible to provide any prognosis. However, using a unique resource, an incidence cohort with 50 years of longitudinal follow-up, we found that the median time from an onset attack to secondary progression was 18 years, to the disability step EDSS6 30 years, and to EDSS7 > 50 years, which should be close to consensus data, based on our untreated, longitudinally followed incidence material (n = 298). These intervals were in agreement with a recent trend in long-term follow-up studies. MS was called an ”age-dependent” disease, disapproving any prediction. However, we observed that the time to disability milestones was indeed predictable over a 50 year period from characteristics of the onset attack with a significant hazard ratio about 2 per step (0 – 2) in an severity score based on characteristics of the onset attack. This long-term prediction was secondary to forecasting the onset of secondary prediction, itself a powerful predictor. The prediction from this score was more effective in women.
Moreover, we exploited the incidence cohort in an innovative approach, using its large array of predictors to calculate the current, continuous risk of transition to secondary progression. Contrary to conventional thinking, relapses later during the course were more predictive that the onset attack. The average risk was 4.5% per year; we constructed an algorithm able to predict the current individual risk within the range 0.1- 15% events per year. This algorithm, based on the patient’s age, and predictors from the last relapse, was incorporated in a web-based predictive tool. “A window of opportunity“ was previously described, implicating that relapse frequency during the first two years from onset only was predictive, suggesting that the anti-inflammatory therapy would be effective only during this short initial period. However our prediction of SP from later relapses suggests that this “window of opportunity” extends through the whole RR phase.
Finally, we investigated the long-term effect of first generation immunomodulators with a novel strategy, using the difference in onset predictors between treated and historical control patients as independent variable and the subsequent course as dependent variable in a Cox regression

52
analysis. We found that patients treated with these disease modifying drugs exhibited a longer time to secondary progression than the historical controls, with a hazard ratio of 0.32 in men and 0.53 in women. If confirmed, this therapeutic effect may be stronger for second-generation immunomodulators. This result may be substantiated in register studies and therapeutic trials, adjusting for the current, continuous risk rather than for risk based on onset predictors.

53
7 FUTURE PERSPECTIVES
Validation and application of the prediction score The results are limited by the moderate size of the cohort, although the information content in the database is unique. In the absence of confirmation, the risk of data over-fitting cannot be excluded, even in a study with a small number of predictors like the present.195 However, our relatively large numbers of end-points (118) and attacks (749) reduce this risk (paper III). Our findings encourage further investigation and replication in an independent patient cohort. The next step will be validation in another untreated material.
Thereafter, the prediction score can be used to adjust for severity of the spontaneous course in register studies of long-term therapeutic effects. In such studies novel outcome parameters like transition to SP could be applied.

54
ACKNOWLEDGEMENT I would like to express my deepest gratitude to everyone who has contributed to this thesis. Special thanks to:
Oluf Andersen, my mentor and friend; It has been a long and evolving journey. I will always be grateful for your guidance and patience. Thank you for always being available and giving me endless support. Your extensive wisdom and knowledge is invaluable.
Jan Lycke, for all your advice and support. I admire your great productive-ness and thoroughness. Your feedback was always quick and helpful.
Bengt Skoog and Björn Runmarker, for great collaboration and sharing your experience and knowledge. Your dedicated work with the follow-up of the patients in the Gothenburg Incidence cohort is admirable.
Olle Nerman and Vera Lisovskaja, for interesting discussions, and valuable help with statistics and manuscripts. I am grateful for your enthusiasm trying to teach me.
Thank you Anders Odén for helping me and sharing your skills in the complex subject of statistics.
Thanks to Ann Wittfeldt Gan for endless support and guidance. With coffee and candy everything is possible. You mean much to me!
All colleagues at Gröna stråket 11, I enjoyed your company and interesting discussions about everything under the sun.
All MS patients participating in these studies, I could never have done this without your cooperation.
Above all, thanks to all my dear friends and my beloved family:
Mom and Dad, thank you for your unconditional support and always being there for me.
Daniel, I could not have done it without you. Thank you for always standing by me. Stella and Jack, you are the sunshine in my life!

55
REFERENCES 1. Pearce JM. Historical descriptions of multiple sclerosis. European
neurology. 2005; 54: 49-53. 2. Clanet M. Jean-Martin Charcot. 1825 to 1893. International MS
journal / MS Forum. 2008; 15: 59-61. 3. Kabat EA, Moore DH and Landow H. An Electrophoretic Study
of the Protein Components in Cerebrospinal Fluid and Their Relationship to the Serum Proteins. The Journal of clinical investigation. 1942; 21: 571-7.
4. Kinnunen E, Koskenvuo M, Kaprio J and Aho K. Multiple sclerosis in a nationwide series of twins. Neurology. 1987; 37: 1627-9.
5. Mackay RP and Myrianthopoulos NC. Multiple sclerosis in twins and their relatives. Archives of neurology. 1966; 15: 449-62.
6. Ebers GC, Bulman DE, Sadovnick AD, et al. A population-based study of multiple sclerosis in twins. The New England journal of medicine. 1986; 315: 1638-42.
7. Ebers GC. Environmental factors and multiple sclerosis. The Lancet Neurology. 2008; 7: 268-77.
8. Pugliatti M, Sotgiu S and Rosati G. The worldwide prevalence of multiple sclerosis. Clinical neurology and neurosurgery. 2002; 104: 182-91.
9. Kurtzke JF, Beebe GW and Norman JE, Jr. Epidemiology of multiple sclerosis in U.S. veterans: 1. Race, sex, and geographic distribution. Neurology. 1979; 29: 1228-35.
10. Koch-Henriksen N and Sorensen PS. The changing demographic pattern of multiple sclerosis epidemiology. The Lancet Neurology. 2010; 9: 520-32.
11. Kurtzke JF. Epidemiology of multiple sclerosis. Does this really point toward an etiology? Lectio Doctoralis. Neurol Sci. 2000; 21: 383-403.
12. Kurtzke JF. Multiple sclerosis in time and space--geographic clues to cause. Journal of neurovirology. 2000; 6 Suppl 2: S134-40.
13. Kingwell E, Marriott JJ, Jette N, et al. Incidence and prevalence of multiple sclerosis in Europe: a systematic review. BMC neurology. 2013; 13: 128.
14. Ahlgren C, Oden A and Lycke J. High nationwide prevalence of multiple sclerosis in Sweden. Mult Scler. 2011; 17: 901-8.
15. Kurland LT. Epidemiologic characteristics of multiple sclerosis. Am J Med. 1952; 12: 561-71.
56
16. Wynn DR, Rodriguez M, O'Fallon WM and Kurland LT. A r eappraisal of the epidemiology of multiple sclerosis in Olmsted County, Minnesota. Neurology. 1990; 40: 780-6.
17. Trojano M, Lucchese G, Graziano G, et al. Geographical variations in sex ratio trends over time in multiple sclerosis. PloS one. 2012; 7: e48078.
18. Alonso A and Hernan MA. Temporal trends in the incidence of multiple sclerosis: a systematic review. Neurology. 2008; 71: 129-35.
19. Ahlgren C, Oden A and Lycke J. High nationwide incidence of multiple sclerosis in sweden. PloS one. 2014; 9: e108599.
20. Kister I, Chamot E, Bacon JH, Cutter G and Herbert J. Trend f or decreasing Multiple Sclerosis Severity Scores (MSSS) with increasing calendar year of enrollment into the New York State Multiple Sclerosis Consortium. Mult Scler. 2011; 17: 725-33.
21. Beecham AH, Patsopoulos NA, Xifara DK, et al. Analysis of immune-related loci identifies 48 new susceptibility variants for multiple sclerosis. Nature genetics. 2013; 45: 1353-60.
22. Jons D, Sundstrom P and Andersen O. Targeting Epstein-Barr virus infection as an intervention against multiple sclerosis. Acta neurologica Scandinavica. 2014.
23. Handel AE, Williamson AJ, Disanto G, Handunnetthi L, Giovannoni G and Ramagopalan SV. An updated meta-analysis of risk of multiple sclerosis following infectious mononucleosis. PloS one. 2010; 5.
24. Ascherio A. Environmental factors in multiple sclerosis. Expert review of neurotherapeutics. 2013; 13: 3-9.
25. Poser CM, Paty DW, Scheinberg L, et al. New diagnostic criteria for multiple sclerosis: guidelines for research protocols. Annals of neurology. 1983; 13: 227-31.
26. McDonald WI, Compston A, Edan G, et al. Recommended diagnostic criteria for multiple sclerosis: guidelines from the International Panel on the diagnosis of multiple sclerosis. Annals of neurology. 2001; 50: 121-7.
27. Tintore M, Rovira A, Rio J, et al. New diagnostic criteria for multiple sclerosis: application in first demyelinating episode. Neurology. 2003; 60: 27-30.
28. MRI predictors of early conversion to clinically definite MS in the CHAMPS placebo group. Neurology. 2002; 59: 998-1005.
29. Polman CH, Reingold SC, Edan G, et al. Diagnostic criteria for multiple sclerosis: 2005 revisions to the "McDonald Criteria". Annals of neurology. 2005; 58: 840-6.
30. Polman CH, Reingold SC, Banwell B, et al. Diagnostic criteria for multiple sclerosis: 2010 revisions to the McDonald criteria. Annals of neurology. 2011; 69: 292-302.

57
31. Miller DH, Grossman RI, Reingold SC and McFarland HF. The role of magnetic resonance techniques in understanding and managing multiple sclerosis. Brain : a journal of neurology. 1998; 121 ( Pt 1): 3-24.
32. Confavreux C and Vukusic S. Natural history of multiple sclerosis: a unifying concept. Brain : a journal of neurology. 2006; 129: 606-16.
33. Runmarker B and Andersen O. Prognostic factors in a multiple sclerosis incidence cohort with twenty-five years of follow-up. Brain : a journal of neurology. 1993; 116 ( Pt 1): 117-34.
34. Weinshenker BG, Bass B, Rice GP, et al. The natural history of multiple sclerosis: a geographically based study. 1. Clinical course and disability. Brain. 1989; 112 ( Pt 1): 133-46.
35. Eriksson M, Andersen O and Runmarker B. Long-term follow up of patients with clinically isolated syndromes, relapsing-remitting and secondary progressive multiple sclerosis. Mult Scler. 2003; 9: 260-74.
36. Miller DH, Hornabrook RW and Purdie G. The natural history of multiple sclerosis: a regional study with some longitudinal data. Journal of neurology, neurosurgery, and psychiatry. 1992; 55: 341-6.
37. Schumacker GA, Beebe G, Kibler RF, et al. Problems of Experimental Trials of Therapy in Multiple Sclerosis: Report by the Panel on the Evaluation of Experimental Trials of Therapy in Multiple Sclerosis. Annals of the New York Academy of Sciences. 1965; 122: 552-68.
38. Lublin FD and Reingold SC. Defining the clinical course of multiple sclerosis: results of an international survey. National Multiple Sclerosis Society (USA) Advisory Committee on Clinical Trials of New Agents in Multiple Sclerosis. Neurology. 1996; 46: 907-11.
39. Tintore M, Rovira A, Martinez MJ, et al. Isolated demyelinating syndromes: comparison of different MR imaging criteria to predict conversion to clinically definite multiple sclerosis. AJNR American journal of neuroradiology. 2000; 21: 702-6.
40. Barkhof F, Filippi M, Miller DH, et al. Comparison of MRI criteria at first presentation to predict conversion to clinically definite multiple sclerosis. Brain. 1997; 120 ( Pt 11): 2059-69.
41. Miller D, Barkhof F, Montalban X, Thompson A and Filippi M. Clinically isolated syndromes suggestive of multiple sclerosis, part I: natural history, pathogenesis, diagnosis, and prognosis. The Lancet Neurology. 2005; 4: 281-8.

58
42. Nilsson P, Larsson EM, Maly-Sundgren P, Perfekt R and Sandberg-Wollheim M. Predicting the outcome of optic neuritis: evaluation of risk factors after 30 years of follow-up. J Neurol. 2005; 252: 396-402.
43. Lebrun C, Bensa C, Debouverie M, et al. Unexpected multiple sclerosis: follow-up of 30 patients with magnetic resonance imaging and clinical conversion profile. Journal of neurology, neurosurgery, and psychiatry. 2008; 79: 195-8.
44. Okuda DT, Mowry EM, Beheshtian A, et al. Incidental MRI anomalies suggestive of multiple sclerosis: the radiologically isolated syndrome. Neurology. 2009; 72: 800-5.
45. Lublin FD, Reingold SC, Cohen JA, et al. Defining the clinical course of multiple sclerosis: the 2013 revisions. Neurology. 2014; 83: 278-86.
46. Scalfari A, Neuhaus A, Degenhardt A, et al. The natural history of multiple sclerosis: a geographically based study 10: relapses and long-term disability. Brain. 2010; 133: 1914-29.
47. Ladd HW, Lacaille JC, O'Riain D and Broman H. Evaluation and prediction of regenerative processes by quantitative analysis of the electromyographic response and biofeedback in peripheral nerve injuries. International rehabilitation medicine. 1981; 3: 201-5.
48. Tutuncu M, Tang J, Zeid NA, et al. Onset of progressive phase is an age-dependent clinical milestone in multiple sclerosis. Mult Scler. 2013; 19: 188-98.
49. Weinshenker BG, Rice GP, Noseworthy JH, Carriere W, Baskerville J and Ebers GC. The natural history of multiple sclerosis: a geographically based study. 3. Multivariate analysis of predictive factors and models of outcome. Brain : a journal of neurology. 1991; 114 ( Pt 2): 1045-56.
50. Confavreux C, Vukusic S, Moreau T and Adeleine P. Relapses and progression of disability in multiple sclerosis. The New England journal of medicine. 2000; 343: 1430-8.
51. Bejaoui K and Rolak LA. What is the risk of permanent disability from a multiple sclerosis relapse? Neurology. 2010; 74: 900-2.
52. Hohlfeld R, Kerschensteiner M, Stadelmann C, Lassmann H and Wekerle H. The neuroprotective effect of inflammation: implications for the therapy of multiple sclerosis. Journal of neuroimmunology. 2000; 107: 161-6.
53. Lassmann H, van Horssen J and Mahad D. Progressive multiple sclerosis: pathology and pathogenesis. Nature reviews Neurology. 2012; 8: 647-56.
54. Compston A and Coles A. Multiple sclerosis. Lancet. 2002; 359: 1221-31.

59
55. Kremenchutzky M, Rice GP, Baskerville J, Wingerchuk DM and Ebers GC. The natural history of multiple sclerosis: a geographically based study 9: observations on the progressive phase of the disease. Brain : a journal of neurology. 2006; 129: 584-94.
56. Miller DH and Leary SM. Primary-progressive multiple sclerosis. The Lancet Neurology. 2007; 6: 903-12.
57. Noseworthy JH, Lucchinetti C, Rodriguez M and Weinshenker BG. Multiple sclerosis. N Engl J Med. 2000; 343: 938-52.
58. Lassmann H, Bruck W and Lucchinetti CF. The immunopathology of multiple sclerosis: an overview. Brain Pathol. 2007; 17: 210-8.
59. Lassmann H. Review: the architecture of inflammatory demyelinating lesions: implications for studies on pathogenesis. Neuropathology and applied neurobiology. 2011; 37: 698-710.
60. Smith ME, Stone LA, Albert PS, et al. Clinical worsening in multiple sclerosis is associated with increased frequency and area of gadopentetate dimeglumine-enhancing magnetic resonance imaging lesions. Annals of neurology. 1993; 33: 480-9.
61. Smith KJ and McDonald WI. The pathophysiology of multiple sclerosis: the mechanisms underlying the production of symptoms and the natural history of the disease. Philosophical transactions of the Royal Society of London Series B, Biological sciences. 1999; 354: 1649-73.
62. Bjartmar C, Wujek JR and Trapp BD. Axonal loss in the pathology of MS: consequences for understanding the progressive phase of the disease. Journal of the neurological sciences. 2003; 206: 165-71.
63. Trapp BD and Nave KA. Multiple sclerosis: an immune or neurodegenerative disorder? Annual review of neuroscience. 2008; 31: 247-69.
64. Kutzelnigg A, Lucchinetti CF, Stadelmann C, et al. Cortical demyelination and diffuse white matter injury in multiple sclerosis. Brain : a journal of neurology. 2005; 128: 2705-12.
65. Serafini B, Rosicarelli B, Magliozzi R, Stigliano E and Aloisi F. Detection of ectopic B-cell follicles with germinal centers in the meninges of patients with secondary progressive multiple sclerosis. Brain Pathol. 2004; 14: 164-74.
66. Howell OW, Reeves CA, Nicholas R, et al. Meningeal inflammation is widespread and linked to cortical pathology in multiple sclerosis. Brain : a journal of neurology. 2011; 134: 2755-71.

60
67. Allen IV, McQuaid S, Mirakhur M and Nevin G. Pathological abnormalities in the normal-appearing white matter in multiple sclerosis. Neurological sciences : official journal of the Italian Neurological Society and of the Italian Society of Clinical Neurophysiology. 2001; 22: 141-4.
68. Wegner C, Esiri MM, Chance SA, Palace J and Matthews PM. Neocortical neuronal, synaptic, and glial loss in multiple sclerosis. Neurology. 2006; 67: 960-7.
69. Loitfelder M, Fazekas F, Koschutnig K, et al. Brain activity changes in cognitive networks in relapsing-remitting multiple sclerosis - insights from a longitudinal FMRI study. PloS one. 2014; 9: e93715.
70. Benedetti B, Rovaris M, Rocca MA, et al. In-vivo evidence for stable neuroaxonal damage in the brain of patients with benign multiple sclerosis. Mult Scler. 2009; 15: 789-94.
71. Wingerchuk DM and Rodriguez M. Premenstrual multiple sclerosis pseudoexacerbations: Role of body temperature and prevention with aspirin. Archives of neurology. 2006; 63: 1005-8.
72. Matthews WB. Paroxysmal symptoms in multiple sclerosis. Journal of neurology, neurosurgery, and psychiatry. 1975; 38: 617-23.
73. Eriksson M, Ben-Menachem E and Andersen O. Epileptic seizures, cranial neuralgias and paroxysmal symptoms in remitting and progressive multiple sclerosis. Mult Scler. 2002; 8: 495-9.
74. Leary SM and Thompson AJ. Current management of multiple sclerosis. International journal of clinical practice. 2000; 54: 161-9.
75. Amato MP, Ponziani G, Siracusa G and Sorbi S. Cognitive dysfunction in early-onset multiple sclerosis: a reappraisal after 10 years. Archives of neurology. 2001; 58: 1602-6.
76. Rothwell PM, McDowell Z, Wong CK and Dorman PJ. Doctors and patients don't agree: cross sectional study of patients' and doctors' perceptions and assessments of disability in multiple sclerosis. BMJ. 1997; 314: 1580-3.
77. Comi G, Filippi M, Martinelli V, et al. Brain MRI correlates of cognitive impairment in primary and secondary progressive multiple sclerosis. Journal of the neurological sciences. 1995; 132: 222-7.
78. Vleugels L, Pfennings L, Pouwer F, et al. Psychological functioning in primary progressive versus secondary progressive multiple sclerosis. The British journal of medical psychology. 1998; 71 ( Pt 1): 99-106.

61
79. Kurtzke JF. Rating neurologic impairment in multiple sclerosis: an expanded disability status scale (EDSS). Neurology. 1983; 33: 1444-52.
80. Burman J, Iacobaeus E, Svenningsson A, et al. Autologous haematopoietic stem cell transplantation for aggressive multiple sclerosis: the Swedish experience. J Neurol Neurosurg Psychiatry. 2014; 85: 1116-21.
81. Tuohy O, Costelloe L, Hill-Cawthorne G, et al. Alemtuzumab treatment of multiple sclerosis: long-term safety and efficacy. J Neurol Neurosurg Psychiatry. 2014.
82. Müller R. Course and prognosis of disseminated sclerosis in relation to age at onset. Arch Neurol Psychiatry 1951: 561-70.
83. Weinshenker BG, Bass B, Rice GP, et al. The natural history of multiple sclerosis: a geographically based study. I. Clinical course and disability. Brain. 1989; 112 ( Pt 1): 133-46.
84. Confavreux C and Vukusic S. Age at disability milestones in multiple sclerosis. Brain : a journal of neurology. 2006; 129: 595-605.
85. Koch M, Kingwell E, Rieckmann P and Tremlett H. The natural history of secondary progressive multiple sclerosis. J Neurol Neurosurg Psychiatry. 2010; 81: 1039-43.
86. Rodriguez M, Siva A, Cross SA, O'Brien PC and Kurland LT. Optic neuritis: a population-based study in Olmsted County, Minnesota. Neurology. 1995; 45: 244-50.
87. Runmarker B, Andersson C, Oden A and Andersen O. Prediction of outcome in multiple sclerosis based on multivariate models. Journal of neurology. 1994; 241: 597-604.
88. Kurtzke JF, Beebe GW, Nagler B, Kurland LT and Auth TL. Studies on the natural history of multiple sclerosis--8. Early prognostic features of the later course of the illness. Journal of chronic diseases. 1977; 30: 819-30.
89. Scalfari A, Neuhaus A, Daumer M, Deluca GC, Muraro PA and Ebers GC. Early relapses, onset of progression, and late outcome in multiple sclerosis. JAMA neurology. 2013; 70: 214-22.
90. Trojano M, Avolio C, Manzari C, et al. Multivariate analysis of predictive factors of multiple sclerosis course with a validated method to assess clinical events. Journal of neurology, neurosurgery, and psychiatry. 1995; 58: 300-6.
91. Kantarci O, Siva A, Eraksoy M, et al. Survival and predictors of disability in Turkish MS patients. Turkish Multiple Sclerosis Study Group (TUMSSG). Neurology. 1998; 51: 765-72.
92. Bergamaschi R, Berzuini C, Romani A and Cosi V. Predicting secondary progression in relapsing-remitting multiple sclerosis: a Bayesian analysis. Journal of the neurological sciences. 2001; 189: 13-21.
62
93. Myhr KM, Riise T, Vedeler C, et al. Disability and prognosis in multiple sclerosis: demographic and clinical variables important for the ability to walk and awarding of disability pension. Multiple sclerosis (Houndmills, Basingstoke, England). 2001; 7: 59-65.
94. Riise T, Gronning M, Fernandez O, et al. Early prognostic factors for disability in multiple sclerosis, a European multicenter study. Acta neurologica Scandinavica. 1992; 85: 212-8.
95. Simone IL, Carrara D, Tortorella C, et al. Course and prognosis in early-onset MS: comparison with adult-onset forms. Neurology. 2002; 59: 1922-8.
96. Amato MP, Ponziani G, Bartolozzi ML and Siracusa G. A prospective study on the natural history of multiple sclerosis: clues to the conduct and interpretation of clinical trials. Journal of the neurological sciences. 1999; 168: 96-106.
97. Confavreux C, Vukusic S and Adeleine P. Early clinical predictors and progression of irreversible disability in multiple sclerosis: an amnesic process. Brain : a journal of neurology. 2003; 126: 770-82.
98. Tremlett H, Yousefi M, Devonshire V, Rieckmann P and Zhao Y. Impact of multiple sclerosis relapses on progression diminishes with time. Neurology. 2009; 73: 1616-23.
99. Langer-Gould A, Popat RA, Huang SM, et al. Clinical and demographic predictors of long-term disability in patients with relapsing-remitting multiple sclerosis: a systematic review. Archives of neurology. 2006; 63: 1686-91.
100. Rudick RA, Cohen JA, Weinstock-Guttman B, Kinkel RP and Ransohoff RM. Management of multiple sclerosis. The New England journal of medicine. 1997; 337: 1604-11.
101. Glaser GH and Merritt HH. Effects of ACTH and cortisone in multiple sclerosis. Transactions of the American Neurological Association. 1951; 56: 130-3.
102. Beck RW, Cleary PA, Trobe JD, et al. The effect of corticosteroids for acute optic neuritis on the subsequent development of multiple sclerosis. The Optic Neuritis Study Group. The New England journal of medicine. 1993; 329: 1764-9.
103. Compston DA, Milligan NM, Hughes PJ, et al. A double-blind controlled trial of high dose methylprednisolone in patients with multiple sclerosis: 2. Laboratory results. Journal of neurology, neurosurgery, and psychiatry. 1987; 50: 517-22.
104. Interferon beta-1b is effective in relapsing-remitting multiple sclerosis. I. Clinical results of a multicenter, randomized, double-blind, placebo-controlled trial. The IFNB Multiple Sclerosis Study Group. Neurology. 1993; 43: 655-61.

63
105. Jacobs LD, Cookfair DL, Rudick RA, et al. Intramuscular interferon beta-1a for disease progression in relapsing multiple sclerosis. The Multiple Sclerosis Collaborative Research Group (MSCRG). Annals of neurology. 1996; 39: 285-94.
106. Johnson KP, Brooks BR, Cohen JA, et al. Copolymer 1 r educes relapse rate and improves disability in relapsing-remitting multiple sclerosis: results of a phase III multicenter, double-blind placebo-controlled trial. The Copolymer 1 Multiple Sclerosis Study Group. Neurology. 1995; 45: 1268-76.
107. Rudick RA, Cutter GR, Baier M, et al. Estimating long-term effects of disease-modifying drug therapy in multiple sclerosis patients. Mult Scler. 2005; 11: 626-34.
108. Johnson KP, Brooks BR, Ford CC, et al. Sustained clinical benefits of glatiramer acetate in relapsing multiple sclerosis patients observed for 6 years. Copolymer 1 Multiple Sclerosis Study Group. Mult Scler. 2000; 6: 255-66.
109. Kappos L, Polman CH, Freedman MS, et al. Treatment with interferon beta-1b delays conversion to clinically definite and McDonald MS in patients with clinically isolated syndromes. Neurology. 2006; 67: 1242-9.
110. Randomised double-blind placebo-controlled study of interferon beta-1a in relapsing/remitting multiple sclerosis. PRISMS (Prevention of Relapses and Disability by Interferon beta-1a Subcutaneously in Multiple Sclerosis) Study Group. Lancet. 1998; 352: 1498-504.
111. Gold R, Kappos L, Arnold DL, et al. Placebo-controlled phase 3 study of oral BG-12 for relapsing multiple sclerosis. The New England journal of medicine. 2012; 367: 1098-107.
112. Kappos L, Radue EW, O'Connor P, et al. A placebo-controlled trial of oral fingolimod in relapsing multiple sclerosis. The New England journal of medicine. 2010; 362: 387-401.
113. O'Connor P, Wolinsky JS, Confavreux C, et al. Randomized trial of oral teriflunomide for relapsing multiple sclerosis. The New England journal of medicine. 2011; 365: 1293-303.
114. Hartung HP, Gonsette R, Konig N, et al. Mitoxantrone in progressive multiple sclerosis: a placebo-controlled, double-blind, randomised, multicentre trial. Lancet. 2002; 360: 2018-25.
115. Polman CH, O'Connor PW, Havrdova E, et al. A randomized, placebo-controlled trial of natalizumab for relapsing multiple sclerosis. The New England journal of medicine. 2006; 354: 899-910.
64
116. Freedman MS, Selchen D, Arnold DL, et al. Treatment optimization in MS: Canadian MS Working Group updated recommendations. The Canadian journal of neurological sciences Le journal canadien des sciences neurologiques. 2013; 40: 307-23.
117. Gold R, Wolinsky JS, Amato MP and Comi G. Evolving expectations around early management of multiple sclerosis. Therapeutic advances in neurological disorders. 2010; 3: 351-67.
118. Kappos L, Weinshenker B, Pozzilli C, et al. Interferon beta-1b in secondary progressive MS: a combined analysis of the two trials. Neurology. 2004; 63: 1779-87.
119. Flynn R. Survival analysis. Journal of clinical nursing. 2012; 21: 2789-97.
120. Rich JT, Neely JG, Paniello RC, Voelker CC, Nussenbaum B and Wang EW. A practical guide to understanding Kaplan-Meier curves. Otolaryngology--head and neck surgery : official journal of American Academy of Otolaryngology-Head and Neck Surgery. 2010; 143: 331-6.
121. McNamee R. Confounding and confounders. Occupational and environmental medicine. 2003; 60: 227-34; quiz 164, 234.
122. Jepsen P, Johnsen SP, Gillman MW and Sorensen HT. Interpretation of observational studies. Heart. 2004; 90: 956-60.
123. Cox DR. Regression Models and Life-Tables. J R Stat Soc. 1972; 34: 187-220.
124. D. C. Modelling Survival Data in Medical Research, 2nd edn.: Chapman and Hall/CRC; 2 edition 2006.
125. Loomis D, Richardson DB and Elliott L. Poisson regression analysis of ungrouped data. Occupational and environmental medicine. 2005; 62: 325-9.
126. Breslow NE and Day NE. Statistical methods in cancer research. Volume II--The design and analysis of cohort studies. IARC scientific publications. 1987: 1-406.
127. Andersen O. Restricted dissemination of clinically defined attacks in an MS incidence material. Acta neurologica Scandinavica. 1980; 77: 1-70.
128. Denckla MB, Rudel RG and Broman M. Tests that discriminate between dyslexic and other learning-disable boys. Brain and language. 1981; 13: 118-29.
129. Svenningsson A, Runmarker B, Lycke J and Andersen O. Incidence of MS during two fifteen-year periods in the Gothenburg region of Sweden. Acta Neurol Scand. 1990; 82: 161-8.

65
130. Novakova L, Skoog B, Runmarker B, et al. Clinically isolated syndromes with no further disease activity suggestive of multiple sclerosis at the age of population life expectancy. Multiple sclerosis. 2014; 20: 496-500.
131. Skoog B, Runmarker B, Winblad S, Ekholm S and Andersen O. A representative cohort of patients with non-progressive multiple sclerosis at the age of normal life expectancy. Brain : a journal of neurology. 2012; 135: 900-11.
132. Myasoedova E, Crowson CS, Turesson C, Gabriel SE and Matteson EL. Incidence of extraarticular rheumatoid arthritis in Olmsted County, Minnesota, in 1995-2007 versus 1985-1994: a population-based study. J Rheumatol. 2011; 38: 983-9.
133. Sackett D HB, Tugwell P. Clinical epidemiology: a basic science for clinical medicine. . Boston: Little, Brown co, 1991.
134. Kurland LT. The evolution of multiple sclerosis epidemiology. Annals of neurology. 1994; 36 Suppl: S2-5.
135. Roberts RS, Spitzer WO, Delmore T and Sackett DL. An empirical demonstration of Berkson's bias. J Chronic Dis. 1978; 31: 119-28.
136. Andersen O. Natural history of multiple sclerosis. In: Raine C, McFarland HF and Hohlfeld R, (eds.). Multiple Sclerosis: A comprehensive text. Edinburgh: Saunders Elsevier, 2008, p. 100-20.
137. Scalfari A, Knappertz V, Cutter G, Goodin DS, Ashton R and Ebers GC. Mortality in patients with multiple sclerosis. Neurology. 2013; 81: 184-92.
138. Weinshenker BG, Bass B, Rice GP, et al. The natural history of multiple sclerosis: a geographically based study. 2. Predictive value of the early clinical course. Brain. 1989; 112 ( Pt 6): 1419-28.
139. Miller DH, Chard DT and Ciccarelli O. Clinically isolated syndromes. Lancet Neurol. 2012; 11: 157-69.
140. Shirani A, Zhao Y, Karim ME, et al. Association between use of interferon beta and progression of disability in patients with relapsing-remitting multiple sclerosis. JAMA : the journal of the American Medical Association. 2012; 308: 247-56.
141. Renoux C. Natural history of multiple sclerosis: long-term prognostic factors. Neurologic clinics. 2011; 29: 293-308.
142. Beck CA. Selection bias in observational studies: out of control? Neurology. 2009; 72: 108-9.
143. Leray E, Morrissey SP, Yaouanq J, et al. Long-term survival of patients with multiple sclerosis in West France. Multiple sclerosis (Houndmills, Basingstoke, England). 2007; 13: 865-74.

66
144. Scalfari A, Neuhaus A, Daumer M, Muraro PA and Ebers GC. Onset of secondary progressive phase and long-term evolution of multiple sclerosis. J Neurol Neurosurg Psychiatry, doi: jnnp-2012-304333. 2013.
145. Tremlett H, Paty D and Devonshire V. Disability progression in multiple sclerosis is slower than previously reported. Neurology. 2006; 66: 172-7.
146. Confavreux C and Vukusic S. [The natural history of multiple sclerosis]. Rev Prat. 2006; 56: 1313-20.
147. Tremlett H, Yinshan Z and Devonshire V. Natural history of secondary-progressive multiple sclerosis. Mult Scler. 2008; 14: 314-24.
148. Kalincik T, Vivek V, Jokubaitis V, et al. Sex as a determinant of relapse incidence and progressive course of multiple sclerosis. Brain. 2013; 136: 3609-17.
149. Bucy PC, Keplinger JE and Siqueira EB. Destruction of the "Pyramidal Tract" in Man. J Neurosurg. 1964; 21: 285-98.
150. Piecharka DM, Kleim JA and Whishaw IQ. Limits on recovery in the corticospinal tract of the rat: partial lesions impair skilled reaching and the topographic representation of the forelimb in motor cortex. Brain Res Bull. 2005; 66: 203-11.
151. Frisen L and Frisen M. A simple relationship between the probability distribution of visual acuity and the density of retinal output channels. Acta Ophthalmol (Copenh). 1976; 54: 437-44.
152. Mori F, Kusayanagi H, Nicoletti CG, Weiss S, Marciani MG and Centonze D. Cortical plasticity predicts recovery from relapse in multiple sclerosis. Mult Scler. 2014; 20: 451-7.
153. Novakova L, Skoog B, Runmarker B, et al. Clinically isolated syndromes with no further disease activity suggestive of multiple sclerosis at the age of population life expectancy. Mult Scler. 2013.
154. Scott TF, Schramke CJ, Novero J and Chieffe C. Short-term prognosis in early relapsing-remitting multiple sclerosis. Neurology. 2000; 55: 689-93.
155. Yamout B, Itani S, Arabi A, Hamzeh D and Yaghi S. Prognostic factors of multiple sclerosis in Lebanon. Int J Neurosci. 2010; 120: 206-10.
156. Kister I, Chamot E, Salter AR, Cutter GR, Bacon TE and Herbert J. Disability in multiple sclerosis: a reference for patients and clinicians. Neurology. 2013; 80: 1018-24.
157. Bergamaschi R, Quaglini S, Trojano M, et al. Early prediction of the long term evolution of multiple sclerosis: the Bayesian Risk Estimate for Multiple Sclerosis (BREMS) score. Journal of neurology, neurosurgery, and psychiatry. 2007; 78: 757-9.

67
158. Veloso M. A web-based decision support tool for prognosis simulation in multiple sclerosis. Mult Scler Relat Disord. 2014; 3: 575-83.
159. Galea I, Lederer C, Neuhaus A, et al. A web-based tool for personalized prediction of long-term disease course in patients with multiple sclerosis. Eur J Neurol. 2013; 20: 1107-9.
160. Daumer M, Neuhaus A, Lederer C, Scholz M, Wolinsky JS and Heiderhoff M. Prognosis of the individual course of disease--steps in developing a decision support tool for Multiple Sclerosis. BMC Med Inform Decis Mak. 2007; 7: 11.
161. Achiron A, Barak Y and Rotstein Z. Longitudinal disability curves for predicting the course of relapsing-remitting multiple sclerosis. Mult Scler. 2003; 9: 486-91.
162. Roxburgh RH, Seaman SR, Masterman T, et al. Multiple Sclerosis Severity Score: using disability and disease duration to rate disease severity. Neurology. 2005; 64: 1144-51.
163. Wootla B, Denic A, Warrington AE and Rodriguez M. Need for a paradigm shift in therapeutic approaches to CNS injury. Expert Rev Neurother. 2012; 12: 409-20.
164. Lind M, Oden A, Fahlen M and Eliasson B. The shape of the metabolic memory of HbA1c: re-analysing the DCCT with respect to time-dependent effects. Diabetologia. 2010; 53: 1093-8.
165. Kanis JA, McCloskey EV, Johansson H, Oden A, Strom O and Borgstrom F. Development and use of FRAX in osteoporosis. Osteoporos Int. 2010; 21 Suppl 2: S407-13.
166. Johansson H, Oden A, Kanis J, et al. Low serum vitamin D is associated with increased mortality in elderly men: MrOS Sweden. Osteoporos Int. 2012; 23: 991-9.
167. Watts NB. The Fracture Risk Assessment Tool (FRAX(R)): applications in clinical practice. J Womens Health (Larchmt). 2011; 20: 525-31.
168. Rio J, Comabella M and Montalban X. Predicting responders to therapies for multiple sclerosis. Nat Rev Neurol. 2009; 5: 553-60.
169. Concato J. Observational versus experimental studies: what's the evidence for a hierarchy? NeuroRx : the journal of the American Society for Experimental NeuroTherapeutics. 2004; 1: 341-7.
170. Schulz KF, Altman DG and Moher D. CONSORT 2010 Statement: updated guidelines for reporting parallel group randomised trials. BMC medicine. 2010; 8: 18.
171. Ann Marrie R and Rudick RA. Drug Insight: interferon treatment in multiple sclerosis. Nature clinical practice Neurology. 2006; 2: 34-44.

68
172. Goodin DS, Jones J, Li D, et al. Establishing long-term efficacy in chronic disease: use of recursive partitioning and propensity score adjustment to estimate outcome in MS. PloS one. 2011; 6: e22444.
173. Wilson M, Berwick DM and DiGuiseppi C. The new edition of the Guide to Clinical Preventive Services. Pediatrics. 1996; 97: 733-5.
174. Moher D, Hopewell S, Schulz KF, et al. CONSORT 2010 Explanation and Elaboration: Updated guidelines for reporting parallel group randomised trials. Journal of clinical epidemiology. 2010; 63: e1-37.
175. Ebers GC, Heigenhauser L, Daumer M, Lederer C and Noseworthy JH. Disability as an outcome in MS clinical trials. Neurology. 2008; 71: 624-31.
176. Marrie RA. Observational studies of treatment effectiveness: useful, useless or somewhere in between? Multiple sclerosis (Houndmills, Basingstoke, England). 2013; 19: 707-8.
177. Trojano M, Pellegrini F, Fuiani A, et al. New natural history of interferon-beta-treated relapsing multiple sclerosis. Annals of neurology. 2007; 61: 300-6.
178. Conway DS, Miller DM, O'Brien RG and Cohen JA. Long term benefit of multiple sclerosis treatment: an investigation using a novel data collection technique. Multiple sclerosis (Houndmills, Basingstoke, England). 2012; 18: 1617-24.
179. Gout O. Confounders in natural history of interferon-beta-treated relapsing multiple sclerosis. Annals of neurology. 2008; 63: 126; author reply -7.
180. Renoux C and Suissa S. Immortal time bias in the study of effectiveness of interferon-beta in multiple sclerosis. Annals of neurology. 2008; 64: 109-10; author reply 10.
181. Sormani MP. The Will Rogers phenomenon: the effect of different diagnostic criteria. Journal of the neurological sciences. 2009; 287 Suppl 1: S46-9.
182. Kister I, Chamot E, Cutter G, et al. Increasing age at disability milestones among MS patients in the MSBase Registry. J Neurol Sci. 2012; 318: 94-9.
183. Marrie RA, Cutter G, Tyry T, Hadjimichael O, Campagnolo D and Vollmer T. Changes in the ascertainment of multiple sclerosis. Neurology. 2005; 65: 1066-70.
184. Feinstein AR, Sosin DM and Wells CK. The Will Rogers phenomenon. Stage migration and new diagnostic techniques as a source of misleading statistics for survival in cancer. The New England journal of medicine. 1985; 312: 1604-8.

69
185. Sormani MP, Tintore M, Rovaris M, et al. Will Rogers phenomenon in multiple sclerosis. Annals of neurology. 2008; 64: 428-33.
186. Andersen O. From the Gothenburg cohort to the Swedish multiple sclerosis registry. Acta neurologica Scandinavica Supplementum. 2012: 13-9.
187. Horwitz RI, Viscoli CM, Clemens JD and Sadock RT. Developing improved observational methods for evaluating therapeutic effectiveness. The American journal of medicine. 1990; 89: 630-8.
188. Amato MP and Ponziani G. A prospective study on the prognosis of multiple sclerosis. Neurol Sci. 2000; 21: S831-8.
189. Levic ZM, Dujmovic I, Pekmezovic T, et al. Prognostic factors for survival in multiple sclerosis. Multiple sclerosis (Houndmills, Basingstoke, England). 1999; 5: 171-8.
190. Pittock SJ, Mayr WT, McClelland RL, et al. Disability profile of MS did not change over 10 years in a population-based prevalence cohort. Neurology. 2004; 62: 601-6.
191. Bostrom I, Callander M, Kurtzke JF and Landtblom AM. High prevalence of multiple sclerosis in the Swedish county of Varmland. Mult Scler. 2009; 15: 1253-62.
192. Broman T, Andersen O and Bergmann L. Clinical studies on multiple sclerosis. I. Presentation of an incidence material from Gothenburg. Acta neurologica Scandinavica. 1981; 63: 6-33.
193. Bronnum-Hansen H, Koch-Henriksen N and Hyllested K. Survival of patients with multiple sclerosis in Denmark: a nationwide, long-term epidemiologic survey. Neurology. 1994; 44: 1901-7.
194. Salhofer-Polanyi S, Windt J, Sumper H, et al. Benefits of inpatient multidisciplinary rehabilitation in multiple sclerosis. NeuroRehabilitation. 2013; 33: 285-92.
195. Subramanian J and Simon R. Overfitting in prediction models - Is it a problem only in high dimensions? Contemp Clin Trials. 2013.