long term epidemiological survey of kudoa thyrsites...
TRANSCRIPT

1
Long term epidemiological survey of Kudoa thyrsites (Myxozoa) in Atlantic salmon (Salmo
salar L.) from commercial aquaculture farms.
Wyth L Marshall1*, Ariadna Sitjà-Bobadilla2, Heather M Brown1, Tiffany MacWilliam3, Zina
Richmond1, Heather Lamson4, Diane B Morrison2, Luis O B Afonso5
1BC Centre for Aquatic Health Sciences, 871A Island Hwy, Campbell River, BC, V9W 2C2,
Canada.
2Instituto de Acuicultura de Torre de la Sal (IATS-CSIC), 12595 Ribera de Cabanes, Castellón,
Spain.
3Marine Harvest Canada, 1334 Island Hwy, Suite 124, Campbell River, BC, V9W 8C9, Canada.
4Ministry of Forests, Lands and Natural Resource Operations, Fish and Wildlife Branch,
Cranbrook, BC, V1C 7G5.
5Centre for Integrative Ecology, School of Life and Environmental Sciences, Deakin University,
Warrnambool Campus, Victoria 3280, Australia
* Corresponding author e-mail: [email protected]
Running title: Epidemiology of K. thyrsites in farmed Atlantic salmon.
2
Abstract
Kudoa thyrsites is a myxozoan parasite, which encysts within myocytes of a variety of fishes.
While infected fish appear unharmed, parasite derived enzymes degrade the flesh post mortem.
In regions of British Columbia (Canada) up to 4-7 % of fillets can be affected, thus having
economic consequences and impacting the competitiveness of BC’s farms. Infections were
monitored in two farms having high (HP) or low (LP) historical prevalence. Prevalence was
determined by PCR of muscle, and intensity was measured by histology. In parallel, fillet tests
were used to quantify myoliquefaction. At each farm, 30 fish were sampled monthly during the
first year followed by nine samplings during year two. Infections were detected by PCR after 355
and 509 degree days at LP and HP farms, respectively. Prevalence reached 100 % at the HP farm
by 2,265 degree days and then declined during the second year, whereas it plateaued near 50 %
at the LP farm. Infection intensities decreased after one year at both farms. Blood was PCR
positive at both farms between 778-1,113 degree days and then again after 2,000 degree days.
This is the first monitoring project in a production setting and compares data between farms with
different prevalence.
Keywords
Immunity, Intensity, Histopathology, Myoliquefaction, Prevalence, Pseudocysts

3
Introduction
The genus Kudoa (Myxozoa) is composed of over 90 species parasitic on a wide range of
marine and estuarine teleosts, and one species from the North-Pacific giant octopus Paroctopus
dofleini (Wülker) (Yokoyama & Masuda 2001). Most Kudoa species are histozoic, infecting a
variety of tissues including muscle, kidney, ovary, and brain (Moran, Whitaker & Kent 1999c).
Infections of the skeletal muscle are the most common and are characterized by visible cysts or
microscopic intracellular pseudocysts (Moran et al. 1999c). Although there are no reported
effects on the physiology or life-span of the hosts from skeletal muscle infections, their impact
on commercial fisheries and aquaculture is due to the presence of visually unappealing cysts or
post-mortem softening of the flesh (Moran et al. 1999c). Kudoa thyrsites (Gilchrist 1924) causes
post-mortem myoliquefaction, otherwise known as soft-flesh syndrome, in 37 fish species
including Pacific hake, Merluccius productus (Ayres), Mahi mahi, Coryphaena hippurus (L),
Atlantic mackerel Scomber scombrus (L), coho salmon, Oncorhynchus kisutch (Walbaum), and
Atlantic salmon, Salmo salar (L) (Whipps & Kent 2006; Moran et al. 1999c; Langdon 1991;
Kabata & Whitaker 1981; Harrell & Scott 1985; Kabata, Whitaker & Bagshaw 1986; Levsen,
Jørgensen & Mo 2008). K. thyrsites has a widespread distribution with endemic strains in most
temperate regions, including the North-East Pacific, North-West Europe, Japan, Southern
Australia, Chile, and South Africa (Whipps & Kent 2006), and is the most frequently studied
species of the genus. Economic consequences of soft-flesh syndrome are high in aquaculture
facilities located in regions having high prevalence of infection. Although infection prevalence
can be monitored within affected farms by PCR or examining fillets for manifestation of soft-
flesh, there are no external clinical signs to identify and cull infected fish. Therefore, the effects
are not realized until after processing and accrual of all production costs. In British Columbia,
Canada annual costs to the Atlantic salmon aquaculture industry due to K. thyrsites infections
reach millions of dollars, e.g. in 2002 losses were estimated at 50 million CAD (Funk, Raap,
Sojonky, Jones, Robinson, Falkenberg & Miller 2007).
Myoliquefaction is caused by enzymatic degradation of the host musculature. In M.
productus, myofibrils in close proximity to the pseudocysts of K. thyrsites and K. paniformis
infections are affected while the fish is alive (Stehr & Whitaker 1986). Most enzymes
responsible for liquefaction are thought to be adsorbed or metabolized by the living host, but
accumulate after the host dies (Willis 1949). Funk, Olafson, Raap, Smith, Aitken, Haddow,

4
Wang, Dawson-Coates, Burke & Miller (2008) identified a cysteine protease, Cathepsin L, as the
responsible enzyme. Both Funk et al. (2008) and Martone, Spivak, Busconi, Folco & Sánchez
(1999) demonstrated that the enzyme is associated with pseudocysts of Kudoa. Earlier,
Patashnik, Groninger, Barnett, Kudo & Koury (1982) concluded that while the proteolytic
enzymes were associated with pseudocysts, they were not produced by the mature myxospores.
In Atlantic salmon, the extent of post mortem myoliquefaction is correlated with parasite
intensity measured as the number of pseudocysts/mm2 (Funk et al. 2007), the number of
myxospores (Dawson-Coates, Chase, Funk, Booy, Haines, Falkenberg, Whitaker, Olafson &
Pearson 2003; St-Hilaire, Hill, Kent, Whitaker & Ribble 1997), or the quantity of nucleic acids
of K. thyrsites origin (Funk et al. 2007). Similar correlations have been documented in infected
M. productus (Zhou & Li-Chan 2009; Samaranayaka, Ho & Li-Chan 2007).
Myxozoa have an alternating two host-life cycle where development in each host
concludes with the release of one of two types of infective spores. Myxospores are typically
produced during maturation within a vertebrate host (usually fish and amphibians) and
actinospores are formed within an invertebrate host following gamogamy (Kent, Andree,
Barhtolomew, El-Matbouli, Desser, Devlin, Feist, Hedrick, Hoffman, Khattra, Hallett, Lester,
Longshaw, Palenzeula, Siddall & Xiao 2001). Although K. thyrsites has many piscine hosts, fish
to fish transmission via intubation of infected tissue has not been successful (Moran, Whitaker &
Kent 1999b), such as demonstrated for Enteromyxum species (Sitjà-Bobadilla & Palenzuela
2012). Instead, infection occurs after exposure to seawater (Moran et al. 1999b) and therefore the
life-cycle of Kudoa is presumed to be similar to other two-host myxozoa. The identity of the
invertebrate host(s) remains unknown and all the stages thus far have been described in fish. K.
thyrsites is first found as small multicellular plasmodia located intracellularly within myocytes,
and later develops into larger pseudocysts containing disporoblasts, developing and mature
myxospores, and undifferentiated cells (Willis 1949). Typically mature myxospores are located
in the interior of the pseudocysts and undifferentiated cells along the periphery (Morado &
Sparks 1986; Moran, Margolis, Webster & Kent 1999a).Without the ability to identify and
culture the infective stage from the putative invertebrate host, research has largely been focused
on monitoring and diagnostic development.
Thus far, all population level surveys have been conducted at the Pacific Biological
Station’s experimental net pen and tank facility in Nanaimo (British Columbia), a research

5
facility located in the Strait of Georgia approximately 200 km Southeast of most affected
aquaculture facilities (Moran & Kent 1999; Moran et al. 1999a; Moran et al. 1999b). Most data
were collected during the first year of exposure using light microscopy except for (Moran et al.
1999a), where PCR was also used. These previous studies showed that muscle tissue from
Atlantic salmon became infected within the first few months of exposure and that infection
prevalence declined after 9-12 months (Moran & Kent 1999; Moran et al. 1999a). Inflammation
occurred in response to lysis and degeneration of infected muscle fibres throughout most of the
infection period, but eventually resolved (Moran et al. 1999a). No earlier stages have been
described, but Moran et al. (1999a) detected the parasite in multiple tissues, including blood, by
PCR, especially during the initial period of infection. Blood was suspected to be the route of
dispersion within fish following successful transmission via intraperitoneal injection of blood
from a chronically infected fish (Moran et al. 1999b).
Industry monitoring programs have shown that there is regional variation in the level of
infection and consumer claims within British Columbia’s waterways (Morrison & MacWilliam
2010b). Fish raised in farms on the West Coast and in the northern most reaches of Vancouver
Island have lower effects of K. thyrsites than those in farms in the Discovery Island regions off
the central inside coast of Vancouver Island (Morrison & MacWilliam 2010b; Karreman,
Saksida, Jones & Stephen 2003). It is assumed that fish farmed in low prevalence regions have
less exposure to the parasite, presumably due to a differential distribution of the alternate host.
However other factors affecting host parasite interactions, such as water temperature are also
known to affect the outcome of myxozoan infections of fish (Schmidt-Posthaus & Wahli 2015).
The primary objectives of the current study were to combine PCR detection, histology,
and fillet testing to compare the progression of infection throughout the two year marine grow-
out phase at two commercial sites located in regions having different predicted infection
outcomes. Our data, based on multiple samples per fish, provide the most detailed description of
the progression of infection, especially during the second year of exposure. In addition, this is the
first data obtained from a less affected population.
Materials and Methods
Fish farms and sampling procedures

6
Two commercial Atlantic salmon farms were sampled throughout their grow-out production
cycle. Farms were chosen based on the historical records of fillet discard rates due to K.
thyrsites, and classified as either being high (4.0 – 7.6 %) or low (0.5 – 3.4 %) (Morrison &
MacWilliam 2010b). The predicted high prevalence (HP) farm was located in the Discovery
Islands between central Vancouver Island and the mainland of British Columbia, Canada. The
predicted low prevalence (LP) farm was located in the Queen Charlotte Strait, northeast of
Vancouver Island. Fish were entered on April 3rd and May 17th 2010 to each site respectively
(Tables 1 and 2). Fish at the LP site were moved to an adjacent farm in January 2011. At each
farm, 30 fish were sampled (blood and muscle) monthly for 15-17 months and then at 2.5 month
intervals for the final three samplings totalling more than 500 fish (Tables 1 and 2). Sampling
ended shortly before commercial harvest at approximately 24 months after seawater entry.
Sampled fish were randomly chosen from the same population (net pen) using a box seine and a
dip net. Fish were reared using the standard commercial procedures of the farms. Water quality
parameters, including temperature, salinity and dissolved oxygen were recorded daily throughout
the sampling time following established farm procedures.
At each sampling time, fish were quickly captured and placed in a bucket containing a
lethal dose (300-500 mg/L) of tricaine methanesulfonate (Syndel Laboratories Ltd., Canada) or
by irreversible percussive stunning. Then, blood was collected within 2 min after anaesthesia
from the caudal vein using EDTA coated vacutainers (BD Vacutainer®) and placed on ice until
centrifugation. Blood was centrifuged at 3,000 g for 10 min at 4 °C, and plasma and blood cells
were frozen at – 80 °C. Fish were held on ice until further sampling. Muscle samples were
collected from eight tissue sites (Fig. 1) within 1-4 h after capture, or within the next 12-18 h
from fish transported on ice and stored at 4ºC. Muscle samples were frozen on dry ice and
transferred to a -80 °C freezer for PCR analysis or fixed in 10% neutral buffered formalin for
histology. Wet weight, fork length and sex were recorded for each fish.
Fillet assessment
All fish weighing 1 kg or greater were used for fillet assessment to measure the effects of
K. thyrsites (pit counts and manifestation of myoliquefaction) (Tables 1 and 2). As growth was

7
slower at the LP farm, fewer fish were analyzed (n=181) than at the HP farm (n=350) (Tables 1-
2). Both left and right fillets were collected from these fish either during sampling, or within 12-
18 hours from whole fish transported on ice and stored at 4 ºC. Fillets were stored flat, skin side
together in sealed bags (3-4 ºC). Each fillet was examined for pits at one, three, and seven days
after sampling. Pits measuring less than 2 mm diameter, or those due to gaping or mechanical
damage were not counted. Fillet classification followed a modified version of the grading system
described by Dawson-Coates et al. (2003). Each fish was assigned a grade (K0 to K6) depending
on the final count of pits from both fillets on day seven. K0 to K3 grades had counts of 0, 1-10,
11-20, and 21-40, respectively. K4 fillets ranged from 41-120 isolated and well defined pits with
small patches of myoliquefaction. A K5 fillet either had greater than 120 pits or indefinable pits
due to widespread myoliquefaction. Fillets that were extensively liquefied to the point where the
flesh was able to slide off the skin were categorized as K6.
PCR analysis
DNA was extracted from 10 μl of red blood cells diluted in 190 μl phosphate buffered
saline or from 25-30 mg of muscle tissue, using a QIAGEN DNeasy® Blood and Tissue kit
according to manufacturer’s instructions. Nested PCR, targeting the ribosomal small subunit
(rDNA-SSU) of K. thyrsites, was performed in two stages using two primer sets (Table 3). All
reactions were amplified for 50 cycles using a Mastercycler (Eppendorf) and IllustraTM PuRe
TaqTM Ready-To-GoTM PCR beads at an annealing temperature of 50 ºC. The resulting 178 bp
amplicon was visualized on a 2% agarose gel. Between 3-5 PCR products from each tissue type
were confirmed as K. thyrsites by sequencing by Macrogen (Seoul, Korea).
K. thyrsites is known to have patchy distribution throughout skeletal muscle (Funk et al.
2007), therefore false negatives can be expected when using muscle as an indicator of infection.
To compensate, each fish was systematically tested before classifying it as positively or
negatively infected. For example, if a fish was positive in tissue site A, it was called positive and
no more PCR testing was done; however, if a fish was PCR negative at tissue site A, then site B
was also tested and so on, up to four tissue sites per fish. In HP fish, all eight sites were analysed
in order to evaluate the sensitivity of the test throughout the sampling period, but prevalence was
calculated from the four samples collected on the left side of the fish as per the LP farm.
8
Histopathology
Up to ten PCR positive fish (based on the result from the first muscle site) were randomly
chosen for the evaluation of the intensity of infection using histological examination of the
muscle. See details of sampling numbers and dates in Tables 1 and 2. The total number of fish
examined from the LP farm (109) was lower than from the HP farm (147) because less than ten
fish were PCR positive in several samplings. All fish with PCR positive blood and an additional
subset of fish with either light or heavily infected fillets were also included (n=43).
Myomere cross sections from the eight muscle sites were processed, embedded in
paraffin, sectioned, and stained with Hematoxylin and Eosin (H&E) by the British Columbia
Ministry of Agriculture and Lands in Abbotsford, British Columbia following standard
protocols. The entire area of all sections was examined using an Olympus CX41 compound
microscope at 200X magnification. The intensity of infection was calculated using total
pseudocyst counts standardized to area. The area of the sections was determined by tracing
photographs of each section using Photoshop v.6.0 and converting the traced areas into pixels
using Image J v.1.44. Data was analyzed with and without counts from poor performers, defined
as fish that weighed less than 40% of the monthly mean.
A subsample of 20 infected and one uninfected fish from the HP site were embedded in
Technovit resin (Heraeus, Germany), sectioned at 2-3 μm, and Giemsa stained. Most selected
fish were collected between 778 and 1,113 degree days and included fish that were PCR positive
in blood and/or muscle, but otherwise negative through H&E screening. An additional eight fish
with exceptionally heavy infections from 1,400, 1,675, and 2,013 degree days were also
included. Sections from each fish were examined for stages prior to penetration of myocytes,
developmental stages within myocytes, and cellular immune response.
Statistical analysis
All statistical analyses were performed using Statistics v.9. All data was validated for
normal distribution and homogeneity of variance using frequency histograms and descriptive
statistics otherwise non-parametric tests were used.
Results

9
The overall number of degree days and fish size were greater at the warmer, more southern HP
farm. The average measured temperature during the study was 8.70 ºC at the HP farm and 8.44
ºC at the LP farm. Salinity and monthly dissolved oxygen levels were consistently lower at the
HP farm (Tables 1-2).
Fillet analysis
Fillets from the HP farm consistently showed more pitting (after seven days of
observation) than those from the LP farm throughout the entire period of analysis (Fig. 2; Table
S1). An average of 34 % of fillets from the LP farm had one or more pits compared to 72 % at
the HP farm. Very few fillets (4 %) from the LP farm were categorized as K4 – K6 compared to
27 % at the HP farm (Fig. 2, Table S1). There was no change in fillet manifestation within farms
with increased production time or growth. There was no difference in manifestation in fish
filleted at the farm compared to those filleted the following day (not shown). Fillet manifestation
was sometimes visible the day following sampling (Day 1) but became more visible after four to
seven days (Fig. S1). Analysis of results from the final six sampling points from HP fish showed
a significant decrease in the percent of unaffected (K0) fillets (P = 0.002) and a corresponding
increase in K3-K6 fillets (p = 0.0054) between days one and four (analysis of variance
(ANOVA) followed by Tukey`s pairwise comparison). Changes between four and seven days
were not statistically significant by pairwise comparison.
PCR sensitivity and sampling effort
K. thyrsites has an over dispersed distribution and multiple muscle samples per fish were
necessary to compensate for false negative results (type two error) from PCR analysis. Assuming
a negligible type two error rate after testing up to eight muscle samples, the percent of false
negatives per number of tissue samples analysed from the HP farm was calculated. The
proportion of fish incorrectly identified as uninfected had an inverse log relationship (R2 = 0.998)
to the number of tissue sites used (Fig. 3). Therefore, the false negative rate was approximately
33 % using one tissue site compared to 9 % when using four sites (Fig. 3). All results described
hereon are based on four tissue sites per fish.
10
Monthly sampling effort at the HP farm, defined as the total number of PCR sites tested
each month (maximum 120) was lowest (52 or less PCR reactions) between 2,265 and 4,017
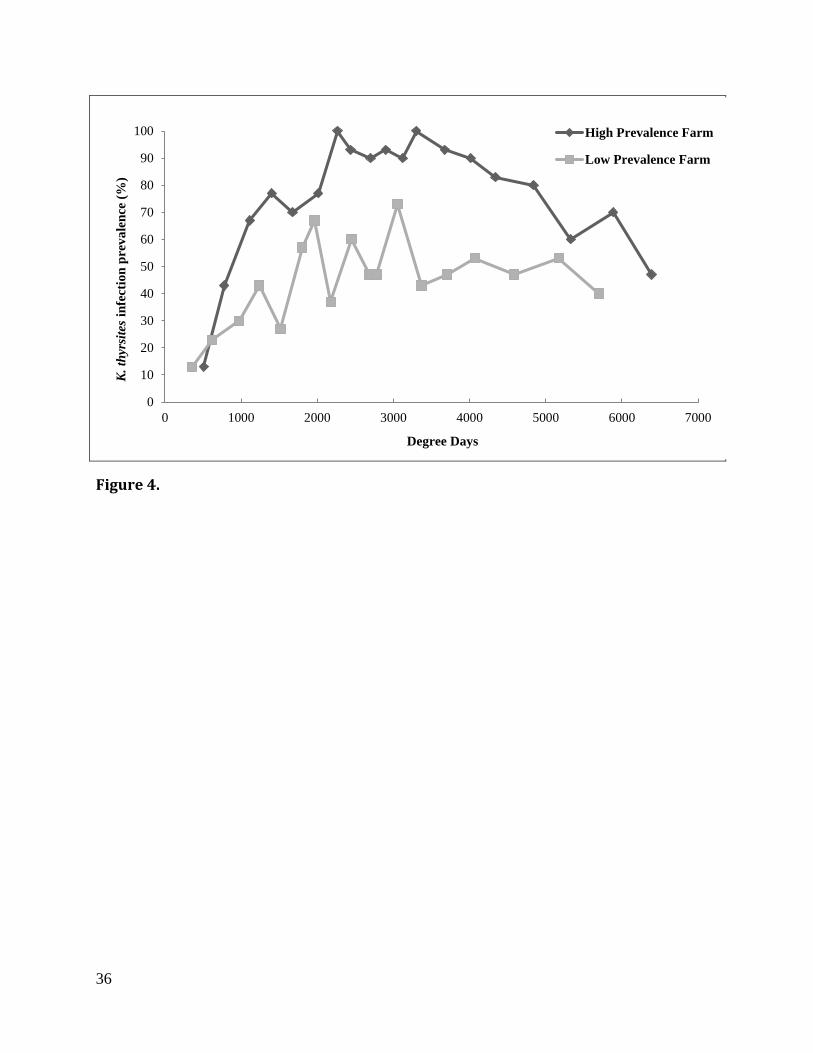
degree days corresponding to a 90 % or greater prevalence (Fig. 4, Table 1). Sampling effort at
the LP farm was highest between 622 and 1,518 degree days, and then varied between 62 and 92
PCR reactions for the duration of the sampling period (Table 2).
K. thyrsites prevalence of infection by PCR
K. thyrsites was first detected in muscle tissue earlier at the LP farm (38 days post entry =
355 degree days) than at the HP farm (58 days post entry = 509 degree days), though with the
same prevalence of infection (13.3 %). Subsequently, infection prevalence increased at both
farms until approximately 2,000 degree days, reaching higher values (90-100 %) in HP fish
(between 2,265 and 4,017 degree days) than in LP fish (37- 73 %) (between 1,804 and 3,053
degree days). In both farms, there was a subsequent decline in the prevalence, though more
pronounced in the HP farm. In any case, prevalence of infection was always higher in the HP
than in the LP farm (Fig. 4).
K. thyrsites was first detected in the blood from HP fish at 778 degree days with a
prevalence of 23.3 %. In subsequent samplings, prevalence ranged between 0 and 17 % (Table 4,
Fig. S2). A similar pattern, although with later first appearance (975 degree days) and lower
prevalence, occurred at the LP farm (Table 5). All fish, except one, having PCR positive blood
were also PCR positive in the first muscle tissue site tested. This exception was PCR positive in
the second tested muscle site.
Histologic diagnosis and histopathology
Pseudocysts were visible by histology at 1,113 and 975 degree days at the HP and LP
farms, respectively. At the HP farm, pseudocyst detection matched between 80 to 100 % of
muscle PCR positive fish from 1,400 to 3,300 degree days. However, later on these values
decreased to 50 to 80 % (Table 4). At the LP farm, corresponding prevalence by histology was
100 % between 1,236 to 1,962 degree days, but later decreased to values between 33 and 67 %
(Table 5). No pseudocysts were visible in the eight fish that were PCR positive in the blood at
778 and 1,113 degree days at the HP farm (Table 4), but they were visible in one of the two fish
that were positive in blood at 975 degree days at the LP farm (Table 5). However, in subsequent

11
HP samplings (2,265 degree days onward) 92 % of the blood positive fish also had visible
pseudocysts; most also exhibiting inflammation and heavy infections (Table 4). Coincidence of
blood positives and pseudocysts was also high (80 %) in the LP farm between 2,682 and 4,068
degree days (Table 5).
Infection intensities, calculated from the cross sections from randomly selected PCR
positive fish, were higher at the HP farm than the LP farm at similar degree days (Fig. 5).
Intensity increased as K. thyrsites became visibly established in the muscle of PCR positive fish,
reaching averages of 0.22-0.57 pseudocysts per mm2 at the HP farm between 1,400 and 2,013
degree days. In contrast, average highs at the LP farm ranged between 0.12-0.13 pseudocysts per
mm2 between 1,518-1,962 degree days (Fig. 5). Intensity dropped in the subsequent samplings at
both farms. Individual variation within each sampling time was high, such that statistically
significant differences (P < 0.05) were only detected between the peak levels and those obtained
at 5,392 degree days at the HP farm, and between peaks levels and those obtained at 4,068 and
5,694 degree days at the LP farm (identified by pairwise comparisons following a Kruskal-
Wallis non-parametric ANOVA). Exclusion of poor performers did not affect the analysis, but
these fish generally had higher than average parasite intensity. Intensities of infection obtained
from different tissue sites of the fish (Fig. 1) were not significantly different (data not shown).
When the intensity of infection was analysed from 81 fish sampled between 2,901 and
6,389 degree days at the HP site, selected through having either high (K4-K6) or low (K0-K2)
fillet manifestation levels a strong and significant positive correlation was found between
intensity and fillet severity (P< 0.05) Spearman’s rank correlation (not shown). However, the
average number of pseudocysts in K4-K6 fillets was negatively correlated with increasing
number of degree days at the HP farm (Fig. S3). Intensity of infection of K4-K6 fillets at 2,901
degree days was significantly different (P < 0.05) from that at two of the final three samplings
(Kruskal-Wallis ANOVA), but there were no significant changes in K0-K2 during the same time
period (Fig. S3).
Initial stages of the parasite occurred earlier at the LP farm (between 975 and 1,236
degree days) than at the HP farm (between 1,113 and 1,400 degree days). During this period
many fish did not have any visible myxospores (Figs. 6A-B). Undifferentiated initial stages and
disporoblasts were located along the pseudocyst periphery and mature spores filled the interior
(Figs. 6C-D, 7A). Some pseudocysts appeared to have microvilli-like extensions on their
12
periphery (Fig. 6C). Most infected myocytes had a single pseudocyst situated near the center of
the cell, but it was not uncommon for pseudocysts to be near the edge of the myocyte. Multiple
infections were frequently observed, with a maximum of four seemingly distinct pseudocysts
within a single myocyte. Branching of pseudocysts was not observed in any longitudinal section.
Infected myocytes appeared to be clumped, rather than evenly dispersed, but this observation
was not quantified. Putative early stages were observed in blood vessels (Figs. 6E-F), migrating
through skin (Fig. 6G), or as multinucleate cells interstitially between myocytes (Fig. 6H). These
unusual cells were rare and we were not able to conclusively identify them as K. thyrsites by
conventional histology. Pseudocysts from older fish were filled with mature myxospores in a
matrix of eosinophilic fibrous material (Fig. 7B). H&E stained polar capsules on developing
spores were pink (Fig. 6D), but became refractile and pale-mauve with deeply stained pycnotic
capsulogenic nuclei once mature (Figs. 6C, 7B).
Cellular immune response in the form of melanomacrophage centres appeared first at
1,113 and 1,518 degree days at the HP and LP sites, respectively (Tables 4 and 5). Many of these
fish also had loose or phagocytosed myxospores within these foci (Tables 4 and 5, Figs. 7C-D).
This evidence of inflammation was present throughout the entire sampling period, but decreased
after 3,675 and 3,053 degree days at the HP and LP farms respectively (Tables 4 and 5).
By 1,400 degree days many pseudocysts appeared to have lost their integrity and
myxospores, disporoblasts, and other undifferentiated cells were visible within and outside of
myocytes (Fig. 7E). Disintegration of the surrounding myofibrils (Fig. 7E) was also notable on
approximately half of these fish. The majority of fish (approximately 80%) having this attribute
were dissected one day post mortem, so most of these effects were probably attributable to
myoliquefaction rather than autolysis. Four fish from the high prevalence site, sampled within 30
min to four h of capture, had immune cells within the affected myocytes. On rare occasions,
macrophages were present within muscle cells that had both degenerated pseudocysts and
myofibril breakdown. However, in general, the most common form of immune response was
inflammation presumably in response to completely degenerated myocytes rather than to intact
myocytes.

13
Discussion
In the present survey, the progression of K. thyrsites infections at two operating commercial sites
having different historical levels of soft-flesh manifestation at harvest is described. Pseudocyst
development, host immune response and infection prevalence from the high prevalence site
showed similarities to previous work at the Pacific Biological research station, located further
South in the Straight of Georgia (Moran et al. 1999a; Moran & Kent 1999), but herein more
sample points and both PCR analysis of multiple tissues and pseudocyst counts were used. All
measures of infection were lower at the historically LP farm. Fillet manifestation results did not
show any indication of change over time, but at the HP farm PCR prevalence and intensity of
infection decreased near the end of the production cycle. At the LP farm, intensity was the only
parameter that clearly decreased. PCR was the most sensitive detection method, detecting higher
numbers of infected fish at earlier sampling times, but, also had false negatives in inverse
proportion to the numbers of muscle tissue sites tested.
Fillet analysis
Pits counts were consistently lower at the LP farm throughout the sampling period ,
thereby confirming the original region based expectation. The values obtained here were higher
than those of industry surveillance records, most likely due to warming during the 10-20 minute
period of sample dissection compared to the rigorous temperature management of a commercial
harvest. A positive correlation between temperature and myoliquefaction has been reported
previously in Pacific whiting, M. productus, infected with K. paniformis (Patashnik et al. 1982).
Although we could distinguish a clear difference in manifestation level between farms, we did
not detect any change over time. Variation in the surface area of fillets from fish ranging from
one to up to 14.5 kg may have impacted the results, but there was no apparent reduction in
unequivocally severe fillets during the second year. Less subjective measures of
myoliquefaction, such as the use of texture analyzers, show good correlation to pit counting
(Dawson-Coates et al. 2003). Although PCR prevalence and pseudocyst density decreased with
time, other changes in pseudocyst development, may have been contributing. For example,
changes in pseudocyst morphology or size, or enzyme production over time were not measured.

14
However, pseudocyst density decreased during the final year within the subset of fish having
high levels of myoliquefaction, was detected in highly which suggests that other factors such as
pseudocyst development or size may have affect the degree of myoliquefaction.
Histological analysis
Intracellular pseudocysts were easily observed in various stages of development but
detection and identification of earlier forms of infection and development proved challenging.
Examination of muscle and blood vessels of younger and more heavily infected fish was
inconclusive with the detection of a few seemingly foreign cells that could not be positively
identified as Kudoa. Morado and Sparks (1986) described a 5-10 µm putative intracellular
infective stage within host phagocytes in both juvenile and mature M. productus. These cells
were described as typically unicellular but occasionally multicellular, and were described from
fish with a range of infection levels including fish having light infections prior to spore
development (Morado & Sparks 1986). Stages representing early infection may be difficult to
observe if they are present in low numbers due to a slow accumulation of infection(s) or if they
transition quickly to the intracellular stage. Identification of early infective and migratory stages
of other myxozoa, such as, Ceratomyxa shasta (Bjork & Bartholomew 2009), Henneguya
ictaluri (Belem & Pote 2001), and Sphaerospora truttae (Holzer, Sommerville & Wootten
2003), have benefited from challenges with high doses of infective actinospores and the
application of in-situ-hybridization techniques.
Once within myocytes, mature myxospores tended to concentrate within the interior of
developing pseudocysts and were surrounded by undifferentiated or sporogonic cells, as
described from most hosts infected with K. thyrsites (e.g. Morado & Sparks 1986; Moran et al.
1999a). The thread-like extensions occasionally observed between the pseudocyst and host cell
cytoplasm can be interpreted as membrane foldings of the primary cell. Using electron
microscopy, Stehr and Whitaker (1986) described microvilli in K. thyrsites from M. productus,
having dimensions of 0.5 µm in width by 0.9 µm in length. Older fish appeared to have larger
pseudocysts, lacking undifferentiated cells and having an eosinophillic fibrous matrix that we did
not observe in pseudocysts from younger fish. It is possible that these differences may provide an
indication about when the fish acquired the infection, but detailed measurements were not within
the scope of this survey. The size of the pseudocysts may also be a function of increased

15
myomere size in larger fish. Counts per mm2 from different regions of the fish were not different,
contrary to observations of mixed Kudoa infections in M. productus (Kabata & Whitaker 1985)
and of K. thyrsites in C. hippurus (Langdon 1991).
Visible evidence of cellular immune response to K. thyrsites appears to be host
dependent. The consistent inflammatory response with melanomacrophage centres and evidence
of phagocytosis observed here was previously reported by Moran and co-authors (1999a), but
Harrell and Scott (1985) reported an absence of inflammation in infected Atlantic Salmon.
Inflammation, caused by K. thyrsites, has been observed in C. hippurus and M. productus
(Langdon, Thorne & Fletcher 1992; Morado & Sparks 1986). No inflammation was observed in
clupeoids, tubesnout Aulorhynchus flavidus (Gill), or mackerel S. scombrus (Langdon et al.
1992; Shaw, Herviot, Devlin & Adamson 1997; Levsen et al. 2008). Other members of the genus
cause inflammation in Bocaccio Sebastes paucispinis (Ayres), White perch Morone Americana
(Gmelin), and Pacific Hake M. productus (Whitaker, Kent & Sakanari 1996; Bunton & Poynton
1991; Morado & Sparks 1986). We did not see any evidence of encapsulation with collagen or
fibroblasts, nor any form of melanisation, such as has been reported from infections of K.
thyrsites, K. paniformis or Kudoa rosenbuschi in hakes M. productus and Merluccius hubbsi
(Marini) (Morado & Sparks 1986; Martone et al. 1999; Stehr & Whitaker 1986; Kabata &
Whitaker 1981). All of these reactions are characteristic responses to myxozoan infections of fish
(Sitjá-Bobadilla 2008).
Loose or uncontained spores and presporogonic stages found both within and between
myocytes appeared to primarily be a post mortem effect given that this was more frequently
observed in fish dissected on the day following sampling. However, the presence of
macrophages within myocytes having loose stages from a small number of fish that were
dissected within hours of capture suggests that this event may occur at a low level within living
fish. Cyst walls are known to dissolve in bullseye puffer Sphoeroides annulantus (Jenyns)
infected with Kudoa dianae and spores travel through the esophageal connective tissue without
eliciting an immune response (Dykova, Avila & Fiala 2002). For K. dianae this observation is
explained as an adaptation to shed spores through the digestive tract (Dykova et al. 2002). At this
time it is not clear whether K. thyrsites stages can spread between muscle cells.
Stehr and Whitaker (1986) described evidence of myoliquefaction in myofibrils in close
proximity to the parasite from tissues collected immediately following euthanization (Morado &
16
Sparks 1986). The same authors also report ‘coagulative necrosis’ of myocytes with the presence
of phagocytes, also supporting that some degree of myomere breakdown occurs while the fish is
alive. Occurrence of myoliquefaction in live hosts has been described, but is rare. Eiras, Júnior,
Sampaio, Robaldo and Abreu (2007) reported severe live myoliquefaction, presumed to have led
to mortality, in a few individuals of farmed South American flatfish Paralichthys orbignyanus
(Valenciennes) due to infections caused by a Myxobolus species. Davies, Andrews, Upton and
Matthews (1998) report myoliquefaction in gobies, presumably caused by a Kudoa sp., but also
may have been caused by secondary invaders. In vivo effects appeared to be limited in our
samples. Dissections from same day only showed mild degeneration within infected myocytes;
only samples collected from heavily infected fish from day 2 had extensive tissue breakdown.
Infection dynamics
Onset of infection showed similarities at both farm sites as well as to previous trials (e.g.
Moran and Kent 1999; Moran et al. 1999a). The first detections between May and June were
within the seasonal infectivity window (April 25th to December 4th) identified by Moran and
Kent (1999). Spring entry trials by Moran and Kent (1999) and Moran et al. (1999a) also
detected infections within two months of entry. Our evidence of first infections (355 and 509
degree days) were similar to the six week detection (approximately 420 degree days) found by
Moran et al. (1999a) by PCR in multiple tissue, including blood. Visually we were able to detect
K. thyrsites in the muscle after 975 and 1,113, but not at 778 degree days, similar to the 1,000
degree days reported by Moran and Kent (1999), but not as early as Moran et al. (1999a) and
Young and Jones (2005) where early stages of cysts were described around 600 - 630 degree
days.
PCR detection of the parasite within blood samples, coinciding with the onset of
infection at both farms, supports a similar pattern of infection as presented by Moran et al.
(1999a). Migratory stages within teleost circulatory systems have been described in several
myxozoans e.g. (Holzer et al. 2003; Bjork & Bartholomew 2009). At the HP farm, detection in
blood did reoccur but not at the same prevalence as the initial detection, possibly indicating a
reduction in new infections in older fish. Most of the fish having positive blood results after
2,265 degree days also had moderate to heavy infections with evidence of inflammation and

17
phagocytosis of spores and therefore at least some of these results may be attributable to late
rather than early stages of infection.
The highest prevalence of infection at the HP farm was between 2,265 and 4,839 degree
days (approximately 9 and 17 months post entry) and was nearly 100%. Moran and Kent (1999)
showed a peak at 2,000 degree days followed by a decline, based on two sampling points from
the subsequent 12 months. We also report a decline at the HP farm, but not until 19 months
(5,329) degree days. The current observation is based on three sample points within a five month
period and is supported by both increased sampling effort by PCR and decreased intensity
counts. These observed declines could be a result of infection resolution, possibly due to the
inflammatory response, or reduced detection due to dispersal of pseudocysts from muscle fibre
hyperplasia as the fish grew (Higgins & Thorpe 1990). Analysis using stereology and counts of
leading edges of pseudocysts from sections taken at multiple depths could be used to calculate
the number of infections per unit volume and extrapolated per individual fish (West 2012), but
were beyond the scope of this survey.
Fish at the LP farm did not reach the infection prevalence or intensities found at either
HP farm or Strait of Georgia fish. Instead, muscle PCR prevalence fluctuated between 37 and 73
% after 2,000 degree days. While exposure is a probable explanation, and the dosages of
infective stages have a documented impact on infection prevalence (Bjork & Bartholomew 2009;
Hallett, Ray, Hurst, Holt, Buckles, Atkinson & Bartholomew 2012), other variables, such as
temperature, have also been linked to increased effects of myxozoan infections of fish (Schmidt-
Posthaus & Wahli 2015). The relationship between exposure and infection has not been studied
in K. thyrsites due to a lack of methods to measure the infective stage in the environment.
Assuming all individuals were eventually exposed, the stable prevalence at the LP farm could be
explained by a population level equilibrium between acquiring and resolving infections. Note
that Moran et al. (1999b) found that some fish maintained in freshwater following a two week
exposure to infective seawater were infected for as long as 23 months. Therefore, once infected,
at least some of the pseudocysts may remain encysted for the duration of the fish’s lifespan. It is
possible that the plateau in prevalence in the LP farm may be due to population level resistance
to new infections after low levels of exposure. This acquired resistance could explain the
apparent decrease in prevalence and intensity seen at the HP farm as well as the decreases
observed by previous studies (Moran & Kent1999; Moran et al. 1999a). Resolution, followed by

18
decreased exposure during the second year seems unlikely given the similarities in infection
dynamics, especially between the HP farm in the Discovery Islands in 2011 and the Georgia
Strait during the mid-1990s. The decrease in prevalence of the putative migratory stages within
the blood supports the argument of population level onset of resistance to new infections.
Observations of resistance against reinfection by myxozoan pathogens have been
reported (Golomazou, Athanassopoulou, Karagouni, Tsagozis, Tsantilas & Vagianou 2006; Foott
& Hedrick 1987). Interactions involving specific and non-specific humoral and cellular
responses have been described from myxozoan infections in various teleosts but have not been
thoroughly investigated (Sitjà-Bobadilla, Schmidt-Posthaus, Wahli, Holland & Secombes 2015).
Acquired resistance against myxozoans, linked to a specific adaptive immune response, has been
demonstrated in turbots Psetta maxima (L) infected with Enteromyxum scophthalmi (Sitjà-
Bobadilla, Palenzuela, Riaza, Macias & Alvarez-Pellitero 2007). Alternatively, age specific
infection susceptibility to myxozoan infections has been described in some freshwater host
parasite relationships, but may specifically be related to post hatch stages (Sollid, Lorz, Stevens
& Bartholomew 2003). In anadromous fish, the effects of smoltification can decrease immune
function (Melingen, Stefansson, Berg & Wergeland 1995; Maule & Shreck 1987), but the
impacts on fish myxozoan interactions has not been explored.
Identification of young compared to mature pseudocysts may help to identify whether
infections are old, new, or mixed. Descriptions of cyst developmental stages compared to fish
age in Kudoa infections of wild fish populations vary with fish hosts and populations. For
example, Heiniger and Adlard (2012) speculate that Kudoa leptacanthae occurs as a recurring
infection in Zoramia spp. based on the presence of both young immature and older mature
plasmodia within members of the population. Similarly, Morado and Sparks (1986) found in
Pacific Hake, M. productus, that presporogonic stages of both K. thyrsites and K. panaformis
were higher in fish under 40 cm. But this study also showed that presporogonic stages were
present in all age classes with older fish having an increased overall prevalence. In contrast,
Langdon et al. (1992) reported a tendency for distinct populations of Mahi mahi, C. hippurus, to
be infected with either sporulated or unsporulated K. thyrsites. Older infected tubesnout, A.
flavidus, had larger cyst sizes than younger fish (Shaw et al. 1997), although this may reflect
reduced growth constraints within smaller myocytes.

19
Regional variation in K. thyrsites prevalence
Regional variation in K. thyrsites infections of Atlantic salmon has been described in
British Columbia with northern Vancouver Island and the West Coast having lower prevalence
than most Discovery Island farms (Karreman et al. 2003; Morrison & MacWilliam 2010a). Our
infection intensity was also higher in the Discovery Island farm but lower than fish from
experimental trials in the Strait of Georgia (Funk et al. 2007; Jones, Forster, Liao & Ikonomou
2012). An epidemiological survey of farms in British Columbia identified a variety of trends
correlated with infection related to environmental parameters, such as, distance from bottom,
bottom slope, salinity, dissolved oxygen as well as stress inducing husbandry practices, such as,
transport and stocking density (Karreman et al. 2003). As of yet, none of these trends have been
methodically investigated. Interestingly, infection prevalence in wild hake sampled along the
coast of British Colombia does not show a parallel regional distribution to infected farmed
salmon. King, McFarlane, Jones, Gilmore and Abbott (2012) report a prevalence of 91.7 % in
summer Queen Charlotte Strait stocks located near less unaffected farms. Using histology this
study demonstrated prevalences ranging from 30.8 % to 91.7 % out of 95 Pacific hake caught in
regions where farmed Atlantic salmon are less affected and 100 % prevalence in fish caught in
the Strait of Georgia were infected (King et al. 2012). It is curious why northern populations of
hake are more infected than farmed Atlantic salmon in the same region, but the migratory ranges
of Hake populations are not well understood.
Although K. thyrsites is a globally dispersed parasite and found in many wild fish
(Whipps & Kent 2006), reports in Atlantic salmon from other regions are limited. Infections
have been documented from Atlantic salmon in France (cf. Harrell & Scott 1985), Galicia, Spain
-- including an anecdotal reference to other infections (Barja & Toranzo 1993), Ireland (Palmer
1995; Palmer 1995 cf. Whipps & Kent 2006), Chile (Lopez & Navarro 2000) and Tasmania
(Munday, Su & Harshbarger 1998). Munday et al. (1998) provided an anecdotal report of
regional variation in Atlantic salmon in Tasmania, which they suggest could be due to
differences in antifouling practices or feed. Regional variation in other affected farmed fish, such
as Mahi mahi, has not been assessed. Levsen et al. (2008) found K. thyrsites infections in wild
Atlantic mackerel, Scomber scombrus, to be more common in stocks from Southwest of Britain
than those from the North Sea and speculated that the mackerel may be acquiring their infections
from the warmer areas of their distribution. Plausible environmental variables include preferable

20
habitat for the invertebrate host(s), water temperature, or host stressors. Alternately some regions
may have more virulent strains.
Conclusions
Infection prevalence and intensity varied between two infected sites with one site having lower
levels of K. thyrsites by all measures, yet populations at both sites had similarities in the overall
presentation of infection. Infections under commercial conditions, especially at the high
prevalence site, corresponded with observations of onset and development of experimental trials
conducted 12 years prior at a nearby research facility. Both populations became infected around
500 degree days. Our high prevalence site reached 100 % saturation within 2,265 degree days
and did not show any indication of resolution until the final six months while the LP site
prevalence, once infected, plateaued around 50 % for the duration of the study. PCR detection
and pseudocyst counts decreased over time but fillet manifestation remained constant. Detection
in the blood occurred near the beginning of infection and again during the second year at sea.
The initial detection in blood at both sites may indicate the presence of a blood borne stage. The
overall patterns of infection provide circumstantial evidence for changes in susceptibility to new
infections over time. Further work characterizing pseudocysts by size or development in
chronically exposed fish or detection of specific antibodies could help determine whether fish
develop immunity.
Acknowledgements
This project was funded by Marine Harvest Canada and an NSERC IRDF fellowship to WL
Marshall. Primer sequences and PCR conditions were designed by and generously shared by
Sean Byrne and Dr. Gary Marty’s group at the BC Ministry of Agriculture and Lands. The
authors are grateful for the assistance of numerous co-op students and staff and the aquaculture
facility.

21
References
Barja, J.L. & Toranzo, A.E. (1993) Myoliquefaction post-mortem caused by the myxosporean
Kudoa thyrsites in reared Atlantic salmon in Spain. Bulletin of the European Association
of Fish Pathologists, 13, 86-86.
Belem, A.M.G. & Pote, L.M. (2001) Portals of entry and systemic localization of proliferative
gill disease orgainsms in channel catfish Ictalurus punctatus. Diseases of Aquatic
Organisms, 48, 37-42.
Bjork, S.J. & Bartholomew, J.L. (2009) Effects of Ceratomyxa shasta dose on a susceptible
strain of rainbow trout and comparatively resistant Chinook and coho salmon. Diseases
of Aquatic Organisms, 86, 29-37.
Bunton, T.E. & Poynton, S.L. (1991) Kudoa sp.(Myxosporea, Multivalvulida) infection in
juvenile white perch, Morone americana (Gmelin): histopathology and spore
morphology. Journal of Fish Diseases, 14, 589-594.
Davies, A.J., Andrews, T., Upton, N.P.D. & Matthews, R.A. (1998) Kudoa as a contributary
cause of muscle necrosis in gobies. Bulletin of the European Association of Fish
Pathologists, 18, 62-66.
Dawson-Coates, J.A., Chase, J.C., Funk, V., Booy, M.H., Haines, L.R., Falkenberg, C.L.,
Whitaker, D.J., Olafson, R.W. & Pearson, T.W. (2003) The relationship between flesh
quality and numbers of Kudoa thyrsites plasmodia and spores found in farmed Atlantic
salmon, Salmo salar L. Journal of Fish Diseases, 26, 451-459.
Dykova, I., Avila, E.J.F. & Fiala, I. (2002) Kudoa dianae sp. n. (Myxosporea: Multivalvulida), a
new parasite of bullseye puffer, Sphoeroides annulantus (Tetraodontiformes:
Tetraodontidae). Folia Parasitol (Praha), 49, 17-23.
Eiras, J., Júnior, J.P., Sampaio, L., Robaldo, R. & Abreu, P. (2007) Myxobolus sp. can cause in
vivo myoliquefaction in the host Paralichthys orbignyanus (Osteichthyes,
Paralichthydae). Diseases of Aquatic Organisms, 77, 255.
Foott, J.S. & Hedrick, R.P. (1987) Seasonal occurence of the infectious stage of proliferative
kidney disease (PKD) and resistance of rainbow trout, Salmo gairdneri Richardson, to
reinfection. Journal of Fish Biology, 30, 447-483.
Funk, V.A., Olafson, R.W., Raap, M., Smith, D., Aitken, L., Haddow, J.D., Wang, D., Dawson-
Coates, J.A., Burke, R.D. & Miller, K.M. (2008) Indentification, characterization and
deduced amino acid sequence of the dominant protease from Kudoa paniformis and K.
thyrisites: A unique cytoplamic cysteine protease. Comparitive Biochemistry and
Physiology Part B, 149, 477-489.
Funk, V.A., Raap, M., Sojonky, K., Jones, S., Robinson, J., Falkenberg, C. & Miller, K.M.
(2007) Development and validation of an RNA- and DNA based quantitative PCR assay
for determination of Kudoa thyrsites infection levels in Atlantic salmon Salmo salar.
Diseases of Aquatic Organisms, 75, 239-249.
Gilchrist, J.D.F. (1924) A protozoal parasite (Chloromyxum thyrsites sp. n.) of the Cape sea-fish,
the "snoek" (Thyrsites atun). Transactions of the Royal Society of South Africa, 11, 263-
273.

22
Golomazou, E., Athanassopoulou, F., Karagouni, E., Tsagozis, P., Tsantilas, H. & Vagianou, S.
(2006) Experimental transmission of Enteromyxum leei Diamant, Lom and Dykova, 1994
in sharpsnout sea bream, Diplodus puntazzo C. and the effect on some innate immune
parameters. Aquaculture, 260, 44-53.
Hallett, S.L., Ray, R.A., Hurst, C.N., Holt, R.A., Buckles, G.R., Atkinson, S.D. & Bartholomew,
J.L. (2012) Density of the waterborne parasite Ceratomyxa shasta and its biological
effects on salmon. Applied and Environmental Microbiology, 78, 3724-3731.
Harrell, L.W. & Scott, T.M. (1985) Kudoa thyrsitis (Gilchrist) (Myxosporea: Multivalvulida) in
Atlantic salmon, Salmo salar L. Journal of Fish Diseases, 8, 329-332.
Heiniger, H. & Adlard, R.D. (2012) Host specificity and local infection dynamics of Kudoa
leptacanthae n. sp. (Multivalvulida: Kudoidae) from the pericardial cavity of two
Zoramia spp. (Perciformes: Apogonidae) at Lizard Island lagoon, Queensland, Australia.
Parasitology International, 61, 697-706.
Higgins, P.J. & Thorpe, J.E. (1990) Hyperplasia and hypertrophy in the growth of skeletal
muscle in juvenile Atlantic salmon, Salmo salar L. Journal of Fish Biology, 37, 505-515.
Holzer, A.S., Sommerville, C. & Wootten, R. (2003) Tracing the route of Sphaerospora truttae
from the entry locus to the target organ of the host, Salmo salar L., using an optimized
and specific in situ hybridization technique. Journal of Fish Diseases, 26, 647-655.
Jones, S.R., Forster, I., Liao, X. & Ikonomou, M.G. (2012) Dietary nicarbazin reduces
prevalence and severity of Kudoa thyrsites (Myxosporea: Multivalvulida) in Atlantic
salmon Salmo salar post-smolts. Aquaculture, 342, 1-6.
Kabata, Z. & Whitaker, D. (1985) Parasites as a limiting factor in exploitation of Pacific whiting,
Merluccius productus. Marine Fisheries Review, 47, 55-59.
Kabata, Z. & Whitaker, D.J. (1981) Two species of Kudoa (Myxosporea: Multivalvulida)
parasitic in the flesh of Merluccius productus (Ayres, 1855) (Pisces: Teleostei) in the
Canadian Pacific. Canadian Journal of Zoology, 59, 2085-2091.
Kabata, Z., Whitaker, D.J. & Bagshaw, J.W. (1986) Kudoa thyrsitis (Gilchrist) (Myxosporea:
Multivalvulida) in coho salmon, Oncorhynchus kisutch (Walbaum). Canadian Journal of
Zoology, 64, 1038-1040.
Karreman, G., Saksida, S., Jones, S. & Stephen, C. (2003) Reducing the impact of Kudoa
thyrsites in farmed Atlantic salmon in British Columbia: generating testable hypotheses.
In, Final Report submitted to the BCSFA.
Kent, M.L., Andree, K.B., Barhtolomew, J.L., El-Matbouli, M., Desser, S.S., Devlin, R.H., Feist,
S.W., Hedrick, R.P., Hoffman, R.W., Khattra, J., Hallett, S.L., Lester, R.J.G., Longshaw,
M., Palenzeula, O., Siddall, M.E. & Xiao, C. (2001) Recent advances in our knowledge
of the Myxozoa. Journal of Eukaryotic Microbiology, 48, 395-413.
King, J.R., Mcfarlane, G.A., Jones, S.R., Gilmore, S.R. & Abbott, C.L. (2012) Stock delineation
of migratory and resident Pacific hake in Canadian waters. Fisheries Research, 114, 19-
30.
Langdon, J.S. (1991) Myoliquefaction post-mortem ('milky flesh') due to Kudoa thyrsites
(Gilchrist) (Myxosporea: Multivalvulida) in mahi mahi, Coryphaena hippurus L. Journal
of Fish Diseases, 14, 45-54.
Langdon, J.S., Thorne, T. & Fletcher, W.J. (1992) Reservoir hosts and new clupeoid host records
for the myoliquefactive myxosporean parasite Kudoa thyrsites (Gilchrist). Journal of
Fish Diseases, 15, 459-471.

23
Levsen, A., Jørgensen, A. & Mo, T.A. (2008) Occurrence of postmortem myoliquefactive
kudoosis in Atlantic mackerel, Scomber scombrus L., from the North Sea. Journal of
Fish Diseases, 31, 601-611.
Lopez, J.C. & Navarro, J. (2000) Descripción de casos clínicos producidos por nuevos agentes
patógenos de importancia en salmons de cultivo en Chile. In: XI Congreso de Medicina
Veterinaria Universidad de Chile. Jornadas de Salmonicultura, 25-27 de Octubre, Puerto
Varas, Chile.
Martone, C.B., Spivak, E., Busconi, L., Folco, E.J.E. & Sánchez, J.J. (1999) A cysteine protease
from myxosporean degrades host myofibrils in vitro. Comparative Biochemistry and
Physiology Part B: Biochemistry and Molecular Biology, 123, 267-272.
Maule, A.G. & Shreck, C.B. (1987) Changes in the immune system of coho salmon
(Oncorhynchus kisutch) during parr-to-smolt transformation and after implantation of
cortisol. Canadian Journal of Fisheries and Aquatic Sciences, 44, 161-166.
Melingen, G.O., Stefansson, S.O., Berg, A. & Wergeland, H.I. (1995) Changes in serum protein
and IgM concentration during smolting and early post-smolt period in vaccinated and
unvaccinated Atlantic salmon (Salmo salar). Fish and Shellfish Immunology, 5, 211-221.
Morado, J.F. & Sparks, A. (1986) Observations on the host-parasite relations of the Pacific
whiting, Merluccius productus (Ayres), and two myxosporean parasites, Kudoa thyrsitis
(Gilchrist, 1924) and K. paniformis Kabata & Whitaker, 1981. Journal of Fish Diseases,
9, 445-455.
Moran, J.D.W. & Kent, M.L. (1999) Kudoa thyrsites (Myxozoa: Myxosporea) infections in pen-
reared Atlantic Salmon in the Northeast Pacific Ocean with a survey of potential
nonsalmonid reservoir hosts. Journal of Aquatic Animal Health, 11, 101-109.
Moran, J.D.W., Margolis, L., Webster, J.M. & Kent, M.L. (1999a) Development of Kudoa
thyrsites (Myxozoa:Mxosporea) in netpen-reared Atlantic salmon determined by light
microscopy and a polymerase chain reaction test. Diseases of Aquatic Organisms, 37,
185-193.
Moran, J.D.W., Whitaker, D.J. & Kent, M.L. (1999b) Natural and laboratory transmission of the
marine myxozoan parasite Kudoa thyrsites to Atlantic Salmon. Journal of Aquatic
Animal Health, 11, 110-115.
Moran, J.D.W., Whitaker, D.J. & Kent, M.L. (1999c) A review of the myxosporean genus
Kudoa Meglitsch, 1947, and its impact on the international aquaculture industry and
commercial fisheries. Aquaculture, 172, 163-196.
Morrison, D. & Macwilliam, T. (2010a) Kudoa thyrsites: What do farmers think? In: Kudoa
thyrsites workshop: Current knowledge of Myxozoa biology, host-pathogen interaction,
diagnostic methods, and impact on fish farm and fisheries industry., Campbell River.
Morrison, D. & Macwilliam, T. (2010b) Kudoa thyrsites: What do farmers think? In: Kudoa
thyrsites workshop: Current knowledge of Myxozoa biology, host pathogen interaction,
diagnostic methods, and impact on the fish farm and fisheries industry,, Campbell River.
Munday, B.L., Su, X.-Q. & Harshbarger, J.C. (1998) A survey of product defects in Tasmanian
Atlantic salmon (Salmo salar). Aquaculture, 169, 297-302.
Palmer, R. (1995) Kudoa in Ireland. In: Abstracts book, European Association of Fish
Pathologists, Seventh international conference" Diseases of Fish and Shellfish, p. 132.
Patashnik, M., Groninger, H.S., Barnett, J., Kudo, G. & Koury, B. (1982) Pacific whiting,
Merluccius productus: I. Abnormal muscle texture caused by myxosporidian-induced
proteolysis. Marine Fisheries Review, 44, 1-12.

24
Samaranayaka, A.G.P., Ho, T.C.W. & Li-Chan, E.C.Y. (2007) Correlation of Kudoa spore
counts with proteolytic activity and texture of fish mince from Pacific hake (Merluccius
productus). Journal of Aquatic Food Product Technology, 15, 75-93.
Schmidt-Posthaus, H. & Wahli, T. (2015) Host and environmental influences on development of
disease. In: Myxozoan evolution, ecology and development (ed. by B. Okamura, J.
Bartholomew & A. Gruhl), pp. 281-293. Springer International Publishing, Switzerland.
Shaw, R.W., Herviot, D.M.L., Devlin, R.H. & Adamson, M.L. (1997) Infection of Aulorhynchus
flavidus (Gill) (Osteichthyes: Gasterosteiformes) by Kudoa thyrsites (Gilchrist)
(Myxosporea: Multivalvulida). Journal of Parasitology, 83, 810-814.
Sitjá-Bobadilla, A. (2008) Fish immune response to myxozoan parasites. Parasite, 15, 420-425.
Sitjà-Bobadilla, A. & Palenzuela, O. (2012) Enteromyxum species. In: Fish Parasites:
Pathobiology and Protection. (ed. by P.T.K. Woo & K. Buchmann), pp. 163-176. CABI.
Sitjà-Bobadilla, A., Palenzuela, O., Riaza, A., Macias, M.A. & Alvarez-Pellitero, P. (2007)
Protective acquired immunity to Enteromyxum scophthalmi (Myxozoa) is related to
specific antibodies in Psetta maxima (L.)(Teleostei). Scandinavian Journal of
Immunology, 66, 26-34.
Sitjà-Bobadilla, A., Schmidt-Posthaus, H., Wahli, T., Holland, J.W. & Secombes, C.J. (2015)
Fish immune responses to Myxozoan infections. In: Myxozoan evolution, ecology and
development (ed. by B. Okamura, J.L. Bartholemew & A. Gruhl), pp. 253-280. Springer
International Publishing, Switzerland.
Sollid, S.A., Lorz, H.V., Stevens, D.G. & Bartholomew, J.L. (2003) Age-dependent
susceptibility of Chinook salmon to Myxobolus cerebralis and effects of sustained
parasite challenges. Journal of Aquatic Animal Health, 15, 136-146.
St-Hilaire, S., Hill, M., Kent, M.L., Whitaker, D.J. & Ribble, C. (1997) A comparitive study of
muscle texture and intensity of Kudoa thyrsites infection in farm-reared Atlantic salmon
Salmo salar on the Pacific coast of Canada. Diseases of Aquatic Organisms, 31, 221-225.
Stehr, C. & Whitaker, D.J. (1986) Host-parasite interaction of the myxosporeans Kudoa
paniformis Kabata & Whitaker, 1981 and Kudoa thyrsites (Gilchrist, 1924) in the muscle
of Pacific whiting, Merluccius productus (Ayres): an ultrastructural study Journal of Fish
Diseases, 9, 505-517.
West, M. (2012) Introduction to stereology. In: Basic Stereology for Biologists and
Neuroscientists. Cold Spring Harbour Laboratory Press.
Whipps, C. & Kent, M. (2006) Phylogeography of the cosmopolitan marine parasite Kudoa
thyrsites (Myxozoa: Myxosporea). Journal of Eukaryotic Microbiology, 53, 364-373.
Whitaker, D.J., Kent, M.L. & Sakanari, J.A. (1996) Kudoa miniauriculata n. sp. (Myxozoa,
Myxosporea) from the musculature of Bocaccio (Sebastes paucispinis) from California.
Journal of Parasitology, 82, 312-315.
Willis, A. (1949) On the vegetative forms and life history of Chloromyxum thyrsites Gilchrist
and its doubtful systematic position. Australian Journal of Biological Sciences, 2, 379-
398.
Yokoyama, H. & Masuda, K. (2001) Kudoa sp.(Myxozoa) causing a post-mortem
myoliquefaction of North-Pacific giant octopus Paroctopus dofleini (Cephalopoda:
Octopodidae). Bulletin- European Association of Fish Pathologists, 21, 266-268.
Young, C.A. & Jones, S.R.M. (2005) Epitopes associated with mature spores not recognized on
Kudoa thyrsites from recently infected Atlantic salmon smolts. Diseases of Aquatic
Organisms, 63, 267-271.

25
Zhou, L.S. & Li-Chan, E.C.Y. (2009) Effect of Kudoa spores, endogenous protease activity and
frozen storage on cokked texture of minced Pacific hake (Merluccius productus). Food
Chemistry, 113, 1076-1082.

26
Figure Legends
Figure 1. Muscle tissue sites selected for Atlantic salmon sample collection. Samples from the
left and right side of fish are labeled as A, B, C, D and E, F, G, H, respectively.
Figure 2. Frequency histograms showing the percentage of fillets belonging to each ‘K’ (Kudoa
thyrsites) category at high (n=353) and low (n=181) prevalence farms throughout the entire fillet
sampling period.
Figure 3. Percentage of type two error (false negatives) based on cumulative PCR results with
increasing numbers of tested tissue samples. Values are based on PCR results from 19 samplings
of 30 fish from the high prevalence farm. Fish were considered true negatives for Kudoa
thyrsites if all eight tissue sites were PCR negative. Bars represent standard error over 19
samplings.
Figure 4. Prevalence of infection of Kudoa thyrsites by degree day at high and low prevalence
farms based on PCR analysis of four tissue sites per fish. N = 30 fish per sampling, except 15
fish at 355 degree days at the LP farm.
Figure 5. Mean intensity of infection of Kudoa thyrsites at HP and LP farms over increasing
degree days post entry measured as the number of pseudocysts counted per mm2 from cross
sections of up to 10 randomly chosen PCR positive fish per sampling time. N = 147 and 109 for
each farm, respectively. Bars represent standard error.
Figure 6. Early development of pseudocysts (A-D) and putative migratory parasite cells (E-H).
A-B. Young pseudocysts containing mono- and bi-nucleate cells (arrows). C. Cross section of a
developing pseudocyst microvilli-like extensions (arrowheads) and mature spores with refractile
polar capsules (small arrows) near center and undifferentiated cells near exterior. Note deeply
stained pycnotic nuclei of capsulogenic cells to left of asterisks D. Longitudinal section of a
developing pseudocyst filled mostly with undifferentiated cells, but also containing young spores
with non-refractile, eosinophilic polar capsules. Myxospores are marked with asterisks and

27
arrowheads point to the interface between the edge of the pseudocyst and the host myocyte. E.
Unidentified and seemingly multinucleate cell underlying dermal tissue (arrow) of a heavily
infected fish at 1,676 degree days. F. Unidentified multinucleate cell within blood vessel (arrow)
of a heavily infected fish at 1,113 degree days. G. Multinucleate cell (arrow) with resemblance to
undifferentiated cells typically within pseudocysts. H. Unidentified multinucleate cell (arrow) in
intracellular space between myocytes from a heavily infected fish at 1,113 degree days. A-B, E-
H are Giemsa stained and C-D are H&E stained. Scale bars = 10 µm.
Figure 7. Ongoing development of pseudocysts, cellular host response and myoliquefaction. A.
Pseudocyst localized within myocyte of a fish sampled at 2,013 degree days. Note
undifferentiated cells along periphery. B. Large pseudocyst from a fish sampled at 6,389 degree
days. Note the absence of undifferentiated cells and the presence of fibrous eosinophilic material
(asterisks) between mature spores with pale mauve refractile polar capsules and deeply stained
pycnotic capsulogenic nuclei. C. Inflammatory response in a fish at 1,676 degree days with
visible spores (arrows). Inset (D) shows an engulfed spore within a macrophage. E. Pseudocyst
has lost its integrity and spores and undifferentiated cells (arrow) are loose within the myocyte.
Note that myofibrils are degenerating. This sample was taken 1 day post mortem from a fish
sampled at 1,676 degree days. All material is Giemsa stained except figure B. Scale bars = 50
µm (A, B); 20 µm (C); and 10 µm (D, E).
28
Tables and Figures
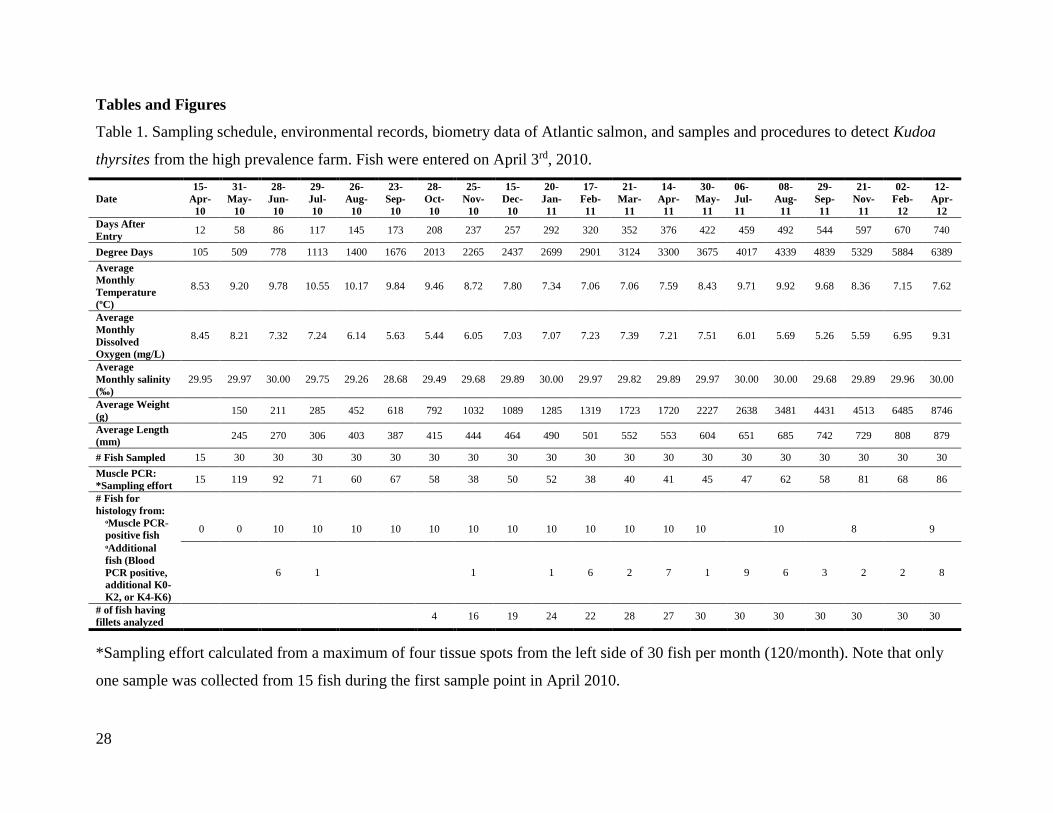
Table 1. Sampling schedule, environmental records, biometry data of Atlantic salmon, and samples and procedures to detect Kudoa
thyrsites from the high prevalence farm. Fish were entered on April 3rd, 2010.
Date
15-
Apr-
10
31-
May-
10
28-
Jun-
10
29-
Jul-
10
26-
Aug-
10
23-
Sep-
10
28-
Oct-
10
25-
Nov-
10
15-
Dec-
10
20-
Jan-
11
17-
Feb-
11
21-
Mar-
11
14-
Apr-
11
30-
May-
11
06-
Jul-
11
08-
Aug-
11
29-
Sep-
11
21-
Nov-
11
02-
Feb-
12
12-
Apr-
12
Days After
Entry 12 58 86 117 145 173 208 237 257 292 320 352 376 422 459 492 544 597 670 740
Degree Days 105 509 778 1113 1400 1676 2013 2265 2437 2699 2901 3124 3300 3675 4017 4339 4839 5329 5884 6389
Average
Monthly
Temperature
(ºC)
8.53 9.20 9.78 10.55 10.17 9.84 9.46 8.72 7.80 7.34 7.06 7.06 7.59 8.43 9.71 9.92 9.68 8.36 7.15 7.62
Average
Monthly
Dissolved
Oxygen (mg/L)
8.45 8.21 7.32 7.24 6.14 5.63 5.44 6.05 7.03 7.07 7.23 7.39 7.21 7.51 6.01 5.69 5.26 5.59 6.95 9.31
Average
Monthly salinity
(‰)
29.95 29.97 30.00 29.75 29.26 28.68 29.49 29.68 29.89 30.00 29.97 29.82 29.89 29.97 30.00 30.00 29.68 29.89 29.96 30.00
Average Weight
(g) 150 211 285 452 618 792 1032 1089 1285 1319 1723 1720 2227 2638 3481 4431 4513 6485 8746
Average Length
(mm) 245 270 306 403 387 415 444 464 490 501 552 553 604 651 685 742 729 808 879
# Fish Sampled 15 30 30 30 30 30 30 30 30 30 30 30 30 30 30 30 30 30 30 30
Muscle PCR:
*Sampling effort 15 119 92 71 60 67 58 38 50 52 38 40 41 45 47 62 58 81 68 86
# Fish for
histology from:
Muscle PCR-
positive fish 0 0 10 10 10 10 10 10 10 10 10 10 10 10 10 8 9
Additional
fish (Blood
PCR positive,
additional K0-
K2, or K4-K6)
6 1 1 1 6 2 7 1 9 6 3 2 2 8
# of fish having
fillets analyzed 4 16 19 24 22 28 27 30 30 30 30 30 30 30
*Sampling effort calculated from a maximum of four tissue spots from the left side of 30 fish per month (120/month). Note that only
one sample was collected from 15 fish during the first sample point in April 2010.

29
Table 2. Sampling schedule, environmental records, biometry data of Atlantic salmon, and samples and procedures to detect Kudoa
thyrsites from the low prevalence farm (H hatchery; 1 first sea-site; and 2 second sea-site). Fish were entered on May 16th 2010.
Date 28-
Apr- 10
23-Jun-10
20-Jul-10
24-Aug-10
20-Sep-10
20-Oct-10
22-Nov-
10
13-Dec-10
12-Jan-11
21-Feb-11
28-Mar-
11
11-Apr-11
16-May-
11
20-Jun-11
25-Jul- 11
29-Aug-11
24-Oct-11
09-Jan-12
27-Mar-
12
Site H 1 1 1 1 1 1 1 1 2 2 2 2 2 2 2 2 2 2
Days After Entry 0 37 65 100 127 157 190 211 241 281 316 330 365 400 435 470 526 603 681
Degree Days 0 355 622 975 1236 1518 1804 1962 2176 2448 2682 2783 3053 3369 3708 4068 4584 5172 5694
Average Monthly
Temperature (ºC) 9.67 10.00 10.07 9.40 9.18 7.99 7.39 6.83 6.68 6.85 7.30 8.54 9.47 9.69 10.05 9.00 6.80 7.06
Average Monthly
Dissolved Oxygen
(mg/L)
9.26 8.38 7.10 6.08 6.84 7.88 7.95 8.23 8.87 9.42 9.21 9.65 9.45 8.23 7.18 7.35 6.64 8.59
Average Monthly
salinity (ppt) 33.14 34.00 34.00 34.00 34.00 34.00 34.00 33.97 34.00 34.00 34.00 34.00 33.57 33.28 33.57 33.09 30.86 33.00
Average Weight
(g) 43.9 122 149 244 359 468 410 475 718 783 893 1063 1240 1850 2319 2045 3632 5230
Average Length
(mm) 163 225 210 241 281 315 354 343 356 411 429 444 470 498 565 592 580 676 759
# Fish Sampled 30 15 30 30 30 30 30 30 30 30 30 30 30 30 30 30 30 30 30
Muscle PCR:
*Sampling effort
30
60
107
102
96
102
81
75
89
79
86
85
62
86
88
81
89
91
92
# Fish for
histology from:
Muscle PCR-
positive fish
Additional fish
(Blood PCR
positive,)
0 0 0 4 4 3 10 10 9 10 10 9 8 9 0
9
6 0 6
1
# of fish having
fillets analyzed 2 5 9 15 0 30 30 30 30 30
*Sampling effort calculated from a maximum of four sites from the left side of 30 fish per month (120/month). Exceptions are the first
two sample points where only one sample was analyzed per fish during the first sample point only 15 fish were collected in June.
** Pseudocyst densities were also measured for all blood PCR positive fish.

30
Table 3. Nested PCR primer sequences
Amplification Sequence 5’-3’
First Forward
Reverse
AGA AAT ACC GGA GTA GAC CGT
TGA TCG TCT TCG AAC CTC CT
Second Forward
Reverse
CGT AGT TGG ATT ACA AAA GCT CTG
GTT CCA TGC TAT AAC ATT CAA GC

31
Table 4. Histological observations in Kudoa thrysites PCR positive fish in blood (all) and in muscle (10 randomly selected, except *
and ** with 8 and 9 fish) from the high prevalence Atlantic salmon farm.
Degree
Days
Blood PCR Positive Fish Muscle PCR Positive Fish
PCR
Positive
Fish
(no.)
Prevalence
by Histology
(%)
Fish with
Inflammation
(%)
Prevalence by
Histology
(%)
Fish with
Inflammation
(%)
Spores in
Inflammatory
Foci (%)
788 7 0 - 0 0 0
1113 1 0 - 40 20 0
1400 0 - - 100 40 10
1676 0 - - 100 90 80
2013 0 - - 100 60 30
2265 1 100 100 90 90 60
2437 0 - - 90 80 40
2699 1 100 100 90 80 30
2901 1 100 100 90 70 10
3124 2 100 50 80 50 30
3300 5 80 80 90 70 40
3675 4 100 50 50 20 10
4017 4 100 100 - - -
4339 1 100 100 80 60 20
4839 3 67 33 - - -
5329 0 - - 88* 0 0
5884 2 100 100 - - -
6389 1 0 - 67** 30 10

32
Table 5. Corresponding histological observations on blood positive fish and randomly selected PCR positive fish sampled from the
low prevalence site.
Degree
Days
Blood PCR Positive Fish Muscle PCR Positive Fish
PCR
Positive
Fish
(no.)
*Prevalence by
Histology %
PCR Positive
Fish (no.
examined)
Prevalence by
Histology (%)
Fish with
Inflammation
(%)
Spores in
Inflammatory
Foci (%)
975 2 50 4 50 0 0
1236 0 - 4 100 0 0
1518 0 - 3 100 33 0
1804 0 - 10 100 60 20
1962 0 - 10 90 60 30
2176 0 - 9 67 44 11
2448 0 - 10 60 60 10
2682 1 100 10 50 40 20
2783 1 100 9 67 67 33
3053 0 - 10 50 20 0
3369 1 100 9 44 33 0
4068 2 50 9 44 33 0
4584 0 - 6 33 33 17
5694 0 - 6 33 67 0
*No inflammation was observed on blood positive fish.

33
Figure 1.

34
Figure 2.
0
0.2
0.4
0.6
K0 K1 K2 K3 K4 K5 K6
Fre
qu
ency
K-score
High Prevalence Site
0
0.2
0.4
0.6
K0 K1 K2 K3 K4 K5 K6
Fre
qu
ency
K-score
Low Prevalence Site

35
Figure 3.
y = -16.73ln(x) + 33.055
R² = 0.9982
0
5
10
15
20
25
30
35
40
45
0 2 4 6 8
Per
cen
tag
e o
f fa
lse
neg
ati
ves
Number of tissue samples tested
36
Figure 4.
0
10
20
30
40
50
60
70
80
90
100
0 1000 2000 3000 4000 5000 6000 7000
K.
thyr
site
s in
fect
ion
pre
va
len
ce (
%)
Degree Days
High Prevalence Farm
Low Prevalence Farm

37
Figure 5.
1.E-05
1.E-04
1.E-03
1.E-02
1.E-01
1.E+00
750 1750 2750 3750 4750 5750 6750
K.
thyr
site
s i
nfe
ctio
n i
nte
nsi
ty
(Pse
ud
ocy
sts
per
mm
2)
Degree Days
High Prevalence
Farm
Low Prevalence
Farm

38
Figure 6.

39
Figure 7.

40
Supplementary Files
Table S1. Fillet manifestation categories due to Kudoa thyrsites from Atlantic salmon fillets collected at sampling times having 27 or
more fish greater than 1 kg from each farm.
Site High Prevalence Low Prevalence
Sampling Date 21-Mar 2011
14-Apr
2011
30-May 2011
06-Jul
2011
08-Aug
2011
29-Sept 2011
21-Nov 2011
02-Feb
2012
12-Apr
2012
25- Jul
2011
29-Aug
2011
24-Oct
2011
09-Jan
2012
27-Mar 2012
Fillets Collected (#) 28 27 30 30 30 30 30 30 30 30 30 30 30 30
K0: no pitting (%) 21 19 13 43 33 33 43 27 23 70 90 63 40 67
K1: 1-10 pits (%) 43 33 40 17 30 33 27 33 33 17 7 20 37 23
K2: 11-20 pits (%) 4 11 13 7 7 0 0 7 3 0 0 10 7 3
K3: 21-40 pits (%) 7 0 7 10 3 10 13 3 3 3 3 0 13 7
K4: >40 pits (%) 14 15 7 7 7 7 13 20 30 7 0 3 3 0
K5: severe pitting (%) 11 19 20 13 17 17 3 10 7 3 0 3 0 0
K6: liquefied (%) 0 4 0 3 3 0 0 0 0 0 0 0 0 0

41
Figure S1. Proportion of fillets belonging to unaffected (K0), lightly infected (K1/K2), or
heavily infected (>K3) Kudoa thrysites categories according to the number of days after
sampling. Averages were calculated from all fish analyzed within the final six sampling times at
the high prevalence Atlantic salmon farm (n = 180 fillets). Bars represent standard error.
0.00
0.10
0.20
0.30
0.40
0.50
0.60
0.70
0.80
Day 1 Day 4 Day 7
Pro
po
rtio
n
Day Examined (post sampling)
K0
K1/K2
>K3
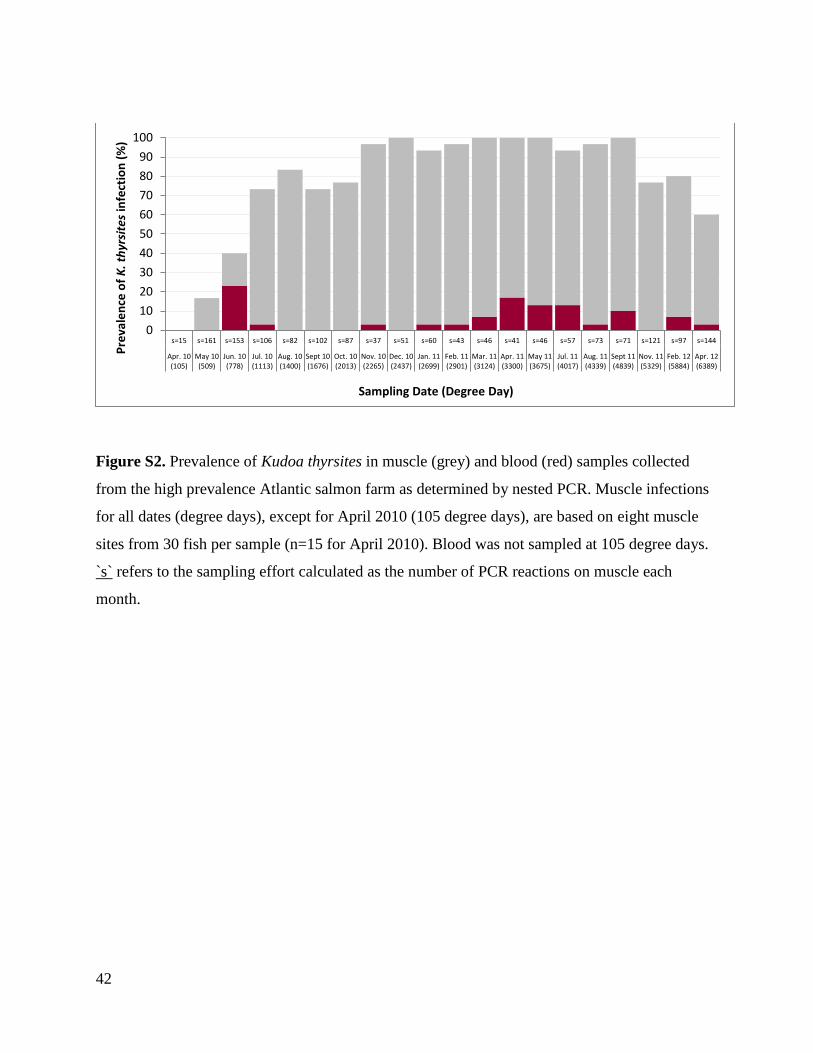
42
Figure S2. Prevalence of Kudoa thyrsites in muscle (grey) and blood (red) samples collected
from the high prevalence Atlantic salmon farm as determined by nested PCR. Muscle infections
for all dates (degree days), except for April 2010 (105 degree days), are based on eight muscle
sites from 30 fish per sample (n=15 for April 2010). Blood was not sampled at 105 degree days.
`s` refers to the sampling effort calculated as the number of PCR reactions on muscle each
month.
0
10
20
30
40
50
60
70
80
90
100
s=15 s=161 s=153 s=106 s=82 s=102 s=87 s=37 s=51 s=60 s=43 s=46 s=41 s=46 s=57 s=73 s=71 s=121 s=97 s=144
Apr. 10(105)
May 10(509)
Jun. 10(778)
Jul. 10(1113)
Aug. 10(1400)
Sept 10(1676)
Oct. 10(2013)
Nov. 10(2265)
Dec. 10(2437)
Jan. 11(2699)
Feb. 11(2901)
Mar. 11(3124)
Apr. 11(3300)
May 11(3675)
Jul. 11(4017)
Aug. 11(4339)
Sept 11(4839)
Nov. 11(5329)
Feb. 12(5884)
Apr. 12(6389)
Pre
vale
nce
of
K.
thyr
site
s in
fect
ion
(%
)
Sampling Date (Degree Day)

43
Figure S3. Mean number of pseudocysts of Kudoa thyrsites per mm2 from fish belonging to high
(K4-K6) or low (K0-K2) fillet manifestation categories with increasing degree days. Bars
represent standard error of the mean and asterisks denote degree days with significant pairwise
difference in pseudocyst counts from fish with high manifestation levels (A) compared to those
with low levels (B) (Kruskal-Wallis AOV).
0
0.05
0.1
0.15
0.2
0.25
0.3
0.35
0.4
0.45
0.5
Pse
ud
ocy
st p
er
mm
2
Degree Days (n=number of fish))
Low (K0-K2)
High (K4-K6)
*A
*B*B