long-term dynamics of dissolved organic carbon: implications for drinking water supply
TRANSCRIPT

Science of the Total Environment 432 (2012) 1–11
Contents lists available at SciVerse ScienceDirect
Science of the Total Environment
j ourna l homepage: www.e lsev ie r .com/ locate /sc i totenv
Long-term dynamics of dissolved organic carbon: Implications for drinkingwater supply
José L.J. Ledesma ⁎, Stephan J. Köhler, Martyn N. FutterDepartment of Aquatic Sciences and Assessment, Swedish University of Agricultural Sciences (SLU), P.O. Box 7050, 750 07 Uppsala, Sweden
⁎ Corresponding author at: Department of Aquatic Scish University of Agricultural Sciences, P.O. Box 7050, 7Tel.:+46 18 67 30 59.
E-mail address: [email protected] (J.L.J. Ledesma)
0048-9697/$ – see front matter © 2012 Elsevier B.V. Alldoi:10.1016/j.scitotenv.2012.05.071
a b s t r a c t
a r t i c l e i n f oArticle history:Received 13 February 2012Received in revised form 16 May 2012Accepted 21 May 2012Available online xxxx
Keywords:DOCOrganic carbonDrinking waterModelingBorealINCA
Surface waters are the main source of drinking water in many regions. Increasing organic carbon concentra-tions are a cause for concern in Nordic countries since both dissolved and particulate organic carbon cantransport contaminants and adversely affect drinking water treatment processes. We present a long-termstudy of dynamics of total (particulate and dissolved) organic carbon (TOC) concentrations in the RiverFyris. This river supplies drinking water to approximately 200000 people in Uppsala, Sweden. The RiverFyris is a main tributary to Lake Mälaren, which supplies drinking water to approximately 2 million peoplein the greater Stockholm area. Utilities responsible for drinking water supply in both Uppsala and Stockholmhave expressed concerns about possible increases in TOC. We evaluate organic carbon dynamics within theFyris catchment by calculating areal mass exports using observed TOC concentrations and modeled flowsand by modeling dissolved organic carbon (as a proxy for TOC) using the dynamic, process based INCA-Cmodel. Exports of TOC from the catchment ranged from 0.8 to 5.8 g m−2 year−1 in the period 1995–2010.The variation in annual exports was related to climatic variability which influenced seasonality and amountof runoff. Exports and discharge uncoupled at the end of 2008. A dramatic increase in TOC concentrations wasobserved in 2009, which gradually declined in 2010–2011. INCA-C successfully reproduced the intra- andinter-annual variation in concentrations during 1996–2008 and 2010–2011 but failed to capture the anoma-lous increase in 2009. We evaluated a number of hypotheses to explain the anomaly in 2009 TOC values, ul-timately none proved satisfactory. We draw two main conclusions: there is at least one unknown orunmeasured process controlling or influencing surface water TOC and INCA-C can be used as part of thedecision-making process for current and future use of rivers for drinking water supply.
© 2012 Elsevier B.V. All rights reserved.
1. Introduction
Concentrations of dissolved organic carbon (DOC) are increasing insurface waters across Europe, especially in Nordic countries (Hongve etal., 2004) and eastern North America (Monteith et al., 2007). The causesfor this increase are still not clear, although somemechanisms have beensuggested. Futter et al. (2009),Monteith et al. (2007) and Skjelkvåle et al.(2005) found correlations between increasing surface water DOC con-centrations and declines in sulfate deposition. Changes in hydrologyand temperature related to climate change (Köhler et al., 2008; Laudonet al., 2004) and changes in land use (Curtis, 1997; Mattsson et al.,2005) have been also reported as a cause of increased surface waterDOC concentrations. It has been suggested that the two main factors be-hind the increasing DOC concentrations in Swedish surface waters aredecreases in sulfate deposition and changes in flow (Erlandsson et al.,2008).
iences and Assessment, Swed-50 07 Uppsala, Sweden.
.
rights reserved.
In many parts of the world, including Sweden, surface waters areused for drinking water supply. Contaminants and toxic substancesmust be removed before water is suitable for human consumption.While DOC is not toxic itself, it can transport contaminants andtoxic compounds. There are several ways in which DOC interfereswith surfaces waters destined for drinking consumption. It is a pre-cursor of trihalomethanes (THM), a group of compounds with poten-tial carcinogenic and mutagenic properties (Chow et al., 2003). DOCinfluences the solubility, mobility and, as a result, the bioavailabilityof toxic metals such as mercury (Ravichandran, 2004), copper(Ashworth and Alloway, 2007) and lead (Klaminder et al., 2006).DOC has also the capability to bind organic pollutants (Dawson etal., 2009).
Humic substances are recalcitrant organic acids derivedmainly fromdetrital plant material in soils, but also from the growth of algae andother microorganisms in the water column or benthos (Miller et al.,2009) and they can make up more than 80% of the dissolved organicmatter (DOM) in some wetlands (Mladenov et al., 2005). Lakes withhigh DOC content show a yellow to brown coloration, which is a typicalcharacteristic of humic substances, responsible for the ‘water color’.Historically, water color was measured by comparison to dissolved

2 J.LJ. Ledesma et al. / Science of the Total Environment 432 (2012) 1–11
platinum standards (mg Pt L−1). Today, color is usually measured aslight absorption of 0.45 μm filtered water at 420 nm in a 5 cm cuvette.Humic substances in DOC can cause secondary problems such as tasteand odor problems associated with excess microorganism growth(Löfgren et al., 2003). Furthermore, increases in DOC concentrationscan adversely affect the functioning of water treatment plants by inter-fering in process selection, design and operation (Eikebrokk et al.,2004).
Total organic carbon (TOC) is the sumof DOC andparticulate organiccarbon (POC), and both terms are routinely used to describe organiccarbon in surface waters. In an experiment carried out in Norway,Eikebrokk et al. (2004) found that residual TOC increased by 26%when water color increased from 20 to 35 mg Pt L−1. Flocculation andfiltration processes needed more substrates and cycles to obtain thesame purification. Other studies have found correlations betweencolor and DOC (Weyhenmeyer et al., 2004). These results suggest in-creased costs for water treatment when color and DOC are higher. Theproblem of DOC removal from natural waters is especially importantin Sweden, where 50% of the population drinks water originating fromsurface waters (Löfgren et al., 2003).
Several models of DOC dynamics in both terrestrial and aquatic en-vironments have been developed. Simple models have been used tosimulate the effects of snowmelt on DOC export (Boyer et al., 2000),study carbon processing in lakes (Hanson et al., 2004) and estimate ex-port coefficients of DOC to lakes (Canham et al., 2004). More detailedprocess-based models have been developed to predict soil water DOCconcentrations (Lumsdon et al., 2005; Neff and Asner, 2001; Michalziket al., 2003). The Integrated Catchments model for Carbon (INCA-C)(Futter et al., 2007) is a process-based model and has been previouslyused in similar research in forested, temperate and boreal single catch-ments with successful results (Futter and de Witt, 2008; Futter et al.,2008, 2009; Oni et al., 2010). INCA-C is based on previous versions ofINCA which were originally designed to model nutrient patterns in
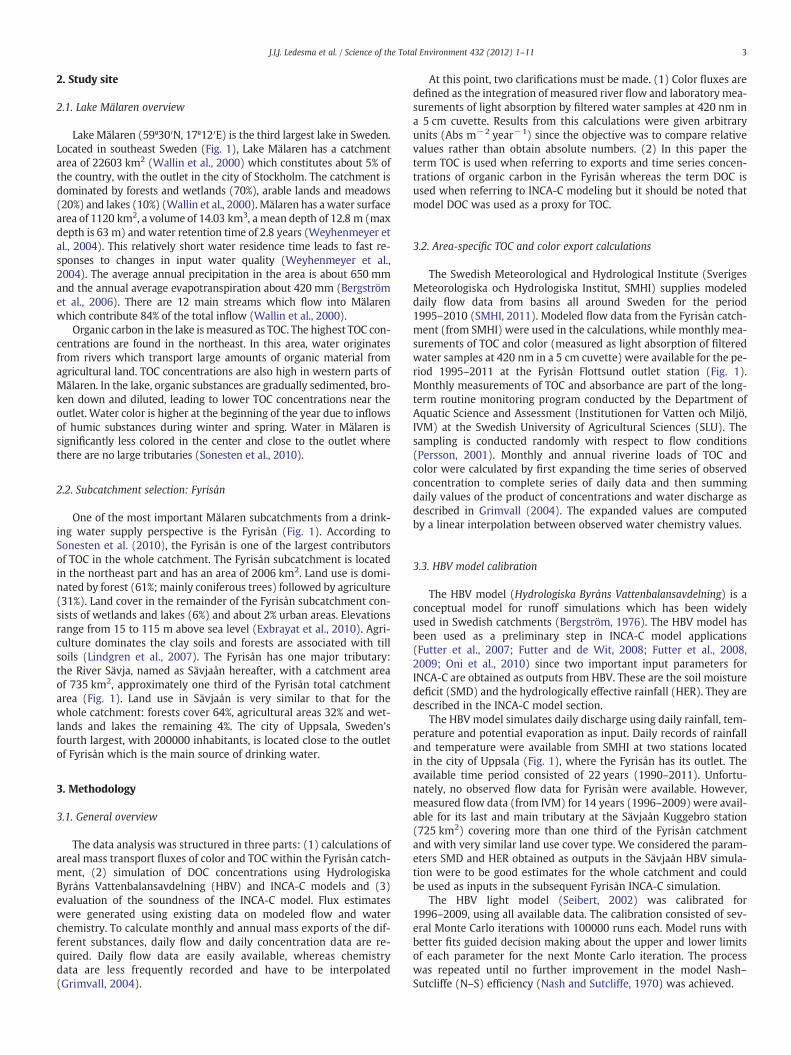
Fig. 1. Location of Lake Mälaren within Sweden and shape of the catchment with locationcatchment highlighted in grey, SMHI temperature station in Uppsala (black square), SMHI(inverse empty triangle) and Fyrisån Flottsund station for water chemistry (empty triangle
both aquatic and terrestrial environments (Wade et al., 2002a, 2002b;Whitehead et al., 1998). So far, INCA-C has been used in relativelysmall catchments and subcatchments of lakes and streams in Canadaand Nordic countries. In this paper, the model is tested in a much largerwatershed, the river Fyris, with a catchment area of 2006 km2.
Lake Mälaren, located in eastern Sweden (Fig. 1), supplies drinkingwater to more than 2 million people in Stockholm and the surround-ings. Water quality is generally rather good (Sonesten et al., 2010), al-though concern has been raised in recent years due to observedincreasing trends in both color and DOC in other surface waters in Nor-dic countries (Hongve et al., 2004). These increases may eventuallyoccur in LakeMälaren, with adverse consequences for water treatment.Climate change predictions forecast a precipitation increase and moreextreme events in the region (Persson et al., 2007). Higher water colorand DOC concentrations associated with extreme precipitation eventshave been already reported in Lake Mälaren (Weyhenmeyer et al.,2004). It is therefore expected that DOC concentrations will increasein the future. In order to avoid undesirable outcomes inwater treatmentplants, a better understanding of the DOC dynamics within the catch-ment is essential. This requires an investigation of the spatial and tem-poral patterns in DOC quality and quantity. Simulation models arecommonly used to aid in the understanding of dynamic systems.
This paper aims to help in the understanding of carbon dynamicswithin the Lake Mälaren watershed by modeling DOC concentrationsin one of its main tributaries, the River Fyris, named as Fyrisån here-after. The modeling is carried out using the process-based modelINCA-C (Futter et al., 2007). Some other specific objectives of this pro-ject are: (1) calculate and compare between each other fluxes ofwater, TOC and color from Fyrisån, (2) test the applicability ofINCA-C model in a large catchment, (3) compare the simulated andthe observed DOC concentration patterns of the modeled catchment,(4) evaluate the soundness of INCA-C and (5) acquire insight into car-bon dynamics in surface waters.
of Fyrisån subcatchment (a). In (b) shape of the Fyrisån catchment with Sävjaån sub-precipitation station in Uppsala (black circle), Sävjaån Kuggebro station for discharge).
3J.LJ. Ledesma et al. / Science of the Total Environment 432 (2012) 1–11
2. Study site
2.1. Lake Mälaren overview
LakeMälaren (59º30′N, 17º12′E) is the third largest lake in Sweden.Located in southeast Sweden (Fig. 1), Lake Mälaren has a catchmentarea of 22603 km2 (Wallin et al., 2000) which constitutes about 5% ofthe country, with the outlet in the city of Stockholm. The catchment isdominated by forests and wetlands (70%), arable lands and meadows(20%) and lakes (10%) (Wallin et al., 2000). Mälaren has a water surfacearea of 1120 km2, a volume of 14.03 km3, a mean depth of 12.8 m (maxdepth is 63 m) and water retention time of 2.8 years (Weyhenmeyer etal., 2004). This relatively short water residence time leads to fast re-sponses to changes in input water quality (Weyhenmeyer et al.,2004). The average annual precipitation in the area is about 650 mmand the annual average evapotranspiration about 420 mm (Bergströmet al., 2006). There are 12 main streams which flow into Mälarenwhich contribute 84% of the total inflow (Wallin et al., 2000).
Organic carbon in the lake is measured as TOC. The highest TOC con-centrations are found in the northeast. In this area, water originatesfrom rivers which transport large amounts of organic material fromagricultural land. TOC concentrations are also high in western parts ofMälaren. In the lake, organic substances are gradually sedimented, bro-ken down and diluted, leading to lower TOC concentrations near theoutlet. Water color is higher at the beginning of the year due to inflowsof humic substances during winter and spring. Water in Mälaren issignificantly less colored in the center and close to the outlet wherethere are no large tributaries (Sonesten et al., 2010).
2.2. Subcatchment selection: Fyrisån
One of the most important Mälaren subcatchments from a drink-ing water supply perspective is the Fyrisån (Fig. 1). According toSonesten et al. (2010), the Fyrisån is one of the largest contributorsof TOC in the whole catchment. The Fyrisån subcatchment is locatedin the northeast part and has an area of 2006 km2. Land use is domi-nated by forest (61%; mainly coniferous trees) followed by agriculture(31%). Land cover in the remainder of the Fyrisån subcatchment con-sists of wetlands and lakes (6%) and about 2% urban areas. Elevationsrange from 15 to 115 m above sea level (Exbrayat et al., 2010). Agri-culture dominates the clay soils and forests are associated with tillsoils (Lindgren et al., 2007). The Fyrisån has one major tributary:the River Sävja, named as Sävjaån hereafter, with a catchment areaof 735 km2, approximately one third of the Fyrisån total catchmentarea (Fig. 1). Land use in Sävjaån is very similar to that for thewhole catchment: forests cover 64%, agricultural areas 32% and wet-lands and lakes the remaining 4%. The city of Uppsala, Sweden'sfourth largest, with 200000 inhabitants, is located close to the outletof Fyrisån which is the main source of drinking water.
3. Methodology
3.1. General overview
The data analysis was structured in three parts: (1) calculations ofareal mass transport fluxes of color and TOC within the Fyrisån catch-ment, (2) simulation of DOC concentrations using HydrologiskaByråns Vattenbalansavdelning (HBV) and INCA-C models and (3)evaluation of the soundness of the INCA-C model. Flux estimateswere generated using existing data on modeled flow and waterchemistry. To calculate monthly and annual mass exports of the dif-ferent substances, daily flow and daily concentration data are re-quired. Daily flow data are easily available, whereas chemistrydata are less frequently recorded and have to be interpolated(Grimvall, 2004).
At this point, two clarifications must be made. (1) Color fluxes aredefined as the integration of measured river flow and laboratory mea-surements of light absorption by filtered water samples at 420 nm ina 5 cm cuvette. Results from this calculations were given arbitraryunits (Abs m−2 year−1) since the objective was to compare relativevalues rather than obtain absolute numbers. (2) In this paper theterm TOC is used when referring to exports and time series concen-trations of organic carbon in the Fyrisån whereas the term DOC isused when referring to INCA-C modeling but it should be noted thatmodel DOC was used as a proxy for TOC.
3.2. Area-specific TOC and color export calculations
The Swedish Meteorological and Hydrological Institute (SverigesMeteorologiska och Hydrologiska Institut, SMHI) supplies modeleddaily flow data from basins all around Sweden for the period1995–2010 (SMHI, 2011). Modeled flow data from the Fyrisån catch-ment (from SMHI) were used in the calculations, while monthly mea-surements of TOC and color (measured as light absorption of filteredwater samples at 420 nm in a 5 cm cuvette) were available for the pe-riod 1995–2011 at the Fyrisån Flottsund outlet station (Fig. 1).Monthly measurements of TOC and absorbance are part of the long-term routine monitoring program conducted by the Department ofAquatic Science and Assessment (Institutionen for Vatten och Miljö,IVM) at the Swedish University of Agricultural Sciences (SLU). Thesampling is conducted randomly with respect to flow conditions(Persson, 2001). Monthly and annual riverine loads of TOC andcolor were calculated by first expanding the time series of observedconcentration to complete series of daily data and then summingdaily values of the product of concentrations and water discharge asdescribed in Grimvall (2004). The expanded values are computedby a linear interpolation between observed water chemistry values.
3.3. HBV model calibration
The HBV model (Hydrologiska Byråns Vattenbalansavdelning) is aconceptual model for runoff simulations which has been widelyused in Swedish catchments (Bergström, 1976). The HBV model hasbeen used as a preliminary step in INCA-C model applications(Futter et al., 2007; Futter and de Wit, 2008; Futter et al., 2008,2009; Oni et al., 2010) since two important input parameters forINCA-C are obtained as outputs from HBV. These are the soil moisturedeficit (SMD) and the hydrologically effective rainfall (HER). They aredescribed in the INCA-C model section.
The HBV model simulates daily discharge using daily rainfall, tem-perature and potential evaporation as input. Daily records of rainfalland temperature were available from SMHI at two stations locatedin the city of Uppsala (Fig. 1), where the Fyrisån has its outlet. Theavailable time period consisted of 22 years (1990–2011). Unfortu-nately, no observed flow data for Fyrisån were available. However,measured flow data (from IVM) for 14 years (1996–2009) were avail-able for its last and main tributary at the Sävjaån Kuggebro station(725 km2) covering more than one third of the Fyrisån catchmentand with very similar land use cover type. We considered the param-eters SMD and HER obtained as outputs in the Sävjaån HBV simula-tion were to be good estimates for the whole catchment and couldbe used as inputs in the subsequent Fyrisån INCA-C simulation.
The HBV light model (Seibert, 2002) was calibrated for1996–2009, using all available data. The calibration consisted of sev-eral Monte Carlo iterations with 100000 runs each. Model runs withbetter fits guided decision making about the upper and lower limitsof each parameter for the next Monte Carlo iteration. The processwas repeated until no further improvement in the model Nash–Sutcliffe (N–S) efficiency (Nash and Sutcliffe, 1970) was achieved.

4 J.LJ. Ledesma et al. / Science of the Total Environment 432 (2012) 1–11
3.4. INCA-C model calibration
3.4.1. Description of INCA-C modelThe dynamic, semi-distributed, process-based INCA-C model simu-
lates daily time series of DOC concentrations, fluxes and water flow.The model needs daily time series of air temperature and precipitation,and daily estimates of SMD and HER. Air temperature and amodel fromRankinen et al. (2004) are used in INCA-C to simulate soil temperatures.The soil moisture deficit (SMD) is an estimate of the difference betweenthe maximum soil water content and the actual amount of water in thesoil. The hydrologically effective rainfall (HER) represents the precipita-tion net of evapotranspiration and interception, either as rainfall orsnowmelt that contributes to streamflow generation. In addition, timeseries of observed flow and DOC concentrations are needed for calibra-tion. INCA-C divides the terrestrial environment into two boxes for eachland use simulated: the upper organic layer and the lowermineral layer.INCA-C consists of two interconnected sub-models. A hydrological sub-model simulates water flows in the soil and to the stream and a biogeo-chemical carbon model simulates fluxes and transformations betweenthe different carbon pools in both the terrestrial and the aquatic com-partments (Fig. 2). Three water pools are represented in the hydrologi-cal sub-model: the soil surface water and the water in the upper andlower soil boxes. Four different carbon pools are considered: (1) poten-tial dissolved carbon (PDC) which consists of leaf litter, root exudates
Fig. 2. Conceptualization of the two interconnected sub‐models within INCA-C. Above,the hydrological sub‐model with theoretical fluxes between water pools. Below, thebiogeochemical carbon sub‐model with theoretical transformations between differentcarbon pools.
and soil microflora in the terrestrial system and leaf litter from the ter-restrial compartment, particulate organic carbon in the water columnand aquatic biota in the aquatic environment; (2) soil organic carbon(SOC) which includes all organic carbon bound to the mineral andclay constituents of the soil and the microbial community attached tothe soil substrate (Whitehead et al., 2006); (3) DOC and (4) dissolvedinorganic carbon (DIC). Further information about INCA-Cmodel equa-tions is available in Futter et al. (2007).
3.4.2. Data sources for INCA-C modelThe same temperature and precipitation data used in theHBVmodel
calibration from the two stations in Uppsala (Fig. 1)were used as inputsto the INCA-C model. Daily estimations of SMD and HER for the period1996–2009 were obtained from the HBV calibration of Sävjaån flow.No measured flow data for Fyrisån were available, although this infor-mation was needed for INCA-C calibration. INCA-C was calibrated to atime series of observed Sävjaån flow multiplied by the ratio of Fyrisånto Sävjaån catchment areas so as to approximate actual discharge inthe Fyrisån. A comparison of SMHI simulated Fyrisån flow and mea-sured Sävjaån flow (1996–2009; r2=0.77; data not shown) showedthat both inter- and intra-annual flow patterns are very similar in bothrivers. Only TOC data were available at Fyrisån Flottsund. Different stud-ies in Swedish surface waters have shown that POC is negligible relativeto the dissolved fraction and approximations of TOC to DOC have beenused previously (Ågren et al., 2008; Ivarsson and Jansson, 1995;Laudon and Bishop, 1999). Therefore, TOC data were used in the INCA-C DOC calibration.
3.4.3. Calibration of INCA-C modelThe calibration process for the period 1996–2009 was carried out
in five phases: (1) selection of fixed values for some parameters, (2)manual calibration of the hydrological sub-model (3) manual calibra-tion of the carbon model, (4) a Monte Carlo simulation and (5) a finalmanual refinement of parameter values.
(1) The Fyrisån catchment was divided in three different land useclasses: wetlands (6%), forests (63%) and agricultural land(31%). A small proportion of lakes is included within the wet-land land use group. Because of their small extent (2%), urbanareas were not included in the model calibration. The bound-aries of the catchment and the initial flow and DOC in thestream were fixed. This information is easily extracted fromthe observed data but the initial values in the soil had to be es-timated. Typically, the upper soil horizons (peatlands and for-est floors) have higher SOC and DOC concentrations. The SOCand DOC in the upper soil box in wetlands were fixed to8·105 kg/ha and 40 mg/l respectively. We considered that wet-lands have double the amount of carbon than forests and for-ests have double the amount of carbon than agriculture andalso that the upper soil boxes have twice as much as thelower horizons in all cover types. Therefore, for instance, theSOC and DOC in the lower box in the agricultural land were105 kg/ha and 5 mg/l respectively. These values were not mod-ified during the calibration. Relevant references were used todecide upon values (Ågren et al., 2007; Hope et al., 1994;Köhler et al., 2008; Mulholland, 2003).
(2) The manual calibration is crucial to achieve a good approxima-tion to the observed values before proceeding with MonteCarlo simulations. The calibration strategy first established re-alistic values for the sensitive hydrological parameters includ-ing base flow index (BFI), soil volumes and residence times,until both flow and DOC simulations were in the range of theobserved values.
(3) Once an acceptable fit to observed flows had been achieved,hydrological parameters were fixed. Finally, the parametersdescribing carbon transformation in the soil were adjusted.

5J.LJ. Ledesma et al. / Science of the Total Environment 432 (2012) 1–11
The objectives of this phase were to achieve a similar efficiencyin the flow model that obtained previously in HBV model andto get an N–S statistic of at least 0.20 in the carbon model.
(4) After an acceptable manual calibration had been obtained, aMonte Carlo exploration of the parameter space was conductedusing Latin Hypercube sampling (LHS; Futter et al., 2007). Thefollowing in-soil organic carbon process rate parameters wereallowed to vary in the upper and lower soil layers during theMonte Carlo analysis: PDC→SOC; PDC→DOC; SOC→DOC;DOC→SOC; DOC→DIC (arrow indicates the direction of transfor-mation between the different fractions of carbon). In addition,the critical soil moisture threshold and process rate response toa soil temperature change were allowed to vary. During each it-eration of theMonte Carlo analysis, 20000model runs were per-formed as part of 1000 LHS of size 20. In all cases, parametersvalues were sampled from a rectangular prior distribution. Theinitial boundaries of the hypercube were defined as ±50% ofthe parameter value for the best performing manual calibration.After each iteration of theMonte Carlo analysis, parameter sensi-tivity was assessed using the 100 best performing parametersets, whichwere defined by ranking the N–S statistics comparingmodeled and observed DOC. The cumulative parameter distribu-tions derived from the best performing parameter sets werecompared to rectangular distributions, and if non-rectangular,the parameter range was adjusted prior to the next iteration ofthe Monte Carlo analysis. This process was terminated whenthe Monte Carlo analysis failed to provide any improvement inN–S values over the preceding set of model runs.
(5) A final manual variation of the sensitive parameters to correctthe major mismatches and to improve the model efficiency.
3.5. INCA-C model evaluation
Because of its unique, long-term TOC time series, the Fyrisån pres-ented a great opportunity to test the performance of INCA-C. The period1995–2011 can be divided in three partswith respect to annual averageTOC concentrations: first, 2 years with below average TOC concentra-tions (1995–1996); second, a 12-year periodwith stable concentrationsaround the average (1997–2008); and third, a 3-year period with highconcentrations which were above average in 2009 and decreased backto average values in 2010–2011 (Fig. 3). The INCA-C model was unableto simulate the high concentrations observed in 2009. Thus, the ques-tion arose whether INCA-C could simulate the concentrations in 2010and 2011 with a parameter set calibrated for the previous 14 years(1996–2009). In order to perform this final stage, the HBV time serieswas extended to obtain SMD, HER and simulated flows for 2010–2011.Since the HBV calibration was successful in the period 1996–2009, the
0
5
10
15
20
25
30
35
1995
1996
1997
1998
1999
2000
2001
2002
2003
2004
2005
2006
2007
2008
2009
2010
2011
TO
C (
mg/
l)
Year
Fig. 3. Annual range of TOC concentrations measured monthly at the outlet of Fyrisåncatchment. Black circles represents annual means and horizontal lines maximum andminimum values. Long horizontal line represents the mean value for the whole timeseries.
simulated flow in 2010–2011 is considered a good approximation tothe upscaled flow used in INCA-C. Finally, a Monte Carlo explorationwas performed to improve the final result.
4. Results
4.1. Area-specific TOC and color exports in Fyrisån
Observed TOC concentrations show a statistically significant increas-ing trend (r2=0.41, pb0.01) in the 17-year period from 1995 to 2011.Average observed TOC concentration in this period was 14.8 mg/l. Theannual average increased from 16.1 mg/l in 2008 to 22.7 mg/l in 2009and then decreased to 19.3 mg/l in 2010 and 16.6 mg/l in 2011 (Fig. 3).Average temperature and precipitation in the region for the 22-year pe-riod 1990–2011were 6.6 °C and561 mmrespectively (Fig. 4). The lowestand highest average annual temperature were recorded in 1996 and2011being 5.1 °C and7.8 °C respectively,whereas the lowest andhighestaverage precipitation occurred in 1993 (443 mm) and 2008 (665 mm)respectively. Annual stream TOC exports in the Fyrisån catchment (esti-mated using daily concentrations linearly interpolated frommonthly ob-servations and flows modeled by SMHI and the total catchment area)averaged 3.3 g m−2 year−1 in the 16-year period 1995–2010 (Fig. 5).The lowest flux was 0.8 g m−2 year−1 in 1996 and the highest(5.8 g m−2 year−1) occurred in 2008.
Monthly TOC export and water discharge are strongly correlated(r2=0.94) (Fig. 5). This is not surprising as the exports are proportionalto the amount of water, i.e. discharge, but this analysis aid in identifyingmismatches. The two outliers in the correlation graph correspond totwo very high monthly export estimates in December 2008(2.2 g m−2 month−1) and April 2010 (2.2 g m−2 month−1). The exportof organic carbon in these 2 months was, for example, higher than thetotal export in 1996 (0.8 g m−2 year−1), 2003 (1.7 g m−2 year−1)and 2005 (2.2 g m−2 year−1) and significantly higher than themonthlyaverage 0.3 g m−2 month−1 in 1995–2010. The uncoupling betweendischarge and TOC exports at the end of 2008 is clearly visible in Fig. 6.Monthly fluxes of TOC and color are strongly correlated (r2=0.97,Fig. 5). This indicates a strong relationship between organic carbon andwater color in the water course of the catchment. The major mismatchoccurred during 2002, where the export of carbon decreased and the ex-port of color increased with respect to the previous year. There was asimilar mismatch in 1999.
4.2. INCA-C DOC modeling in Fyrisån
The results from the manual calibration of the model were veryencouraging, achieving the objectives in both modeled flow(r2=0.77, N–S=0.77, similar to the efficiency obtained in the HBV
400
500
600
700
-4
0
4
8
12
16
1990
1991
1992
1993
1994
1995
1996
1997
1998
1999
2000
2001
2002
2003
2004
2005
2006
2007
2008
2009
2010
2011
Pre
cipi
tati
on (
mm
)
Tem
pera
ture
(ºC
)
Year
Fig. 4. Annual meteorological records in Uppsala. Bars represent total precipitation,solid line is the mean temperature, square dotted line is the mean temperature inthe growing season (May–October) and dashed line is mean temperature in the non-growing season (January–April and November–December).

Fig. 5. Modeled annual TOC exports and discharge from Fyrisån (top left). Monthly correlation between TOC exports and discharge (top right). Modeled annual color and TOC ex-ports from Fyrisån (down left). Monthly correlation between TOC exports and color exports (down right).
6 J.LJ. Ledesma et al. / Science of the Total Environment 432 (2012) 1–11
calibration) and modeled DOC (r2=0.25, N–S=0.22, above the tar-get 0.20). The most sensitive parameters were easily detected duringthe manual calibration and they were varied in the Monte Carlo sim-ulation. After the Monte Carlo simulation, the best parameter set im-proved the DOC model (r2=0.32, N–S=0.30), with a similarefficiency in the flow model (r2=0.76, N–S=0.76). Finally, a manualvariation of parameters was performed which significantly improvedthe DOC model until r2=0.40, N–S=0.39. Taking into account onlythe efficiency we consider that simulations of both hydrology andorganic carbon are very good, being in the range of the best publishedcalibrations previously performed with INCA-C.
The simulation for 2009 deserves special attention since the model,despite capturing the timing of the dynamics, clearly underestimates
0
10
20
30
40
50
60
1995
1996
1997
1998
1999
2000
2001
2002
2003
2004
2005
2006
2007
2008
2009
2010
2011
TO
C (
g.m
-2)
Year
Discharge
TOC
0
2000
4000
6000
8000
Dis
char
ge (
Gm
3 )
Fig. 6. Cumulative values of estimated TOC exports and discharge for Fyrisån(1995–2010).
the concentration during thewhole year (Fig. 7). To testwhether this fail-ure could be a result of either special conditions occurring during2008–2009 or to systematic errors, the time series was extended twomore years using the parameter set obtained in the last manual variationin the 1996–2009 calibration (Fig. 7). The hydrological sub-model effi-ciency increased to r2=0.80, N–S=0.79, which could be attributed tothe fact that the flow in 2010–2011 is a simulation from HBV and INCA-C reproduces it similarly (as observed during the 1996–2009 calibra-tions). DOC model efficiency improved slightly to r2=0.41, N–S=0.40.Model performance improved after 2009. Both dynamics and absolutevalues are very well captured by themodel in 2010 and 2011. Thereforethe evaluation of INCA-C is very positive and the failure in 2009 could beattributed to something unusual happening that is not included in themodel. Furthermore, a final Monte Carlo exploration for thewhole peri-od 1996–2011 could not achieve more than a 1% improvement over theN–S statistic from the existing parameter set obtained in the lastmanualstep of the 1996–2009 calibration. This highlights two things: (1) theimportance of a manual calibration since a Monte Carlo simulationwas not able to significantly improve the performance of the modeland (2) the model is robust when extending time series with newdata using a well calibrated parameter set.
5. Discussion
5.1. Catchment response to climate drivers
Hinton et al. (1997) discussed how regression methods as usedhere to calculate carbon exports might influence the results. Theyfound that this method accurately predicted exports but they esti-mated the uncertainty to be larger than 30%. When consideringmonthly concentrations as we did here there is a risk of missing

Fig. 7. Observed and INCA-C simulated flow (top) and DOC (down) in Fyrisån. Measured flow is actually upscaled flow from the tributary Sävjaån and measured DOC is actuallymeasured TOC.
7J.LJ. Ledesma et al. / Science of the Total Environment 432 (2012) 1–11
high TOC values that could have occurred under high discharge con-ditions. This would lead to an underestimation of exports. We havenot conducted any analysis to estimate this potential source of errorbut we consider our calculations to be good approximations.
TOC export estimates and discharge in Fyrisån tracked each other inthe 11-year period 1997–2008, keeping the TOC concentrations similarto the average concentration from 1995 to 2011. The last 5 months of2008 were especially wet with a total precipitation of 372 mm. Thisalone cannot explain the peak in concentration in December and espe-cially the subsequent average concentration in 2009 of 22.7 mg/l(values measured monthly) which was much greater than the averageof 14.8 mg/l for the period 1995–2011. There were, therefore, somemechanisms apart from the flow occurring in the late 2008 whichresulted in a TOC concentration increase and a possible memory effectin 2009. These factors will be discussed later. There are signs of climatecontrol of TOC exports; the year 2008, with the highest stream export,was the second warmest and wettest year (of 1990–2009), and theyear 1996, with the lowest TOC exports, was the coldest and driest (of1995–2009). This supports the idea that warmer and/or wetter condi-tions favor higher organic carbon production and exports (Hongve etal., 2004; Köhler et al., 2008). The most plausible explanation for thepeak in exports in 2010 is amassive carbon flushing in themajor springflood of that year. The biggest flow event recorded in the previous30 years was observed in spring 2010 due to the melting of largeamounts of snow which had accumulated during the previous winterwhichwas the coldest in the time series. This snowmelt event could ex-plain the peak in the TOC concentration in April–Maywhich is typical offorest-dominated catchments like Fyrisån (Buffam et al., 2007; Hintonet al., 1998; Köhler et al., 2008; Laudon et al., 2004).
Color export peaked in February 2002. However, this effect was notas strong for TOC causing the mismatch during that year (Fig. 5). Aver-age temperature in February 2002 was above 0 °C (2.6 °C on average
in the first 3 weeks of themonth), enough to melt the snow accumulat-ed in previous months and produce an early spring flood with a peak indischarge (Fig. 7). Mineralization of organic matter at this time of theyear is low and leaf litters from the previous autumn contain significantfractions of highly colored humic substances (Hongve, 1999). Therefore,flushing of organic carbon of humic character during this early floodevent is likely the reason for the peak in color export in 2002. Thiscould have been enhanced by co-transportation with iron that madeTOC darker (i.e. higher in color;Maloney et al., 2005). Monthly iron con-centration in the period 1995–2003 (data from IVM, not shown) peakedin February 2002 up to 1.42 mg/l at Fyrisån Flottsund, being the averageconcentration in this period 0.59 mg/l. The second mismatch betweencolor and TOC exports was seen in 1999 (Fig. 5), especially in April.Here the most likely explanation is a co-transportation with iron. Ironconcentration in April 1999 was1.8 mg/l, the second largest in the 9-year period of records 1995–2003.
5.2. Model calibration strategy
There is an important concept to consider when modeling com-plex environmental systems, the so-called equifinality. According toBeven and Freer (2001), equifinality occurs when many different pa-rameters sets within a model give equivalent reproductions of the ob-served behavior of that system. Equifinality can be caused by over-parameterization and the compensatory effects across the parameterspace. For example, Monte Carlo simulations during the HBV modelcalibration in our study gave thousands of different parameter setswith similar efficiency. Although uncertainty could be minimized byreducing the parameter ranges, there was still an important degreeof equifinality in the last iteration, where thousands of parametersets were close to the best simulation. Signs of equifinality werealso noticed during the manual calibration of the INCA-C model. For

8 J.LJ. Ledesma et al. / Science of the Total Environment 432 (2012) 1–11
example, the model efficiency was the same when considering twoopposite soil behaviours in the parameter set: (1) low retentiontimes and low rates of DOC production in the mineral layer and (2)high retention times and high rates of DOC production in the minerallayer. But from experience we know that retention times are usuallyhigher in mineral layers than in organic layers; thus the second pos-sibility was considered better. This points out the importance of ini-tial manual calibrations to produce credible parameter sets. Thefacts that a second manual refinement after a Monte Carlo iterationimproved the model efficiency and that during the evaluation stageanother Monte Carlo iteration could not improve the simulation sup-port the necessity of manual calibrations for catchment understand-ing. Future INCA-C calibrations should follow this strategy.
5.3. INCA-C evaluation
The INCA-C model was able to reproduce the intra- and inter-annual variation in DOC concentration during the period 1996–2008(Fig. 7). However, the model failed to capture some of the highpeaks although the timing, i.e. the simulated time at which concen-tration peaked in the model, is correct. The high concentration insummer 2000 that the model failed to capture corresponds to a yearwhere the non-growing season, i.e. winter and early spring, was espe-cially warm. The month of July of that year was the wettest in the pe-riod 1990–2009 with a total precipitation of 118 mm. This majorprecipitation event led to a peak in the observed flow in the end ofJuly and beginning of August that the hydrological model failed tocapture and, in turn, the carbon model underestimated the peak inthe concentration. Other studies have found that higher color andDOC concentrations occur after prolonged droughts (Vogt andMuniz, 1997; Watts et al., 2001). The total precipitation measuredin the first half of 2000 was 166 mm, the lowest for the aggregate ofthese months in the whole period 1990–2011. We therefore believethis peak was consequence of a high TOC export during a peak inthe discharge in summer after a dry period in the first half of theyear. In contrast, the peak in the middle of June of 2006 that themodel was unable to reproduce presents a more difficult case whichcould be the result of a combination of multiple factors. The springflood occurring in April–May was especially sharp this year followedby a warm period with low flows which could produce high evapo-transpiration and thus DOC could have become more concentrated.Although the model did a better job in reproducing the lower concen-trations, in some cases there was an overestimation. These overesti-mations occurred in both the hydrological and carbon model andthereby could be solved with a better hydrological approximation,but this is potentially unachievable.
The model was unable to reproduce the difference in DOC concen-tration between 2008 and 2009, although the simulation in 2009shows the highest average simulated concentration, 16.7 mg/l. Thisis, however, still far from the observed average of that year,22.7 mg/l. One factor that probably plays a role here is the underesti-mation of a high flow event at the end of 2008. Observed flow peakedon 14th of December up to 85 m3/s and the simulated flow of that dayis 56 m3/s. Neither HBV nor INCA-C could reproduce the observedflow. This could be caused by precipitation events upstream that didnot occur at the outlet of the large catchment (2006 km2) wherethe precipitation station is located. Within the year 2009 there wasan extremely high measured concentration of 33.4 mg/l in July. Thetiming in the model is good since it also peaked there but far fromthe actual value. In the previous month the leaching of phosphorusand nitrogen (data not shown) was significantly high in comparisonswith previous summers which could be an indication of over-fertilization in agriculture resulting in higher primary productionand organic matter exported. Furthermore, the measured precipita-tion in June of 2009 was 117 mm, the highest in this month for thewhole time series 1990–2009, whereas the total precipitation
January–Maywas 121 mm. Overfertilization together with wet condi-tions after a dry period could have dramatically increased the primaryproduction leading to the high peak in concentration in July. Thesepossibilities, however, do not conclusively determine why concentra-tions were underestimated during 2009 since they are related to asingle episode in the summer. Hypotheses about possible causes ofthe high TOC values observed during 2009 and why the modelcould have failed to capture them are discussed in the next section.
In this project, INCA-C was applied to a significantly larger catch-ment than it had been previously. The experience can be consideredas successful, but the combination of different land types and thelarge range of conditions that can be found in an 80 km streamwithina 2006 km2 catchment might be too big for a single, lumped repre-sentation. Moreover, some processes are different in the headwatersthan in the outlet such as the DOC mineralization, which is more im-portant upstream (Köhler et al., 2002). Conditions that vary across alarge watershed may not be captured when a catchment is simulatedas a single, lumped box. For example, precipitation data were collect-ed from a station close to the outlet of the catchment. This can sum-marize general rainfall patterns but extreme local events such assummer–autumn storms occurring upstream which might influencetotal discharge might not be captured and render the model calibra-tions more difficult. This probably plays a role in the flow underesti-mation at the end of 2008 as we have already mentioned.
Four approximations were used in the Fyrisån input data to INCA-C: (1) TOC concentration measurements considered as DOC, (2) useof estimates HER and SMD from the HBV simulation of the tributarySävjaån, (3) use of upscaled water flow from Sävjaån in the1996–2009 calibration and (4) use of upscaled simulated HBVSävjaån flow when extending the time series 2 years (2010–2011).Quantifying the error from these is not possible. (1) The POC fractionof the TOC could be quantitatively important in Fyrisån, where 31% ofthe catchment is covered by agricultural land. A stable POC/TOC ratiothroughout the time series would, however, not affect the efficiencyof the simulated dynamics since TOC and DOC would behave equally.But an intra- and inter-annual variation in agricultural activity couldpotentially modify the fraction of POC within the TOC, which causesuncertainty when using TOC as a proxy to DOC. (2) Regarding the ap-proximations of hydrological estimates and flows, Sävjaån is bigenough to represent the whole catchment and has a very similarland use type. Therefore, the estimates HER and SMD are valid forFyrisån. (3) Upscaling flows is a common practice in hydrologicalmodeling. (4) Upscaled simulated HBV Sävjaån flow was used when2010 and 2011 were added into the time series in INCA-C. We believethis is a good approximation since the Sävjaån calibration in HBV forthe 14-year period 1996–2009 gave an efficiency of 80%, but thiscould cause another unknown source of error. Nevertheless, this iswhat models are used for, i.e. simulating reasonably good representa-tions of reality when data are not available.
Most of the parameters in INCA-C had to be calibrated manuallysince no data on actual conditions were available. This lack of infor-mation led to a high uncertainty in the values. For instance, no inven-tories of carbon content in the soil were available and the initialvalues used were only estimations that did not change during the cal-ibration. There is a risk of reduced accuracy due to the use of fixed pa-rameters. However, we believe the values fixed here were adequateto represent reality, giving higher values to wetlands and upper layersthan forest and agricultural land and lower layers. Besides, the cali-bration is easier when some parameters are kept unchanged. Evenso, better results would have been obtained with more data.
Typical sensitive parameters in previous INCA-C applications in-clude in-soil DOC transformations, critical soil moisture thresholdand process rate response to a soil temperature change. Special atten-tion must be paid to the two parameters describing stream velocity.INCA-C uses Eq. (1) to calculate the water velocity in the stream v,with the dimensionless a (streamflow multiplier) and b (streamflow

9J.LJ. Ledesma et al. / Science of the Total Environment 432 (2012) 1–11
exponent) as model parameters (Futter et al., 2007). Results weresensitive to both parameters during our calibration. Considering aspring peak flow Q of 80 m3/s and a stream velocity of 1 m/s inFyrisån, a and b should have values around 0.05 and 0.7 respectively(the model performed better with b values around 0.7). These valuesproduced accurate flow simulations but led to a very poor simulationof DOC concentrations. The most likely explanation here is that thelumped representation of the catchment precluded accurate repre-sentation of in-stream carbon transformation processes. It is also pos-sible that monthly TOC observations failed to adequately describeshort term variations in concentration; thus, the simulated variationin DOC was higher than the observed data with a parameter set thatsimulated credible water velocities. In order to reproduce a good pat-tern the a value needed to be reduced one order of magnitude. Thesimulated flow was still sufficient and the carbon fit improved signif-icantly but the result is a slower flow than in reality, i.e. the flow ve-locity calculated with Eq. (1) with this parameter set is low incomparison to what the velocity is expected to be in the river. Moreflow velocity measurements could aid in constraining the flow veloc-ity parameters used in the model. In addition, the semi-distributednature of INCA-C means that future model applications could repre-sent the catchment as a series of reaches. This would permit the ap-plication of reach-specific flow velocity and rainfall runoff-relatedparameters, thus better representing the actual residence time ofwater in the river.
v ¼ a⋅Qb ð1Þ
5.4. Hypotheses behind the high TOC concentrations in 2009
The oscillation in organic carbon concentrations in the last years ofthe time series, peaking in 2009 and recovering during 2010 and 2011(Figs. 3 and 7), is an indication of a specific event with medium-termconsequences rather than a long-term trend in this case. Plus, theINCA-C calibration presented here was able to fit all years except2009. In the previous section we have discussed overfertilizationand a post-drought period as likely causes of the high observed TOCconcentration in July of 2009. Now we present an evaluation of anumber of hypotheses to explain the anomaly in TOC values for thewhole year, ultimately none proved satisfactory.
Unlike other parts in Fennoscandia, the sulfate deposition was notan important issue in this part of Sweden and it is unlikely that reduc-tions in sulfate deposition play a role here. In addition, reductions inacid deposition have been responsible of long-term trends increasesin organic carbon (Erlandsson et al., 2008) and thereby it is not ade-quate to consider this in a lower temporal scale.
We hypothesized that the poor fit to 2009 data might be an artifactof the model fitting procedure. Minimizing the N–S statistic biasesmodel results in favor of more common values. To avoid this problem,we performed a Monte Carlo analysis using observations from 2008 to2009 only. A similar strategy to the one described above was followed.After 100000 iterations, it was not possible to find a single parameterset which adequately captured the mean DOC concentration in eachyear. For all model runs examined, modeled DOC concentrations weretoo low in 2009 and too high in other years.
We believe the increase in TOC in 2009 is real as color values in-creased at the same time. There was not, however, any clear increasein concentrations of other determinants measured at the Fyrisånmonitoring site, apart from the already mentioned high nutrientvalues in June. A PCA analysis (not shown) using pH, alkalinity, sili-con, ammonium (NH4
+), nitrite and nitrate (NO2−+NO3
−), total nitro-gen, phosphate (PO4
3−), total phosphorus, TOC and absorbanceindicated that the only unusual parameters in 2009 were in factTOC and absorbance. This discarded a possible change of chemicalcomposition in the stream caused by, for example, in-catchment
processes such as erosion and sediment transport, which wouldhave been manifested by high values of nutrients throughout theyear. Plus, decreasing ionic strength can be linked to increased TOCconcentrations. Unfortunately, there was no evidence of a decline inionic strength in the 2009 water chemistry samples.
The observed increase in TOC concentrations in the Fyrisån in2009 was not unique to this river alone. Similar increases in TOC con-centration were observed in other nearby rivers including theSävjaån. This regional increase falsifies a hypothesis of a local effectin the Fyrisån. We had originally suspected that the observed increasein 2009 may have been a result of change in practice in the sewagetreatment works located a few kilometers upstream of the monitor-ing site, or perhaps of construction in the town of Uppsala. Landcover changes such as increasing wetland proportion, increasing agri-cultural activity, urbanization or higher rate of deforestation mightlead to increasing DOC concentrations (Creed et al., 2008; Laudon etal., 2009, 2011; Wilson and Xenopoulos, 2008; Oni et al., 2012). Thelack of a co-occurring increase in nitrate, suspended sediments ortotal phosphorus concentrations argues against increased export ofmaterial from agricultural lands during 2009 and no big constructionprojects or land use changes were recorded.
We hypothesized that the high TOC values may have been the re-sult of exceptionally high flows and the activation of new flow paths(Haaland et al., 2010; Laudon et al., 2011), but there was no evidenceof this in the hydrological record. High TOC concentrations are oftenassociated with post-drought periods. Unfortunately for this hypoth-esis, 2008 was one the wettest years in the period of observation. Thislack of elevated TOC concentrations in wet years highlights the differ-ences in landscapes specific responses. The winter in 2008–2009 wasnot noticeably unusual. There was a moderate amount of snow andmoderate temperatures. This suggests that unusual winter conditionswere not the cause of the observed increase in TOC concentrations in2009.
The lack of an explanation of the high TOC concentrations ob-served in 2009 is troubling. The increase is real, yet it has not beenpossible to link it to hydrological climatic, land use related or chemi-cal changes. This suggests that there is at least one more unknown, orunmeasured mechanism operating to control surface water TOC. Ad-ditional efforts must be focused on identifying this mechanism andincorporating it into INCA-C and other models of organic carbonbehavior.
5.5. Implications for surface water quality
Despite all the aforementioned sources of uncertainty, INCA-C dida very good job modeling the DOC in the Fyrisån catchment from1996 to 2011 with the exception of 2009. It failed to predict thehighest concentrations of DOC, which can be considered outliers inthe data series. Nevertheless this is the important issue when itcomes to water treatment: using models to predict when carbon con-centrations will be high in order to be aware of future changes andthus apply the proper solutions before the problems come. The in-creasing trend in TOC concentrations in Fyrisån is in agreementwith increasing trends in other countries. Water treatment plantsshould be concerned about this, as they should be concerned aboutthe unusual years 2008–2009 that we have shown here. Furthermore,the success in modeling DOC dynamics will be useful for understand-ing other potential harmful compounds such as mercury (Eklöf et al.,2012).
6. Conclusions, further investigations and implications for drinkingwater treatment
We believe this paper highlights that the puzzle of carbon processesexplaining organic carbon dynamics in surface waters is not yetcomplete. This can be seen as a new opportunity to improve our

10 J.LJ. Ledesma et al. / Science of the Total Environment 432 (2012) 1–11
understanding of carbon dynamics by future researches that will try toidentify these mechanisms. Organic carbon models such as INCA-C canbe then conceptualized to incorporate these new findings. It will also beespecially interesting to follow up the trend in TOC concentrations inFyrisån to see if the 2009 behavior is repeated. All these aspects arevery important from a water treatment perspective. Apart from theyear 2009, the parameter set obtained in the calibration for the period1996–2009 worked very well when extending the time series twoyears. This is a clear sign of the utility of the model to generate futurescenarios under, for example, climate and land cover changes includingchanges in precipitation patterns. INCA-C has been previously used toproject future climate conditions and their consequences in DOC con-centrations in catchments in Canada (Aherne et al., 2008; Oni et al.,2012) and Finland (Futter et al., 2009). The model can be a useful toolfor those responsible of drinking water treatment since forecast offuture scenarios may help in all management, strategy and decision-making processes.
References
Ågren A, Buffam I, Jansson M, Laudon H. Importance of seasonality and small streamsfor the landscape regulation of DOC export. J Geophys Res 2007;112:G03003.
Ågren A, Buffam I, Berggren M, Bishop K, Jansson M, Laudon H. Dissolved organic car-bon characteristics in boreal streams in a forest-wetland gradient during the tran-sition between winter and summer. J Geophys Res 2008;113:G03031.
Aherne J, Futter MN, Dillon PJ. The impacts of future climate change and sulphur emis-sion reductions on acidifications recovery at Plastic Lake, Ontario. Hydrol EarthSyst Sci 2008;12:383–92.
Ashworth DJ, Alloway BJ. Complexation of copper by sewage sludge-derived dissolvedorganic matter and plant uptake. Water Air Soil Pollut 2007;182:187–96.
Bergström S. Development and application of a conceptual runoff model for Scandina-vian catchments. Norrköping: SMHI RHO, 7. ; 1976. 134 pp.
Bergström S, Hellström S, Andréasson J. Nivåer och flöden i Vänerns och Mälarensvattensystem – Hydrologyskt underlag till klimat och sårbarhetsutredningen.SMHI Reports Hydrology; 2006. 55 pp.
Beven K, Freer J. Equifinality, data assimilation, and uncertainty estimation in mecha-nistic modelling of complex environmental systems using the GLUE methodology.J Hydrol 2001;249:11–29.
Boyer EB, Hornberger GM, Bencala KE, McKnight DM. Effects of asynchronous snow-melt on the flushing of dissolved organic carbon: a missing model approach.Hydrol Processes 2000;18:3291–308.
Buffam I, Laudon H, Temnerud J, Mörth C, Bishop K. Landscape-scale variability of acid-ity and dissolved organic carbon during spring flood in a boreal stream network. JGeophys Res 2007;112:G01022.
Canham CD, Pace ML, Papaik MJ, Primack AGB, Roy KM, Maramger RJ, et al. A spatiallyexplicit analysis of watershed scale dissolved organic carbon in Adirondack lakes.Ecol Appl 2004;14:839–54.
Chow AT, Tanji KK, Gao S. Production of dissolved organic carbon (DOC) and trihalo-methane precursor (THM) from peat soils. Water Res 2003;37:4475–85.
Creed IF, Beall FD, Clair TA, Dillon PJ, Hesslein RH. Predicting export of dissolved organ-ic carbon from forested catchments in glaciated landscapes with shallow soils.Global Biogeochem Cycles 2008;22:GB4024.
Curtis PJ. Climatic and hydrologic control of DOM concentration and quality in lakes. In:Hessen DO, Tranvik LJ, editors. Aquatic Humic Substances: Ecology and Biogeo-chemistry. Berlin: Springer; 1997. p. 93-105.
Dawson JJC, Malcolm IA, Middlemas SJ, Tetzlaff D, Soulsby C. Is the composition of dis-solved organic carbon changing in upland acidic streams? Environ Sci Technol2009;43:7748–53.
Eikebrokk B, Vogt RD, Liltved H. NOM increase in Northern European source waters:discussion of possible causes and impacts on coagulation/contact filtration pro-cesses. Water Sci Technol Water Supply 2004;4:47–54.
Eklöf K, Fölster J, Sonesten L, Bishop K. Spatial and temporal variation of THg concen-trations in run-off water from 19 boreal catchments, 2000–2010. Environ Pollut2012;164:102–9.
Erlandsson M, Buffam I, Fölster J, Laudon H, Temnerud J, Weyhenmeyer GA, et al. Thir-ty-five years of synchrony in the organic matter concentrations of Swedish riversexplained by flow and sulphate. Glob Chang Biol 2008;14:1191–8.
Exbrayat JF, Viney NR, Seibert J, Wrede S, Frede HG, Breuer L. Ensemble modelling ofnitrogen fluxes: data fusion for a Swedish meso-scale catchment. Hydrol EarthSyst Sci 2010;14:2383–97.
Futter MN, de Wit HA. Testing seasonal and long-term controls of streamwater DOCusing empirical and process-based models. Sci Total Environ 2008;407:698–707.
Futter MN, Butterfield D, Cosby BJ, Dillon PJ, Wade AJ, Whitehead PG. Modellingthe mechanisms that control in-stream dissolved organic carbon dynamicsin upland and forested catchments. Water Resour Res 2007;43:W02424.http://dx.doi.org/10.1029/2006WR004960.
Futter MN, Starr M, Forsius M, Holmberg M. Modelling the effects of climate on long-term patterns of dissolved organic carbon concentrations in the surface waters ofboreal catchment. Hydrol Earth Syst Sci 2008;12:437–47.
Futter MN, Forsius M, Holmberg M, Star M. A long-term simulation of the effects of acidicdeposition and climate change on surface water dissolved organic carbon concentra-tions in a boreal catchment. Hydrol Res 2009;40:291–305.
Grimvall A. Flownorm 2.0—a Visual Basic program for computing riverine loads ofsubstances and extracting anthropogenic signal for time series of load data.(User's manual)Department of Mathematics, Linköping University; 2004.
Haaland S, Hongve D, Laudon H, Riise G, Vogt RD. Quantifying the drivers of the in-creasing colored organic matter in boreal surface waters. Environ Sci Technol2010;44:2975–80.
Hanson PC, Pollard AI, Bade DL, Predick K, Carpenter SR, Foley JA. A model of carbonevasion and sedimentation in temperate lakes. Glob Chang Biol 2004;10:1285–98.
Hinton MJ, Schiff SL, English MC. The significance of storms for the concentration andexport of dissolved organic carbon from two Precambrian Shield catchments. Bio-geochemistry 1997;36:67–88.
Hinton MJ, Schiff SL, English MC. Sources and flowpaths of dissolved organic carbonduring storms in two forested watersheds of the Precambrian Shield. Biogeochem-istry 1998;41:175–97.
Hongve D. Production of dissolved organic carbon in forested catchments. J Hydrol1999;224:91–9.
Hongve D, Riise G, Kristiansen JF. Increased colour and organic acid concentrations inNorwegian forest lakes and drinking water: a result of increased precipitation?Aquat Sci 2004;66:231–8.
Hope D, Billett MF, Cresser MS. A review of the export of carbon in river water: fluxesand processes. Environ Pollut 1994;84:301–24.
Ivarsson H, Jansson M. Sources of acidity in running waters in central northern Sweden.Water Air Soil Pollut 1995;84:233–51.
Klaminder J, Bindler R, Laudon H, Bishop K, Emeteryd O, Renberg I. Flux rates of atmo-spheric lead pollution within soils of a small catchment in Northern Sweden andtheir implications for future water quality. Environ Sci Technol 2006;40:4639–45.
Köhler SJ, Buffam I, Jonsson A, Bishop KH. Photochemical and microbial processing ofstream and soilwater dissolved organic matter in a boreal forested catchment innorthern Sweden. Aquat Sci 2002;64:269–81.
Köhler SJ, Buffam I, Laudon H, Bishop KH. Climate's control of intra-annual and inter-annual variability of total organic carbon concentration and flux in two contrastingboreal landscapes. J Geophys Res 2008;113:G03012.
Laudon H, Bishop KH. Quantifying sources of acid neutralization capacity depressionduring spring flood episodes in Northern Sweden. Environ Pollut 1999;105:427–35.
Laudon H, Köhler S, Buffam I. Seasonal TOC export from seven boreal catchments innorthern Sweden. Aquat Sci 2004;66:223–30.
Laudon H, Hedtjärn J, Schelker J, Bishop K, Sørensen R, Ågren A. Response of dissolvedorganic carbon following forest harvesting in a boreal forest. Ambio 2009;38:381–6.
Laudon H, Berggren M, Ågren A, Buffam I, Bishop K, Grabs T, et al. Patterns and dynam-ics of dissolved organic carbon (DOC) in boreal streams: the role of processes, con-nectivity, and scaling. Ecosystems 2011;14:880–93.
Lindgren G, Wrede S, Seibert J, Wallin M. Nitrogen source apportionment modeling andthe effect of land-use class related runoff contributions. Nord Hydrol 2007;38:317–31.
Löfgren S, Andersen T, Forsius M. The color of water: climate induced water color in-crease in Nordic lakes and streams due to humus. Nordic Council of Ministry bro-chure; 2003. 12 pp.
Lumsdon DG, Stutter MI, Cooper RJ, Manson JR. Model assessment of biogeochemicalcontrols on dissolved organic carbon partitioning in an acid organic soil. EnvironSci Technol 2005;39:8057–63.
Maloney KO, Morris DP, Moses CO, Osburn CO. The role of iron and dissolved organiccarbon in the absorption of ultraviolet radiation in humic lake water. Biogeochem-istry 2005;75:393–407.
Mattsson T, Kortelainen P, Räike A. Export of DOM from boreal catchments: impacts ofland use cover and climate. Biogeochemistry 2005;76:373–94.
Michalzik B, Tipping E, Mulder J, Gallardo Lancho JF, Matzner E, Bryant CL, et al. Model-ing the production and transport of dissolved organic carbon in forest soils. Biogeo-chemistry 2003;66:241–64.
Miller MP, McKnight DM, Chapra SC. Production of microbially-derived fulvic acid fromphotolysis of quinine-containing extracellular products of phytoplankton. AquatSci 2009;71:170–8.
Mladenov NM, McKnight DM, Wolski P, Ramberg L. Effects of annual flooding on dis-solved organic carbon dynamics within a pristine wetland, the Okavango delta, Bo-tswana. Wetlands 2005;25:622–38.
Monteith DT, Stoddard JL, Evans CD, de Wit HA, Forsius M, Høgåsen T, et al. Dissolvedorganic carbon trends resulting from changes in atmospheric deposition chemis-try. Nature 2007;450:537–40.
Mulholland PJ. Large-scale patterns in dissolved organic carbon concentration, flux andsources. In: Findlay S, Sinsabaugh RL, editors. Aquatic ecosystems: interactivity ofdissolved organic matter. New York: Elsevier; 2003. p. 139–59.
Nash JE, Sutcliffe JV. River flow forecasting through conceptual models, part I – a discussionof principles. J Hydrol 1970;10:282–90.
Neff JC, Asner GP. Dissolved organic carbon in terrestrial systems: synthesis and amodel. Ecosystems 2001;4:29–48.
Oni SK, Futter MN, Dillon PJ. Landscape-scale control of carbon budget of Lake Simcoe:a process- based modelling approach. J Great Lakes Res 2010;37:160–5.
Oni SK, Futter MN, Molot LA, Dillon PJ. Modelling the long term impact of climatechange on the carbon budget of Lake Simcoe, Ontario using INCA-C. Sci Total Envi-ron 2012;414:387–403.
Persson G. Phosphorus in tributaries to Lake Mälaren, Sweden: analytical fractions, an-thropogenic contribution and bioavailability. Ambio 2001;30:486–95.

11J.LJ. Ledesma et al. / Science of the Total Environment 432 (2012) 1–11
Persson G, Bärring L, Kjellström E, Strandberg G, Rummukainen M. Climate indices forvulnerability assessments. SMHI Reports Meteorology and Climatology, 111. ;2007. 64 pp.
Rankinen K, Karvonen T, Butterfield D. A simple model for predicting soil temperaturein snow-covered and seasonally frozen soil: model description and testing. HydrolEarth Syst Sci 2004;8:706–16.
Ravichandran M. Interactions between mercury and dissolved organic matter – A review.Chemosphere 2004;55:319–31.
Seibert J. HBV light version 2, User's manual. Uppsala: Department of EnvironmentalAssessment, SLU; 2002. 32 pp.
Skjelkvåle BL, Stoddard JL, Jeffries DS, Tørseth K, Høgåsen T, Bowman J, et al. Regionalscale evidence for improvements in surface water chemistry 1990–2001. EnvironPollut 2005;137:165–76.
SMHI, SverigesMeteorologiska ochHydrologiska Institut, http://www.smhi.se/en/Research/Research-departments/Hydrology/hype-in-sweden-s-hype-1.7891, 2011-10-19.
Sonesten L, Wallin M, Vrede T, Wallman K. Miljöövervakning I Mälaren 2009. Mälarensvattenvårdsförbund; 2010. 32 pp.
Vogt RD, Muniz IP. Soil and stream water chemistry in a pristine and boggy site in mid-Norway. Hydrobiologia 1997;348:19–38.
Wade AJ, Durand P, Beaujouan V, Wessel WW, Raat KJ, Whitehead PG, et al. A nitrogenmodel for European catchments: INCA, newmodel structure and equations. HydrolEarth Syst Sci 2002a;6:559–82.
Wade AJ, Whitehead PG, Butterfield D. The Integrated Catchments model of Phosphorusdynamics (INCA-P), a new approach for multiple source assessment in heterogeneousriver systems: model structure and equations. Hydrol Earth Syst Sci 2002b;6:583–606.
Wallin M, Andersson B, Johnson R, Kvarnäs H, Person G, Weyhenmeyer G, et al. Mäl-aren miljötillstånd och utveckling 1965–98. Mälarens vattenvårdsförbund; 2000.94 pp.
Watts CD, Naden PS, Machell J, Banks J. Long term variation in water colour from York-shire catchments. Sci Total Environ 2001;278:57–72.
Weyhenmeyer GA, Willén E, Sonesten L. Effects of an extreme precipitation event onwater chemistry and phytoplankton in the Swedish Lake Mälaren. Boreal EnvironRes 2004;9:409–20.
Whitehead PG, Wilson EJ, Butterfield D. A semi-distributed Integrated Nitrogen modelfor multiple source assessment in Catchments (INCA): part I—model structure andprocess equations. Sci Total Environ 1998;210:547–8.
Whitehead PG, Futter MN, Wilby R. Impacts of climate change on hydrology, nitrogenand carbon in upland and lowland streams: assessment of adaptation strategies tomeet Water Framework Directive Objectives. Durham: BHS 9th National Hydrolo-gy Symposium; 2006. p. 129–34.
Wilson HF, Xenopoulos MA. Ecosystem and seasonal control of stream dissolved organ-ic carbon along a gradient of land use. Ecosystems 2008;11:555–68.