long-term dynamic patterns and diversity of … · long-term dynamic patterns and diversity of...
TRANSCRIPT

Verasztó et al.: Long-term dynamic patterns and diversity of phytoplankton communities in a large eutrophic river - 329 -
APPLIED ECOLOGY AND ENVIRONMENTAL RESEARCH 8(4): 329-349. http://www.ecology.uni-corvinus.hu ● ISSN 1589 1623 (Print) ● ISSN 1785 0037 (Online)
2010, ALÖKI Kft., Budapest, Hungary
LONG-TERM DYNAMIC PATTERNS AND DIVERSITY OF PHYTOPLANKTON COMMUNITIES IN A LARGE EUTROPHIC
RIVER (THE CASE OF RIVER DANUBE, HUNGARY)
VERASZTÓ, CS.1 – KISS, K.T.2 – SIPKAY, CS.2 – GIMESI, L.3 – VADADI-FÜLÖP, CS.4 – TÜREI, D.4 – HUFNAGEL, L.5*
1Eötvös Loránd University, Department of Systematic Botany and Ecology, H-1117 Budapest, Pázmány Péter sétány 1/c, Hungary
2Hungarian Academy of Sciences, Institute of Ecology and Botany, Hungarian Danube Research Station,
H-2131 Göd, Jávorka Sándor út 14, Hungary
3University of Pécs, Department of Informatics and General Technology, H-7624 Pécs, Ifjúság útja 6, Hungary
4Eötvös Loránd University, Department of Systematic Zoology and Ecology, H-1117 Budapest, Pázmány Péter sétány 1/c, Hungary
5„Adaptation to Climate Change” Research Group of the Hungarian Academy of Sciences, H-1118 Budapest, Villányi út 29-43, Hungary
(phone: +36-1-482-6261; fax: +36-1-466-9273)
*Corresponding author e-mail: [email protected]
(Received 16th August 2010 ; accepted 19th November 2010)
Abstract. In this paper we present the composition, seasonal dynamics and fluctuations in diversity of the phytoplankton in the Danube River over 24 years. Weekly samplings were conducted at one section of the river at Göd, in the 1669 river kilometer segment. The change in the phytoplankton community structure was analyzed in relation of water temperature and discharge means. Our findings support the opinion that the Danube is very rich in species, although many of the species are rare and could be described only as coloring species. Results indicate trends in the phytoplankton abundance, which are only detectable in long-term studies. By the help of diversity indices we have observed an increase in the phytoplankton community diversity. With the relevant information, an explanation of the significant changes in diversity and richness was formed. Our goals were a construction of a solid database of the phytoplankton, examining the seasonal dynamics of the phytoplankton through a 24 year long study and to see the most important changing factors of the community. The results of this study are to assist and help future model developments to predict the phytoplankton seasonal dynamic patterns. Keywords: river phytoplankton, LTER, diversity, multivariate analysis
Introduction During the last decades our knowledge about the taxonomical composition,
quantitative relations, seasonal changes and long-term changes of phytoplankton in the Hungarian stretch of River Danube became more and more complete (Kiss, 1987; Kiss and Schmidt, 1998; Szemes, 1967a,b; Uherkovich, 1969). The phytoplankton is characterised by high densities of centric diatoms from early spring to late autumn. Besides the centrics, the chlorococcalean species are abundant during summer.
Verasztó et al.: Long-term dynamic patterns and diversity of phytoplankton communities in a large eutrophic river - 330 -
APPLIED ECOLOGY AND ENVIRONMENTAL RESEARCH 8(4): 329-349. http://www.ecology.uni-corvinus.hu ● ISSN 1589 1623 (Print) ● ISSN 1785 0037 (Online)
2010, ALÖKI Kft., Budapest, Hungary
Because the nutrient supply of the river is high, the potential trophic level is hypertrophic or eutrophic (Déri, 1991; Varga et al., 1989). During the low water period 70-90 % of the water column belongs to the euphotic zone (Kiss, 1994). This is a favourable situation for the quick proliferation of the phytoplankton. The density of centric diatoms is 20000 – 70000 cell ml-1; biomass 10-30 mg l-1 at that time. This group forms 90-95 % of the abundance in spring and 65-75 % in summer. After floods, when the density of algae is low, they can develop quickly (Schmidt et al., 1996; Kiss, 1984; Kiss et al., 2006). The cell number of centrics can rise by two times during two-three days in summer (Kiss, 1994, 1996).
The phytoplankton abundance showed great seasonal and yearly changes (Kiss, 1994; Kiss and Schmidt, 1998; Vörös et al., 2000). Such results were presented about periphytic algae, too (Ács and Kiss, 1993) after comparing two years. Such detailed long term study of the phytoplankton of the River Danube was only performed for the Hungarian stretch. This current database could be the base of future river monitoring, for example (Ács et al., 2006). The importance of the long term scale is clearly shown in Sommer et al. (1993), since the small-scale change in weather for terrestrial vegetation has an effect of climatic magnitude for the phytoplankton, because of its fast reproduction rate. According to Reynolds (1997), one year change in the weather counts for a climatic change for the phytoplankton. Our study contributes to understand the community dynamics of the riverin phytoplankton (Tilman, 1982; Tilman et al., 1982) and provides valuable information for defending the community from harmful algal blooms (Anderson et al., 2008). Every phytoplankton study is of great importance, since the Earth phytoplankton biomass plays a capital role (compared to other living beings) in shaping the global climate (Charlson et al., 1987; Williamson and Gribbin, 1991). The understanding of long-term changes and seasonal dynamics is crucial for modelling. Our work serves as a base for the simulation modelling of seasonal dynamics (Sipkay et al., 2008a, 2008b) for which we already have strategic model of the theoretical algae community (Drégelyi-Kiss and Hufnagel, 2009a, 2009b).
The aim of this study was to construct a solid database of the phytoplankton, examining the seasonal dynamics of the phytoplankton through a 24 year long study and to see the most important changing factors of the community in a eutrophic large river.
Materials and methods The River Danube is a eutrophic large river with relatively high water discharge
(average water runoff at Budapest = 2300 m3s-1, average current velocity 1-1.5 ms-1). Because of the turbulence and sampling method the phytoplankton is considered homogeneous, except for the areas of river bank. Samples were taken weekly sometimes biweekly between 1979 and 2002 upstream of Budapest, at Göd (1669 river kilometer), from near the surface of the river 5 times in 1 liter bottles with 1 minute intervals for Utermöhl method). This way a sample has been collected from a 500-600 meter long section, which homogeneousity is plausible (Kiss et al., 1996). Samples for phytoplankton analysis were fixed with Lugol solution. This study demonstrates data collected for 24 years, but sampling continues up to this day. The quantitative changes in the phytoplankton growth shows, that biweekly sampling is within an average of 10% margin of error (Kiss et al., 1996).
Quantitative analysis was performed using Utermöhl’s method by inverted microscope (OPTON Invertoscope-D). For counting statistics and calculation errors

Verasztó et al.: Long-term dynamic patterns and diversity of phytoplankton communities in a large eutrophic river - 331 -
APPLIED ECOLOGY AND ENVIRONMENTAL RESEARCH 8(4): 329-349. http://www.ecology.uni-corvinus.hu ● ISSN 1589 1623 (Print) ● ISSN 1785 0037 (Online)
2010, ALÖKI Kft., Budapest, Hungary
suggestions of Lund et al. (1958) were used (400 algal specimens were counted, the calculation error is ±10 %). To get biomass value, the specimen number of each species needs to be multiplied with their peculiar cell volume. The outcome can uniformly be normalized to mg l-1 measure.
The examinations of species diversity that have a great specialized literature, the demand for the elaboration of species abundance models have emerged (Izsák and Szeidl, 2009), that is analyzing in what entity numbers (mass) do species take part in the examined community (Magurran, 1988; Pásztor and Oborny, 2007). The received gradation provides information about the power relations of the species.
The species abundance models start from the assumption that if a species (community) obtains bigger resources (nutriment, living space etc.), then it will appear in greater entity number (Izsák and Szeidl, 2009). Certain literature dealing with ecology mention three basic models: geometrical, lognormal, and broken stick models (Aoki, 1995; Dunbar et al., 2002; Kobayashi, 1985; Saldaña and Ibáñez; 2004; Skalskia and Pośpiechb, 2006). Beta-distribution is hardly mentioned by literature apart from a few exceptions (Fattorini, 2005; Muneepeerakula et al., 2007), we still use it, because in certain cases this model approximates abundance-distribution the best. Izsák and Szeidl (2009) verified that beta-distribution is very similar to lognormal distribution in case of certain parameters, and with the prosperous choice of parameter it nears well the broken stick model too.
Besides the conventional imagery and graphs, method of Gimesi (2008, 2009) of three-dimensional illustration was used to present annual and monthly trends on the same diagram. During the 24 years, 1176 samples were analysed and in the vicinity of 530 species were identified, thus Multivariate Data Analysis (such as Hierarchical Clustering and non-metric multidimensional scaling: “NMDS”) was used beside the conventional statistical analysis. In this analysis the spatial changes were left out of consideration, only temporal markings were studied. The datamatrix constructed from the sample data was also logarithmically transformed and binarized, in order to emphasize rare species in the analysis. Euclidean distance and the Past data analysis package ver. 1.36 and 1.55 were used for every multivariate analysis (Hammer et al., 2001).
Results Long-term changes in phytoplankton abundance
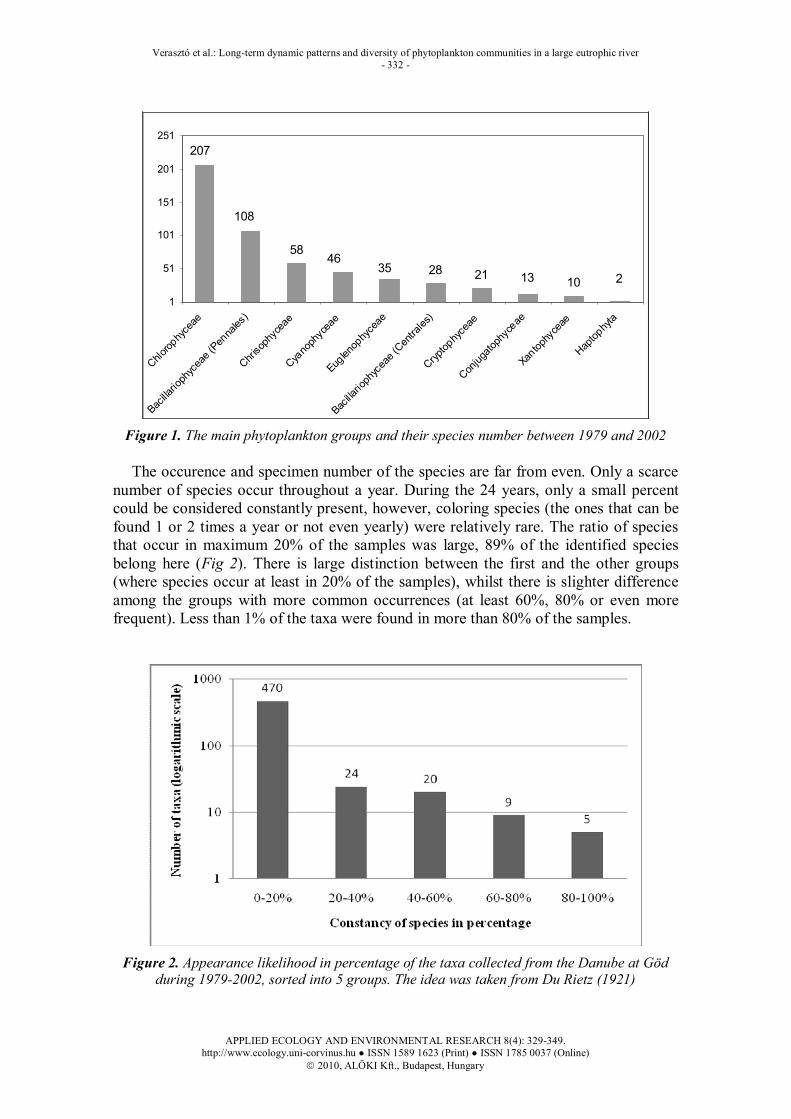
During the investigated period of 1979-2002 a total of 528 taxa were identified from the phytoplankton at Göd. Compared to this number in 1998, 583 species were identified throughout the length of the river within Hungarian borders and 2696 algal taxa were mentioned in Kusel-Fetzmann’s summary (1998), which was published on the full length of the Danube. The most species belong to the classes of Chlorophyceae and Bacillarophyceae (Fig. 1). The abundance distribution was also much distorted. Although, the most abundant group, the Chlorophyceae class had 207 species, they only represented 5.8 % of the total biomass. The two Bacillarophyceae groups dominated the whole community with a 92.1 % participation and from that, only 28 Centrales taxa were responsible for 89.9 % of the phytoplankton biomass.
Verasztó et al.: Long-term dynamic patterns and diversity of phytoplankton communities in a large eutrophic river - 332 -
APPLIED ECOLOGY AND ENVIRONMENTAL RESEARCH 8(4): 329-349. http://www.ecology.uni-corvinus.hu ● ISSN 1589 1623 (Print) ● ISSN 1785 0037 (Online)
2010, ALÖKI Kft., Budapest, Hungary
5828 21 10 2
3546
108
207
13
1
51
101
151
201
251
Chlorop
hyce
ae
Bacilla
rioph
ycea
e (Pen
nales
)
Chriso
phyc
eae
Cyano
phyc
eae
Euglen
ophy
ceae
Bacilla
rioph
ycea
e (Cen
trales
)
Cryptop
hyce
ae
Conjug
atoph
yceae
Xantop
hyce
ae
Haptop
hyta
Figure 1. The main phytoplankton groups and their species number between 1979 and 2002 The occurence and specimen number of the species are far from even. Only a scarce
number of species occur throughout a year. During the 24 years, only a small percent could be considered constantly present, however, coloring species (the ones that can be found 1 or 2 times a year or not even yearly) were relatively rare. The ratio of species that occur in maximum 20% of the samples was large, 89% of the identified species belong here (Fig 2). There is large distinction between the first and the other groups (where species occur at least in 20% of the samples), whilst there is slighter difference among the groups with more common occurrences (at least 60%, 80% or even more frequent). Less than 1% of the taxa were found in more than 80% of the samples.
Figure 2. Appearance likelihood in percentage of the taxa collected from the Danube at Göd
during 1979-2002, sorted into 5 groups. The idea was taken from Du Rietz (1921)

Verasztó et al.: Long-term dynamic patterns and diversity of phytoplankton communities in a large eutrophic river - 333 -
APPLIED ECOLOGY AND ENVIRONMENTAL RESEARCH 8(4): 329-349. http://www.ecology.uni-corvinus.hu ● ISSN 1589 1623 (Print) ● ISSN 1785 0037 (Online)
2010, ALÖKI Kft., Budapest, Hungary
For the long-term analysis the phytoplankton density was measured in ind ml-1 and mg l-1 biomass means (Fig. 3). Between each year a considerable difference is present, big jumps in density between years are rotating as well, as short and long tendencies. While between 1960 and 1980 the phytoplankton numbers in the Danube were nearly duplicating, this trend seems to be reversing to the millennia. During the beginning of the 80s there was a period (1981-1983) where 30000 ind ml-1 of average abundance and 17-19 mg l-1 of biomass occurred. This period was followed by a recession in phytoplankton numbers, which lasted till 1987. The 90s could be characterized with 2 periods of high densities of phytoplankton, although this time the maximum of the average abundance was 20000 ind. ml-1 and the biomass 11-14 mg l-1. In the very last years of this study the abundance diminished to 10000 ind. ml-1 and the biomass 4-5 mg l-1. The trendlines indicate a clear decrease in density and in the magnitude of the phytoplankton biomass.
Figure 3. Phytoplankton abundance (ind. ml-1) and biomass (mg L-1) means in each year at Göd
and the trendlines The change of phytoplankton abundance can be observed in more detail on Fig. 4.
Early years (1981-1985) show late winter blooms and summer periods with intensive algal growth. The highest numbers in phytoplankton were found during these blooms. Such density in summer can be found only in these early years. After 1985, for nearly 5 years, late winter blooms of the community disappeared. In the latter years (1991-1998) only late winter and early spring blooms were found in the samples and the other ones disappeared.

Verasztó et al.: Long-term dynamic patterns and diversity of phytoplankton communities in a large eutrophic river - 334 -
APPLIED ECOLOGY AND ENVIRONMENTAL RESEARCH 8(4): 329-349. http://www.ecology.uni-corvinus.hu ● ISSN 1589 1623 (Print) ● ISSN 1785 0037 (Online)
2010, ALÖKI Kft., Budapest, Hungary
Figure 4. Quantitative fluctuations of the phytoplankton of the Danube River between 1979 and
2002 with three-dimensional imagery. The x axis represents months, the y axis years. On the right side of the graph the shadows indicate the abundances in ind. l-1
Regarding the Stephanodiscus spp. group (consist of those 9-12 near related species
from the Stephanodiscus, Cyclotella, Thalassiosira és Cyclostephanos genus, that cannot be identified with light microscope during the Utermöhl’ counting) more accurate observation can be made while analyzing its 3D graph (Fig. 5). Compared to the previous graph, here the absence of summer blooms are more emphatic after 1985. In the 90s the Stephanodiscus spp. peaks are only detectable in the early spring periods. The seasonal dynamic of this group is not steady, for some reason the former conspicuous Centrales peaks have been missing the later years.
Figure 5. The Stephanodiscus spp. abundance between 1979 and 2002 with 3D-imagery. The x axis represents months, the y axis years. On the right side of the graph the shadows indicate the
abundances in ind. l-1

Verasztó et al.: Long-term dynamic patterns and diversity of phytoplankton communities in a large eutrophic river - 335 -
APPLIED ECOLOGY AND ENVIRONMENTAL RESEARCH 8(4): 329-349. http://www.ecology.uni-corvinus.hu ● ISSN 1589 1623 (Print) ● ISSN 1785 0037 (Online)
2010, ALÖKI Kft., Budapest, Hungary
Diversity indices To measure the biological diversity of a community, using diversity indices of
different kind is a very useful tool, each providing slightly different information about the community structure in question and about the changes in the background. Diversity indices are formed from two components of empirical approach, the evenness and the richness component. Since an accurate definition for biodiversity cannot be given, we examined many diversity indices (Shannon H, Simpson 1-D, Evenness eH/S, Menhinick, Margalef, Equitability J, Fisher alpha, Berger-Parker). Comparing these diversity indices we have found they all show similar seasonal dynamics, so in this paper we only present the Shannon index in detail.
The phytoplankton community diversity has ascending and descending periods during the years (Fig. 6). In the very early years diversity is high, which drops down and a new peak was shown only 10 years later in the early 90s. Then diversity started to decrease again, which lasted till 1998. In the last years of the study we measured another rise with characteristically higher minimum values in winter. Compared to these last years, earlier minimum and maximum values were following a periodic pattern, in winter with low, in summer with high diversity values, respectively.
Figure 6. Shannon diversity of phytoplankton of Danube from 1979 till 2002 and the Trendline
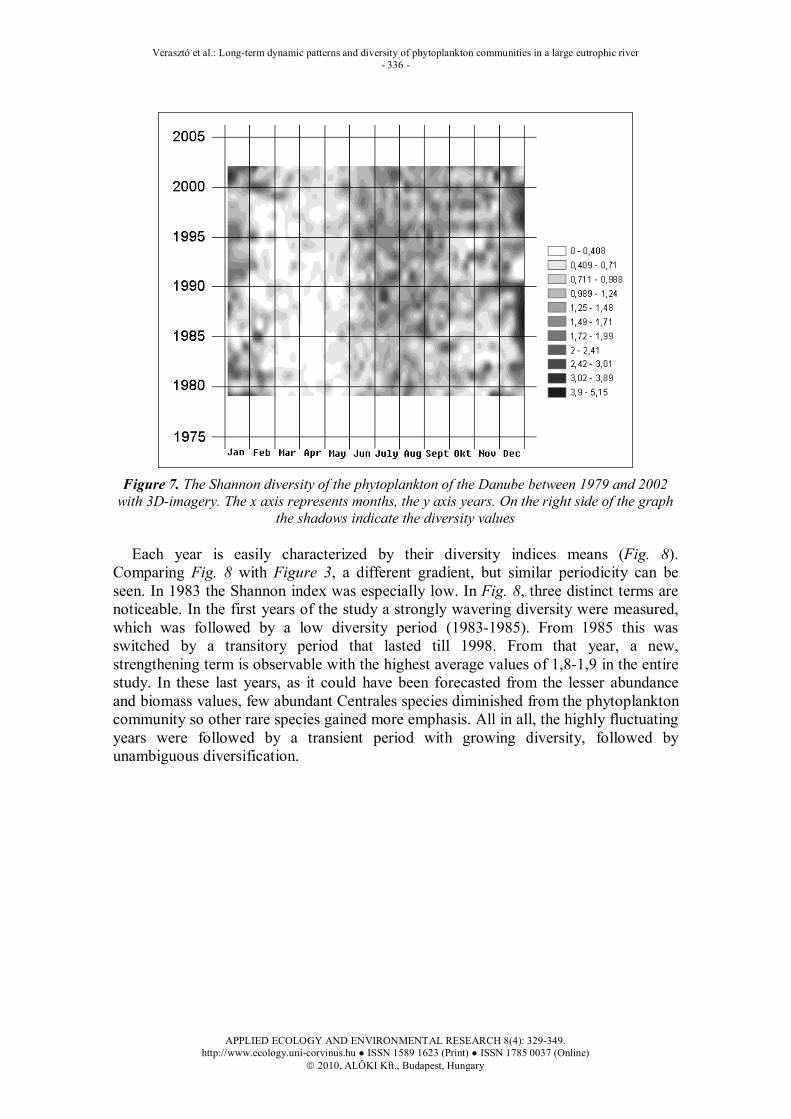
To compare each year, the 3D-imagery of the Shannon diversity is forcibly
descriptive (Fig. 7). Late winter and early spring periods have the lowest diversity indices. Only a few species are to be responsible for this. Also these low diversity periods appear at a slightly different time during the years. In the early years of 1979-1984 periods started at the end of February or at the first days of March, however, from 1985 low diversity periods started to appear a little earlier. Between 1988 and 1999 the diversity was low throughout February. We have observed higher diversity values in the summer periods of the latter years. The highest peaks of diversity can be found in late November and December. This shows the importance of the continuous sampling during winter. In December 1991 no sample was collected, that is why the diversity is zero at that time.
Verasztó et al.: Long-term dynamic patterns and diversity of phytoplankton communities in a large eutrophic river - 336 -
APPLIED ECOLOGY AND ENVIRONMENTAL RESEARCH 8(4): 329-349. http://www.ecology.uni-corvinus.hu ● ISSN 1589 1623 (Print) ● ISSN 1785 0037 (Online)
2010, ALÖKI Kft., Budapest, Hungary
Figure 7. The Shannon diversity of the phytoplankton of the Danube between 1979 and 2002
with 3D-imagery. The x axis represents months, the y axis years. On the right side of the graph the shadows indicate the diversity values
Each year is easily characterized by their diversity indices means (Fig. 8).
Comparing Fig. 8 with Figure 3, a different gradient, but similar periodicity can be seen. In 1983 the Shannon index was especially low. In Fig. 8, three distinct terms are noticeable. In the first years of the study a strongly wavering diversity were measured, which was followed by a low diversity period (1983-1985). From 1985 this was switched by a transitory period that lasted till 1998. From that year, a new, strengthening term is observable with the highest average values of 1,8-1,9 in the entire study. In these last years, as it could have been forecasted from the lesser abundance and biomass values, few abundant Centrales species diminished from the phytoplankton community so other rare species gained more emphasis. All in all, the highly fluctuating years were followed by a transient period with growing diversity, followed by unambiguous diversification.

Verasztó et al.: Long-term dynamic patterns and diversity of phytoplankton communities in a large eutrophic river - 337 -
APPLIED ECOLOGY AND ENVIRONMENTAL RESEARCH 8(4): 329-349. http://www.ecology.uni-corvinus.hu ● ISSN 1589 1623 (Print) ● ISSN 1785 0037 (Online)
2010, ALÖKI Kft., Budapest, Hungary
Figure 8. Means of Shannon diversity in each year estimated from the phytoplankton samples in
the examined period of 1979-2002 Strong relation was found between values of abundance/biomass and values of
diversity. Most years show low diversity in the late winter periods because of the winter blooms of algae (for example 1984, 1993, 1996), however, there were certain years where the late winter blooms were missing but diversity remained low (1987, 1988, 1995). There were a few rare occasions where the diversity is unnaturally high in the winter periods. Such years included 1979, 2000 and 2002. The summer / early autumn periods were similarly diverse. 1983 and 1992 have characteristically high diversity and high biomass values. In 1985 and 1989-1990, the summer peaks were either very short or absent, whereas the biomass was high compared to the other years. In this paper we only show 2 representative years (Fig. 9).
Figure 9. Two years’ (1983, 1990 biomass and Shannon diversity values. Both years had high diversity in winter. In 1983 after the summer bloom, species disappeared and the diversity fell,
while in 1990 the diversity increased significantly

Verasztó et al.: Long-term dynamic patterns and diversity of phytoplankton communities in a large eutrophic river - 338 -
APPLIED ECOLOGY AND ENVIRONMENTAL RESEARCH 8(4): 329-349. http://www.ecology.uni-corvinus.hu ● ISSN 1589 1623 (Print) ● ISSN 1785 0037 (Online)
2010, ALÖKI Kft., Budapest, Hungary
We have investigated every year’s most dominant species. Obviously we haven’t found the same species every year, since with the diversity increase, we expected that some species would spread, some would disappear. We have found that each year, the 20 most abundant taxa provides 90-95% of the whole biomass, except for short winter periods. Observing each year, between 1979 and 2002, 63 taxa ranked in the Table of ranks (Table 1). Each taxa is coded with a number (according to their alphabetic order) and their ranks change during the years. For an easier understanding some cells were shadowed differently. Following the species rankings through the years is much easier. Every year the Stephanodiscus spp. (Code 481) ranked in the first place. In the second place mostly Skeletonema potamos (Code 467) was found, sometimes replaced by Stephanodiscus neoastraea (in 1979, code 466), Stephanodiscus binderanus (in 1980, code 480) and Pandorina morum (in 1985, code 393), Coelastrum microporum (in 1993, code 129). They are rather abundant in the first part of the examined period: Oocistis borgei (code 374), Skeletonema neoastraea (code 466), Stephanodiscus hantzschii (code 449), Trachelomonas volvocina (code 503) and Chlamydomonas sp (code 86). There are rather abundant in the second part of the examined period: Fragilaria ulna (code 224), Aulacoseira subarctica (code 12) and Planktothrix aghardii (code 419).
Table 1. Table of ranks. Every taxa is coded with numbers for a better overview. Each year (columns) consist of the 20 most abundant taxa’s code. The names behind the codes can be found in the Appendix
1979 1980 1981 1982 1983 1984 1985 1986 1987 1988 1989 1990 1991 1992 1993 1994 1995 1996 1997 1998 1999 2000 2001 2002
1 481 481 481 481 481 481 481 481 481 481 481 481 481 481 481 481 481 481 481 481 481 481 481 481
2 466 480 467 467 467 467 393 467 467 467 467 467 467 467 129 467 467 467 467 467 467 467 467 467
3 467 466 480 449 129 129 467 129 129 129 129 129 129 129 467 129 129 480 129 129 129 480 480 130
4 129 467 129 480 130 393 129 393 250 393 250 130 419 12 393 419 46 129 419 393 43 129 43 129
5 43 43 320 129 449 363 130 130 43 250 43 12 480 393 12 130 393 12 480 43 419 419 129 250
6 86 449 130 130 480 130 43 167 130 130 419 224 393 419 419 46 130 393 250 349 393 393 224 419
7 363 393 518 503 167 167 449 363 363 419 320 320 403 130 130 403 224 130 224 130 12 12 320 58
8 320 86 503 393 320 224 167 250 167 320 130 167 43 224 43 393 250 46 43 403 130 130 130 320
9 148 129 363 363 393 86 363 58 58 480 363 363 12 43 224 224 419 349 12 419 487 58 419 224
10 46 224 186 320 374 43 20 480 320 43 403 58 224 400 320 320 43 224 320 58 58 167 58 480
11 176 130 167 86 46 320 58 20 393 21 258 250 130 320 487 108 480 419 130 12 353 46 363 108
12 58 320 86 43 186 224 374 374 86 167 58 21 216 363 46 216 58 487 46 224 250 403 85 363
13 20 363 22 167 86 366 86 86 224 363 167 85 58 167 400 58 108 403 58 167 363 108 108 43
14 91 487 20 374 363 181 22 401 374 22 85 374 363 20 20 250 320 58 349 363 224 320 167 167
15 167 503 46 58 522 186 88 65 22 85 20 342 401 216 363 363 209 43 167 108 320 25 251 46
16 304 58 58 366 43 58 366 366 176 20 21 393 46 46 58 43 363 108 108 250 167 490 12 393
17 22 173 374 224 58 20 320 46 366 374 22 176 20 58 216 167 487 468 363 487 85 363 250 487
18 503 20 181 46 143 374 445 88 224 58 86 43 167 21 353 20 216 353 400 85 108 85 487 85
19 395 374 91 486 22 176 108 186 85 176 181 20 108 401 22 21 353 400 85 374 22 65 46 374
20 487 181 366 186 445 151 145 108 216 487 176 108 250 374 172 316 12 342 374 214 374 487 353 22

Verasztó et al.: Long-term dynamic patterns and diversity of phytoplankton communities in a large eutrophic river - 339 -
APPLIED ECOLOGY AND ENVIRONMENTAL RESEARCH 8(4): 329-349. http://www.ecology.uni-corvinus.hu ● ISSN 1589 1623 (Print) ● ISSN 1785 0037 (Online)
2010, ALÖKI Kft., Budapest, Hungary
Species abundance models It can be proved from the models that in the case of the smoothest relations and the
most abundant species, the simultaneous broken stick model approximates the abundance-distribution the best. At the same time this means the upper barrier of the different models. With the decrease of the resources and the abundance of the species the models can be ranked after each other as follows: beta-distribution, lognormal distribution, and geometrical distribution.
In Figure 11 the graphs of abundance distribution, lognormal distribution model and beta-distribution model can be seen based on the total harnessing between 1979 and 2002. It can be noticed that at the beginning (in case of species with large abundance) the graph suits the logarithmic model, while with species of smaller entity numbers it follows beta-distribution.
The reason can be that species with smaller entity numbers are less rivals of each other in the consuming of remaining resources that were left by the species with larger abundance. The other possible reason is that the species with smaller entity number distribute more smoothly in time (seasonally), while the abundance of species with large entity number is season-dependent.
The comparison of the gradation of phytoplankton, beta-distribution and lognormal distribution (Fig. 10):
Beta: In case of α= 2,3 and β=0,0001 the correlation of the gradation and beta-distribution is 0,997643.
Lognormal: In case of σ= 1,8 and μ=0,00001 the correlation of the gradation and lognormal distribution is 0,885658775.
Figure 10. The comparison of the gradation of phytoplankton, beta-distribution
and lognormal distribution
Similarity patterns of the phytoplankton assemblage In the first investigation the datamatrix consist of years as sample units and the
abundance of the taxa as variables. Our hypothesis is that the patterns were determined

Verasztó et al.: Long-term dynamic patterns and diversity of phytoplankton communities in a large eutrophic river - 340 -
APPLIED ECOLOGY AND ENVIRONMENTAL RESEARCH 8(4): 329-349. http://www.ecology.uni-corvinus.hu ● ISSN 1589 1623 (Print) ● ISSN 1785 0037 (Online)
2010, ALÖKI Kft., Budapest, Hungary
by the dominant species, the ones abundant every year, so we tried to interpret the results of the multivariate methods with the columns of the ranking table (Table 1). Ordinations were done both with ind. ml-1 and mg l-1 data; however, these ordinations did not differ significantly. We have considered the biomass data more relevant, according to the general algological literature.
On the grounds of the NMDS and Cluster Analysis we can set the next statements about Fig 11 and 12:
The groups cannot be clearly separated in the ordination plot. In the bigger group that is the centre of ordination plot we can sparely find some from the 1980s and 90s. Year 1979 also belongs to this group which is a little bit different from other years. In 1979, Stephanodiscus spp. did not have a peak, but Stephanodiscus neoastraea ranked in the second place with such high biomass that only Skeletonema potamos could exceed. In other years of the group Stephanodiscus spp. is characterised by less biomass but the biomass of the species has decreased as well.
In 1981-1982 the biomass of Skeletonema potamos escalated into a peak and ranked in the second place. At the same time the first Stephanodiscus spp. peak occurred (compared to 1980, their biomass doubled). On the dendogram, the year 1981 and 1982 is separated at a very early stage. In center of the ordination plane the late 1980s and early 1990s compose a group. In these years Stephanodiscus spp. have lower biomass and other species diminished as well. Aside from this, the year 1994 forms a separate group. In this year Skeletonema potamos has a salient peak.
The last group was formed from the years 1995, 1999, 1983, 1984, 1985 and the 2000s. Although in these years Stephanodiscus spp. and Skeletonema potamos occupied the first 2 places, their biomass were only half and seventh of the previous years’. In these years every dominant species’ biomass was smaller. 1985 and 1999 belong in this group; however, their similarity could not be interpreted by the ranking of the dominant species, except for the increase of Pandorina morum in 1985.
No other significant separation could be interpreted by the table of ranks
Figure 11. Ordination of the studied years with NMDS method for every taxa
(Euclidean distance)

Verasztó et al.: Long-term dynamic patterns and diversity of phytoplankton communities in a large eutrophic river - 341 -
APPLIED ECOLOGY AND ENVIRONMENTAL RESEARCH 8(4): 329-349. http://www.ecology.uni-corvinus.hu ● ISSN 1589 1623 (Print) ● ISSN 1785 0037 (Online)
2010, ALÖKI Kft., Budapest, Hungary
Figure 12. The dendogram for every taxa (Euclidean distance)
Similarity patterns based on logarithmic transformation of the data matrix
We assumed that the most abundant species have influenced the previous analysis. A logarithmic transformation of the data tempers the (order of) magnitude in difference and decreases the emphasis of the dominant species. The standard method is to add 1 to every value, however, we only added 1 to the 0 values (absence of the phytoplankton), since the standard method would have distort the biomass data (from asymmetric to the right distribution to an asymmetric to the left distribution).
A temporal trend can be observed in the groups (Fig. 13 and 14). On the one hand, long-term changes were clearly indicated: the first (1979-1990) and the last (1991-2002) part of the examined period can be clearly separated. On the other hand, each year is followed by the next one in the ordination plot till the end of the 1980s, where we suspect a great change in the phytoplankton composition.
The separation of these periods cannot be explained with the ranking or the abundance. The years 1989, 1990 and 2002 have the highest species number. Each year had over 220-230 species. After the logarithmic transformation these new species got a strong emphasis. Surveying each year’s taxonomic composition we found, that for example in 1990, there were 70 species that disappeared to 1991 and there were only 33 new species in 1991.
The 1990s and the 2000s have separated clearly as individual groups, but the temporal trend is harder to notice. 1995, as a year rich in species is separated clearly, same as the 2000s where the species numbers were also high.

Verasztó et al.: Long-term dynamic patterns and diversity of phytoplankton communities in a large eutrophic river - 342 -
APPLIED ECOLOGY AND ENVIRONMENTAL RESEARCH 8(4): 329-349. http://www.ecology.uni-corvinus.hu ● ISSN 1589 1623 (Print) ● ISSN 1785 0037 (Online)
2010, ALÖKI Kft., Budapest, Hungary
Figure 13. After logarithmic transformation of the data, the NMDS ordination of the studied
years with Euclidean distance
Figure 14. After logarithmic transformation of the data, the dendogram of the studied years
with Euclidean distance
A seeded scale type, the binary variable In most cases one variable can take infinite values. The strongest reduction of this is
the binarization, which equals the species presence/absence characteristic. On this scale,

Verasztó et al.: Long-term dynamic patterns and diversity of phytoplankton communities in a large eutrophic river - 343 -
APPLIED ECOLOGY AND ENVIRONMENTAL RESEARCH 8(4): 329-349. http://www.ecology.uni-corvinus.hu ● ISSN 1589 1623 (Print) ● ISSN 1785 0037 (Online)
2010, ALÖKI Kft., Budapest, Hungary
we are only interested in what effect each species have on the whole community regardless of their abundance (may it by ind ml-1 or mg l-1). In this case (Fig. 15 and 16) we observed an even stronger “arch effect” and continuous transition during the years.
The earlier (1979-1990) and latter (1991-2002) years behaved like in the results of the logarithmic transformation. The contingency of the vast number of coloring species is clearly noticeable, this can be observed on the Cluster Analysis, the years separate very early. A temporal trend is clearly recognizable on the ordination plot like in the results of logarithmic transformation.
A clear separation of the years 1988-1990 can be seen, which was attributed to the high species number (only here has the Hierarchical Clustering significant change).
The highest diversity characterised the last years of the study. It can be explained by the decrease of phytoplankton biomass that is due to the decrease in abundance of dominant species.
On the whole we can assess that when no quantitative effect influences the assays, the main organizing order is the number of rare species each year. The pattern of occurrence looks to be a continuously shifting gradient in the ordination plot. The cluster analysis support additional information: the phytoplankton in the Danube River, that is rich in coloring species, is very diverse each year.
Figure 15. NMDS ordination of the studied years with Euclidean distance from binary data

Verasztó et al.: Long-term dynamic patterns and diversity of phytoplankton communities in a large eutrophic river - 344 -
APPLIED ECOLOGY AND ENVIRONMENTAL RESEARCH 8(4): 329-349. http://www.ecology.uni-corvinus.hu ● ISSN 1589 1623 (Print) ● ISSN 1785 0037 (Online)
2010, ALÖKI Kft., Budapest, Hungary
Figure 16. Dendogram of the studied years with Euclidean distance from binary data
Discussion The potential trophic level of River Danube based on nutrient supply (P, N) is
polytrophic in Hungary (Déri, 1991). Therefore in suitable circumstances it can become polytrophic with dense phytoplankton. The actual trophic level changes during the year according to phytoplankton biomass, chlorophyll-a concentration, primary production (Kiss, 1994; Vörös et al., 2000). The river is oligotrophic in December-January, it can become mesotrophic by the end of February in low water periods. From spring to autumn the river is oligo-mesotrophic during the floods and is eutrophic, polytrophic during the low water periods. It is remarkable that certain years the river reaches eu-polytrophic level by March, too (Kiss, 2000).
An important ecological factor controlling the density of phytoplankton is the water transparency, influenced first of all by floods. Light climate of rivers like the River Danube is determined primarily by the quality and quantity of suspended matter and the thickness of the euphotic zone. The suspended matter content of the River Danube is low, transparency is high in low water period and vice versa. The depth of the euphotic zone is 250-300 cm (80-90 % of water column) in low water period and 100-130 cm (25-30 %) during the floods. The effect of dilution, change in current is much less controlling the abundance (Kiss, 1994).
According to recent research we question our previous statement of a river being perfectly homogeneous. We can presume the competitive exclusion theory (Hardin, 1960) is not effective, species from brooks to water reservoirs survive in the Danube for a very long time. The 90% rate of the coloring species supports this hypothesis. In a reservoir detached for years from the mainstream, a still water community is to be developed, which is usually limited by nutriments. From such reservoirs more than hundred were built in the 1960s and 80s along the Danube and it tributaries.
The inner dynamic fluctuations of the plankton community could have a stabilizing effect on the large diversity of the community structure (Huisman and Weissing, 1999). Stress and disturbance events affecting the community (Jacobsen and Simonsen, 1993; Barbiero et al., 1996) could result in the community’s incompetence of reaching equilibrium state with little species numbers, as the mathematical models predict.

Verasztó et al.: Long-term dynamic patterns and diversity of phytoplankton communities in a large eutrophic river - 345 -
APPLIED ECOLOGY AND ENVIRONMENTAL RESEARCH 8(4): 329-349. http://www.ecology.uni-corvinus.hu ● ISSN 1589 1623 (Print) ● ISSN 1785 0037 (Online)
2010, ALÖKI Kft., Budapest, Hungary
We have appointed that diversity changes in the late winter periods have been starting a little earlier from 1985. The increasing magnitude of flushes and the slow increase in water temperature, which were measured during the reported period also suggest, extreme climatic events (IPCC, 2007; Kiss, 2000) have great effect (Sipkay et al. 2009, 2010) on the phytoplankton. Many research studying global warming predicted earlier phytoplankton biomass maximums (Flanagan et al., 2003; Wiedner et al, 2007; Sipkay et al, 2009), especially in the winter periods (Thackerey et al, 2008). It is possible that the phytoplankton of the Danube after 2002 will favor this hypothesis.
The multivariate analyses have led us to different results. The patterns were determined by the dominant species based on the results of the first investigation. The reason we couldn’t separate the groups clearly might be the high representation of dominant species. In cases of logarithmic transformation and binarization of the datamatrix the temporal patterns could be unambiguously recognized. The temporal trend in the examined period (years following one another) can refer to the possibility of the existence of gradually changing environmental factor. Assumable the changes in the degree of nutrient excess could cause this. The economic and environmental consequences of change of regime, that was significant historical event in Hungary, could lead to separation of the two period. The breakdown of the Socialist large-scale industry and the development of sewerage could lead to the decrease of nutrient load in the Danube. According to the statistics the nutrient load has decreased by 40-50 % in Danube’s watershed (Schreiber et al. 2005, ICPDR 2005, Csathó et al. 2007).
This study supports the presumption that despite the food oversupply in the Danube, the community stand in the door-step of an era without large algal blooms. Future monitoring and modeling studies shall have an answer.
Acknowledgements. This research was supported by the “Bolyai János” Research Fellowship (Hungarian Academy of Sciences), the Klíma KKT “Jedlik Ányos” project, the MTA-TKI “Adaptation to Climate Change” Research Group and the Research Assistant Fellowship Support (Corvinus University of Budapest).
REFERENCES
[1] Bothár, A., Kiss, K.T. (1990): Phytoplankton and zooplankton (Cladocera, Copepoda) relationship in the eutroficated River Danube (Danubialia Hungarica, CXI). – Hydrobiologia 191: 165-171.
[2] Ács, É., Kiss, K.T. (1993): Effects of water discharge on periphyton abundance and diversity in a large river (River Danube, Hungary). – Hydrobiologia 249: 125-134.
[3] Ács, É., Kiss, K.T., Padisák, J., Szabó, K.É. (ed.) (2006): 6th International Symposium on Use of algae for monitoring rivers. – Magyar Algológiai Társaság, Budapest, ISBN 963 06 0497 3, pp 192.
[4] Anderson, D.M., Burkholder, J.M., Cochlan, W.P., Glibert, P.M., Gobler, C.J., Heil, C.A., Kudelag, R.M., Parsons, M.L., Rensel, J.E.J., Townsend, D.W., Trainer, V.L., Vargol, G.A. (2008): Harmful algal blooms and eutrophication: Examining linkages from selected coastal regions of the United States. Harmful Algae. – Volume 8, Issue 1, December 2008, Pages 39-53. HABs and Eutrophication.
[5] Aoki, I. (1995): Diversity and rank-abundance relationship concerning biotic compartments. – Ecological Modelling 82: 21-26.
[6] Barbiero, R.P., Speziale, B.J., Ashby, S.L. (1996): Phytoplankton community succession in a lake subjected to artificial destratification. – Hydrobiologia 331: 109-120.

Verasztó et al.: Long-term dynamic patterns and diversity of phytoplankton communities in a large eutrophic river - 346 -
APPLIED ECOLOGY AND ENVIRONMENTAL RESEARCH 8(4): 329-349. http://www.ecology.uni-corvinus.hu ● ISSN 1589 1623 (Print) ● ISSN 1785 0037 (Online)
2010, ALÖKI Kft., Budapest, Hungary
[7] Charlson, R.J., Lovelock, J.E., Andreae, M.O., Warren, S.G. (1987): Oceanic phytoplankton atmospheric sulfur, cloud albedo and climate. – Nature (London) 326: 655-661.
[8] Csathó, P., Sisák, I., Radimszky, L., Lushaj, S., Spiegel, H., Nikolova, M.T., Nikolov, N., Čermák, P., Klir, J., Astover, A., Karklins, A., Lazauskas, S., Kopiński, J., Hera, C., Dumitru, E., Manojlovic, M., Bogdanović, D., Torma, S., Leskošek, M., Khristenko, A. (2007): Agriculture as a source of phosphorus causing eutrophication in Central and Eastern Europe. – British Society of Soil Science Supplement 23: 36-56.
[9] Déri, A. (1991): The role of nitrification the oxygen depletion of the River Danube. – Verh. Internat. Verein. Limnol. 24: 1965-1968.
[10] Drégelyi-Kiss, Á., Hufnagel, L. (2009a): Simulations of Theoretical Ecosystem Growth Model (TEGM) during various climate conditions – Applied Ecology and Environmental Research 7(1): 71-78.
[11] Drégelyi-Kiss, Á., Hufnagel, L. (2009b): Effects of temperature-climate patterns on the production of some competitive species on grounds of modelling. – Environmental Modeling and Assessment, DOI 10.1007/s10666-009-9216-4.
[12] Dunbar, J., Ticknor, L.O., Kuske, C.R. (2002): Empirical and Theoretical Bacterial Diversity in Four Arizona Soils. – Applied and Environmental Microbiology 68: 3035-3045.
[13] Du Rietz, G.E. (1921): Zur methodologischen Grundlage der modernen Pflanzensoziologie. – Holzhausen, Wien. 272 pp.
[14] Fattorini, S. (2005): A simple method to fit geometric series and broken stick models in community ecology and island biogeography. – Acta Oecologica 28: 199-205.
[15] Flanagan, K.M., McCauley, E., Wrona, F., Prowse, T. (2003): Climate change: the potential for latitudinal effects on algal biomass in aquatic ecosystems. – Can. J. Fish Aquat. Sci. 60: 635-639.
[16] Gimesi, L. (2008): The use of 3-dimensional graphic display method for presenting the changes in weather. – Applied Ecology And Environmental Research 6(1): 165-176. (ISSN 1589-1623).
[17] Gimesi, L. (2009): Development of a visualization method suitable to present the tendencies of the changes in precipitation. – Jurnal of Hydrology 377: 185-190.
[18] Hammer, O., Harper, D.A.T., Ryan, P.D. (2001): PAST: Paleontological Statistics software package for education and data analysis. – Paleontologia Electronica 4(1): 9.
[19] Hardin, G. (1960): The competitive exclusion theory. – Science 131: 1292-1297. [20] Huisman, J., Weissing, F.J. (1999): Biodiversity of plankton by species oscillations and
chaos. – Nature 402: 407-410. [21] Ibáñez, J.J., De-Alba, S., Bermúdez, F.F., García-Álvarez, A. (1995): Pedodiversity:
concepts and measures. – Catena 24: 215-232. [22] ICPDR (2005): The Danube River Basin District. Part A – Basin-wide overview.
http://www.icpdr.org/pub. [23] IPCC (2007): The Fourth Assessment Report “Climate Change 2007” – Cambridge
University Press 2008 ISBN-13:9780521705974. [24] Izsák, J., Szeidl, L. (2009): Fajabundancia-eloszlási modellek [Species-abundance
distribution models]. – Pars Kft. Nagykovácsi [in Hungarian]. [25] Jacobsen, B.A., Simonsen, P. (1993): Disturbance events affecting phytoplankton
biomass, composition and species diversity in a shallow, eutrophic, temperate lake. – Hydrobiologia 249: 9-14.
[26] Kiss, K.T. (1994): Trophic level and eutrophication of the River Danube in Hungary. – Ver. Int. Ver. Limnol. 25: 1688-1691.
[27] Kiss, K.T., (1996): Diurnal change of planktonic diatoms in the River Danube near Budapest (Hungary). – Arch. Hydrobiol. Algol. Studies 80: 113-122.

Verasztó et al.: Long-term dynamic patterns and diversity of phytoplankton communities in a large eutrophic river - 347 -
APPLIED ECOLOGY AND ENVIRONMENTAL RESEARCH 8(4): 329-349. http://www.ecology.uni-corvinus.hu ● ISSN 1589 1623 (Print) ● ISSN 1785 0037 (Online)
2010, ALÖKI Kft., Budapest, Hungary
[28] Kiss, K.T. (2000): Növekedett-e a Duna trofitási szintje a Bősi-vízlépcső hatására? [Has the trophic level of the River Danube increased as an effect of the Gabčikovo (Bős) barrage?] – Hidrológiai Közlöny 80: 316-318. [in Hungarian].
[29] Kiss, K.T., Schmidt, A., Ács, É. (1996): Sampling strategies for phytoplankton investigations in a large river (River Danube, Hungary). – In: Whitton, B.A., Rott, E. (eds.): Use of algae for monitoring rivers II Proceedings International Symposium. Innsbruck/Austria, 17-29. September 1995. STUDIA Studentenförderungs-Ges.m.b.H. Innsbruck. p. 179-185.
[30] Kobayashi, S. (1985): Species diversity preserved in different numbers of nature reserves of the same total area. – Researchies on Population Ecology 27: 137-143.
[31] Lund, J.W.G., Kipling, C., Le Cren, E.D. (1958): The inverted microscope method of estimating algal numbers and the statistical basis of estimations by counting. – Hydrobiologia 11: 143-170.
[32] Magurran, A.E. (1988): Ecological Diversity and Its Measurement. – Chapman and Hall, London, 179 pp.
[33] Muneepeerakula, R., Weitzb, J.S., Levinb, S.A., Rinaldoc, A., Iturbea, I.R. (2007): A neutral metapopulation model of biodiversity in river networks. – Journal of Theoretical Biology 245: 351-363.
[34] Pásztor, E., Oborny B. (2007): Ökológia [Ecology]. – Nemzeti tankönyvkiadó Zrt. Budapest. [in Hungarian].
[35] Reynolds, C.S. (1997): Vegetation Processes in the Pelagic: A Model for Ecosystem Theory. Ecology Institute. – Oldendorf/Luhe, Germany. 1997. DM 68. xxvii+371 pp.
[36] Saldaña, A., Ibáñez, J.J. (2004): Pedodiversity analysis at large scales: an example of three fluvial terraces of the Henares River (central Spain). – Geomorphology 62: 123-138.
[37] Schreiber, H., Behrendt, H., Constantinescu, L.T., Cvitanic, I., Drumea, D., Jabucar, D., Juran, S., Pataki, B., Snishko, S., Zessner, M. (2005): Nutrient emissions from diffuse and point sources into the River Danube and its main tributaries for the period of 1998–2000 – results and problems. – Water Science and Technolog 51: 283-290.
[38] Sipkay, Cs., Hufnagel, L., Révész A., Petrányi G. (2008.a): Seasonal dynamics of an aquatic macroinvertebrate assembly (Hydrobiological case study of Lake Balaton, №. 2) – Applied Ecology and Environmental Research 5(2): 63-78.
[39] Sipkay, Cs., Horváth, L., Nosek, J., Oertel, N., Vadadi-Fülöp, Cs., Farkas, E., Drégely-Kiss, Á., Hufnagel, L. (2008.b): Analysis of climate change scenarios based on modelling of the seasonal dynamics of a danubian copepod species. – Applied Ecology and Environmental Research 6(4): 101-109.
[40] Sipkay, CS., Kiss, K.T., Vadadi-Fülöp, CS., Hufnagel, L. (2009): Trends in research on the possible effects of climate change concerning aquatic ecosystems with special emphasis on the modelling approach. – Applied Ecology and Environmental Research 7(2): 171-198.
[41] Sipkay, Cs., Drégely-Kiss, Á., Horváth, L., Garamvölgyi, Á., Kiss, K.T., Hufnagel, L. (2010): Community ecological effects of climate change. – In: Climate change and Variability. Sciyo (in press) ISBN: 978-953-7619-X-X.
[42] Skalski, T., Pośpiech, N. (2006): Beetles community structures under different reclamation practices. – European Journal of Soil Biology 42: 316-320.
[43] Sommer, U., Padisák, J., Reynolds. C.S., Juhász-Nagy, P. (1993): Hutchinson's heritage: the diversity-disturbance relationship in phytoplankton. – Hydrobiologia 249: 1-8.
[44] Szemes, G. (1967a): Systematisches Verzeichnis der Pflanzenwelt der Donau mit einer zusammenfassenden Erläuterung. – In: Liepolt, R. (ed.): Limnologie der Donau. Schweizer-Bartsche Verlag, Stuttgart 3: 70-131.
[45] Szemes,G. (1967b): Das Phytoplankton der Donau. – In: Liepolt, R. (ed.): Limnologie der Donau. Schweizer-Bartsche Verlag, Stuttgart 3: 158-179.
Verasztó et al.: Long-term dynamic patterns and diversity of phytoplankton communities in a large eutrophic river - 348 -
APPLIED ECOLOGY AND ENVIRONMENTAL RESEARCH 8(4): 329-349. http://www.ecology.uni-corvinus.hu ● ISSN 1589 1623 (Print) ● ISSN 1785 0037 (Online)
2010, ALÖKI Kft., Budapest, Hungary
[46] Thackeray, S.J., Jones, I.D., Maberly, S.C. (2008): Long-term change in the phenology of spring phytoplankton: species-specific responses to nutrient enrichment and climatic change. – Journal of Ecology 96: 523-535.
[47] Tilman, D. (1982): Resource competition and community structure. – Princeton University Press, Princetown.
[48] Tilman, D., Kilham, S.S., Kilham, P. (1982): Phytoplankton Community Ecology: The Role of Limiting Nutrients. – Annual Review of Ecology and Systematics 13: 349-372.
[49] Uherkovich, G. (1969a): Über die quantitativen Verhältnisse des Phytosestons (Phytoplanktons) der Donau, Drau und Theiss. – Acta Bot. Hung. 15: 183-200.
[50] Varga, P., Ábrahám, M., Simor, J. (1989): A magyar Dunaszakasz vízminősége (The water quality of the Hungarian Danube section). – Vízügyi Közlem. 71: 582-595.
[51] Vörös, L., V.-Balogh, K., Herodek, S., Kiss, K.T. (2000): Underwater light conditions, phytoplankton photosynthesis and bacterioplankton production in the Hungarian section of the River Danube. – Arch. Hydrobiol., Large Rivers. 11: 511-532.
[52] Wiedner, C., Rücker, J., Brüggemann, R., Nixdorf, B. (2007): Climate change affects timing and size of populations of an invasive cyanobacterium in temperate regions. – Oecologia 152: 473-484.
[53] Williamson, P., Gribbin, J. (1991): How plankton change the climate. – New Sci. 16: 48-52.
APPENDIX
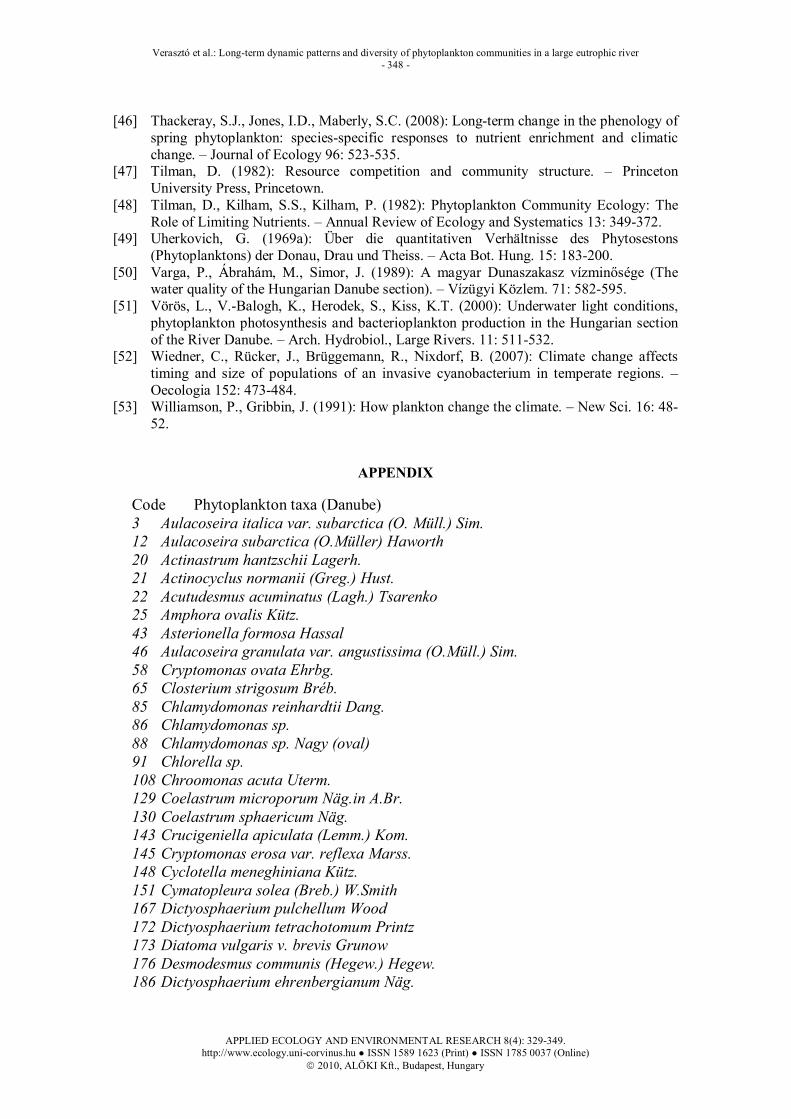
Code Phytoplankton taxa (Danube) 3 Aulacoseira italica var. subarctica (O. Müll.) Sim. 12 Aulacoseira subarctica (O.Müller) Haworth 20 Actinastrum hantzschii Lagerh. 21 Actinocyclus normanii (Greg.) Hust. 22 Acutudesmus acuminatus (Lagh.) Tsarenko 25 Amphora ovalis Kütz. 43 Asterionella formosa Hassal 46 Aulacoseira granulata var. angustissima (O.Müll.) Sim. 58 Cryptomonas ovata Ehrbg. 65 Closterium strigosum Bréb. 85 Chlamydomonas reinhardtii Dang. 86 Chlamydomonas sp. 88 Chlamydomonas sp. Nagy (oval) 91 Chlorella sp. 108 Chroomonas acuta Uterm. 129 Coelastrum microporum Näg.in A.Br. 130 Coelastrum sphaericum Näg. 143 Crucigeniella apiculata (Lemm.) Kom. 145 Cryptomonas erosa var. reflexa Marss. 148 Cyclotella meneghiniana Kütz. 151 Cymatopleura solea (Breb.) W.Smith 167 Dictyosphaerium pulchellum Wood 172 Dictyosphaerium tetrachotomum Printz 173 Diatoma vulgaris v. brevis Grunow 176 Desmodesmus communis (Hegew.) Hegew. 186 Dictyosphaerium ehrenbergianum Näg.

Verasztó et al.: Long-term dynamic patterns and diversity of phytoplankton communities in a large eutrophic river - 349 -
APPLIED ECOLOGY AND ENVIRONMENTAL RESEARCH 8(4): 329-349. http://www.ecology.uni-corvinus.hu ● ISSN 1589 1623 (Print) ● ISSN 1785 0037 (Online)
2010, ALÖKI Kft., Budapest, Hungary
209 Euglena texta (Duj.) Hübn. 214 Fragilaria teñera (W. Smith) Lange-Bertalot 215 Fragilaria ulna v. oxirincus (Kütz.) Lange-Bert. 216 Fragilaria ulna var.acus (Kütz.) Lange-Bert. 250 Gymnodinium sp. 251 Gymnodinium sp. kicsi, kerek 258 Hannaea arcus (Ehrgb.) Patrick 304 Monoraphidium contortum (Thur.) Kom.-Legn. 316 Melosira varians Agardh 320 Micractinium pusillum Fres. 342 Nitzschia palea (Kütz.) W.Smith 349 Nitzschia tryblionella Hantzsh 353 Navicula cryptocephala Kütz. 363 Nitzschia acicularis (Kütz.) W.M.Smith 366 Nitzschia sp. 374 Oocystis borgei Snow 393 Pandorina morum (O.F.Müller) Bory 395 Pennales sp. 400 Peridinium cinctum (Müller) Ehrbg. 401 Peridinium sp. 403 Peridiniopsis kevei Grigorszky 419 Planktothrix aghardii (Gom.) Anagn. et Kom. 445 Scenedesmus ecornis (Ehrbg.) Chod. 449 Stephanodiscus hantzschii Grun. 466 Stephanodiscus neoastraea Hĺkansson & Hickel 467 Skeletonema potamos (Weber) Hasle 468 Skeletonema subsalsum (Cleve-Euler) Bethge 480 Stephanodiscus binderanus (Kütz.) Krieger 481 Stephanodiscus spp. 486 Strombomonas fluviatilis (Lemm.) Deflandre 487 Surirella brebissonii Krammer Lange-Bert. 490 Surirella robusta Ehrenberg 503 Trachelomonas volvocina Ehrbg. 518 Thalassiosira weissflogii (Grunow) Fryxell & Hasle 522 Trachelomonas sp.