long term debt financing as a determinant of firm
TRANSCRIPT
LONG TERM DEBT FINANCING AS A DETERMINANT OF FIRM
PERFORMANCE: A SURVEY OF SELECTED SUGAR MANUFACTURING
FIRMS IN KENYA.
ISABWA KAJIRWA HARWOOD
A THESIS SUBMITTED IN PARTIAL FULFILLMENT OF THE
REQUIREMENTS FOR THE DEGREE OF
MASTER OF BUSINESS MANAGEMENT
SCHOOL OF BUSINESS AND MANAGEMENT SCIENCES
UNIVERSITY OF ELDORET, KENYA
NOVEMBER, 2015

ii
DECLARATION
This is my original work and has never been presented for a degree in this or any other
university for the conferment of a degree.
Isabwa Kajirwa Harwood
SBMS/PGMBM/001/13 Signature............................. Date………………………
Supervisors’ Approval
We hereby approve that the preparation and presentation of this thesis was supervised in
accordance with the guidelines on supervision laid down by University of Eldoret.
Dr. Paul Odwori Signature…………........... Date………………………..
University of Eldoret
Mrs. Katherine Nelima Signature………………... Date……………………......
University of Eldoret

iii
DEDICATION
I dedicate this thesis to my beloved parents Mr. and Mrs. Kajirwa who have always been
a pillar in my life in terms of prayers, financial support and encouragement through the
entire period of the study. To my siblings Churchill, Beverlyne and Joyner for their moral
support and prayers. To servants of God Pastor Douglas Okwomi and Apostle Pius
Masinde for their prayers.
iv
ABSTRACT
The main purpose of this study was to analyze Long term debt financing as a determinant
of the performance of sugar manufacturing firms in Kenya. The study was guided by the
three long term debt financing constructs namely: Corporate bond financing on firm
performance, Long term loan financing on firm performance, Operating lease financing
on firm performance. The tradeoff theory was used to inform the study. The study
adopted a longitudinal research design and a targeted population of 9 and a sample size of
3. Simple random sampling was used to select the respondents. Inferential techniques
were utilized in data analysis. Multiple linear Regressions model was used to identify
significant predictors of Return on Assets controlling for confounders. Corporate bond
financing, long term loan financing and operating lease financing did not have a
significant relationship with Return on Equity. Results indicated that: Corporate bond
financing and firm performance, (β =1.240, p< 0. 001), Long term loan financing and
firm performance, (β =-20.991, p<.004), Operating lease financing and firm performance,
(β =13.619, p<.020). The study concluded the following, Corporate bond financing
significantly positively affects firm performance, Long term loan financing significantly
negatively affects firm performance and operating lease financing does not significantly
affect firm performance. The study recommended that, Sugar firms should become less
dependent on long term loan financing in their capital structure. There is need for sugar
firms to invest more in issuance of corporate bonds. Sugar firms should opt for outright
purchase rather than excessive use of operating lease financing. The study contributed to
literature review, policy and development of measurements of scale. The study suggests
that other studies are needed to explore the effects of long term debt financing on
performance of sugar firms in Kenya using predictors of firm performance other than
long term loan financing and corporate bond financing.

v
TABLE OF CONTENTS
DECLARATION ............................................................................................................................ ii
DEDICATION ............................................................................................................................... iii
ABSTRACT ................................................................................................................................... iv
LIST OF ABBREVIATIONS ...................................................................................................... viii
LIST OF TABLES ......................................................................................................................... ix
LIST OF FIGURES ........................................................................................................................ x
ACKNOWLEDGEMENT ............................................................................................................. xi
OPERATIONAL DEFINITION OF TERMS .............................................................................. xii
CHAPTER ONE ........................................................................................................................... 1
INTRODUCTION......................................................................................................................... 1
1.0 Overview ............................................................................................................................. 1
1.1 Background of the study ..................................................................................................... 1
1.2 Statement of the Problem .................................................................................................... 4
1.3 Objectives of the study........................................................................................................ 5
1.3.1 General objective ............................................................................................................. 5
1.3.2 Specific objectives of the study ....................................................................................... 5
1.4 Research Hypotheses .......................................................................................................... 5
1.5 Justification of the study ..................................................................................................... 5
1.6 Significance of the study ..................................................................................................... 6
1.7 Scope of the study ............................................................................................................... 7
1.8 Limitations of the Study ...................................................................................................... 7
CHAPTER TWO .......................................................................................................................... 8
LITERATURE REVIEW ............................................................................................................ 8
2.0 Introduction .......................................................................................................................... 8
2.1 Concept of Firm Performance .............................................................................................. 8
2.2 Concept of Long Term Debt Financing ............................................................................. 10

vi
2.3 Long Term Debt Financing and Firm Performance .......................................................... 11
2.3.1 Corporate Bond Financing and Firm performance ........................................................ 13
2.3.2 Long Term Loan Financing and Firm performance ...................................................... 16
2.3.3 Operating Lease Financing and Firm performance ....................................................... 19
2.4 Theoretical Framework ..................................................................................................... 23
2.5 Conceptual Framework ..................................................................................................... 25
2.6 Summary ........................................................................................................................... 26
2.7 Research Gap .................................................................................................................... 27
CHAPTER THREE .................................................................................................................... 28
RESEARCH METHODOLOGY .............................................................................................. 28
3.1 Research Design............................................................................................................... 28
3.3 Target population ............................................................................................................. 28
3.4 Sampling Procedure and Sample size .............................................................................. 29
3.5 Data Collection Procedure and Instruments .................................................................... 29
3.6 Measurement of Variables ............................................................................................... 30
3.6.1 Measures of long term debt financing .......................................................................... 30
3.6.2 Measures of Firm performance ..................................................................................... 30
CHAPTER FOUR ....................................................................................................................... 32
RESULTS .................................................................................................................................... 32
4.1 Corporate Bond Financing and Firm Performance ........................................................... 32
4.1.1 Correlation Analysis Results for Corporate Bond Financing ........................................ 32
4.1.2 Regression analysis Results for Corporate Bond Financing .......................................... 34
4.2 Long Term Loan Financing and Firm Performance ......................................................... 35
4.2.1 Correlation Analysis Results for Long Term Loan Financing....................................... 35
4.2.2 Regression analysis Results for Long Term Loans Financing....................................... 35
4.3.1 Correlation Analysis Results for Operating Lease Financing ........................................ 36
4.3.2 Regression analysis Results for Operating Lease Financing ......................................... 37
4.5 Hypothesis Testing............................................................................................................ 38
vii
CHAPTER FIVE ........................................................................................................................ 40
DISCUSSIONS ............................................................................................................................ 40
5.1 Summary of findings........................................................................................................ 40
5.1.1 Corporate bond financing on performance of Sugar Firms .......................................... 40
5.1.2 Long term loan financing on performance of Sugar firms ........................................... 40
5.1.3 Operating Lease financing on performance of Sugar firms .......................................... 40
5.2 Discussion ........................................................................................................................ 41
5.2.1 Corporate bond financing and Sugar Firms performance ............................................. 41
5.2. 2 Long term loan financing and Sugar firms performance ............................................. 42
5.2.3 Operating Lease financing and Sugar firms performance............................................. 43
CHAPTER SIX ........................................................................................................................... 45
CONCLUSIONS AND RECOMMENDATIONS .................................................................... 45
6.1 Conclusions ...................................................................................................................... 45
6.2 Recommendations ............................................................................................................ 45
6.2.1 Policy Recommendations.............................................................................................. 45
6.2.2 Recommendation for Further Research ........................................................................ 46
REFERENCES ............................................................................................................................. 47
APPENDIX 1: LIST OF SELECTED SUGAR FIRMS IN KENYA .......................................... 54
APPENDIX 1I: DATA COLLECTION FORM FOR SECONDARY DATA ............................ 55
APPENDIX 111: FIRMS FINANCIAL STATEMENTS ............................................................ 56

viii
LIST OF ABBREVIATIONS
EBIT - Earnings before interest and tax
EVA - Economic value added
LTDR - Long term debt ratio
MBVR - Market to book value ratio
NIS - National insurance scheme
ROA - Return on assets
ROE - Return on equity
ROS - Return on sales
SOE - State owned enterprises
SMES’ - Small and medium enterprises

ix
LIST OF TABLES
Table 4.1: Correlation between Corporate bond financing, Long term loan financing,
operating lease financing and performance (ROA & ROE)………………………………
…… ………………...........................................................................................................32
Table 4.2: Regression results for Corporate Bond, Long Term Loans & Leasing............33
Table 4.3: Regression model summary Results…………………………………………….
……………………………………………………………………………………………36

x
LIST OF FIGURES
Fig 2.1Conceptual Framework for Long term debt financing: (Corporate bond financing,
long term loan financing, Operating lease financing and firm performance (ROA &
ROE)…………………………………………………………………………………..…24

xi
ACKNOWLEDGEMENT
First of all, I want to express my gratitude to my supervisors, Dr. Paul Odwori and Mrs.
Katherine Nelima. They encouraged my work through their support, interest, and
constructive comments. They gave me freedom to explore possibilities, critical feedback
and practical suggestions for this thesis. Following their guidance I started to learn how
to carry out a research. I really appreciate their commitment and tremendous guidance
given to me.
Second, I want to express my sincere gratitude to my parents, who have always given me
the freedom to pursue whatever I wanted to do and supported me in my decision. Last but
by no means least; I want to express my sincere gratitude to my siblings, classmates and
servants of God for their prayers and moral support.

xii
OPERATIONAL DEFINITION OF TERMS
Firm performance
Refers to a business entity end results and the results may be financial or non financial
(Ittner, 2008). In this study it refers to the end of year financial results of the sugar firms.
Return on Assets
It is a measure of the income available to debt and equity investors per dollar of the
firm‟s total assets” (Brealey et al., 2011). In this study it refers to total revenue divided
by total assets of a firm.
Return on Equity
Refers to the income generated for the shareholder‟s by the equity, which is the financing
provided by the shareholders (Alexander & Nobes, 2010). In this study it is used as
earnings before interest and tax divided by total shareholders‟ equity.
Long term debt financing
Long term debt is a resource that is owed to lenders for a period of more than one year
from the date of the current balance sheet (Lancett, 2008).In this study it referred to all
those resources borrowed by sugar firms whose repayment period was more than one
year from the current balance sheet date.
Corporate Bond Financing
Corporate bonds are debt obligations issued by corporations for the purpose of raising
capital for corporate projects and other means of expanding the issuing corporation

xiii
(Thune, 2014). In this study it referred to the proportion of corporate bond to total long
term debt ratio.
Long term loan financing
A Long term loan is a loan from a financial institution (Athreya, 2008). All types of long
term loans sugar firms used were added to form the actual value for Long term loans in
the study. In this study it refers to the proportion of long term loan financing to total long
term debt ratio.
Operating lease financing
Operating lease is a contract that allows for the use of an asset, but does not convey rights
of ownership of the asset (Lorigan, 2014). In this study it referred to operating lease
obligations of the firm that exceeded one year and it is the proportion of operating lease
financing to total long term debt ratio.

1
CHAPTER ONE
INTRODUCTION
1.0 Overview
This chapter presents the background of the study, statement of the problem, objectives
of the study, research hypotheses, justification of the study, significance of the study,
scope of the study and limitations of the study.
1.1Background of the study
Businesses must pay attention to how they are financed as optimality in their capital
structure would only be achieved when the right financing is adopted. Long term debt
financing is a component of debt finance which is basically resources borrowed to run
business and whose repayment takes more than one year from the current balance sheet
date (Lancett, 2008). Firm performance could either be financial and non-financial
performance (Ittner, 2008). This study concentrates much on financial performance
which measures a firm's overall financial status over a given period of time, and can be
used to compare similar firms across the same industry or to compare industries or
sectors in totality (Ukko, 2009).
The global sugar economy is essentially “managed” rather than allowing free market
forces to hold sway (Tyler, 2007). The World sugar prices have normally been so low
that even the world‟s lowest cost, major exporters, Brazil, Australia, Thailand and
2
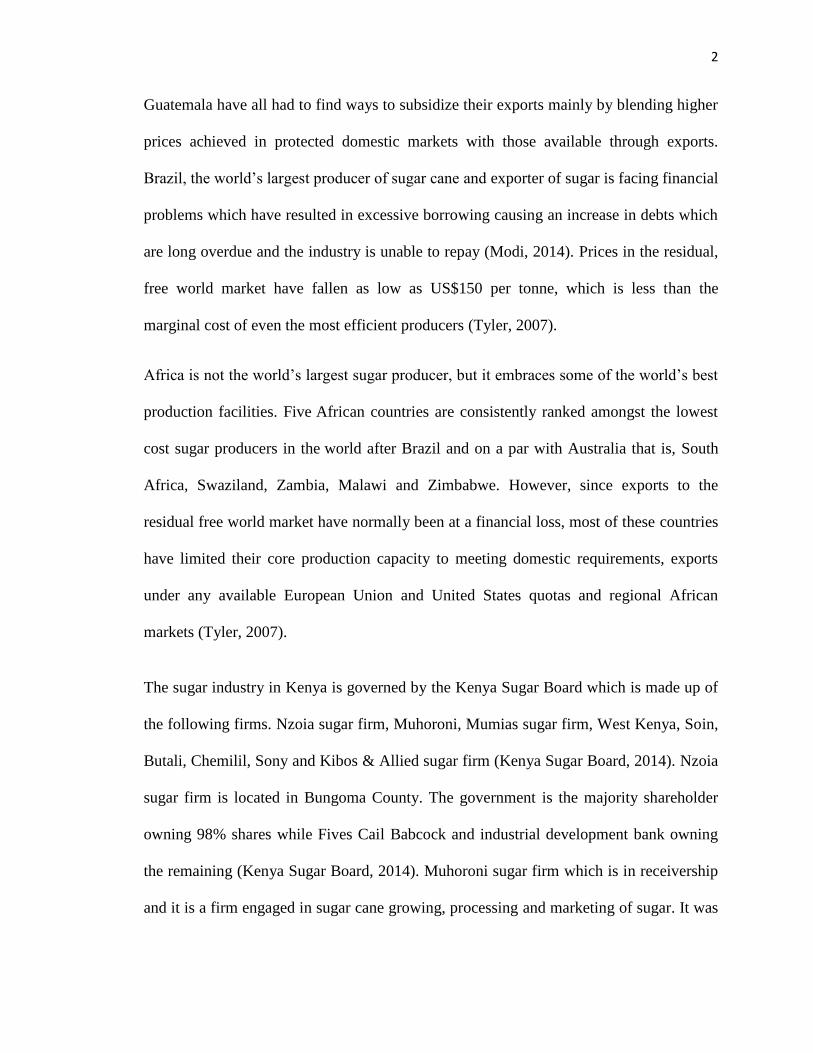
Guatemala have all had to find ways to subsidize their exports mainly by blending higher
prices achieved in protected domestic markets with those available through exports.
Brazil, the world‟s largest producer of sugar cane and exporter of sugar is facing financial
problems which have resulted in excessive borrowing causing an increase in debts which
are long overdue and the industry is unable to repay (Modi, 2014). Prices in the residual,
free world market have fallen as low as US$150 per tonne, which is less than the
marginal cost of even the most efficient producers (Tyler, 2007).
Africa is not the world‟s largest sugar producer, but it embraces some of the world‟s best
production facilities. Five African countries are consistently ranked amongst the lowest
cost sugar producers in the world after Brazil and on a par with Australia that is, South
Africa, Swaziland, Zambia, Malawi and Zimbabwe. However, since exports to the
residual free world market have normally been at a financial loss, most of these countries
have limited their core production capacity to meeting domestic requirements, exports
under any available European Union and United States quotas and regional African
markets (Tyler, 2007).
The sugar industry in Kenya is governed by the Kenya Sugar Board which is made up of
the following firms. Nzoia sugar firm, Muhoroni, Mumias sugar firm, West Kenya, Soin,
Butali, Chemilil, Sony and Kibos & Allied sugar firm (Kenya Sugar Board, 2014). Nzoia
sugar firm is located in Bungoma County. The government is the majority shareholder
owning 98% shares while Fives Cail Babcock and industrial development bank owning
the remaining (Kenya Sugar Board, 2014). Muhoroni sugar firm which is in receivership
and it is a firm engaged in sugar cane growing, processing and marketing of sugar. It was

3
set up in 1964. Muhoroni was placed under protective receivership in the year 2001
(Kenya Sugar Board, 2014).
Mumias Sugar firm is listed on the Nairobi Stock Exchange. Mumias is engaged in the
manufacture and sale of sugar. It was established in 1973 (Kenya Sugar Board, 2014).
The firm is currently highly indebted (Wachira, 2014). Soin Sugar firm is situated in
Kericho District Soin division and it is a privately owned firm established in 1999 (Kenya
Sugar Board, 2014). West Kenya Sugar Company Limited was incorporated in 1979 and
it is situated in Shamberere South Kabras (Kenya Sugar Board, 2014).
Kibos Sugar and Allied firms is located a few kilometers from Kisumu town. Their main
aim is to produce high quality refined sugar for the Kenyan market among other sugar
products. (Kenya Sugar Board, 2014). Butali Sugar firm is located at Butali area, in
Western Kenya (Kenya Sugar Board, 2014).South Nyanza Sugar Company Limited was
established in 1976 and is located in South Western Kenya in Migori County. It‟s located
along Kisii - Migori Highway (Kenya Sugar Board, 2014).
Chemelil Sugar firm is located along the Awasi-Nandi Hills road in Nyando District of
Nyanza province. It was established in 1965 as a private limited company and later
became a parastatal in 1974 (Kenya Sugar Board, 2014). There is an increase in the rate
of indebtedness across the sugar firms which indicate financial instability of the sugar
firms in Kenya and across the world (Otieno, 2014).
The sugar industry in Kenya is not performing well either for example, Sugar firms like
Nzoia (Mutai, 2014), Mumias (Wachira, 2014), Muhoroni (Otieno, 2014), Chemilil

4
(Otieno, 2014), Nzoia are among the firms faced with deteriorating financial performance
characterized with a reduction in firms‟ profitability and hence inability to meet the
firm‟s financial needs. The persistent financial constraints have affected the image of the
sugar industry as it sends away investors. The investors are afraid of investing in highly
indebted firms (Mutai, 2014). This study will therefore add to existing literature that has
discussed issues on long term debt financing such as Umar et al., (2012), and how it has
affected the performance of the Sugar firms.
1.2 Statement of the Problem
The sugar industry caters for the livelihood of many Kenyans in terms of employment
and also forms a ready market for their sugar cane plantations. Statistically 54% of
farmers in western region and part of Nyanza region grow sugarcane (Kenya Sugar
Board, 2014). Most of the sugar firms in Kenya have been recording poor financial
performance for over a decade (Wachira, 2014). For example, Muhoroni Sugar firm has
been recording poor financial performance characterized by low profitability and the firm
recording losses (Mutai, 2014). This financial problem has led to the firm‟s inability to
pay for its administrative costs including wages and salaries expense for their employees
and payment of their creditors. This financial problem at Muhoroni caused the firm being
put under protective receivership to prevent the firm from total collapse and subsequent
closure of the firm (Otieno, 2014). Poor financial performance is one of the reasons for
total collapse of Miwani Sugar firm which up to date the sugar firm is not operational
(Otieno, 2014). Therefore, there existed poor financial performance among the sugar
manufacturing firms in Kenya. This study sought to investigate and provide a solution
5
and necessary recommendations for the problem of poor financial performance in its
entirety.
1.3 Objectives of the study
1.3.1 General objective
To analyze Long term debt financing as a determinant of the performance of selected
sugar manufacturing firms in Kenya.
1.3.2 Specific objectives of the study
i. To determine the effects of corporate bond financing on a firms performance.
ii. To find out the effects of long term loan financing on a firms performance.
iii. To evaluate the effects of operating lease financing on a firms performance.
1.4 Research Hypotheses
H0I: Corporate bond financing has no significant effect on firm performance.
H02: Long term loan financing has no significant effect on firm performance.
H03: Operating lease financing has no significant effect on firm performance.
1.5 Justification of the study
Studies on Long term debt financing by various researchers yielded diverse results; in the
case of, Ebaid (2009), Huang & Song (2006), Cai & Zhang (2006), Umar et al., (2012),
Onaolapo & Kajola (2010), Daskalakis & Psillaki (2005); they found a negative

6
relationship between long term debt financing and financial performance. Abor (2005),
Mesquita & Lara (2003), Omran & Pointon (2009), Antwi, Mills & Zhao (2012),
Aliakbar et al., (2013), showed a positive correlation between long term debt financing
and financial performance. The findings were not unanimous hence a gap in knowledge
for further research.
Secondly, there were a few studies on long term debt financing in Kenya sugar
manufacturing firms‟. The researcher sought to address the knowledge gap of insufficient
studies on long term debt financing in the sugar industry by focusing on the sugar
manufacturing firms in Kenya.
A study by Alawwad (2013) on Capital Structure Effects on Firms‟ Performance:
Evidence from Saudi Listed Companies recommended that for more reliable results to be
achieved, a future study was to use annual financial data rather than quarterly
financial data used in the study.
The researcher further recommended that another study on debt finance to be conducted
on individual sectors in the economy could lead to more informed conclusions on
how each sector responded to the choice of financing mix since each sector was
subject to different regulations and investment requirements. The researcher replicated
the recommendations made by Alawwad (2013) in a Kenyan context by focusing on
sugar manufacturing sector.
1.6 Significance of the study
7
Findings of the study will help contribute to policy development, literature review on
long term debt financing and firm performance, development of conceptual framework
and measurement of variables. It will also be of great help to firms‟ managers who are
charged with the responsibility of effective management of the Sugar firms.
1.7 Scope of the study
This research study was conducted on sugar firms‟ in Kenya. The main aspects
investigated in this study were operating lease financing, corporate bond financing, long
term loan financing and their effect on firm performance. Return on equity and Return on
assets were the only measures of firm performance that were used in the study. A target
population of 9 sugar manufacturing firms in Kenya were studied. A time period of five
years were considered that was between 2010 to 2014.
1.8 Limitations of the Study
The major limitation of the study was that this study was limited in scope as not all the
sugar firms in Kenya were included in the sample size. This study was based on a time
period of five years which is relatively a short period of time to access the trend of
financial performance of the sugar firms.

8
CHAPTER TWO
LITERATURE REVIEW
2.0 Introduction
This chapter covers the concept of firm performance, the concept of long term debt
financing, the concept of long term debt financing and firm performance, concept of
corporate bond financing on firm performance, the concept of long term loan financing
on firm performance, the concept of operating lease financing on firm performance,
theoretical perspective, the conceptual framework of the study, summary of literature and
finally the research gap.
2.1 Concept of Firm Performance
Firm performance focuses on providing financial returns, variously referred to as profits,
return on investment (Ukko, 2009) Performance is the ability to distinguish the outcomes
of organizational activities. Financial performance is a subjective measure of how well
a firm can use its assets from its primary role of conduction of business and its
subsequent generation of revenues.
Financial performance is also used as a general measure of a firm's overall financial
status over a given period of time, and can be used to compare similar firms across the
same industry or to compare industries or sectors in totality. The financial performance is
measured using accounting Key Performance Indicators such as Return on assets, Return
9
on sales, Earnings before interest and tax, Economic value added or Sales growth
(Crabtree & DeBusk, 2008).
The advantage of these measurements is their general availability, since every profit
oriented organization produces these figures for their yearly financial reporting (Chenhall
et al., 2007). In Kenya some firms are under receivership as a result of financial
instability such as Muhoroni (Otieno, 2014), other firms have been closed down due to
financial constraints for example, Miwani sugar firm, other firms are experiencing
rampant go slows from employees as a result of the firms unable to pay their salaries and
wages such as Chemilil sugar firm (Otieno, 2014).
This study adopted the use of Return on assets and Return on equity since ROA measures
the income available to debt and equity investors per dollar of the firm‟s total assets
(Brealey et al., 2011). That is, it measures financial soundness of the firm in terms of its
assets. It was therefore used in the regression model as a measure of financial
performance. Specifically, it is the ratio of revenues generated over a firm„s total assets.
Another ratio that gave an indication of a firm‟s overall financial health is Return on
equity (Bodie et al., 2011). ROE shows the income generated for the shareholder‟s by the
equity, which is the financing provided by the shareholders (Alexander & Nobes, 2010).
It gave an indication of whether a firm was able to find profitable investment
opportunities (Berk & DeMarzo, 2011), something that was of great importance for firms
that wanted to stay competitive. The researcher therefore believed that it justified the use
of Return on equity as a measure of financial performance in the regression model.

10
Return on equity is calculated as “earnings before interest and tax divided by equity”,
following the lead of Abor (2005).
2.2 Concept of Long Term Debt Financing
Long term debt is a resource that is owed to lenders for a period of more than one year
from the date of the current balance sheet (Lancett, 2008). Long-term debt converts to
short-term debt when the period left until the debt must be repaid becomes less than one
year with the passage of time. Long-term debt is used to finance business investments
that have longer payback periods. Long term debt financing is advantageous as it is
usually less prone to short term shocks as it is secured by formally established contractual
terms. Hence, they are relatively more stable than short-term debt (Lancett, 2008).
Long term debt financing is directly linked to the growth of the company's operating
capacity. The purchase of capital assets such as machinery. Long-term debt financing is
normally well structured and defined (Lancett, 2008). Thus fewer resources have to be
channeled to monitor and maintain long-term debt financing accounts compared to short
term debt financing such as supplier credit which, changes overtime and need to be
monitored on a regular basis.
Long term debt financing options such as leases offer a certain degree of flexibility,
compared to having to purchase the asset (Lancett, 2008). Long term debt financing is a
widely used mode of financing around the world. Long term debt financing is a fast
growing concept in the Sugar industry with little attention paid to its literature. In this
study the indicators of long term debt financing are: corporate bond financing, long term

11
loan financing and operating lease financing which all are forms of long term debt
financing. In Kenya Sugar firms have adopted the use of corporate bond financing, long
term loan financing and operating lease financing. For example, Mumias sugar firm has
been issuing corporate bond for over the past five years. Some of the Sugar firms using
long term loan financing and operating lease financing are Muhoroni, Mumias sugar firm
and Nzoia sugar.
2.3 Long Term Debt Financing and Firm Performance
The link between Long term debt financing and firm performance are mostly
inconclusive but a negative relations between the two have been reported in most of the
studies. Studies have been done on long term debt financing in the sugar sector for
example, Ahmad et al., (2012), sought to investigate the impact of capital structure on
performance of Malaysia sugar firms by analyzing the relationship between return on
assets, return on equity and long term debt. The study established that long-term debt
financing had significant negative relationship with ROA. It was also established that
ROE had significant negative relationship with long-term debt financing. The researchers
did not research on the various forms of long term debt financing that sugar firms are
using and how it had affected firm performance.
A research by Mesquita & Lara (2003), on Capital structure and profitability: a case of
Brazilian Sugar firms‟ and found that long-term debt financing had an insignificant
negative relationship with Return on equity. Anandasayanan & Subramaniam (2013)
examined the Effect of Capital Structure on profitability of Listed Sugar Manufacturing
Companies in Sri Lanka. Their results revealed significantly negative relationship

12
between long term debt financing and firm‟s performance. Their studies did not provide
the various forms of long term debt financing that sugar firms are using and how it had
affected firm performance
Other studies on Long term debt financing and firm performance have shown positive
relations between long term debt financing and firm performance. This means the more
one uses the proportion of long term debt the better the performance of sugar firms. For
example, Omran & Pointon (2009) found that the capital structure is not same for every
industry and vary across some of the industries. Further, Egyptian firms with high
business risks are not witnessed with low level of long term debt. The contracting sector
has employed higher level of debt compared to services sector because of higher tax rate
on the service industry confirming the trade off theory. Heavy industries have a positive
relation with long term debt financing sources because of the large assets base employed
by the firms.
A study by Antwi, Mills, & Zhao (2012) on the effect of capital structure on company‟s
value by taking all 3 listed Sugar companies on Ghana stock exchange. Simple regression
analysis was used to study this effect. Long term debt had been used as the independent
variable to analyze its effect on firm value. Results of the study indicated that long term
debt is positively and significantly related with firm value. Findings on effects of various
forms of long term debt financing were missing in the study.
According to Aliakbar et al., (2013), study on the “relationship between capital structure
decisions and firm performance: A Comparison between big and small industries in firms
listed on Tehran Stock Exchange.” They found that there is positive and significant

13
relationship between long term debt and firm performance as measured by Tobin‟s Q in
big and small industries.
2.3.1 Corporate Bond Financing and Firm performance
Corporate bonds are debt obligations issued by corporations for the purpose of raising
capital for corporate projects and other means of expanding the issuing corporation.
When you purchase a corporate bond, you are lending money to a corporation, which in
turn promises to pay you a specified amount of interest until the stated maturity date, at
which time the original amount of the bond you purchased the principal is returned to you
(Thune, 2014).
A corporate bond is a debt instrument that a firm can issue in order to raise funds for its
operations. The buyer of the bond acts as a lender who lends money to the firm for a pre-
specified time period, and who receives interest payments during this time. This interest
that the buyer earns can come in different forms. The most common form is to regularly
that is annual, semi-annual or quarterly receive a coupon, which is an amount calculated
by the bond‟s coupon rate that is interest rate times its principal amount( Bodie et al.,
2011).
Corporate bond financing is more advantageous because when you invest in corporate
bonds, you are taking part in a very safe type of investment in general. As a bond holder,
you are actually a creditor to the corporation and the corporation becomes a debtor to the
bondholders. The firm pays interest to the bondholder in return for the loan (Thune,
2014).
14
If the firm goes bankrupt, the bondholder will stand a chance of getting the money back
since you are a creditor. There is also a clearly defined rating system offered by
investment experts. The rating system allows the firms‟ determine exactly how much it is
going to get before it invest. With a corporate bond, a firm pays regular interest to the
bondholder which is cheap (Thune, 2014).
A study by Sanna & Emilie (2013), on bond-to-total debt ratio and its impact on firms'
performance of Swedish firms. The study found using regression analysis that corporate
bond financing had a positive significant effect on firm performance as measured by
ROA and also there was a significant positive significant relationship between corporate
bond financing and firm performance as measured by ROA, ROE and ROCE at the 99 %
confidence level. The researchers also found that corporate bond financing had a positive
significant effect on firm performance as measured by ROE. The researchers did not
study on the effects of corporate bond to total long term debt but rather as a component of
total debt which comprises the sum of both long term debt and short term debt financing.
A study on Corporate Debt Value, Bond Covenants, and Optimal Capital Structure of
Ghanaian Manufacturing firms by Leland (2004) found that corporate bond financing had
a significant positive effect on firm performance as measured by return on assets and
return on equity. The study did not operationalize corporate bond as the proportion of
corporate bond to total long term debt, therefore the results it provided were not for the
effects of corporate bond on total long term debt financing on firm performance. Lagerlof
& Rosenlof (2012) in their research on the Swedish High Yield Corporate Bond Market
found that the issuance of high yield corporate bond resulted in improved firm

15
performance as measured by ROA, with an adjusted R Square Value of 0.624. High yield
corporate bond led to an increase in firm performance as measured by ROA. The study
focused on how high yield corporate bond affected firm performance and not on how
corporate bonds to total long term debt affected firm performance.
A research by Oslo Børs (2013) on „Issuance of corporate Bonds in Oslo market for
raising debt capital‟ found that corporate bond financing had a positive significant effect
with firm performance as measured by return on assets. Shirley & Xu (2001) examined
the effects of corporate bond financing on firm performance. The researchers adopted the
SoE panel data set used by Mengistae & Xu (2004) and found that corporate bonds were
crucial in increasing firms‟ financial performance as measured by Return on asset. The
researchers did not study on the effects of corporate bond to total long term debt on firm
performance
Corporate bond financing has a positive in significant effect on firm performance for
example Uchida (2008) researched on the relationship between Tobin‟s Q, corporate
bond and bank debt on Japanese manufacturing firms‟ between 1989 to 1997. Regression
results showed that corporate bond financing had positive and statistically insignificant
coefficients. Corporate bond had a positive significant effect on firm performance. The
study was carried out on corporate bond but it did not provide results on the effects of
corporate bond to total long term debt on firm performance.
According to the researcher highly indebted firms have insufficient financial resources to
repay debt obligations owed to creditors and whatever little amount that exists is used to
offset part of the debt and hence the financial performance of the firms‟ decreases.
16
2.3.2 Long Term Loan Financing and Firm performance
A Long term loan is a loan from a financial institution. Long term loans can be raised in
relatively short period, because long term loans are negotiated directly between the lender
and the borrower, and documentation is minimized (Athreya, 2008). According to
Athreya (2008) terms and conditions of long term loan can be revised by mutual
agreement between the lender and borrower. Long term loan has lower issuance costs.
Funds raised from Long term loan are typically used to finance permanent working
capital, to pay for fixed assets or to discharge other loans a firm had borrowed (Athreya,
2008).
Long term loans minimize time spent saving for investments and investors are able to
realize potential earnings sooner to help offset the cost. Long term loans increase the
flexibility of an investor‟s limited capital by allowing for its distribution over multiple
investments, and minimizing the immediate impact on operational cash flow. The loans
provide an opportunity to finance potential investments while maintaining control of the
firm (Athreya, 2008).
Long term loans have a very structured payment thus builds credit. It can be very
advantageous to take out a long term loan for a business. After the maturity date and
when full ownership is assumed, the former debtor and now owner can use the asset and
the positive credit they have developed for paying for future borrowing. Thus, reliable
debtors experience a compounding effect of the advantages of a long term loan (Athreya,
2008).

17
Scholarly work of Hammes (2003) on firm performance, debt, bank loans and trade credit
where by the researcher compared Polish and Hungarian Sugar firms to a large sample of
firms in industrialized countries. The researcher used panel data analysis to investigate
the relation between bank loan and firms‟ performance as measured by profitability. The
results showed that long term loans had an insignificant and negative effect for most
countries. The findings of the study did not bring out the effects of outstanding long term
loans on performance.
Some studies on Long term loan financing found a negative significant effect on firm
performance for example Abu (2012) examined “Capital structure and firm performance;
Evidence from Palestine stock exchange” and found a negative effect existed between
long terms loans and bank performance as measured by ROA although not statistically
significant. In this study the researcher focused on the effects of bank loans on
performance. The researcher did not capture the component of outstanding long term
loans on firm performance.
Studies of Asterbro & Bernhardt (2003) on Start-up Financing, Owner Characteristics,
and firm performance of French Sugar firms. They found long term loan financing had a
negative significant effect on firm performance as measured by both ROA and ROE
although not statistically significant. The researchers focused on long term loans as a
source of start up financing and in their findings they did not provide results on long term
loans outstanding obligations of the firms and how it has affected its performance.
The research work of Ghosh (2006) on profitability and capital structure of Amex and
Nyse firms, found that the level of long term loan associated inversely with firms‟

18
performance as measured by ROA. The result referred to the creditors who were using
Long term loans as disciplinary tool on the firm. This tool bases on the restrictions
imposed by creditors on the firm as prevention on the firm from distributing the
earnings on the shareholders or impose restrictive conditions on the loans by increasing
the interest rates or impose sufficient collaterals on loans, thus, these restrictions
according to Ghosh (2006) led the management of the firms‟ to use a large proportion of
its finances on repayment of debt owed to creditors which in turn reduces firm
performance. The study focused on firms that used long term loans as disciplinary tool
for repayment of debts and also it did not provide results on how outstanding long term
loans affected firm performance.
A study by Fok et al., (2004) researched on the impact of bank loan on performance of
Taiwanese Sugar firms around the 1997 Asian financial crisis. The researchers found that
domestic borrowed long term loans had a negative significant effect on firm performance,
but long term loans borrowed from foreign countries had a positive significant effect on
firm performance. The findings are tied in scope as it was conducted during the Asian
financial crisis. The researchers focused on source of borrowing that is from domestic or
foreign market, they did not provide findings on how outstanding long term loans
affected performance.
According to Kang & Stulz (2000), they researched on how Banking Shocks affects
Borrowing Firms‟ Performance on Tokyo Stock Exchange between 1990 to 1993. They
found that firms whose debt had a higher fraction of long term loans in 1989 performed
worse from 1990 to 1993 and also invested less than other firms did. The researchers

19
concentrated much on how firms performed in relation to the proportion of long term
loans it held but did not provide results on the effects of outstanding long term loan
obligations.
2.3.3 Operating Lease Financing and Firm performance
Operating lease is a contract that allows for the use of an asset, but does not convey rights
of ownership of the asset (Lorigan, 2014).The property may be leased for a period more
than one year on an operating lease hence being a component of long term debt. Leasing
is a contract between an owner of equipment, the lessor and another party, the lessee
giving the lessee possession and use of a specific asset in return for payment of specific
rentals over an agreed period (Kisaame, 2002).
An operating lease is usually signed for a period much shorter than the actual life of
the asset, and the present value of lease payments are generally much lower than the
actual price of the asset. At the end of the life of the lease, the equipment reverts
back to the lessor that is, the owner of the equipment who will either offer to sell it to the
lessee or lease it to somebody else. The lessee usually has the option to cancel the lease
and return equipment to the lessor, sometimes at a cost (Lorigan, 2014).
Operating lease is advantageous to a business because operating lease is used to hide
financially leveraged balance sheets by presenting capital leases as operating leases.
Although an operating lease is, many a times, more expensive as compared to an outright
purchase or a capital lease for the same equipment due to the guarantee of service
obscured in an operating lease in addition to the obsolescence risk assumed by the leasing
company (Lorigan, 2014).

20
However, this is justified by the lessee through the convenience of relying on fully
operational equipment in addition to avoiding the obsolescence cost. An operating lease
reduces the lessee‟s liabilities thus allowing it to borrow more than if it used a mortgaged
loan or a capital lease. Leases offer a certain degree of flexibility, compared to having to
purchase the asset. The tradeoff theory supports the opinion that leasing leads to tax
allowable and thus high financial performance (Lorigan, 2014).
A study by Tarus (1997) on factors influencing the growth of lease in Kenya in which the
researcher used descriptive research design and collected data through questionnaires
both structured and unstructured while his population consisted of all companies listed in
the stock exchange. The researcher found that leasing improves financial performance by
influencing the cost of capital thus reducing the leverage level which in turn improves the
working capital of the firm. The researcher focused on how leasing improves financial
performance but did not provide results on long term operating lease obligations and how
it affects firm performance.
A research on ‘Effects of Lease Finance on Performance of Sugar Firms in Bangladesh‟
by Abdus (2013) found that operating lease financing had a positive significant effect on
ROE. The Adjusted R square value was 0.279. Letoluo (2003) did a study of the
influence of farmland leasing on household livelihood in Narok. The researcher did a
survey with eighty respondent selected randomly and ten informants were interviewed.
The researcher found that leasing of farmland increased revenue to the farmers who later
shifted from pastoralism to doing business. The researcher focused on factors that
influence farmland leasing and its subsequent impact on the farmers but did not research
on long term operating leasing obligations and how it affected performance.
21
A study by Vasantha (2012) on capital market frictions, leasing and investment, found
that firms with high information leased more and those with low agency costs leased less.
In addition the researcher found that firms with significant tax-loss carry forwards were
unable to take full advantage of tax benefits of asset ownership, hence they leased more.
The coefficient on size was positive and size squared was negative indicating that largest
firms used less operating lease financing .The coefficient on Tobin‟s Q is positive as
higher growth firms leased more which led to an improvement in firm performance. The
researcher dwelt much on characteristics of firms that leased more and those that leased
less. The researcher did not provide findings on operating lease obligations of the firms
and its effects on firm performance.
According to Akinbola & Otokiti (2012), they researched on the Effects of Lease Options
as a Source of Finance on the Profitability Performance of Sugar Firms in Lagos State,
Nigeria using a sample of 300 respondents and the results from the model summary
revealed the extent to which the variance in profitability of organizations could be
influenced by operating lease option. The adjusted R square value was .081. The
researchers also used ANOVA and found that operating lease had significant effect on
organizational profitability with an F-cal 7.540 at 0.01 significance level that is operating
lease financing had significant effect on organizational profitability. The researcher
focused much on leasing options that small and medium enterprises had adopted as a
source of finance but did not emphasize on the effects of operating leasing obligations on
performance.

22
A research on the effects of leasing on performance of companies listed at the Nairobi
securities exchange by Munene (2011), found that operation lease financing had a
negative but insignificant effect on firm performance as measured by ROA with p value
of 0.876. The researcher provided results on the effects of lease on firm performance but
did not provide results on outstanding operating lease obligations on performance.
A study on the factors influencing the profitability of leasing firms in Pakistan by
(Muhammad et al., 2012) where the researchers analyzed a pool of data of 28 leasing
companies for a period of 2006-2008. The variables used to determine profitability were
size, leverage liquidity, age and Return on assets in operating lease finance. The study
applied ordinary least square model and Logistic models for estimation of results. The
researchers found that operating lease financing had a negative insignificant effect on
firm performance of leasing companies as measured by ROA. The researchers centered
their study on factors influencing the profitability of leasing firms thus they did not study
on outstanding operating lease obligations and how it affects firm performance.
Leasing is advantageous to outright purchase as it leads to improved financial
performance. This is evident in Salam (2013), research on the casual relationship between
firm performance using ROA and ROE with different sugar firms on lease finance. The
researcher found that operating lease financing had a positive significant effect on firm
performance as measured by ROA and ROE. The researcher did not research on
outstanding operating lease obligation thus the study dwelt much on causal relationship
between lease finance and performance. Eric (2012) did a study on French Small and
medium enterprises for 11436 firms for the year 1999. The variables used were long term
23
debt, leasing, equity, short term assets, short term liabilities, financial fees, fiscal debt and
firm age. The researcher found that operating lease financing had a significant positive
effect on ROA. The study did not capture outstanding operating lease obligations.
Studies on the relationships between Operating lease financing and firm performance also
proves a positive significant relationship between the two variables for example, Lasfer
& Levis (2008) examined the relationship between lease finance and ROA for Sugar
firms and found a positive relationship existed between operating lease financing and
firm performance as measured by ROA. They also found that a positive relationship
existed between operating lease financing and firm performance as measured by ROE.
Kisaame (2002) researched on lease finance in sugar firms in Uganda and found that
businesses with leasing competence were on average more profitable as measured by
ROA. The researcher dwelt much on characteristics of firms in relation to leasing
competence and not on the effects of outstanding operating lease obligations on firm
performance.
The researcher argued that with leasing, you may pay more over the long term. Operating
lease payments included taxes, insurance and risk premium since the lessor assumes the
risk for the purchase and this leads to a decrease in firm performance.
2.4 Theoretical Framework
The study adopted the trade-off theory by Myers (1984) which refers to the idea that a
company chooses how much debt finance and how much equity finance to use by
balancing the costs and benefits. The trade-off theory was taken under consideration after

24
the debate on the theorem of Modigliani-Miller (Iqbal et al., 2012).When the irrelevance
theorem was added with the corporate income tax, this favored benefit for debt that is it
shields the earnings from taxes. Firm manager evaluates and analyzes the various costs
and benefits of several alternatives of leverage plans.
Most of the time it is presumed that interior solution should be obtained so that balance
can be acquired between marginal costs and benefits. An important purpose of the trade
theory is to explain the fact that corporations usually are financed partly with debt and
partly with equity. The tradeoff theory assumes that there are benefits to leverage within
a capital structure up until the optimal capital structure is reached.
The trade off theory recognizes the tax benefit from interest payments. The marginal
benefit of further increases in debt declines as debt increases, while the marginal cost
increases, so that a firm that is optimizing its overall value focuses on this trade-off when
choosing how much debt and equity to use for financing. Optimal capital structure is
acquired by firms by trading off the costs of debt and equity against their benefits.
Empirically Abor (2007) researched on Debt Policy and Performance of SMEs, Evidence
from Ghanaian and South African firms. The researcher supported the use of the tradeoff
theory as the best in determining Long term debt financing as a source of firm financing.
Other scholars in support of the tradeoff theory are Hovakimian, Opler & Titman (2001),
Korajczyk & Levy (2003), Hovakimian & Tehranian (2004). The researcher held similar
opinion with the above named researchers that marginal benefits and marginal cost
should be considered in the determination of how much of a financial resource to borrow.
25
2.5 Conceptual Framework
The conceptual frame work for this study figure 2.1 shows the constructs for Long term
debt financing for the study which are, corporate bond financing, long term loan
financing and Operating lease financing. The indicator of corporate bond financing is
corporate bond to total long term debt ratio, the indicator of long term loan is long term
loan to total long term debt ratio and finally the indicator of operating lease financing is
operating lease to total long term debt ratio. Long term debt financing is the independent
variable while firm performance (Sugar firms) is the dependent variable. The indicators
of Firm performance are Return on assets and return on equity. The relationship between
long term debt financing and firm performance as displayed in the conceptual framework
is that corporate bond financing, long term loan financing and Operating lease financing
are the predictor variables of firm performance, where by the overall financial
performance of the firms is assessed using Return on assets and Return on Equity.

26
Independent variable: Long term debt financing
Dependent variable Dependent variable
Fig 2.1Conceptual Framework for Long term debt financing: (Corporate bond
financing, long term loan financing, Operating lease financing and firm
performance (ROA & ROE).
(Source: Author, 2015)
2.6 Summary
There was uniqueness shown in this study of which the literature review has made it
clear. This study has examined major forms of long term debt which are a determinant of
the performance of sugar firms. The study was aimed at identifying the effects of
corporate bond financing, long term loan and operating lease financing on the
performance of sugar firms. According to review studies, it was established that corporate
bond financing, long term loan and operating lease financing affects the performance of
sugar firms. The differences across the studies were that the effects were positively
significant or insignificant and/or negatively significant or insignificant. This study
therefore was aimed at finding whether long term debt financing is a determinant of firm
Long term loan financing
Corporate bond financing
Operating lease financing
Firm performance
Return on assets
Return on equity
27
performance whereby it provided literature review on the various forms of long term debt
and how it affects firm performance.
2.7 Research Gap
There is lack of findings from the studies reviewed above as to the effects of long term
debt financing (Corporate bond financing, long term loan and operating lease financing)
when the above components are operationalized as a proportion of total long term debt on
firm performance. The studies did not provide findings on the effects of corporate bonds
to total long term debt on firm performance, outstanding long term loans to total long
term debt on firm performance and also outstanding operating lease obligations to total
long term debt on firm performance. The current study addresses this knowledge gap.
28
CHAPTER THREE
RESEARCH METHODOLOGY
3.1 Research Design
The Researcher used a longitudinal research design because it is a type of survey where
data is collected from the same target population at different points in time to study
changes over time. Ideally subjects or participants in a study are followed over a long
period to study changes on the same issue of interest (Kothari, 2004). A time span of 5
years between 2010 - 2014 was considered where the researcher drew data from the
audited annual financial statements results of the firms.
3.2 Study Area
The study area is on sugar manufacturing firms in Kenya. This sugar firm‟s fall under
various categories; those totally owned by government, private investors and those which
are partly owned by the government of Kenya and partly by private investors. The entire
sugar firms are what comprises the sugar industry in Kenya and the firms are governed
by the Kenya Sugar Board which was established on 1st April, 2002, under the Sugar Act
2001, succeeding the defunct Kenya Sugar Authority (Kenya Sugar Board, 2014). The
problem of poor financial performance was analyzed in detail across these sugar firms.
3.3 Target population
Target population is the objects a researcher selects as respondents in the study and is
vital in achieving the set objectives (Mugenda & Mugenda, 2003). The study targeted a
sum of 9 sugar manufacturing firms in Kenya that is Muhoroni, Mumias sugar firm,

29
Nzoia sugar firm, West Kenya, Soin, Butali, Chemilil, Sony and kibos & allied sugar
firm (Kenya Sugar Board, 2014). These are sugar firms which have been in existence for
a decade and above since their incorporation.
3.4 Sampling Procedure and Sample size
This study adopted probability sampling because it allows generalizability to a larger
population with a margin of error that is statistically determinable. Probability sampling
is key to obtaining a representative sample as every sample of a given size in the
accessible population has an equal chance of being selected (Mugenda & Mugenda,
2003). Simple random sampling technique was used to select the firms because it
produces more precise estimates than other methods (Silverman, 2007). The sample size
was determined using Mugenda & Mugenda (2003) 10% - 30% rule. In this case 30% of
9 firms, which are 3 firms. The Sugar firms were Mumias, Nzoia and Muhoroni Sugar
firms.
3. 5 Data Collection Procedure and Instruments
The study used Secondary data. The data was collected using a data collection form for
secondary data (Appendix 11) since secondary data was the main source of data. The
firms prepared financial statements on a regular or continuous basis; this allowed the
researcher to effectively analyze the debt ratios in the sugar firms in Kenya from 2010 to
2014. The data was obtained from the NSE handbook, firms‟ websites and firms‟
management. The data collection form was presented to the finance managers of the
firms before the required documents were given to the researcher.

30
3.6 Measurement of Variables
3.6.1 Measures of long term debt financing
The long term debt ratio was used to measure long term debt financing because it
delivered the key insights to evaluating a firm's long term debt position. High leverage
increased the risk of financial distress if there was slump in economic activity. The ratio
was Long term debt ratio (LTDR) = Long term debt / total assets. Operating lease was
measured using Operating lease to total long term debt ratio, Long term loan was
measured using Long term loan to total long term debt ratio and corporate bond was
measured using corporate bond to total long term debt ratio. A year-over-year decrease in
this metrics would suggest the firm was progressively becoming less dependent on debt
to grow their business.
3.6.2 Measures of Firm performance
This study adopted the use of Return on assets and Return on equity. ROA is the ratio of
revenues generated over a firm„s total assets that is (Total Revenue ÷ Total Assets).
Return on equity is calculated as earnings before interest and tax divided by equity,
which is (EBIT ÷ Equity).
3.7 Data Analysis
Data entry and analysis was done using SPSS V.20. Pearson product moment correlation
was used to assess for significant association between dependent variables (ROA and
ROE) and the independent variables (Long term loan financing, operating lease
financing, and corporate bond financing). Multiple linear Regression model was used to

31
identify significant predictors of ROA controlling for confounders. P < 0.01 was
considered significant. The regression models were as follows:
ROA M, t = β0 + β1x1M, t+ β2x2M, t+ β3x3M, t+ e M, t.
ROE M, t = βk + βaxa M, t+ βb xb M, t+ βcxc M, t + e M, t.
When using ROA;
X1M, t = Corporate bond to total long term debt of the firm M in year t.
X2M, t = Long term loan to total long term debt of the firm M in year t.
X3M, t = Operating lease to total long term debt of the firm M in year t.
e M, t = error term, β0 = intercept, β1, β2, β3 = coefficients of x1, x2.x3 respectively.
When using ROE;
Xa M, t = Corporate bond to total long term debt of the firm M in year t.
Xb M, t = Long term loan to total long term debt of the firm M in year t.
Xc M, t = Operating lease to total long term debt of the firm M in year t.
e M, t = error term, βk = intercept, βa, βb, βc = coefficients of xa, xb. xc respectively.

32
CHAPTER FOUR
RESULTS
4.1 Corporate Bond Financing and Firm Performance
Pearson product moment correlation was used to assess for correlation between
dependent variables (ROA and ROE) and the independent variable (corporate bond
financing) before conducting regression analysis and the results were as follows.
4.1.1 Correlation Analysis Results for Corporate Bond Financing
The results of Table 4.1, at 99% level of confidence, showed that 1 unit change in
corporate bond financing leads to 0.691 change in performance of sugar firms as
measured by ROA. When ROE was used as a measure of firm performance the results
were, 1 unit change in corporate bond financing leads to 0.119 change in performance of
sugar firms as shown in Table 4.1.

33
Table 4.1: Correlation between Corporate bond financing, long term loan financing,
operating lease financing and performance (ROA & ROE).
Operating
lease
financing
Corporate
bond
financing
Long term
loan
financing
Return
on
assets
Return
on
equity
Operating
lease
financing
Pearson
Correlatio
n
Sig. (2-
tailed)
N
1
15
Corporate
bond
financing
Pearson
Correlatio
n
Sig. (2-
tailed)
N
.124
.842
5
1
5
Long term
loan
financing
Pearson
Correlatio
n
Sig. (2-
tailed)
N
-.506
.055
15
-.463
.432
5
1
15
Return on
assets
Pearson
Correlatio
n
Sig. (2-
tailed)
N
.810**
.000
15
.691**
.005
5
-.832**
.000
15
1
15
Return on
equity
Pearson
Correlatio
n
Sig. (2-
tailed)
N
-.133
.637
15
.119
.849
5
-.097
.732
15
.109
.700
15
1
15
**. Correlation is significant at the 0.01 level (2-tailed).
(Source: Survey data, 2015)

34
4.1.2 Regression analysis Results for Corporate Bond Financing
Multiple linear regressions was then done on corporate bond financing and ROA and the
results showed that 1 unit change in corporate bond financing led to .080 change in ROA
as shown in Table 4.2. Multiple linear regression was not conducted on corporate bond
financing using return on equity because there was no significant relationship between
corporate bond financing and firm performance as measured by ROE at 0.01 level of
significance. The significance was .849 which is above the required 99 % level of
confidence as shown in Table 4.1.
Table 4.2: Regression Results for Corporate Bond, Long Term Loans & Leasing
Model
Unstandardized Coefficients
Standardized
Coefficients
T Sig. B Std. Error Beta
1 (Constant) 59.383 24.647 2.409 .250
Operating lease
financing 13.619 7.206 .565 1.890 .020
Corporate bond
financing 1.240 4.560 .080 .272 .001
Long term loan
financing -20.991 13.521 -.520 -1.552 .004
a. Dependent Variable: Return on Assets
(Source: Survey data, 2015)

35
4.2 Long Term Loan Financing and Firm Performance
The study conducted Pearson product moment correlation to assess for correlation
between dependent variables (ROA and ROE) and the independent variable (long term
loan financing) before conducting regression analysis and the results were as follows.
4.2.1 Correlation Analysis Results for Long Term Loan Financing
The results showed that 1 unit change in long term loan financing leads to - 0.832 change
in performance of sugar firms as measured by ROA at 99% level of confidence as shown
in Table 4.1. When ROE was used as a measure of firm performance the results were 1
unit change in corporate bond financing leads to -.097 change in performance of sugar
firms as shown in Table 4.1.
4.2.2 Regression analysis Results for Long Term Loans Financing
Multiple linear regressions was then done on Long-term loans financing and ROA and
the results showed that 1 unit change in Long term loan financing led to -.520 change in
firm performance as shown in Table 4.2. Multiple linear regression was not conducted on
Long term loan financing using return on equity because there was no significant
relationship at 0.01 level of significance between long term loan financing and firm
performance as measured by ROE as shown in Table 4.1. The significance was .732 as
shown in Table 4.1. This is above the required 99 % level of confidence.

36
4.3 Operating Lease Financing and Firm Performance
Pearson product moment correlation was used to assess for correlation between
dependent variables (ROA and ROE) and the independent variable (operating lease
financing) before conducting regression analysis and the results were as follows.
4.3.1 Correlation Analysis Results for Operating Lease Financing
At 99% level of confidence as shown in Table 4.1, 1 unit change in operating lease
financing leads to .810 change in performance of sugar firms as measured by ROA.
When ROE was used as a measure of firm performance the results were 1 unit change in
operating lease financing leads to - 0.133 change in performance of sugar firms as shown
in Table 4.1.
In summary the findings clearly show that corporate bond financing and operating lease
financing are positively related to firm performance. However, Long term loan financing
is negatively related to firm performance. Operating lease financing compared to other
independent variables has the highest level of positive relationship that is, 0.810 since an
operating lease reduces the lessee‟s liabilities thus allowing it to borrow more than if it
used a capital lease and also operating leases offer a certain degree of flexibility,
compared to having to purchase the asset. Long term loan financing compared to other
independent variables has the highest level of a negative relationship that is, - 0.832.
Some of the factors that explain the negative relationship are such as, changes in interest
rates, inflation rates. From the findings of this study, return on assets is a good measure
of firm performance as compared to return on equity as all the three independent
variables were significantly related to return on assets.

37
4.3.2 Regression analysis Results for Operating Lease Financing
The results of multiple linear regression on operating lease financing showed that I unit
change in operating lease financing led to .565 change in ROA as shown in Table 4.2.
There was no significant relationship between operating lease financing and return on
equity at 0.01 level of significance therefore multiple linear regression was not conducted
on operating lease financing and ROE as shown in Table 4.1. Operating lease financing
had a .637 level of significance which is above 0.01 level of significance.
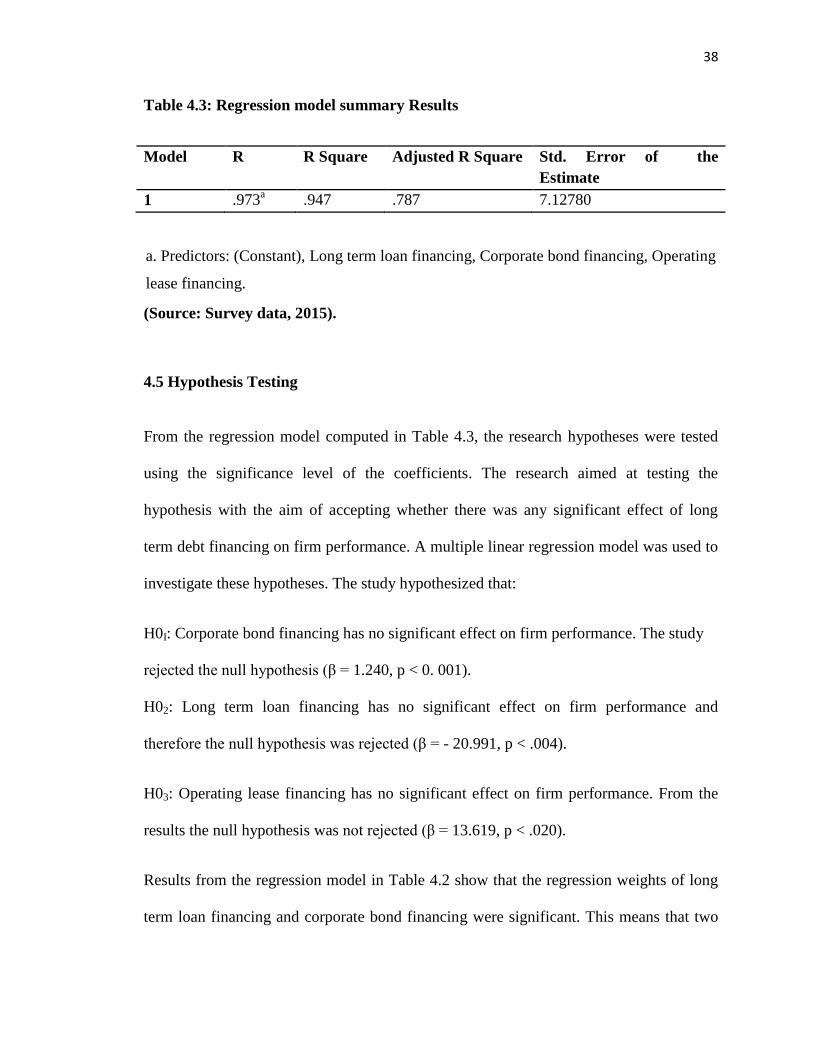
4.4 Regression Model Summary
From the results in Table 4.3, R = .973, R square = .947, adjusted R Square =. 787, and
the standard estimate error = 7.12780. R coefficients indicate the degree of linear
relationship of performance in sugar firms with all predictor variables, whereas the
coefficient of multiple determinations R square shows the provision of the total variation
in firm performance as explained by the independent variables, long-term loan financing,
operating lease financing and corporate bond financing in the regression equation. The
adjusted R square gives us the coefficient of determination indicating that the
independent variables explains 78.7% change in firm performance as shown in Table 4.3.
38
Table 4.3: Regression model summary Results
Model R R Square Adjusted R Square Std. Error of the
Estimate
1 .973a .947 .787 7.12780
a. Predictors: (Constant), Long term loan financing, Corporate bond financing, Operating
lease financing.
(Source: Survey data, 2015).
4.5 Hypothesis Testing
From the regression model computed in Table 4.3, the research hypotheses were tested
using the significance level of the coefficients. The research aimed at testing the
hypothesis with the aim of accepting whether there was any significant effect of long
term debt financing on firm performance. A multiple linear regression model was used to
investigate these hypotheses. The study hypothesized that:
H0I: Corporate bond financing has no significant effect on firm performance. The study
rejected the null hypothesis (β = 1.240, p < 0. 001).
H02: Long term loan financing has no significant effect on firm performance and
therefore the null hypothesis was rejected (β = - 20.991, p < .004).
H03: Operating lease financing has no significant effect on firm performance. From the
results the null hypothesis was not rejected (β = 13.619, p < .020).
Results from the regression model in Table 4.2 show that the regression weights of long
term loan financing and corporate bond financing were significant. This means that two

39
of the three postulated hypotheses were supported. Therefore, long term loan financing
and corporate bond financing are predictor variables which are determinants of
performance in sugar firms.

40
CHAPTER FIVE
DISCUSSIONS
5.1 Summary of findings
5.1.1 Corporate bond financing on performance of Sugar Firms
Results for objective one indicated that corporate bond financing had β =1.240, p < 0.
001 and the hypothesis was rejected. This shows that one unit of corporate bond
financing resulted to 1.240 units of performance of Sugar Firms.
5.1.2 Long term loan financing on performance of Sugar firms
Results for objective two indicated that Long term loan financing had β = - 20.991, p
<.004 and the hypothesis was rejected. This shows that one unit of long term loan
financing resulted to - 20.991 units of performance of Sugar Firms.
5.1.3 Operating Lease financing on performance of Sugar firms
Results for objective three indicated that Operating lease financing had β =13.619, p <
.020 and the hypothesis was not rejected. This shows that one unit of Operating lease
financing resulted to 13.619 units of performance of Sugar Firms.
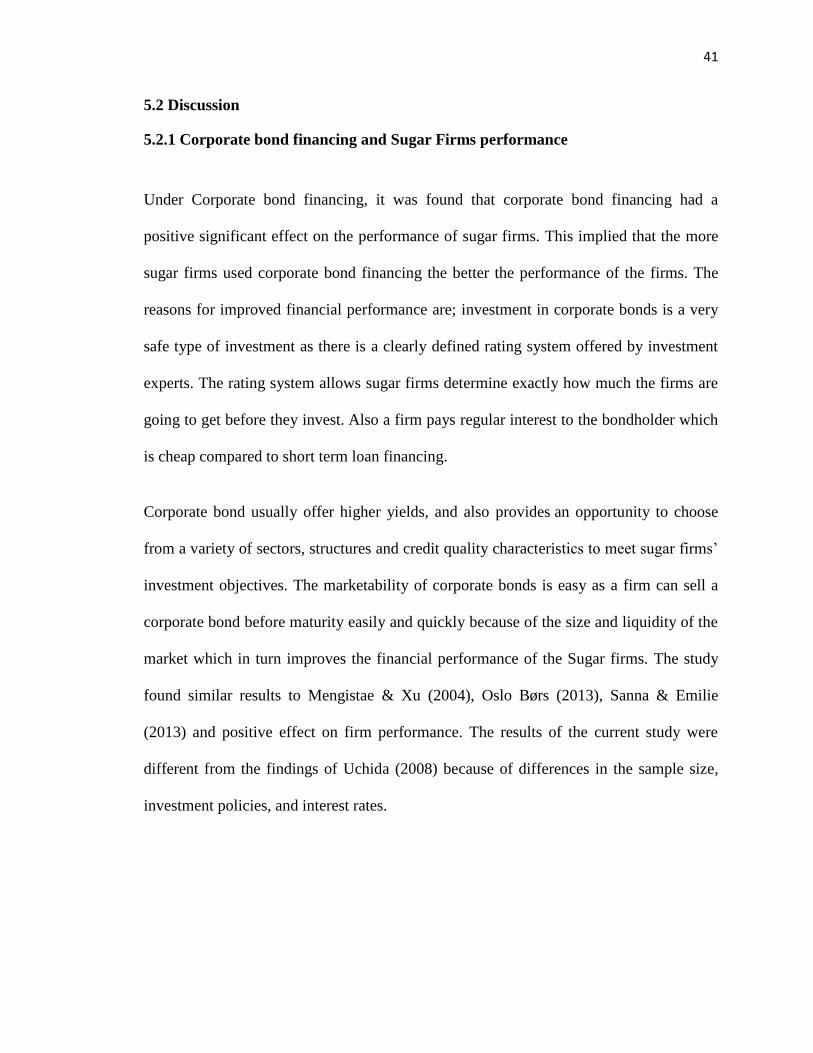
41
5.2 Discussion
5.2.1 Corporate bond financing and Sugar Firms performance
Under Corporate bond financing, it was found that corporate bond financing had a
positive significant effect on the performance of sugar firms. This implied that the more
sugar firms used corporate bond financing the better the performance of the firms. The
reasons for improved financial performance are; investment in corporate bonds is a very
safe type of investment as there is a clearly defined rating system offered by investment
experts. The rating system allows sugar firms determine exactly how much the firms are
going to get before they invest. Also a firm pays regular interest to the bondholder which
is cheap compared to short term loan financing.
Corporate bond usually offer higher yields, and also provides an opportunity to choose
from a variety of sectors, structures and credit quality characteristics to meet sugar firms‟
investment objectives. The marketability of corporate bonds is easy as a firm can sell a
corporate bond before maturity easily and quickly because of the size and liquidity of the
market which in turn improves the financial performance of the Sugar firms. The study
found similar results to Mengistae & Xu (2004), Oslo Børs (2013), Sanna & Emilie
(2013) and positive effect on firm performance. The results of the current study were
different from the findings of Uchida (2008) because of differences in the sample size,
investment policies, and interest rates.

42
5.2 .2 Long term loan financing and Sugar firms performance
On objective two, it was found that Long term loan financing had a negative significant
effect on firm performance as measured by ROA. This implied that the more sugar firms‟
uses long term loan financing the poor the performance of the firms. The reasons for poor
financial performance are, higher interest rates that is, the interest rates available for a
long term loan financing agreement are usually higher and the level of the interest rate is
established based upon the risk involved with making the loan. Long term loan financing
includes a greater span of time for default and hence more interest payments are made
which affect the financial performance of sugar firms.
Another reason is greater interest cost, the higher rates alone for a long term loan means
that the sugar firms pays more over the life of the loan than they would for a short term
loan, and that is exacerbated by the length of time the firm pays the higher interest rates.
Also the debt to income ratio affect firm performance as accessing credit involves a
review of the sugar firms‟ total financial picture. Included in that picture is the firms‟
debt to income ratio, or the amount of outstanding debt the firms owe in relation to the
firms cash flows. The longer the terms for the loan, the longer the firms have a hefty
number in the debt column of the sugar firms‟ credit worthiness evaluation.
Slow growth of equity is another reason for poor financial performance as long term loan
financing accrues equity as the firms‟ repays the loan. The firms‟ net worth is defined as
assets minus debt. Long term loan financing, with generally smaller installment
payments, adds equity at a slower rate which affects the sugar firms‟ financial
performance. The results were similar to the findings of Abu (2012), Asterbro &

43
Bernhardt (2003), Ghosh (2006), Kang & Stulz (2000), Fok et al., (2004).The findings of
this study were different from the results of Hammes (2003) because the researcher
carried out the research on firms from different sectors, differences in sample size and
differences in economic growth.
5.2.3 Operating Lease financing and Sugar firms performance
On operating lease financing, the study found that operating lease financing positively
affects firm performance as measured by ROA although not statistically significant. This
implied that the use of operating lease financing in sugar firms capital structure does not
significantly affect the firm‟s performance. Some of the reasons for the non significant
effect are, entering an operating lease involves the higher level of expenses reported.
Sugar firms which enter operating leases record a lease expense for each period
throughout the duration of the lease. These expenses appear on the company's income
statement. The income statement reports the revenues earned for the period, the expenses
incurred and the net income for the period. Financial statement users like to see
companies report a positive net income. Expenses, including the operating lease expense,
reduce the company's net income.
Entering an operating lease is that the leased asset appears nowhere as an asset on the
company's accounting records. The company holds no ability to sell or modify the asset
without the lessor's permission. Operating leases represent temporary arrangements
between the lessor and the Sugar firm. When the lease expires, the terms of that lease
become void. The lessor and the Sugar firm spend time renegotiating the terms or ending
the relationship. The Sugar firm needs to reconsider the lease and evaluate its options on

44
a regular basis. This lack of continuity makes it difficult for the sugar firm to plan and
hence affects the financial performance of the firms.
The results of this current study were similar to the findings of Abdus (2013), Akinbola
& Otokiti (2012), Muhammad, et al., (2012), Letoluo (2003), Tarus (1997), Eric (2012)
and Lasfer & Levis (2008). The results were different from the findings of Munene
(2011) because of differences in asset base of the firms, market characteristics and capital
base of the firms under study,

45
CHAPTER SIX
CONCLUSIONS AND RECOMMENDATIONS
6.1 Conclusions
From the results on corporate bond financing, the study concluded that corporate bond
financing positively significantly affects firm performance as measured by return on
assets. The use of a corporate bond improves the financial performance of Sugar firms.
On long term loan financing, it was concluded that long term loan financing negatively
significantly affects firm performance. The more sugar firms borrows the poor the
financial performance of firms. Lastly on operating lease financing, it does not
significantly affect firm performance. The Financial performance of Sugar firms is
therefore not significantly affected by the use of operating lease in their capital structure.
6.2 Recommendations
6.2.1 Policy Recommendations
The study recommends that the sugar firms should become less dependent on long term
loan financing in their capital structure. Sugar firms needs to invest more in income
generating projects for financial empowerment rather than overreliance on borrowing.
This is because larger proportion of long term loan financing negatively significantly
affects the performance of Sugar firms. There is need for sugar firms to invest more in
issuance of corporate bonds as there is a clearly defined rating system offered by
investment experts which allows the firms‟ determine exactly how much it is going to get
before it invests. Sugar firms should opt for outright purchase rather than excessive use of

46
operating lease financing as in the long run the operating lease obligations exceeds the
initial value of the leased product or property.
6.2.2 Recommendation for Further Research
The study suggests that further research to be conducted on the effects of long term debt
financing on performance of sugar firms using predictors of firm performance other than
long term loan financing and corporate bond financing. The researcher found that the data
used in carrying out the research were obtained from sugar firms. A Further study that
includes all manufacturing firms in Kenya is highly recommended. Extensive studies are
also needed to explore the relationship between short term debt financing and
performance of sugar firms in Kenya.

47
REFERENCES
Abor, J. (2005). “The effect of capital structure on profitability: an empirical analysis of
Listed Firms in Ghana”. Journal of Risk Finance, 6, 438- 447.
Abor, J. (2007). “Debt Policy and Performance of SMEs, Evidence from Ghanaian and
South African Firms”. Journal of Risk Finance, 8, 364-379.
Abu, R.N. (2012). “Capital Capital structure and firm performance; Evidence from
Palestine
Stock exchange”. Journal of Money, Investment and Banking, 3(23).
Abdus, S. (2013). “Effects of Lease Finance on Performance of Sugar Firms in
Bangladesh”.
International Journal of Science and Research, 2 (12), 2319-7064.
Akinbola, O. A., & Otokiti, B. O. (2012). “Effects of Lease Options as a Source of
Finance
On the Profitability Performance of Sugar Firms in Lagos State, Nigeria”.
International Journal of Economic Development Research and Investment, 3(3).
Alawwad, S. (2013). Capital Structure Effect on Firms‟ Performance: : Evidence from
Saudi
Listed Companies Evidence. International Journal of Economics and Finance,
4(11),
217 – 224.
Alexander, D., & Nobes, C. (2010). Financial accounting (4th Ed.). Harlow: Pearson
Education Limited.
Ahmad, Z., Abdullah, H.M.N., & Roslan, S. (2012). Capital Structure and Effect on
Firms
Performance: Focusing on Malaysian Sugar Firms. International Journal of
Business and Social Science, 8(5), 137-155.
Aliakbar, R., Seyed, H.S. N., & Peyen, M. (2013). The relationship between capital
structure
Decisions and firm performance: Comparison between big and small industries
In firms listed on Tehran Stock Exchange. World of sciences journal, 1(9), 83-
92.
Anandasayanan & subrenaman (2013).The determinant of leverage of the Sugar
companies in Sri Lanka. International Journal of Research in Commerce &
Management, 3(6).
48
Antwi, S., Mills, E. F. E. A., & Zhao, X. (2012). Capital Structure and Firm Value:
Empirical evidence from Ghana Sugar Firms. International Journal of Business
and Social Science, 3(22), 103-111.
Asterbro, T., & Bernhardt, I. (2003). “Start-up Financing, Owner Characteristics, and
Survival”. Journal of Economics and Business, 55, 303-319.
Athreya, K. B. (2008). “Default, insurance, and debt over the life-cycle”. Journal of
Monetary Economics, 55(4), 752–774.
Berk, J., & DeMarzo, P.M. (2011).Corporate finance (2nd Ed.). Harlow: Pearson
Education Limited.
Bodie, Z., Kane, A., & Marcus, A.J. (2011).Investments and portfolio management (9th
Ed.). New York: McGraw-Hill/Irwin.
Brealey, R.A., Myers, S.C., & Allen, F. (2011). Principles of corporate finance (10th
Ed.). New York: McGraw-Hill/Irwin.
Bryman, A. (2005). Social research methods (3rd Ed.). Oxford: Oxford University
Press.
Cai & Zhang (2006). Capital structure dynamics and stock returns. Working papers
Series from http://ssrn.com/abstracts
Chen, J. J. (2003). Determinants of capital structure of Chinese-listed companies. Journal
of Business Research, 57, 1341– 1351.
Chenhall, R. H., & Langfield, S. K. (2007).Multiple perspectives of performance
Measures. European Management Journal, 25(4), 266–282.
Crabtree, A. D., & DeBusk, G. K. (2008). The effects of adopting the balanced scorecard
on shareholder returns. Advances in Accounting, 24(1), 8–10.
Daskalakis, N., & Psillaki, M. (2005). The Determinants of Capital Structure of the
SMEs: Evidence from the Greek and the French firms. Journal of Business &
Economics Research, 13, 37- 44.
Ebaid, I.E. (2009). The Impact of Capital- Structure choice on Firm Performance:
Empirical Evidence from Egypt. The Journal of Risk Finance, 10(5), 477-487.
Ebrati, M. R., Emadi, F., Balasang, R. S., & Safari, G. (2013).The Impact of Capital
Structure on Firm Performance: Evidence from Tehran Stock Exchange.
Australian Journal of Basic and Applied Sciences, 7(4), 1-8.

49
Eric, S. (2012). Determinants of the choice leasing vs. bank loan: Evidence from the
French SME, working paper, University of Durham.
Fama, E., & French, K.L. (2002). “Testing trade-off and pecking order predictions about
Dividends and debt”, Review of Financial Studies, 15, 1-33.
Fok, Robert, C.W., & Chang, Yuan, C., & Lee, W. T. (2004). Bank Loans and their
effects on firm performance around the Asian Financial Crisis: Evidence from
Taiwan Sugar Firms. Financial Management, 33(2).
Ghosh, A. (2006). Profitability and Capital Structure of Amex and Nyse Firms. Journal
of Business & Economics Research, 11, 57-64.
Gleason, K.C., Mathur, L.K., & Mathur, I. (2000). The Interrelationship between
Cultures Capital Structure and Performance: Evidence from European Retailers.
Journal of Business Research, 50, 185-191.
Hammes, K. (2003). “Firm performance, debt, bank loans and trade credit. An empirical
Study”, working paper, Department of Economics, Gothenburg University of
Gothenburg.
Hovakimian, A., Hovakimian, G., & Tehranian, H. (2004). Determinants of target capital
Structure: The case of dual debt and equity issues. Journal of Financial
Economics, 71(3), 517-540.
Hovakimian, A., Opler, T., & Titman, S. (2001).The Debt-Equity Choice. The Journal of
Financial and Quantitative Analysis, 36(1), 1-24.
Huang, G., & Song, F. M. (2006). “The determinants of capital structure: Evidence from
China”. China Economic Review, 17(1), 14-36.
Hyvonen, J. (2007). Strategy, performance measurement techniques and information
technology of the firm and their links to organization performance
Management. Cambridge, MA: Havard Business School Press.
Ittner, C. D. (2008). Does measuring intangible for management purposes improve firm
performance? A review of the evidence, 38(3), 61-127.
Iqbal, S. M. J., Muneer, S., Jahanzeb, A., & Rehman, S.U. (2012). A Critical Review of
Capital Structure Theories. Information Management and Business Review,
4(11), 553-557.
Kang, J. K., & Stulz, R.M. (2000).Do Banking Shocks Affect Borrowing Firm
Performance? An Analysis of the Japanese Experience. The Journal of Business,
73(1), 1-23.

50
Kenya Sugar Board, (2014).Year Book of Statistics; KSB Headquarters, Nairobi.
Kisaame, J. (2002). Financing of Sugar Firms. Paper presented at a United Nations
Conference on Trade and Development, Kampala.
Kieso, D. E., Weygand, J. J., Warfield, T. D., Young, N. M., & Wiecek, I. M. (2005).
Intermediate accounting (7th ed. Vol. 1): Wiley.
Korajczyk, R., & Levy, A. (2003). Capital structure choice: macroeconomic conditions
and Financial constraints. Journal of Financial Economics, 68, 75-109.
Kothari, C.R. (2004). Research Methodology, Methods and Techniques: New age
International (P) Limited
Lagerlof, A., & Rosenlof, F. (2012).Swedish High Yield Corporate Bond Market – A
Market Outlook in the Light of Increasing Financial Regulations Retrieved 12
August, 2014, from https:// gupea.ub. gu.se/ bitstream /2077/ 30592/ 1/gupea
2077305021. pdf
Lancett, p., & media, D. (2008).Types of Long term debt: Retrieved 28 June, 2014, from
http://www.chron.com/ privacy_ Policy/#caprivacyrights
Lasfer, M.A., & Levis, M. (2008).The Determinants of Leasing Decision of
Small and Large Sugar Companies. European Financial Management, 4, 159-
184.
Leland, H.E. (2004). Corporate Debt Value, Bond Covenants, and Optimal Capital
Structure, Journal of Finance, 49(4), 1213-1252.
Letoluo, J.L., (2003). The influence of Farmland Leasing on Household Livelihood
Strategies. Study of the Wheat belt Region in Narok District. Unpublished MBA
Research paper, University of Nairobi.
Li, L. R., & Simerly, M. (2008).The moderating effect of environmental dynamism on
the ownership and performance relationship. Strategic Management Journal, 19,
69-79.
Lorigan, p. (2014).Definition of Operating Leases. Retrieved 5 June, 2014, from
http://www.linkedin.com/today/post/article/20140605230933-182358definition-
of-Operating-leases
Mengistae, T., & Xu, L. (2004). „Agency Theory and Executive Compensation: the Case
of Chinese State-Owned Enterprises‟, Journal of Labor Economics, 22 (3),
15-637.

51
Mesquita, J.M.C., & Lara, J.E. (2003). “Capital structure and profitability: The Brazilian
Case Academy of Business and Administration Sciences Conference,
Vancouver, 11-13.
Miller, M.H. (1977).Debt and Taxes, Journal of Finance, 32(2), 261-275.
Modi, A. (2014). Blame it on Rio. Retrieved 30 March, 2014, from http:// Brazil debt
Mugenda, O.M., & Mugenda, A.G. (2003). Research Methods. Quantitative and
Quantitative Approaches. Nairobi: Acts Press.
Muhammad, J.K., Naveed, K., & Hammad, H.M. (2012). Factors Influencing the
Profitability of Leasing Firms in Pakistan: Application of OLS and LOGIT
Model.
Munene, W.W. (2011). The effect of lease finance on the financial performance of
Companies listed at the Nairobi securities exchange, unpublished masters
Dissertation, University of Nairobi.
Murugesu, T. (2013).Effect of debt on corporate profitability of 11 listed hotels in Sri
Lanka Between 2008 to 2012. European Journal of Business and Management,
5(30).
Mutai, E. (2014). Nzoia Sugar owes sh.32bn and is insolvent, pic told. Retrieved 7 May
2014, from http:// Nzoia debt .html
Myers, S.C. (1984). The Capital Structure Puzzle, the Journal of Finance, Papers and
Proceedings, Forty-Second Annual Meeting, American Finance Association, 39
(3), 575-592.
Onaolapo, A.A., & Kajola, S.O. (2010). Capital Structure and Firm Performance:
Evidence from Nigeria. European Journal of Economics, Finance and
Administrative Sciences, 25, 70-82.
Omran, M. M. and Pointon, J. (2009), “Capital structure and firm characteristics: an
Empirical analysis from Egypt Sugar Firms”, Review of Accounting and
Finance, 8(4), 454-474.
Oslo Børs. (2013). Issuing corporate Bonds in Oslo - market for raising debt capital.
Retrieved 20 February, 2013, from http://www.oslobors.no/ob eng/Oslo-
Boers/Products- and services / Brochure material/Bonds
Otieno, J. (2014). Sugar cane farmers to wait longer for payout. Retrieved 22 March,
2014, from http:// www.the eastafrican.co.ke/-/2456/2024932/-/abf12iz/-
/index.html

52
Pandey, M. (2001). Capital structure and the firm characteristics: evidence from an
emerging Market, working paper, Indian Institute of Management
Ahmadabad.
Penman, S.H. (2010). Financial Statement Analysis and Security Valuation. (4 th ED.).
New York: McGraw-Hill/Irwin.
Saeed, M. M., Gull, A. A., & Rasheed, M. Y. (2013). Impact of Capital Structure on
Banking. Empirical Evidence from Tehran Stock Exchange Companies. The
Journal of Business, 13(2), 10-26.
Salam, A. (2013). Effects of Lease Finance on Performance of Sugar Firms in
Bangladesh. International Journal of Science and Research, 2(12), 2319 –
7064.
Sanna, M., & Emilie, R. (2013). The Bond-to-Total Debt Ratio and its Impact on Firms'
Performance, Unpublished Management Research Project of the Umea
School of Business and Economics.
Silverman, D. (2007), Qualitative Research: Theory, Method and Practice. London, UK:
SAGE Publications Limited.
Shirley, M., & Xu, L. C. (2001). „The Empirical Effects of Performance Contracts:
Evidence from China‟. Journal of Law, Economics and Organization 17,168-
200.
Tarus, K. (1997). Determination of the factors influencing the growth of finance leases in
Kenya. Unpublished MBA Research paper, University of Nairobi.
Thune, k. (2014).Definition and Basics on Corporate Bonds and Corporate Bond Funds.
Retrieved10 August, 2014, from http://mutualfunds.about.com/od/mutualfund
glossary/a/What-Are-Corporate-Bonds.html
Tyler, G. (2006). Competitive Commercial Agriculture in Sub Saharan Africa. Paper
Presented at a United Nations Conference on Trade and Development,
Ethiopia.
Uchida, K. (2008). “The Relation between corporate bond and bank debt on Japanese
Manufacturing firms”. Journal of Financial Economics 15, 251-169.
Ukko, J. (2009). Managing through measurement: A framework for successful operative
level Performance measurement. PhD thesis at the Lappeenranta University of
Technology.
Umar, Tanveer, Aslam, & Sajid. (2012). Impact of capital structure on firm‟s financial
Performance. Research Journal of Finance and Economics, 3(12), 319 -764.

53
Vasantha (2012). Essays on Capital Market Frictions: Evidence from Leasing Financing.
Journal of Financial Economics, 14, 501-521.
Wachira, C. (2014). Mumias sugar to renegotiate Debt payments with lenders. Retrieved
11 June, 2014 from http://mumias- sugar-to- Renegotiate-debt- payments-with
Lenders.html

54
APPENDIX 1: LIST OF SELECTED SUGAR FIRMS IN KENYA
1. MUHORONI
2. KIBOS & ALLIED
3. SOIN SUGAR FIRM
4. MUMIAS
5. NZOIA
6. WEST KENYA
7. SONY SUGAR
8. CHEMILIL
9. BUTALI
SOURCE: KENYA SUGAR BOARD (2014)

55
APPENDIX 1I: DATA COLLECTION FORM FOR SECONDARY DATA
Tick as appropriate
Company Id…………..
Indicator Year
2010 2011 2012 2013 2014
Long term debt ratio
Long term loan
Corporate bond
Operating lease
ROA
ROE
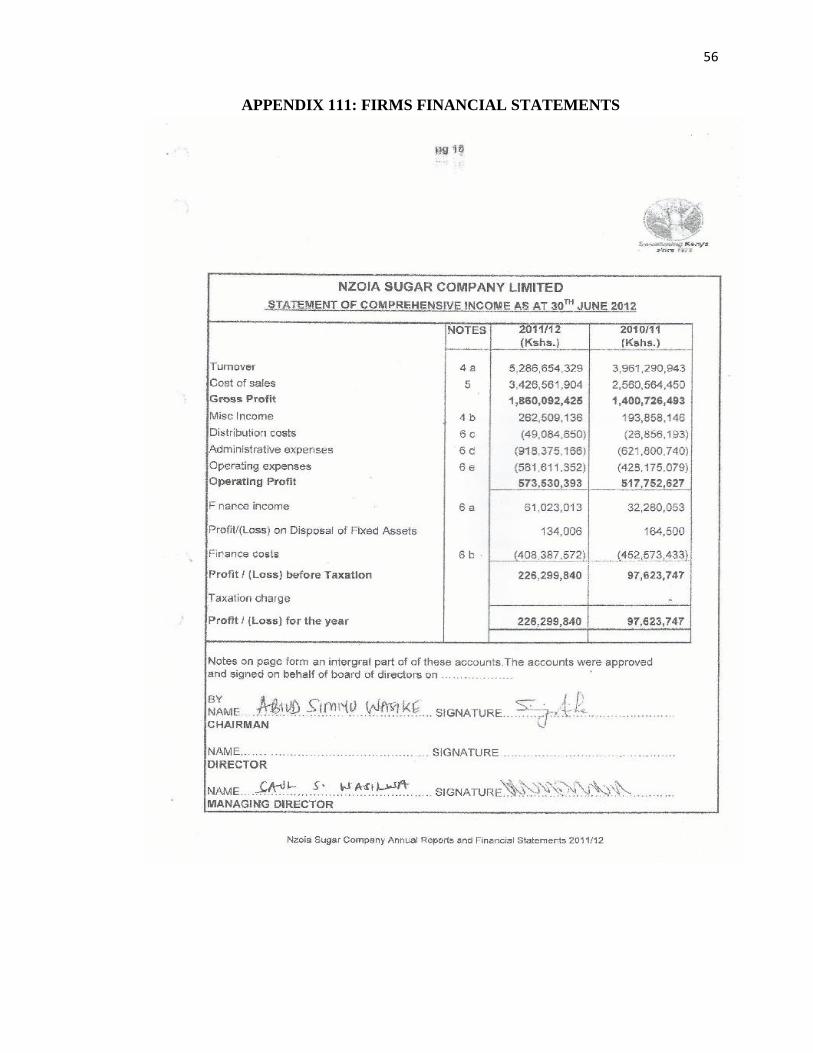
56
APPENDIX 111: FIRMS FINANCIAL STATEMENTS
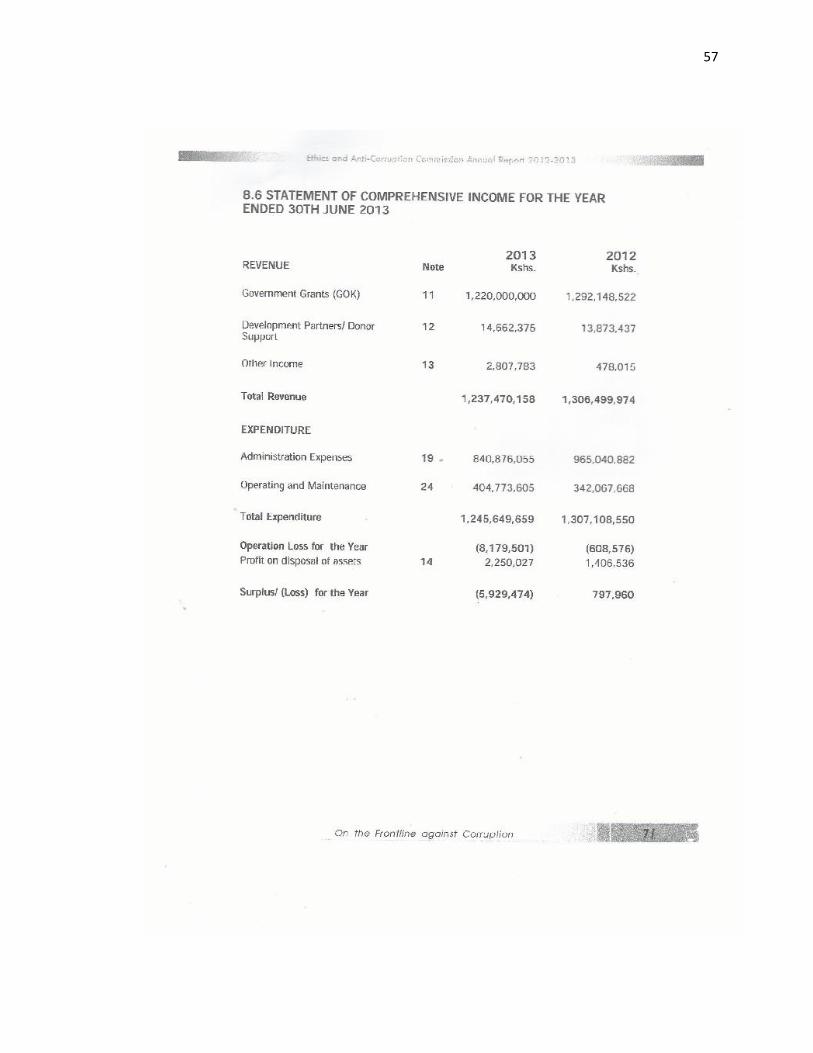
57

58

59
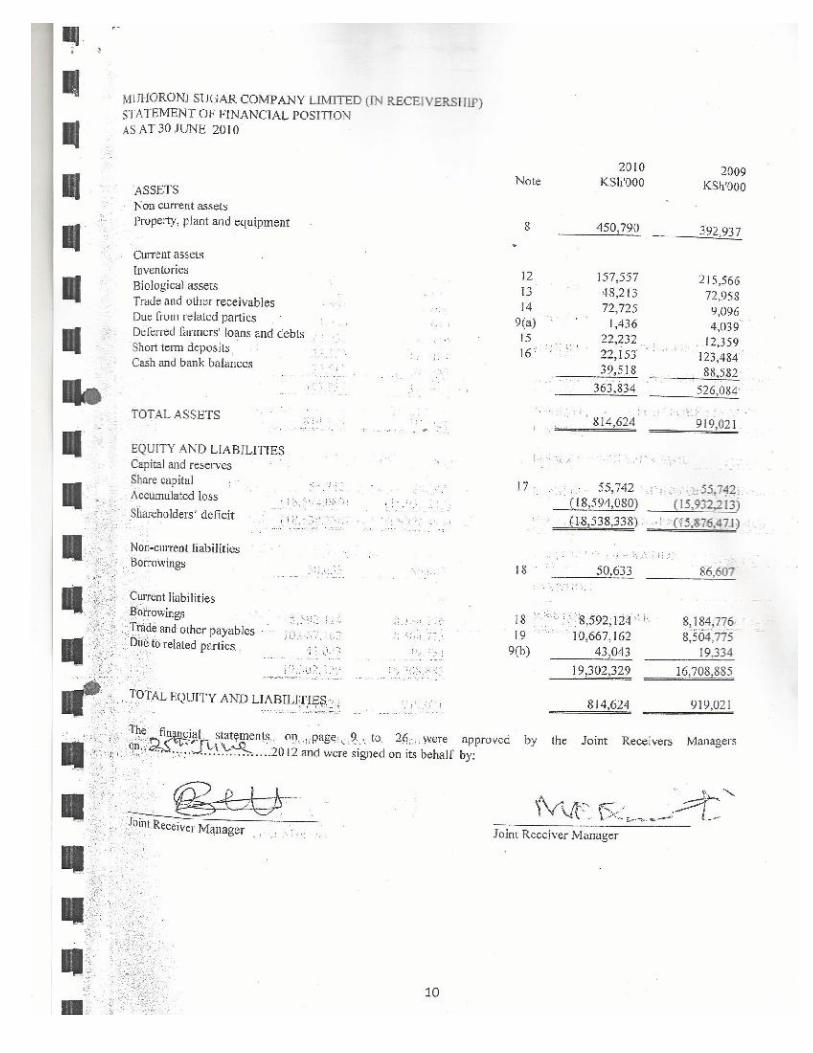
60

61

62

63
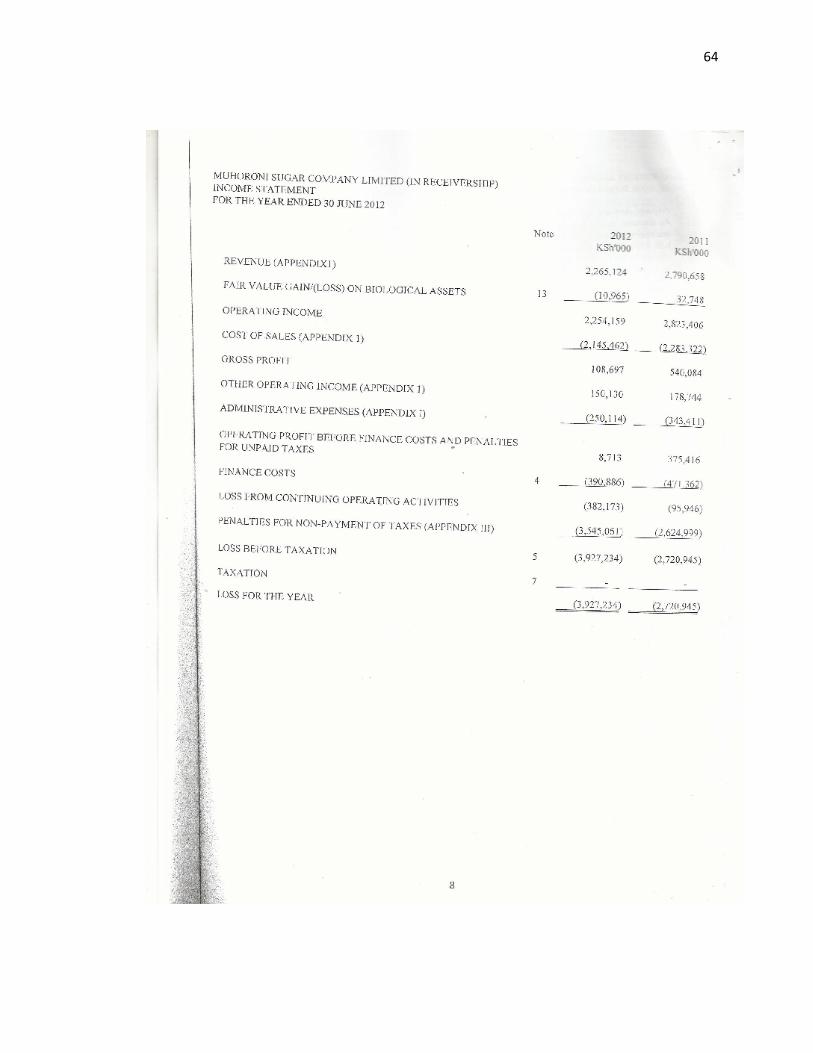
64

65
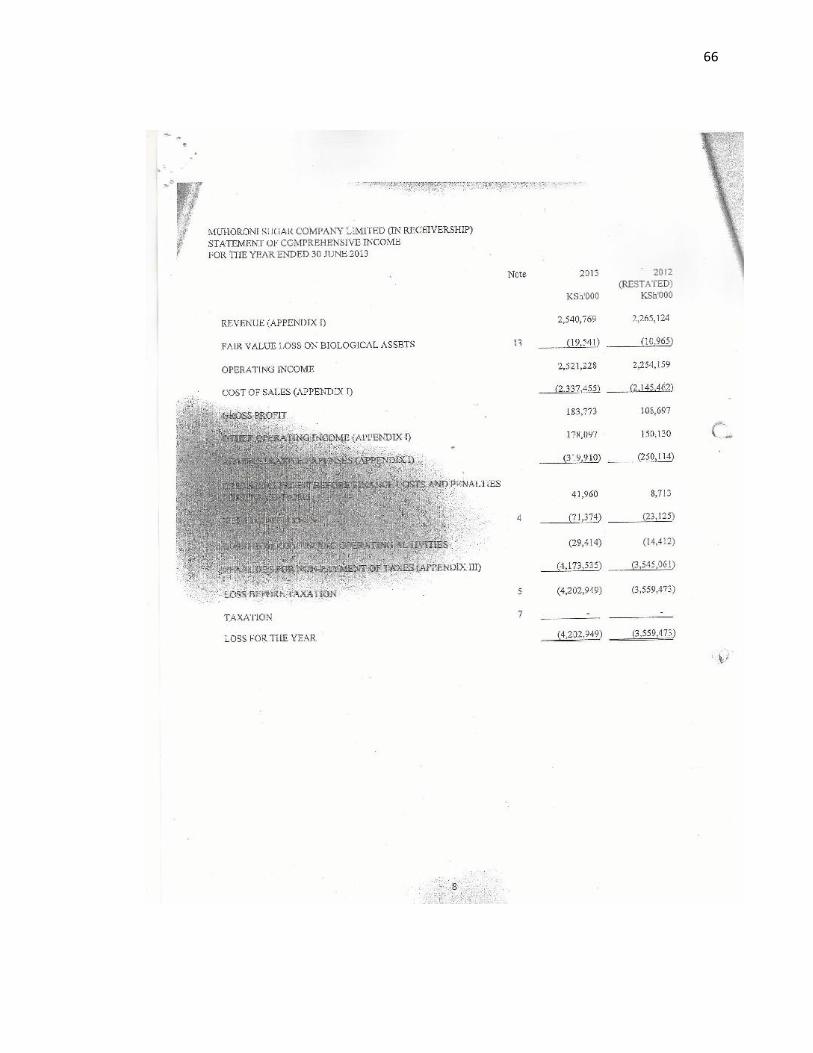
66

67

68
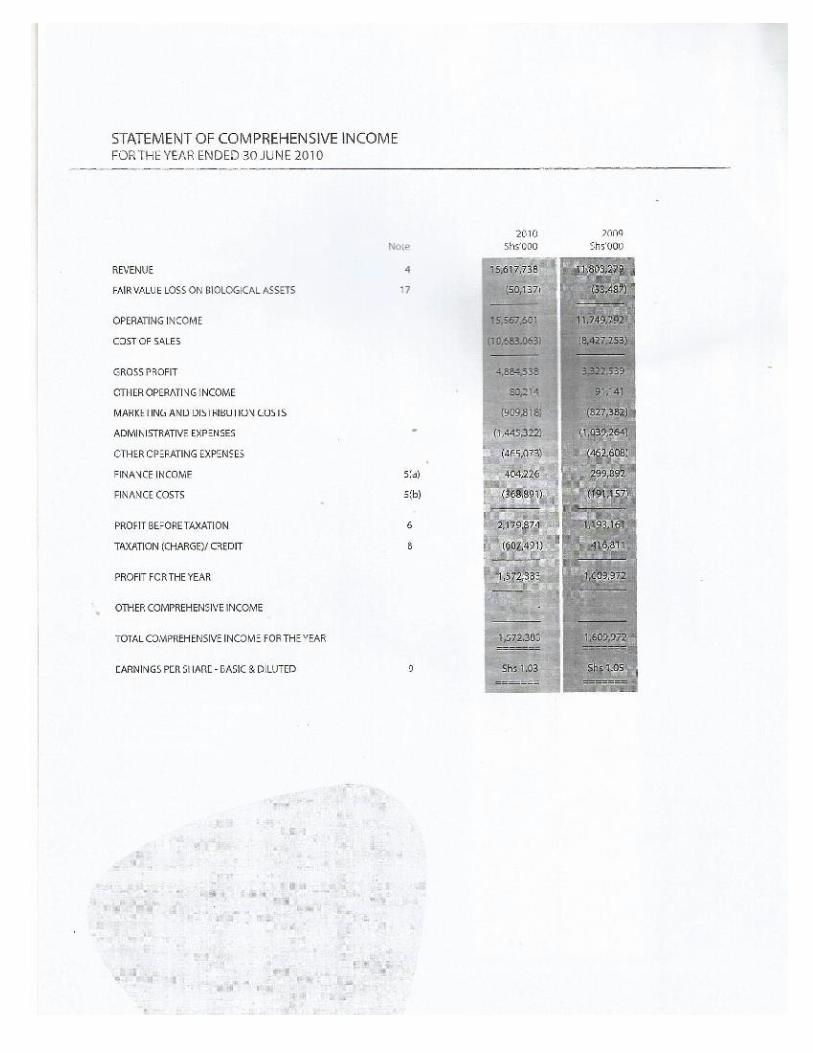
69

70

71

72