long term capital appreciation and current income ... leaflet and brochure/sbi magnum... ·...
TRANSCRIPT

Product Labeling
This product is suitable for investors who are seeking*:
Long term capital appreciation and current income
Investment in equity and equity related instruments as well as
fixed income securities (debt and money market securities)
*Investors should consult their financial advisers if in doubt about whether the product is suitable for them.

Table of Content
Characteristics of Equity and Debt Portfolio
Investors Conundrum & Solution
SBI Magnum Monthly Income Plan
SBI MMIP – Asset allocation & Active Management
Portfolio Holding
Performance
Regular Cash Flow & SWP Illustration
Synopsis
Annexures

CRISIL Composite Bond Fund Index (CCBFI) Vs BSE Sensex
• Under the different market phases & different investment horizon, debt asset class has given relatively stable return, which has added stability to investors net asset value
• But pure debt portfolio returns might not beat inflation.
• It is important to add a portion of equity to your debt portfolio to improve the performance over longer holding period.
Source: BSE and MFI Explorer
Crisil composite bond fund index has delivered almost similar returns in various time period
Sensex has relatively given high volatile returns during the period as illustrated above
Characteristics of Equity & Debt Portfolio
4%
7% 7% 7%
Jan'04 - Dec'07 Jan'08 - Mar'09 Dec'10 - Dec'13 Jan'04 - May'17
% C
AG
R R
etu
rns
Period
CAGR Returns during different market phases
37%
-45%
1%
13%
Jan'04 - Dec'07 Jan'08 - Mar'09 Dec'10 - Dec'13 Jan'04 - May'17
% C
AG
R R
etu
rns
Period
CAGR Returns during different market phases
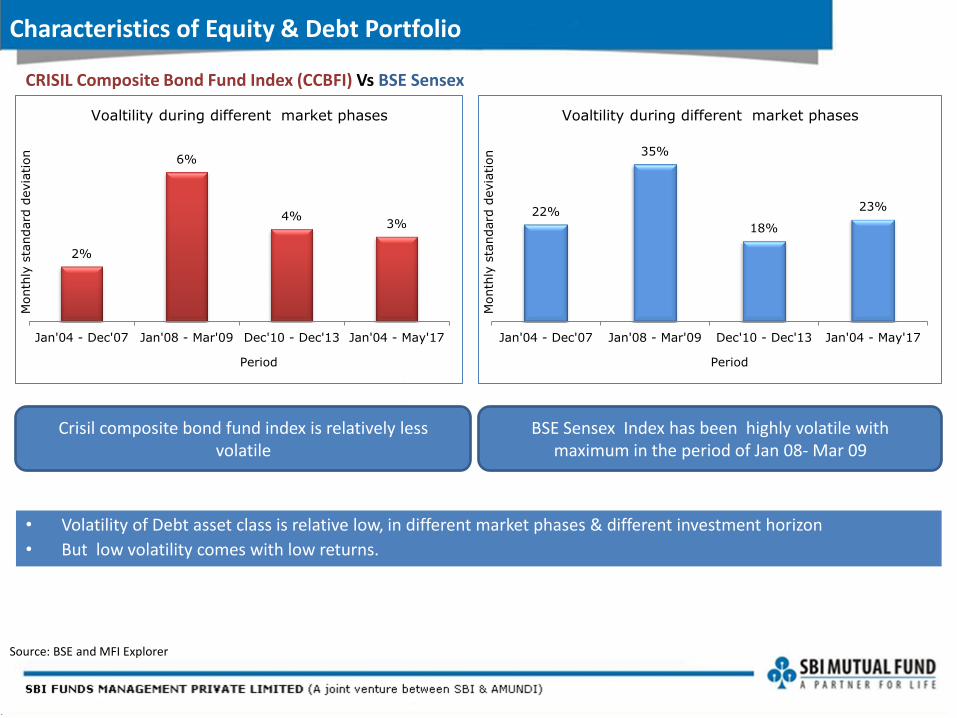
• Volatility of Debt asset class is relative low, in different market phases & different investment horizon
• But low volatility comes with low returns.
Crisil composite bond fund index is relatively less volatile
BSE Sensex Index has been highly volatile with maximum in the period of Jan 08- Mar 09
Source: BSE and MFI Explorer
Characteristics of Equity & Debt Portfolio
CRISIL Composite Bond Fund Index (CCBFI) Vs BSE Sensex
2%
6%
4% 3%
Jan'04 - Dec'07 Jan'08 - Mar'09 Dec'10 - Dec'13 Jan'04 - May'17
Month
ly s
tandard
devia
tion
Period
Voaltility during different market phases
22%
35%
18%
23%
Jan'04 - Dec'07 Jan'08 - Mar'09 Dec'10 - Dec'13 Jan'04 - May'17
Month
ly s
tandard
devia
tion
Period
Voaltility during different market phases

Crisil composite bond fund index has delivered almost similar returns in 1, 3 and 5 yr bases
BSE Sensex has given a very volatile return in 1yr, 3 yr and 5 yr bases
• Equity returns are volatile. There are period of up-markets and down markets.
• Debt returns are less volatile and stable over long investment period.
• A hybrid portfolio of debt and equity gets stability from its debt component and growth opportunities from equity
component.
Source: BSE and MFI Explorer
Characteristics of Equity & Debt Portfolio
CRISIL Composite Bond Fund Index (CCBFI) Vs BSE Sensex
11%
11%
9%
1 Year 3 Year 5 Year
Period
CAGR Returns as on May 31, 2017
17%
9%
14%
1 Year 3 Year 5 Year
Period
CAGR Returns as on May 31, 2017

So investors face a difficult task to choose between:
Debt asset class which comes with relatively stable return & low volatility but might not beat inflation
Equity asset class which can build wealth for investors but comes with high volatility
The key is an efficient asset allocation between debt & equity asset classes
Investors Conundrum

Risk averse investors
Most of the investible surplus goes into bank and post office deposits Prefers to “Play Safe” and invest in debt instruments Still aspires for higher returns
Equity market – volatile, high risk - high returns trade off
Access to debt papers is limited
Corporate debt – inflation leading to volatility in interest rates
Reasons for such paradox
Indian Investor: Investment Pattern
Investors are willing to invest into equity markets but not at risk of high volatility

Hybrid Fund
Relatively steady returns
Returns with Volatility
Investors Requirement : Low volatility investment solution
A product that can captures both the opportunities Optimizing returns with low volatility

Presenting
Product Labeling
This product is suitable for investors who are seeking*:
Long term capital appreciation and current income
Investment in equity and equity related instruments as well as
fixed income securities (debt and money market securities)
*Investors should consult their financial advisers if in doubt about whether the product is suitable for them.

Debt Portfolio • Less Volatility • Stable Returns
Equity Portfolio • Alpha Strategy • Relatively High Volatility • Highly Liquid Stocks • Bottom Up Strategy
In a Nut Shell: SBI Magnum Monthly Income Plan Portfolio
Fund Strategy
Investments under the fund will be a mix of debt, equity & money market instruments. Debt instruments is invested based on evaluation of macro-economic factors, market dynamics and issuer specific factors. Maximum exposure to equities is capped at 15% in the scheme. SBI MMIP invests across large, mid and Small-cap stocks.

Date of Inception 09/04/2001
Benchmark
Crisil MIP Blended Fund Index
Fund Managers Mr. Ruchit Mehta –Equity; Mr. Dinesh Ahuja – Debt
Exit Load
For exit within 1 Year from date of allotment: For 10% of investments – Nil; For remaining – 1% For exit after 1 Year from date of allotment- Nil
Investment Plans
Direct Plan &
Regular Plan
Investment Options
Growth Monthly, Quarterly & Annual
Dividend (Payout, Re-investment & Transfer
Facility)
FUND FEATURES
The objective of the scheme will be to provide regular income, liquidity and attractive returns to the investors through an actively managed portfolio of debt, equity and money market instruments. Income may be generated through the receipt of coupon payments, the amortization of the discount on the debt instruments, receipt of dividends or purchase and sale of securities in the underlying portfolio.
Investment Amount
Minimum investments Rs. 5000 & in multiples of Re. 1
Additional investments
Rs. 1000 & in multiples of Re. 1
SIP
Rs. 500 / month – 12 months Rs. 1000 / month – 6 months
Rs. 1500 / quarter – 4 quarters
SBI Magnum Monthly Income Plan
INVESTMENT OBJECTIVE

QUANTITATIVE ANALYSIS*
Modified Duration 4.67
Average Maturity 7.08 years
Yield to Maturity 7.70%
Fund Philosophy • Invests in a mix of equity & debt securities • Exposure in equity is limited to 15% and
exposure in debt & money market securities can be up to 100%
• Debt portion is invested in investment grade
securities with active duration management. Debt portfolio is manage in two parts viz. Core & Tactical
• Fund invests the equity portion across all market
caps. Equity portion is managed as a well-diversified portfolio with tightly defined internal guidelines.
SBI Magnum Monthly Income Plan
* As on May 31, 2017

SBI Magnum Monthly Income Plan – Asset Allocation
Allocation between equity and debt & money market is stable
Data is for the respective month end
52.5 56.2 49.0 50.12 48.64 48.18
39.73 44.91
32.72
56.70 51.63 54.00
30.4 26.43 33.59 33.19
31.5 30.87
28.9 27.22
29.91
27.10 27.81 24.36
2.2 2.0 3.2 3.05 5.09 7.35
16.89 14.04
24.00
2.14 6.60 7.58
15.0 15.3 14.2 13.64 14.77 13.6 14.48 13.83 13.37 14.06 13.96 14.06
Jun-16 Jul-16 Aug-16 Sep-16 Oct-16 Nov-16 Dec-16 Jan-17 Feb-17 Mar-17 Apr-17 May-17
SOV,AAA, AA+ and Equivalent Below AA+ NCA (Incl. Cash Deposits) Equity

SBI Magnum Monthly Income Plan – Actively Managed Debt Portfolio
Debt portfolio is managed actively based on macro economic views & fundamental research
Data is for the respective month end
7.44
8.39
7.50
8.49 8.24
8.93
6.46
5.86
4.15
7.54
6.99 7.08
Jun
-16
Jul-
16
Au
g-1
6
Sep
-16
Oct
-16
No
v-1
6
De
c-1
6
Jan
-17
Feb
-17
Mar
-17
Ap
r-1
7
May
-17
Avg Maturity (In Years)
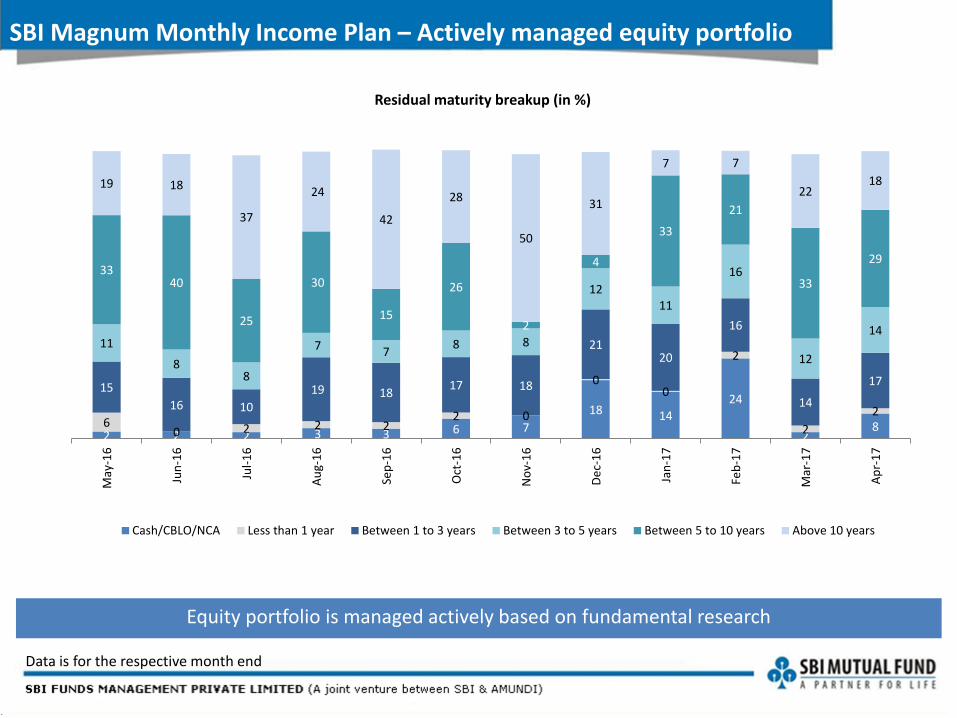
SBI Magnum Monthly Income Plan – Actively managed equity portfolio
Equity portfolio is managed actively based on fundamental research
Data is for the respective month end
2 2 2 3 3 6 7
18 14
24
2 8 6
0 2 2 2 2 0
0 0
2
2
2
15
16 10
19 18 17 18
21 20
16
14
17
11
8 8
7 7 8 8
12 11
16
12
14
33 40
25
30
15
26
2
4
33
21
33
29
19 18
37
24
42
28
50
31
7 7
22 18
May
-16
Jun
-16
Jul-
16
Au
g-1
6
Sep
-16
Oct
-16
No
v-1
6
De
c-1
6
Jan
-17
Feb
-17
Mar
-17
Ap
r-1
7
Residual maturity breakup (in %)
Cash/CBLO/NCA Less than 1 year Between 1 to 3 years Between 3 to 5 years Between 5 to 10 years Above 10 years

Data as on 31.05.2017
Portfolio Holdings
Top Equity Holdings % Of NAV
UPL LTD. 0.78
ITC LTD. 0.78
SREI INFRASTRUCTURE FINANCE LTD. 0.74
KOTAK MAHINDRA BANK LTD. 0.73
THE RAMCO CEMENTS LTD. 0.73
TITAN COMPANY LTD. 0.72
STATE BANK OF INDIA 0.69
PETRONET LNG LTD. 0.69
MARUTI SUZUKI INDIA LTD. 0.64
INDIAN TERRAIN FASHIONS LTD. 0.63
Equity, 14.07
NCD, 55.10
G-Sec, 15.14
SDL, 8.11
CBLO, 4.54
Cash, 3.04

Performance
Past performance may or may not be sustained in future. Returns (in %) other than since inception are absolute, calculated for growth option and in INR are point-to-point (PTP) returns calculated on a standard investment of 10,000/-. Inception date of the scheme is 09/04/2001. NAV (Regular plan Growth option) 31-Mar-2013: INR 23.8065, 28-Mar-2014: INR 25.1706, 31-Mar-2015: INR 30.0184, 31-Mar-2016: INR 31.8566. Additional benchmark as prescribed by SEBI for long-term debt schemes is used for comparison purposes. Please refer page no. 27-30 for the performance of other schemes managed by fund managers of the scheme; Data as on 31/03/2017
31-Mar-2016 to 31-Mar-2017
31-Mar-2015 to 31-Mar-2016
31-Mar-2014 to 31-Mar-2015 Since Inception
Absolute Returns (%) CAGR Returns
(%) PTP Returns (INR)
SBI Magnum Monthly Income Plan 14.17 6.12 19.15 8.40 36286.37 Crisil MIP Blended Index (Scheme Benchmark) 12.30 5.67 16.45 N.A. N.A. Crisil 10 year Gilt Index (Additional Benchmark) 11.87 7.97 14.57 N.A. N.A.
0.0
5.0
10.0
15.0
20.0
25.0
31-Mar-2016 to 31-Mar-2017
31-Mar-2015 to 31-Mar-2016
31-Mar-2014 to 31-Mar-2015
Since Inception
SBI Magnum Monthly Income Plan - Reg Plan -Growth
Scheme Benchmark: - Crisil MIP Blended Index
Additional Benchmark: - Crisil 10 Yr Gilt Index
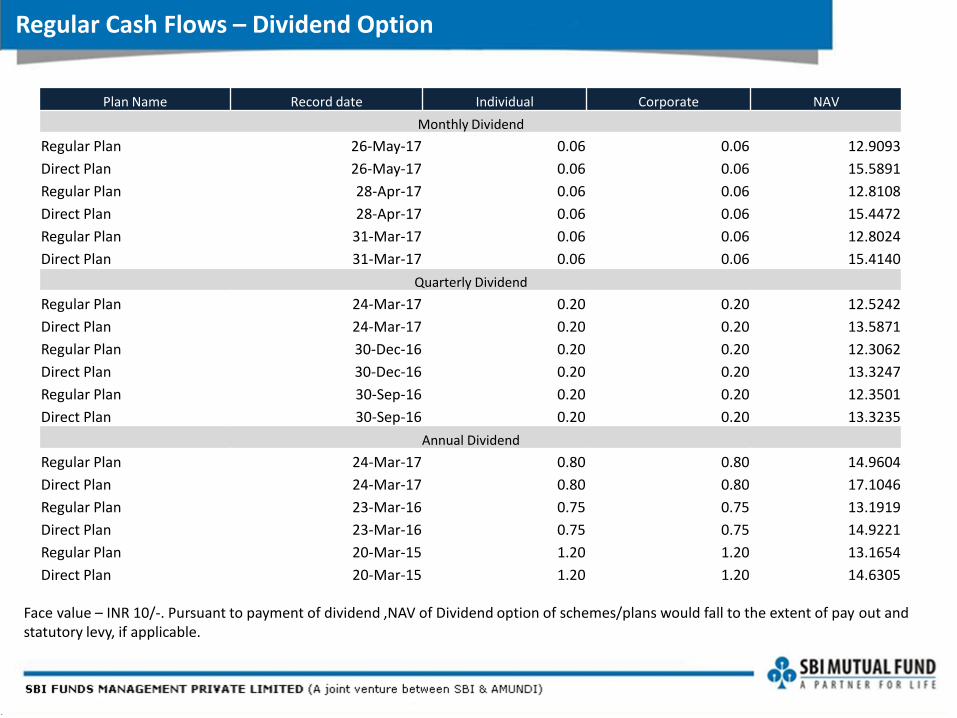
Regular Cash Flows – Dividend Option
Face value – INR 10/-. Pursuant to payment of dividend ,NAV of Dividend option of schemes/plans would fall to the extent of pay out and statutory levy, if applicable.
Plan Name Record date Individual Corporate NAV
Monthly Dividend
Regular Plan 26-May-17 0.06 0.06 12.9093
Direct Plan 26-May-17 0.06 0.06 15.5891
Regular Plan 28-Apr-17 0.06 0.06 12.8108
Direct Plan 28-Apr-17 0.06 0.06 15.4472
Regular Plan 31-Mar-17 0.06 0.06 12.8024
Direct Plan 31-Mar-17 0.06 0.06 15.4140
Quarterly Dividend
Regular Plan 24-Mar-17 0.20 0.20 12.5242
Direct Plan 24-Mar-17 0.20 0.20 13.5871
Regular Plan 30-Dec-16 0.20 0.20 12.3062
Direct Plan 30-Dec-16 0.20 0.20 13.3247
Regular Plan 30-Sep-16 0.20 0.20 12.3501
Direct Plan 30-Sep-16 0.20 0.20 13.3235
Annual Dividend
Regular Plan 24-Mar-17 0.80 0.80 14.9604
Direct Plan 24-Mar-17 0.80 0.80 17.1046
Regular Plan 23-Mar-16 0.75 0.75 13.1919
Direct Plan 23-Mar-16 0.75 0.75 14.9221
Regular Plan 20-Mar-15 1.20 1.20 13.1654
Direct Plan 20-Mar-15 1.20 1.20 14.6305
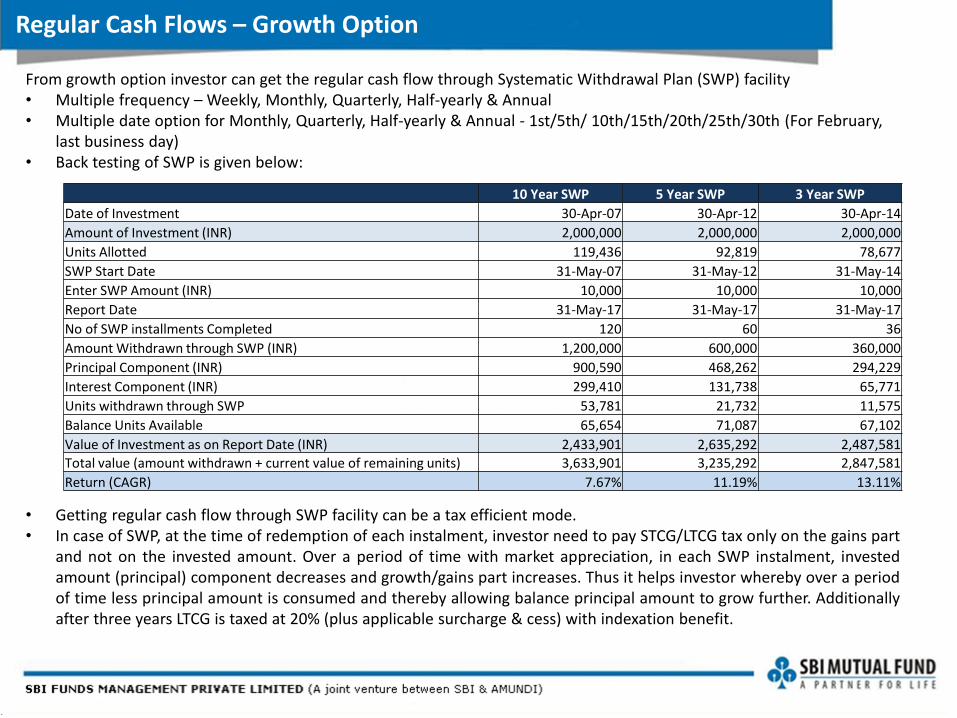
Regular Cash Flows – Growth Option
From growth option investor can get the regular cash flow through Systematic Withdrawal Plan (SWP) facility • Multiple frequency – Weekly, Monthly, Quarterly, Half-yearly & Annual • Multiple date option for Monthly, Quarterly, Half-yearly & Annual - 1st/5th/ 10th/15th/20th/25th/30th (For February,
last business day) • Back testing of SWP is given below:
• Getting regular cash flow through SWP facility can be a tax efficient mode. • In case of SWP, at the time of redemption of each instalment, investor need to pay STCG/LTCG tax only on the gains part
and not on the invested amount. Over a period of time with market appreciation, in each SWP instalment, invested amount (principal) component decreases and growth/gains part increases. Thus it helps investor whereby over a period of time less principal amount is consumed and thereby allowing balance principal amount to grow further. Additionally after three years LTCG is taxed at 20% (plus applicable surcharge & cess) with indexation benefit.
10 Year SWP 5 Year SWP 3 Year SWP
Date of Investment 30-Apr-07 30-Apr-12 30-Apr-14
Amount of Investment (INR) 2,000,000 2,000,000 2,000,000
Units Allotted 119,436 92,819 78,677
SWP Start Date 31-May-07 31-May-12 31-May-14
Enter SWP Amount (INR) 10,000 10,000 10,000
Report Date 31-May-17 31-May-17 31-May-17
No of SWP installments Completed 120 60 36
Amount Withdrawn through SWP (INR) 1,200,000 600,000 360,000
Principal Component (INR) 900,590 468,262 294,229
Interest Component (INR) 299,410 131,738 65,771
Units withdrawn through SWP 53,781 21,732 11,575
Balance Units Available 65,654 71,087 67,102
Value of Investment as on Report Date (INR) 2,433,901 2,635,292 2,487,581
Total value (amount withdrawn + current value of remaining units) 3,633,901 3,235,292 2,847,581
Return (CAGR) 7.67% 11.19% 13.11%

Regular Cash Flows – Growth Option – SWP illustration
Source: Internal data compilation. The above calculation is for illustration purpose only. SBIMF does not guarantee returns on investment to the investor in the scheme or those opting for SWP on their holding in the growth option. Valuation date – December 31, 2016. In the above calculation it has been assumed that investor falls under highest tax bracket (i.e. 30%) and total income of the investor does not exceed R. 1 crore. Indexation has been done using the actual cost inflation index numbers. Gains on the redemption of units of mutual fund are treated as capital gains for income tax purpose. For non-equity oriented schemes, gains on the investments for less than 3 years are treated as short term capital gains (STCG) and gains on the investment above 3 years are treated as long term capital gains (LTCG). STCG are taxed at marginal tax rate applicable to the investor and LTCG are taxed at 20% (plus applicable surcharge & cess) with indexation benefit. At the time of the redemption of units, redemption amount comprises two parts. One is the invested amount and other is gains on the invested amount. STCG/LTCG tax are applicable only on the gains made on the redemption units. In case of Systematic Withdrawal Plan (SWP), at the time of redemption of each instalment, investor need to pay STCG/LTCG tax only on the gains part and not on the invested amount. Over a period of time with market appreciation, in each SWP instalment, invested amount (principal) component decreases and growth/gains part increases. Thus it helps investor whereby over a period of time less principal amount is consumed and thereby allowing balance principal amount to grow further. Additionally after three years LTCG is taxed at 20% (plus applicable surcharge & cess) with indexation benefit.
Date NAV (Rs.) Amount (Rs.) Units transacted Balance units Cost of investment
(Rs.) Profit (Rs.)
Taxable Profit (Rs.)
Tax (Rs.) Net Profit
(Rs.) Value of balance
units (Rs.)
30-Apr-14 25.42 2,000,000 78677 78,677 - -
31-May-14 26.02 (15,000) -576 78,100 14,655 345 345 107 238 2,032,104
31-Aug-14 27.03 (15,000) -555 77,545 14,109 891 891 275 616 2,095,751
30-Nov-14 28.49 (15,000) -526 77,019 13,382 1,618 1618 500 1118 2,194,534
28-Feb-15 29.87 (15,000) -502 76,517 12,767 2,233 2233 690 1543 2,285,234
28-May-15 30.11 (15,000) -498 76,019 12,665 2,335 2335 722 1613 2,288,690
28-Aug-15 30.68 (15,000) -489 75,530 12,430 2,570 2570 794 1776 2,316,876
28-Nov-15 31.16 (15,000) -481 75,048 12,236 2,764 2764 854 1910 2,338,727
28-Feb-16 30.83 (15,000) -487 74,562 12,368 2,632 2632 813 1819 2,298,714
28-May-16 32.59 (15,000) -460 74,101 11,700 3,300 3300 1020 2281 2,415,054
28-Aug-16 34.42 (15,000) -436 73,666 11,079 3,921 3921 1212 2709 2,535,356
28-Nov-16 35.68 (15,000) -420 73,245 10,686 4,314 4314 1333 2981 2,613,697
28-Feb-17 35.83 (15,000) -419 72,827 10,642 4,358 4358 1347 3012 2,609,501
28-May-17 37.02 (15,000) -405 72,421 10,301 4,699 1563 322 4377 2,680,808
28-Aug-17 37.56 (15,000) -399 72,022 10,151 4,849 1021 210 4638 2,705,343
28-Nov-17 37.56 (15,000) -399 71,623 10,151 4,849 1021 210 4638 2,690,343
28-Feb-18 37.56 (15,000) -399 71,223 10,151 4,849 1021 210 4638 2,675,343
28-May-18 37.56 (15,000) -399 70,824 10,151 4,849 1021 210 4638 2,660,343
28-Aug-18 37.56 (15,000) -399 70,425 10,151 4,849 452 93 4756 2,645,343
28-Nov-18 37.56 (15,000) -399 70,025 10,151 4,849 452 93 4756 2,630,343
31-May-17 37.07 70,025 2,595,939
Particulars
Invested amount (Rs.)
SWP amount (Rs.)
Principal component (Rs.)
Growth/Gains component (Rs.)
Tax (Rs.)
Tax as % of SWP
Units Outstanding
Value of investments
(Rs.)
Amount 2,000,000 225,000 179,322 45,678
10,409 4.63% 70025 2,595,939

Synopsis
A debt oriented hybrid scheme with allocation in equity up to 15% & balance in debt
Backed by a robust investment management process
Endeavour to bring both - Growth from equity and Stability from debt
Active management within each asset class
The equity portion is dynamically managed based on a bottom up approach.
The debt portion is managed actively among government debt, corporate debt and money market instruments based on interest rate view, inflation & credit risk.
Thank You!

Annexures

24
63% 37%
India’s premier and largest bank with over
200 years experience (Estd.: 1806)
Asset base of USD 423 bn.*
Pan-India network of ~23,010 branches and
56,930 ATM’s as at end of September 2015
Servicing over 290 million customers
Only Indian bank in Fortune 500 list; ranked
among the top 100 banks in the world
Global leader in asset management
Backed by Credit Agricole and listed in Euronext Paris
More than 2,000 institutional clients and distributors
in 30 countries
Over 100 million retail clients via its partner
networks
€985 bn AuM as at end of December 2015
SBI Funds Management Private Limited
*Source: SBI Analyst Presentation as on end September 2015. USD 1 = INR 65.74 # Source : Amundi website as on end December 2015

SBI FM: Strengths Transforms To Experience
Established in 1987: A leading asset manager in India
25
Broad Investor
Base
AUM
INR 1,53,884 Cr
Wide Distribution
Network Experienced Investment
Team
Extensive Product Range
INR 1,57,025 Crores* AAUM in mutual funds
Asset management across mutual funds, segregated managed accounts, domestic advisory & offshore advisory business
Multiple asset classes ranging from equities and debt, money market to ETFs and structured funds
Investment team of 34 professionals with strong track record
Broad customer base with over 40 lakh folios of individual, corporate and institutional investors
* Quarterly average March, 2017

• Mr. Navneet Munot - Chief Investment Officer
Mr. Navneet Munot joined SBI Funds Management Pvt. Ltd. as Chief Investment Officer in Dec. 2008. Prior to SBIFM he was the
Head of Multi Strategies fund at Morgan Stanley Investment Management before which he worked as the Chief Investment Officer
(Fixed Income and Hybrid Funds) of Birla Sun Life Asset Management Company Ltd. Navneet has been associated with the financial
services business of the Birla group for over 13 years and worked in various areas such as fixed income, equities and foreign
exchange. His articles on matters related to financial markets have widely been published. Navneet holds a Masters in Commerce
and is also a rank holder Chartered Accountant. He is a charter holder of Chartered Financial Analyst Institute, US and Chartered
Alternative Analyst Institute, US. He has also done Financial Risk Management, FRM from Global Association of Risk Professionals
(GARP).
• Mr. Ruchit Mehta – Fund Manager Equity portion Ruchit joined SBIFM in 2010. Ruchit joins us from HSBC Asset Management where he was an analyst and assistant portfolio manager for four years. Prior to HSBC, Ruchit was as a sell side analyst with leading broking firms like ASK Raymond James and Prabhudas Liladhar for two years. Ruchit is a Commerce graduate from Mumbai University and holds Masters Degree in finance from Lancaster University, UK. He is also a Charter holder of the CFA Institute, USA.
• Mr. Dinesh Ahuja - Fund Manager Debt portion
Dinesh joined SBI Funds Management Pvt. Ltd. as a fixed income portfolio manager in 2010. Prior to joining SBI Funds Management
Pvt. Ltd. Dinesh was a portfolio manager at L&T Asset Management and Reliance Group for four years. Dinesh started his career in
1998 as a fixed income dealer on the sell side. Thereafter he worked in leading broking outfits for eight years before moving on the
buy side in 2006. Dinesh is a commerce graduate and has completed his Masters in Management Studies from Mumbai University
Biographies

Performance of other schemes managed by Mr. Dinesh Ahuja
Past performance may or may not be sustained in the future. Returns (in %) other than since inception are absolute calculated for growth option and in INR are point-to-point (PTP) returns calculated on a standard investment of 10, 000/-. Additional benchmark as prescribed by SEBI for long-term and short-term debt schemes is used for comparison purposes only. Performance calculated for regular plan.
*Returns for scheme benchmark index I Sec and Li-BEX is calculated using CRISIL Fund Analyser *Returns for scheme benchmark index Isec and SI-BEX is calculated using CRISIL Fund Analyser
Managing since
January, 2011
31-Mar-2016 to 31-Mar-
2017
31-Mar-2015 to 31-Mar-2016
31-Mar-2014 to 31-Mar-2015
Since Inception
Absolute Returns (%)
CAGR Returns
(%) PTP Returns
(INR)
SBI Dynamic Bond Fund - Reg Plan - Growth 13.62 5.57 13.69 5.65 20,600
Crisil Composite Bond Fund Index
11.09 8.24 14.59 6.75 23,617
Crisil 10 Yr Gilt Index
11.87 7.97 14.57 5.80 20,995
Managing since January,
2011
31-Mar-2016 to 31-
Mar-2017
31-Mar-2015 to 31-Mar-
2016
31-Mar-2014 to 31-Mar-
2015
Since Inception
Absolute Returns (%) CAGR
Returns (%)
PTP Returns
(INR)
SBI Magnum Gilt Fund
- Short Term - Growth 11.96 8.93 13.20 7.97 34,711
I Sec Si-BEX* 8.38 9.06 9.75 N.A. N.A.
Crisil 1 Year T-Bill
Index 7.15 7.69 8.74 6.31 26,994
Managing since January,
2011
31-Mar-2016 to 31-Mar-2017
31-Mar-2015 to 31-Mar-2016
31-Mar-2014 to 31-Mar-
2015
Since Inception
Absolute Returns (%) CAGR
Returns (%)
PTP Returns
(INR)
SBI Magnum Gilt Fund
- Long Term - Growth 14.74 5.90 21.34 8.36 36,894
I Sec Li-BEX* 12.47 7.26 19.88 N.A. N.A.
Crisil 10 Year Gilt Index 11.87 7.97 14.57 N.A. N.A.
31-Mar-2016 to 31-Mar-
2017
31-Mar-2015 to 31-Mar-2016
31-Mar-2014 to 31-Mar-
2015
Since Inception
Absolute Returns (%)
CAGR Returns
(%)
PTP Returns
(INR)
SBI Regular Savings Fund 13.29 6.67 16.18 8.06 28,221
Crisil MIP Blended
Index 12.30 5.67 16.45 8.13 28,483
Crisil 10 Yr Gilt Index 11.87 7.97 14.57 5.72 21,074

Performance of schemes managed by Dinesh Ahuja
Since inception NAV has been assumed at Rs.10.
Managing since
January, 2011
31-Mar-2016 to 31-Mar-
2017
31-Mar-2015 to 31-Mar-2016
31-Mar-2014 to 31-Mar-2015
Since Inception
Absolute Returns (%)
CAGR Returns
(%)
PTP Returns (INR)
Magnum
Income Fund
12.71
5.86
13.09
7.86
40,132
Crisil Composite
Bond Fund
Index
11.09
8.24
14.59
N.A.
N.A.
Crisil 10 year
Gilt Index
11.87
7.97
14.57
N.A.
N.A.
NAV of the Schemes
Managing since July, 2011
31-Dec-2015 to 31-Dec-
2016
31-Dec-2014 to 31-Dec-
2015
31-Dec-2013 to 31-Dec-
2014 Since Inception
Scheme Name Absolute Returns (%) CAGR
Returns (%)
PTP Returns
(INR)
SBI Magnum MIP - Floater – Growth
11.42
7.50
18.52
8.15
24192
Crisil MIP Blended Index
12.30
5.67
16.45
8.41
24876
Crisil 1 Yr T-Bill Index
7.15
7.69
8.74
6.30
19929
Scheme Name 31-Mar-14 31-Mar-15 31-Mar-16 31-Mar-17
SBI Corporate Bond Fund - Growth 19.6494 21.8093 23.8333 26.2086
SBI Dynamic Bond Fund - Growth 15.1043 17.1727 18.1288 20.5979
SBI Equity Savings Fund - Reg - Growth N.A. N.A. 10.4162 11.5373
SBI Magnum Balanced Fund - Growth 66.1133 94.9637 94.7017 109.1553
SBI Magnum Gilt LTP - Growth 25.0246 30.3645 32.1573 36.8972
SBI Magnum Gilt STP - Growth 25.2424 28.5746 31.1272 34.8494
SBI Magnum Income Fund - Growth 29.9174 33.8345 35.8163 40.3685
SBI Magnum MIP - Floater - Growth 17.0401 20.1965 21.7115 24.1917
SBI Magnum MIP - Growth 25.1929 30.0184 31.8566 36.3691
SBI Regular Savings Fund - Growth 20.1442 23.4027 24.9638 28.2815

Disclaimer
Mutual Fund investments are subject to market risks, read all scheme related documents carefully. This presentation is for information purposes only and is not an offer to sell or a solicitation to buy any mutual fund units/securities. These views alone are not sufficient and should not be used for the development or implementation of an investment strategy. It should not be construed as investment advice to any party. All opinions and estimates included here constitute our view as of this date and are subject to change without notice. Neither SBI Funds Management Private Limited, nor any person connected with it, accepts any liability arising from the use of this information. The recipient of this material should rely on their investigations and take their own professional advice