long-term and short-term prospects for feed...
TRANSCRIPT

Long-Term and Short-Term Prospects for Feed Costs
Presented to The Annual Pork Financial Management Conference
June 17, 2011
Bill Lapp, President Advanced Economic Solutions™

Corn Is King “When corn sneezes, the other food commodities catch a cold”
Corn67%Oats
0%
Wheat11%
Barley1%
Soybeans19%
Milo2%
Corn Represents 2/3rds ofAll Crops Produced in the US
(Basis 2009 production data)
May 2011 Advanced Economic Solutions 2

Importance of Outside Influences on Agriculture Prices
Corn & Other Ag
Commodities
Global
Economic
Growth
Value of US $
Think Globally, Act Locally
May 2011 Advanced Economic Solutions 3

The Value of the US Dollar Has Declined By 1/3rd Since 2002
May 2011 Advanced Economic Solutions 4

GDP Growth (Real Ave Annual %)
1990-99 2000-09 2010-11
World 2.9 3.5 4.7
China 9.3 9.6 10.0
Developing 3.3 6.0 6.8
US 3.1 1.8 2.9
Advanced 2.7 1.7 2.8
May 2011 Advanced Economic Solutions 5

China’s Growing Appetite For Food:
- To paraphrase Seinfeld,
“its real, and its spectacular….”
80
90
100
110
120
130
2000 2001 2002 2003 2004 2005 2006 2007 2008 2009 2010 2011
Chinese Per Capita Meat Consumption (2000=100)
May 2011 Advanced Economic Solutions 6

Contributions to Global Demand Growth: 2000-10
CHINA
Wheat 0%
Rice 5%
Coarse Grains 17%
Soymeal 51%
Vegoil 28%
BIOFUELS
Ethanol (Corn) 46%
Biodiesel (Vegoil) 43%
May 2011 Advanced Economic Solutions 7

Growth in World Grain / Oilseed Demand 1990-2000 2000-10 Annual Yld
Growth Rate MM Acres (2011)
Annual Acreage “Gap”
- Rice 1.5% 1.1% 1.1% 395 0 MM
- Wheat 0.4% 1.1% 1.1% 555 0 MM
- Coarse Grains 0.8% 2.5% 2.1% 775 3 MM
- -- Eaten 0.7% 1.4%
- -- Burned 4.8% 23.1%
Oilseed Meal 4.2% 3.9% 1.1% 543 15 MM
- -- Soymeal 5.4% 4.2% 1.2% 260 8 MM
- Vegoil 4.8% 5.1%
- -- Eaten 4.5% 3.5%
- -- Burned 7.3% 13.5%
- Palm 8.4% 5.5%
May 2011 Advanced Economic Solutions 8

Where Will The Acres Come From?
May 2011 Advanced Economic Solutions 9
US, 28.9 , 27%
Non-US, 80.0 , 73%
1970-80 Acreage Expansion: 109 mm acres (8%)
US, 10.5 , 19%
Non-US, 44.3 , 81%
2000-2010 Acreage Expansion: 54 mm acres (4%)
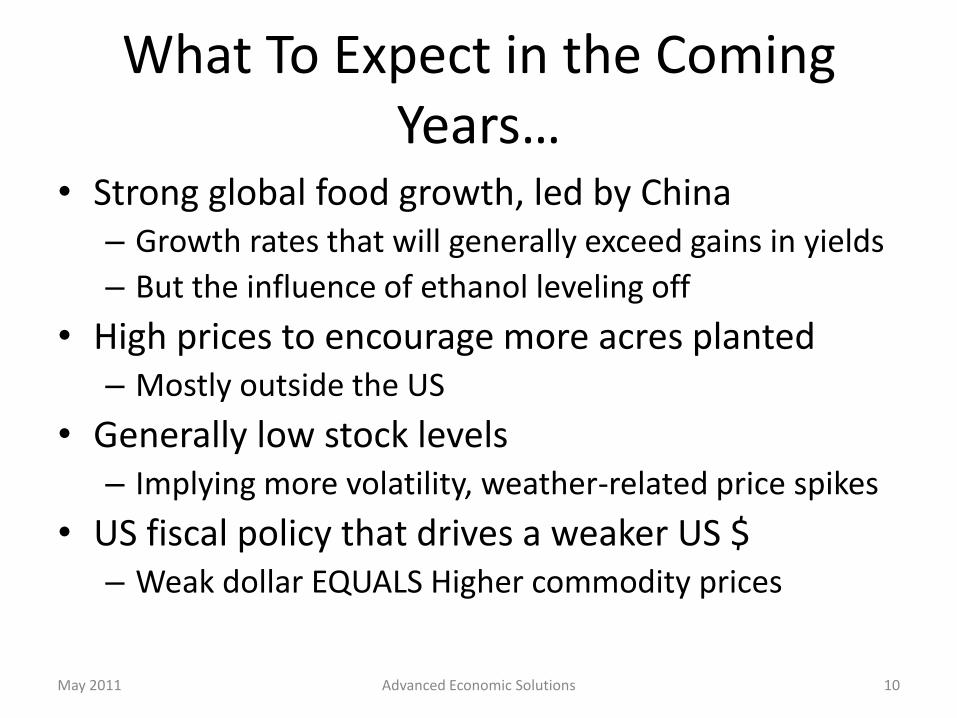
What To Expect in the Coming Years…
• Strong global food growth, led by China – Growth rates that will generally exceed gains in yields
– But the influence of ethanol leveling off
• High prices to encourage more acres planted – Mostly outside the US
• Generally low stock levels – Implying more volatility, weather-related price spikes
• US fiscal policy that drives a weaker US $ – Weak dollar EQUALS Higher commodity prices
May 2011 Advanced Economic Solutions 10

Volatility Is Here…. (even if you choose to ignore it)
May 2011 Advanced Economic Solutions 11

The New Plateau….
May 2011 Advanced Economic Solutions 12
$-
$1.00
$2.00
$3.00
$4.00
$5.00
$6.0018
66
1876
1886
1896
1906
1916
1926
1936
1946
1956
1966
1976
1986
1996
2006
AVERAGE U.S. CORN PRICES: (1866-2010)

End Stocks – Price Scatter Diagrams • This was a useful tool for predicting prices, but has become
less meaningful in past 4 years
• All have shifted upward and to the right since 2006/07
June 2011 Advanced Economic Solutions 13
2007
20062008
2009
2010
$1.50
$2.00
$2.50
$3.00
$3.50
$4.00
$4.50
$5.00
$5.50
$6.00
0.0% 5.0% 10.0% 15.0% 20.0% 25.0%
Co
rn F
utu
res
Pri
ce
Corn Stocks as % of Usage
Annual Corn Prices vs. Ending Corn Stocks-Use Ratio

Outlook for Feed Costs
• The overall situation for grains has become “tighter” since mid-2010, and will remain tight through most of 2011 and into 2012
– Prices will remain generally strong, and volatility will remain high
– Changes in supply/demand will dramatically impact prices
• Ending stocks – Corn: 10/11F 620 mm (4.6% of usage) ---- 11/12F 631 mm (4.7% of usage) ---- critically tight
– Soybeans: 10/11F 176 mm (5.3% of usage) ---- 11/12F 200 (6.0% of usage) ---- extremely tight
• Key unknowns during the next six months – Production, based on changes in planted area & yields
– Ethanol demand & policy
– Chinese corn/sb imports
• External factors will remain important drivers of prices in the coming year
– This includes the value of the US dollar and Chinese monetary policy
June 2011 Advanced Economic Solutions 14

US Corn Supply/Demand
June 2011 Advanced Economic Solutions 15
- Stocks at the end of the 10/11 crop year are forecast to decline to a bare
minimum 4.6%, tightest since mid-90s
- Even with an increase to 91.7mm acres, stocks at the end of 11/12 are
projected to build only modestly
2007/08 2008/09 2009/10F 2010/11F 2011/12FProj Proj Proj
Planted Acres 93.5 86.0 86.4 88.2 91.7
Harv. Acres 86.5 78.6 79.5 81.4 84.3
Yield (bu./acre) 150.7 153.9 164.7 152.8 160.0
Production 13038 12092 13092 12447 13495
Carryin 1614 1614 1673 1708 620
Total Supply 14362 13730 14773 14170 14128
Fuel 3027 3708 4560 5015 5083
Total FSI (incl Fuel) 4442 5025 5938 6390 6408
Feed & Resid 5859 5187 5142 5340 5239
Exports 2438 1845 1985 1820 1850
TOTAL USE 12738 12057 13065 13550 13497
Ending Stocks 1624 1673 1708 620 631
% of Use 12.7% 13.9% 13.1% 4.6% 4.7%
US Corn Supply/Demand
(Million Acres/Bushels)

June 2011 Advanced Economic Solutions 16
Lowest Stocks-Use Ratio On Record
– for both this year and next year!
5.0%
10.0%
14.9%
19.2%18.1%
19.5%
16.3%
11.5%
9.4%
18.5%17.6%
11.6%12.7%
13.9%13.1%
4.6% 4.7%
0%
5%
10%
15%
20%
25%9
5
96
97
98
99
00
01
02
03
04
05
06
07
08
09
10
11
U.S. Corn Stocks-Use Ratio (10/11 & 11/12 Forecast)

June 2011 Advanced Economic Solutions 17
- Current Expected: 13.47 B (91.5 planted & 160 BPA) – would imply December corn
futures trading near $6.00-6.50 this fall
- Low Side Estimate: 12.89 B (91.0 planted & 154 BPA) – would imply need for
rationing and December corn trading over $9 later this year
- High Side Estimate: 13.96 B (92.5 planted & 164 BPA) – would imply adequate
supplies & some stock building, lead December corn toward $5.50

- Corn acreage was pegged at 92.2 mm in 2011 by USDA - But a better estimate may be 91.7 mm
Mayl 2011 Advanced Economic Solutions 18
93.5 92.2
70
75
80
85
90
958
9/9
0
90
/91
91
/92
92
/93
93
/94
94
/95
95
/96
96
/97
97
/98
98
/99
99
/00
00
/01
01
/02
02
/03
03
/04
04
/05
05
/06
06
/07
07
/08
08
/09
09
/10
10
/11
11
/12
12
/13
13
/14
Millio
n A
cre
s
US Corn Acreage (2011-13 Forecast)
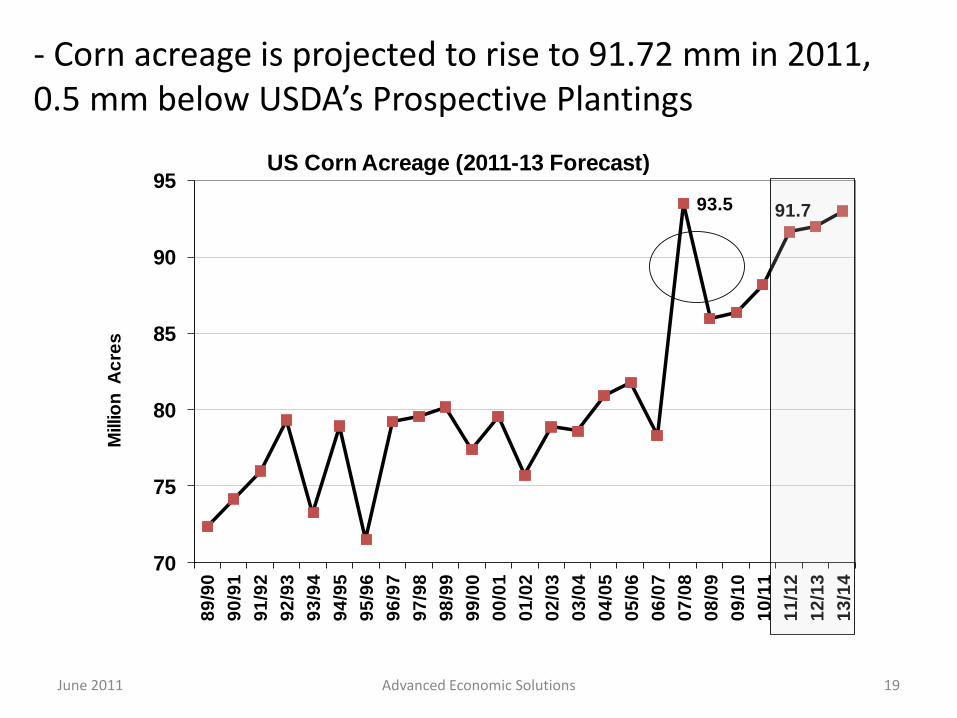
- Corn acreage is projected to rise to 91.72 mm in 2011, 0.5 mm below USDA’s Prospective Plantings
June 2011 Advanced Economic Solutions 19
93.5 91.7
70
75
80
85
90
95
89
/90
90
/91
91
/92
92
/93
93
/94
94
/95
95
/96
96
/97
97
/98
98
/99
99
/00
00
/01
01
/02
02
/03
03
/04
04
/05
05
/06
06
/07
07
/08
08
/09
09
/10
10
/11
11
/12
12
/13
13
/14
Millio
n A
cre
s
US Corn Acreage (2011-13 Forecast)

- CORN Yields: 2010 US corn yields were forecast at 165.0 BPA in August, but finished 7% lower at 152.8 BPA - 2011 yields are projected at 160.0 – actual trend depends upon what years are included in the analysis
Mayl 2011 Advanced Economic Solutions 20
80
90
100
110
120
130
140
150
160
1707
7
79
81
83
85
87
89
91
93
95
97
99
01
03
05
07
09
11
bp
aUS Corn Yields
2011 Projected at 160.0
2011 TREND YIELD OPTIONS:
1977-10 157.8
1982-10 159.6
1987-10 161.8
1992-10 161.5
1997-10 162.0

- 2010/11 corn demand base forecast to reach 13.55 B (+4%) - Growth in demand continues to be led by ethanol - Feed/residual revised up to 5.34 B (+3%) after release of 3/1 stks
June 2011 Advanced Economic Solutions 21
5564 5795 6158 5995 5545 58595187 5142 5340
15871900
1918 21332125
2438
1845 1985 1820
1345 1369
1383 1415 1420
1415
1317 1378 1375
996
11681324 1604 2120
3027
37084560
5015
0
2000
4000
6000
8000
10000
12000
14000
02/03 03/04 04/05 05/06 06/07 07/08 08/09 09/10 10/11
MM
Bu
she
ls
Annual Corn Usage (10/11F)
Ethanol
Food Use
Exports
Feed Use

June 2011 Advanced Economic Solutions 22
50155234
-
1,000
2,000
3,000
4,000
5,000
6,00002 03 04 05 0
6
07
08 09 10 11 12 13
U.S. Corn Used For Ethanol
Ethanol Grind Has risen sharply, but growth will slow going forward

June 2011 Advanced Economic Solutions 23
200
250
300
350
400
450
S O N D J F M A M J J A
MM
Bu
she
ls U
sed
(1 Bushel of Corn Produces Approximately 2.70 Gallons of Ethanol)
Sept-Aug Monthly Ethanol Production - Corn Usage (MM Bus)
07/08
08/09
09/10
10/11
10/11F
Source: Dept of Energy

Where Would The Price of Corn Be without Ethanol?
June 2011 Advanced Economic Solutions 24
1.602.002.402.803.203.604.004.404.805.205.606.006.40
89
/90
91
/92
93
/94
95
/96
97
/98
99
/00
01
/02
03
/04
05
/06
07
/08
09
/10
11
/12
AverageFarm Price
ModelW/OutEthanol
(Adopted from a model developed by Drs. Steve Meyer & Thomas Elam)

June 2011 Advanced Economic Solutions 25
05/06 06/07 07/08 08/09 09/10 10/11 11/12
(Sept-Aug, MM Bus) Proj Proj
Acres Planted (mil.) 72.0 75.5 64.7 75.7 77.5 77.4 76.6
Acres Hvstd. (mil.) 71.3 74.6 64.1 74.7 76.4 76.6 75.6
Yield (bu./acre) 43.0 42.9 41.7 39.7 44.0 43.5 44.0
Production 3063 3197 2677 2967 3359 3329 3327
Carryin 256 449 574 205 138 151 176
Imports 3 10 10 10 10 11 12
TOTAL SUPPLY 3322 3656 3261 3182 3507 3491 3515
Crush 1739 1806 1800 1662 1752 1642 1665
Exports 945 1108 1159 1279 1501 1545 1550
Seed/Stock Adj 189 169 98 103 103 128 100
TOTAL USE 2873 3082 3056 3044 3356 3315 3315
Ending Stocks 449 574 205 138 151 176 200
% of Use 15.6% 18.6% 6.7% 4.5% 4.5% 5.3% 6.0%
US Soybean Supply/Demand
(Million Acres/Bushels)

June 2011 Advanced Economic Solutions 26
24
26
28
30
32
34
36
38
40
42
44
467
6/7
7
78
/79
80/
81
82/
83
84/
85
86/
87
88/
89
90/
91
92
/93
94
/95
96
/97
98
/99
00
/01
02
/03
04
/05
06
/07
08
/09
10
/11
Bu
she
ls P
er
Acr
e
U.S. Soybean Yields

In spite of record crops, soybean stocks remain extremely tight through end of 11/12
June 2011 Advanced Economic Solutions 27
7.1%6.4%
4.5%
8.6%
15.6%
18.6%
6.7%
4.5% 4.5%5.3%
6.0%
2%
4%
6%
8%
10%
12%
14%
16%
18%
20%
01/0
2
02/0
3
03/0
4
04
/05
05
/06
06
/07
07/0
8
08/0
9
09/1
0
10/1
1
11/1
2
SOYBEAN ENDING STOCKS-USE RATIO(10/11 & 11/12 Forecast)

S American Soybean Crops Continue To Be Revised Up
June 2011 Advanced Economic Solutions 28
43.5 52.5 51.0 53.0 57.0 59.0 61.0 57.8
73.0 72.5
30.0
35.5 33.0 39.0
40.5 48.8 46.2
32.0
49.5 53.0
-
20.0
40.0
60.0
80.0
100.0
120.0
140.0
01/02 02/03 03/04 04/05 05/06 06/07 07/08 08/09 09/10 10/11
Brazil and Argentina Soybean Production (10/11F)
Argentina
Brazil

China Imports Have Risen Dramatically - Account for 44 mm Acres of Demand -
June 2011 Advanced Economic Solutions 29
16.9
25.828.3 28.7
37.841.1
50.354.5
58.0
0.0
10.0
20.0
30.0
40.0
50.0
60.0
70.0
03/04 04/05 05/06 06/07 07/08 08/09 09/10 10/11
Chinese Soybean Imports (10/11 & 11/12 Forecast)

Food Inflation is accelerating - Dealing with a $40 B cost bubble….
May 2011 30 Advanced Economic Solutions
Forecast: CPI-Food up 4-6% by December 2011

Long-Term and Short-Term Prospects for Feed Costs
Presented to The Annual Pork Financial Management Conference
June 17, 2011
Bill Lapp, President Advanced Economic Solutions™