long-run effects of democracy on income inequality
TRANSCRIPT
Policy Research Working Paper 7153
Long-Run Effects of Democracy on Income Inequality
Evidence from Repeated Cross-Sections
Carlos Felipe Balcázar
Poverty Global Practice GroupJanuary 2015
WPS7153P
ublic
Dis
clos
ure
Aut
horiz
edP
ublic
Dis
clos
ure
Aut
horiz
edP
ublic
Dis
clos
ure
Aut
horiz
edP
ublic
Dis
clos
ure
Aut
horiz
ed
Produced by the Research Support Team
Abstract
The Policy Research Working Paper Series disseminates the findings of work in progress to encourage the exchange of ideas about development issues. An objective of the series is to get the findings out quickly, even if the presentations are less than fully polished. The papers carry the names of the authors and should be cited accordingly. The findings, interpretations, and conclusions expressed in this paper are entirely those of the authors. They do not necessarily represent the views of the International Bank for Reconstruction and Development/World Bank and its affiliated organizations, or those of the Executive Directors of the World Bank or the governments they represent.
Policy Research Working Paper 7153
This paper is a product of the Poverty Global Practice Group. It is part of a larger effort by the World Bank to provide open access to its research and make a contribution to development policy discussions around the world. Policy Research Working Papers are also posted on the Web at http://econ.worldbank.org. The author may be contacted at [email protected].
This paper assesses the link between democracy and inequality. Inequality is measured at the cohort level with pseudo-panel data built from nine Latin American countries’ household surveys (1995–2009, biannual). Democracy is measured as a stock during long periods of time both before and after each cohort’s year of birth. The paper presents evidence
that long-run historical patterns in the degree of democracy relate to income inequality. However, this relationship is non-monotonic: inequality first increases with the stock of democracy before falling. The paper also presents evidence that education may be a mechanism explaining this result.
Long-Run Effects of Democracy on Income Inequality:
Evidence from Repeated Cross-Sections
Carlos Felipe Balcazar*
Keywords: Inequality, democracy, Latin America, pseudo panel
JEL Classification: C23, D31, N36
* I thank Leopoldo Fergusson, Camilo Garcia-Jimeno, Ana Marıa Ibanez, HugoNopo, Pablo Querubın, Jose Cuesta,
Martha Schmitz, Jaime Ramırez and Javier Rojas for their comments and suggestions.
1. Introduction
This paper assesses the relationship between democracy andincome inequality. It is reasonable
to think that democracies reduce income inequality by allowing citizens to vote for political parties
that privilege redistributive platforms. Thus, societieswith a more egalitarian distribution of polit-
ical power may have lower income inequality. Nonetheless, Asian countries, for example, display
low income inequality and low-rating democratic institutions while Latin America, a region with
higher-rating democratic institutions, displays extremeincome inequality (Savoia et al., 2009).
The lack of a clear relationship between democracy and income inequality has two popular ex-
planations. The first one is the political Kuznets curve. Chong (2004) argues that democratization
first produces an increase in inequality before it produces an improvement in the distribution of
income. However, Palma (2011) states that inequality does not decline after democratization in
countries with historically high levels of inequality. Acemoglu and Robinson (2002) clarify that
there are exceptions to the political Kuznets curve, for example, inequality might fluctuate if coun-
tries switch between less and more democratic regimes (e.g., Latin America). A second explanation
suggests that democracies that begin with high inequality may develop poor economic and political
institutions that perpetuate the unequal distribution of income. Indeed, recent research attributes
high and persistent inequality to the presence of “bad” economic and political institutions, which
are in turn a result of high initial inequality (Savoia et al., 2009).1
Gerring et al. (2005; 2012) argue that that the best way to think about the relationship between
democracy and social outcomes is as a time-dependent, historical phenomenon. Most recent empir-
ical studies assess the link between democracy and inequality using cross-country panel data sets,
traditionally: the Deninger and Squire data base; UNU-WIDER’s World Income Inequality data
base; and the World Bank’s World Development Indicators.2 In general they conceptualize this link
as the effect of regime type on inequality at timet plus some specified period. However, regimes
are historically informed phenomena rather than contemporary variables. Gerring et al. find, for ex-
ample, that a country’s level of democracy in a given year is not likely to affect its level of human
development –but its stock of democracy over a very long-period of time does.
On top of the previous problem “traditional” cross-countrystudies have other considerable prob-
lems: i) Some surveys report data on income and some on expenditure, making cross-country com-
parisons difficult, ii) The degree of accuracy is still a problem; e.g., some surveys undertaken in the
midst of civil wars in sub-Saharan Africa have “national” coverage, but polities were fragmented
1See Acemoglu et al. (2013) for a further discussion on why inequality might not decline under a democratic regime.2For example: Li et al. (1998), Gradstein et al. (2001), Reuveny and Li (2003), Chong (2004), Hamanaka (2008)
and Timmons (2010), to name a few.
2
during those events, iii) None of the data sets provide relevant distributional information given that
they are composed of country-level aggregates, iv) Democracy is endogenous –it might be a result
of many socioeconomic phenomena (omitted variables bias) and may vary between groups within
countries (measurement error), v) Although many studies resort to instrumental variables to solve
the problem of endogeneity, the variables related to the quality of democratic institutions relate to
either a prior or subsequent redistribution of income, violating the exclusion restriction.3
I assess the link between democracy and inequality using pseudo-panel data built from nine har-
monized Latin American countries’ household surveys (1995-2009, biannual), conceiving within-
cohort inequality as a function of the accumulated level of democracy (or its stock) around the
cohort’s year of birth. My approach has some advantages overcross-country studies, in that: i) I
explore a relatively homogenous region, ii) surveys reportthe same sources of income, making
surveys comparable between countries and over time, iii) I do not rely upon country-level measures
of income inequality but upon cohort-level inequality (somewhat accounting for heterogeneity be-
tween groups within countries), iv) I measure democracy over long periods of time –I explore the
accumulated effect of historical legacies on the contemporary level of inequality.
The biggest empirical challenge to overcome in this study isendogeneity in the proxy for
democracy. To address endogeneity I include a set of fixed-effects that capture cohort specific
time-invariant characteristics, gender differences, long-run and short-run country-level economic
differences, and changes in survey lifting. Therefore, my identification strategy, although it does
not completely solves the problem of endogeneity, attenuates it.
To reassure the reader about the validity of my results, I test whether my results survive statistical
scrutiny. I check if my results hold after controlling for periods of wars and economic crises since
both can lead to regime transitions and affect socioeconomic outcomes (Bethell, 1997; Piketty and
Saez, 2003; Hagopian and Mainwaring, 2005; UNESCO, 2010; Fernandez and Lopez-Calva, 2010;
Torche, 2010; Acemoglu et al., 2013).
A number of messages emerge from this paper. First, cohorts that “experienced” long periods of
quality democratic institutions have lower inequality. I find that 20 years of high quality democratic
institutions could reduce the dispersion in labor income (on average) by around 25%. Second, I find
suggestive evidence that this relationship is non-monotonic: The level of inequality increases with
the democracy stock and then starts decreasing with long periods of quality democratic institutions.
Third, cohorts that “experienced” long periods of quality democratic institutions show lower dis-
persion in educational attainment. I find that 20 years of high quality democratic institutions could
3See Atkinson and Brandolini (1999), Timmons (2010), Palma (2011), Niemeyer et al. (2008), Wejnert (2005),Savoia et al. (2009), Bardhan (2005), Nikoloski (2009, 2010), Engermann and Sokoloff (1997, 2000) and Acemoglu etal. (2013) for further discussion.
3
reduce the dispersion in the years of education (on average)by around 15%. This relationship also
appears to be non-monotonic. These results give credence tothe hypothesis that education maps
democracy onto long-run changes in the distribution of human capital and then onto contemporary
changes in income inequality.
The rest of the paper proceeds as follows. The next section briefly presents a review of four
mechanisms that link democracy and inequality, their limitations, and presents an alternative ap-
proach. Section three describes the data. Section four describes the econometric approach and ad-
dresses the methodological challenges. Section five presents the main results and shows suggestive
evidence that education may be one mechanism explaining thee link between democracy and in-
equality. The last section concludes.
2. Do democracies breed more egalitarian societies?
Meltzer and Richard (1981), Alesina and Rodrik (1994), and Persson and Tabellini (1994) pro-
pose that utility-maximizing individuals redistribute based on rational choices; if the median in-
come lies below the mean income, the median voter chooses redistribution and higher taxation
for rich people. This model predicts that democracies have lower levels of inequality than non-
democracies (Acemoglu and Robinson, 1998).
A second mechanism alleges that democracy lowers the costs of political participation of orga-
nized labor, allowing labor unions to obtain a privileged position in the policy process (Schumpeter,
1942; Rodrik, 1999). As a result, democracy encourages unionization, centralized wage bargaining,
and minimum wages, which reduce wage dispersion (Katz and Autor, 1999; Rodrik, 1999).
Democracies should also guarantee broad access to propertyrights. With well-defined property
rights and broad access to them, the poor have the possibility to gain access over improved or
produced assets by facilitating the development of efficient market-based economies and opening
up markets and institutions, which also prevent the elite from erecting entry barriers and enjoying
markets with monopoly power (Gerring et al., 2005; Acemoglu, 2008).
A fourth mechanism suggests that democracy increases competition among politicians for citi-
zen support. This causes governments to invest more in public services, such as education (Saint-
Paul and Verdier, 1993). Education, in turn, acts as a redistribution channel reducing the dispersion
of human capital and increasing a generation’s human capital relative to the previous generation.
I find these four mechanisms the most relevant.4 However, recent empirical findings reveal
4See Thorbecke and Charumilind (2002) and Savoia et al. (2009) for further discussion.
4
caveats in most of these mechanisms. In a well regarded paper, Milanovic (2000), using micro-
level data from the Luxembourg Income Studies, finds weak evidence for redistribution through
the median voter channel. Indeed, he finds that the middle classes are not net beneficiaries from
redistributive transfers. Timmons (2010), using the University of Texas Inequality Project and the
United Nations Industrial Development Organization (UTIP-UNIDO) data set, finds no evidence
for the existence of the second channel. He shows that although democracies may pay higher av-
erage wages in manufacturing, democracy does not dampen wage dispersion between industries.
Amendola et al. (2013), using the UNU-WIDER Income Inequality data set, find evidence that
democracy is not a sufficient condition to reduce income inequality in the presence of strong proper-
ty rights. They find that in presence of weak democratic institutions, strong property rights actually
lead to an increase in the level of inequality.
Education presents an interesting alternative. The historical record offers many cases where the
birth of democracies opened up new possibilities for the scaling up of public education (Sachs,
2012). Engerman et al., (2000), Baum and Lake (2001), Lindert (2004) and Glaeser et al. (2004)
suggest that democracy increases the education output, mapping democracy onto long-run changes
in the distribution of human capital and then onto contemporary changes in income inequality.
However, if the quality of education is low for the poor or thesocial payoff from education di-
minishes as a consequence of deeply ingrained patterns of social exclusion and discrimination,
educational attainment may not reduce inequality (Perry etal., 2003).
A considerable issue that democracy faces to achieve redistribution is inequality itself: If democ-
racies display high initial levels of inequality, it is difficult for the poor to hold the rich and powerful
accountable. Such a state of affairs affects the social norms about the legitimacy of rules and in-
stitutions. On the one hand, the wealthy minority may be inclined and able to establish a legal
framework to ensure themselves a disproportionate share ofpolitical power, and use it to establish
rules, laws, and government policies to give themselves broader access to economic opportunities.
On the other hand, citizens may feel discouraged to press forredistributive changes that may not
ultimately benefit them. Hence, property rights, legal systems, and fiscal and economic institutions
may perpetuate the unequal distribution of income. (Engerman and Sokoloff, 2000; You and Ka-
gram, 2004; Savoia et al., 2009; Acemoglu and Dell, 2010.) Itis important that democracy works
as a commitment device that prevents ruling minorities fromerecting barriers to the excluded.
2.1. Conceptualizing democracy over long periods of time
Works on democracy and inequality have usually focused on the possible causal effect of a coun-
try’s contemporary level of democracy on its subsequent level of inequality. However, institutional
5
effects unfold over time, sometimes a great deal of time, andare cumulative. It is the long-term
effect of these historical legacies the central concern if we wish to comprehend the causal effect of
democracy on social outcomes. (Gerring et al., 2005; 2012.)
It is reasonable to think that children that enjoyed higher quality democratic institutions during
their childhood enjoyed a more appropriate environment forindividual development. For exam-
ple, Kudmatsu (2011) provides suggestive evidence that democratization was associated with an
increase in the use of some health inputs on children in Sub-Sharan Africa. Also, higher quality
democratic institutions might benefit children and teenagers during the school years if we con-
sider that more democratic countries are more likely to spend more in school education (Brown
and Hunter, 2004; Ansell, 2008; Huber and Stephens, 2012; Harding and Stasavage, 2014). Maybe
democratic transitions are also important when entering the labor markets. On the one hand, work-
ers might enjoy more bargaining power as a result of the political power of unions (Rodrik, 1999).
On the other hand, workers might have access to job opportunities that were only available to the
elite. It is also likely that the benefits from democracy haveintergenerational impacts, as in the case
of education (Saint-Paul and Verdier, 1993). In other words, democracy is likely to have long-run
and cumulative impacts on social outcomes (Baum and Lake, 2003; Gerring et al. 2012).
3. Data
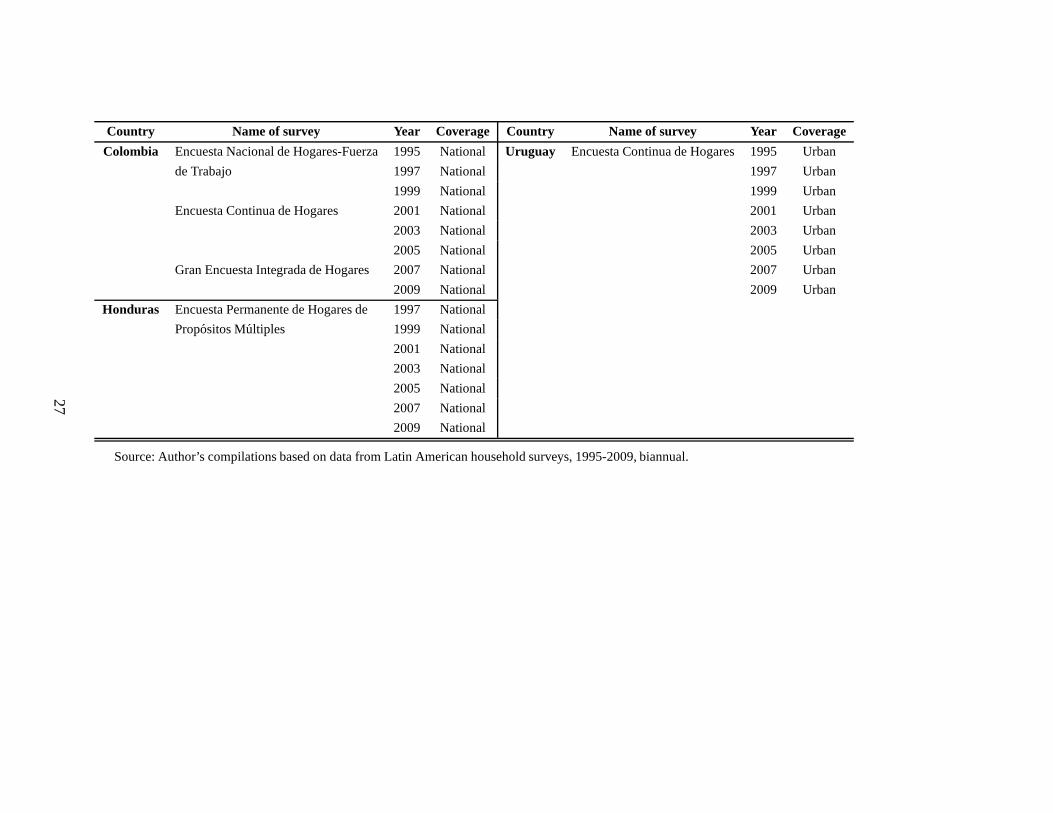
The data come from several harmonized household surveys of nine Latin American countries:
Argentina, Brazil, Bolivia, Colombia, Honduras, Peru, Panama, Paraguay and Uruguay. To max-
imize the number of countries and periods I use surveys between 1995 and 2009, biannual, and
restrict myself to urban areas in Bolivia due to the lack of rural data for the 1995 and 2009 surveys.
Peru and Honduras surveys for 1995 are not harmonizable, butthe countries represent sources of
variation too important to exclude them; therefore, my pseudo-panel is unbalanced. Table A1, in
the appendix, reports the data sources.
I restrict myself to individuals born between 1936 and 1977.However, I drop individuals be-
tween 18 and 24 years of age in 1995 and between 21 and 24 years of age in 1997 to consider that
by 2009 life expectancy in the region was about 74 years –to keep a representative sample of “old”
individuals- and that a person’s educational attainment islikely to remain unchanged after age 25
–to avoid truncation in the distribution of educational attainment.
The source of income for every observation is monthly monetary labor income (constant prices
of 2005, US$, adjusted by purchasing power parity), which isthe sum of earnings from wages,
tips (as applicable), over-time payments, commissions andbonuses. I drop monthly monetary labor
6
income outliers.5 The previous procedure comprises 2% of the sample with positive labor income.6
I measure educational attainment as the number of years of education attained in the year previ-
ous to the survey. Missing values for the variable of educational attainment comprise an additional
3% of the sample.
The pseudo panel
When using repeated cross-sections ordinary least squaresestimators are likely to be biased,
however we can use cohort aggregates to obtain consistent estimators (Deaton, 1985). In other
words, we can use a pseudo-panel. A pseudo-panel consists ofcohorts (synthetic individuals) that
we are able to follow over time. However, to obtain consistent estimators from a pseudo-panel,
grouping variables –those that aggregate individuals intocohorts- must i) not have missing val-
ues for any individual in the sample, ii) not vary over time, and iii) be exogenous and relevant
(Verbeek, 2008). It is also important that the number of cohorts is large enough to avoid small sam-
ple size problems, that cohort-sizes are large enough to avoid measurement error problems, and
that cohorts somehow minimize within-cohort heterogeneity and maximize heterogeneity between
cohorts (Verbeek and Nijman, 1993; McKenzie, 2000).
I use gender, country and birth year in three-year spans as grouping variables –which should
be exogenous and relevant (Verbeek, 2008). I group individuals in three-year-span birth-cohorts
to reduce within cohort heterogeneity and obtain high heterogeneity between cohorts. This also
provides me a relatively large number of cohorts to mitigatesample size problems and cohorts that,
due to their large sizes, should not present considerable measurement error problems. Table A2, in
the Appendix, shows the distribution of individuals and of cohorts.
Income inequality estimates consist of Gini indices at the cohort level using survey weights.
However, one potential problem of using labor income to compute inequality is that of self-selection
into the labor markets, which leads to self-selection bias.However, if grouping variables are exoge-
nous and relevant, they should act as instruments for self-selection into the labor markets (Moffitt,
1983; Moscarini and Vella, 2003). Therefore self-selection is not a concern. I proxy educational
attainment as the average number of years of education attained and its dispersion as the standard
deviation of the number of years of education attained.
5I detect outliers using the blocked adaptive computationally efficient outlier nominators algorithm (Billor et al.,2000), using the first percentile of the chi-squared distribution as a threshold to separate outliers from non-outliers.
6The sample with positive labor income comprises 59% of the individuals born between 1936 and 1977.
7
Measuring democracy
I measure democracy asstockrather than a level variable. This implies conceptualizingdemoc-
racy as an asset. It implies that democracy is a fungible resource that may accumulate over time,
promising increased returns in the future. Along these lines, if a democratic regime endures it is
likely to yield some return, for example: market-augmenting economic policies, political stability
(understood as a reduction of uncertainty), rule of law, andefficient public bureaucracies (Gerring
et al., 2005). But, why should we expect better results from along-term democracy?
All polities are subject to the “liability of newness” (Stinchcombe, 1965). New polities face a
constellation of problems associated with their newly founded status which renders them particu-
larly prone to failure.
In democratic regimes the policy-making process, by definition, involves a considerable num-
ber of players. Policy-making is a continual back and forth between different interest groups (e.g.,
legislators, citizens, political and economic organizations, etc.). Each of these players must learn
to anticipate the goals, interests, and special sensitivities of the other players. Hence, the process
of defining a “good policy” is likely to take considerable time; “lessons” arise only after many
miscues. Not only must governing politicians learn what constitutes good policy; voters must also
learn to recognize good policy. Only as democratic experience accumulates, we can expect a tran-
sition away from a populist style of politics and policy-making to the institutionalization of “good”
policies. (Gerring et al., 2005.) Off course, there can be reversals.
In authoritarian regimes, in contrast, this process is generally monopolized by a small number
of elite actors and has few mechanisms of accountability. Naturally, the longer these elites are in
power, the greater their opportunities for gaining experience in the diverse tasks of governance.
But, since the political environment is highly constrained, the development of legal-bureaucratic
authority is virtually impossible. Therefore, it is less likely that “good” policies institutionalize.
(Gerring et al., 2005.)
To measure democracy I employ the Polity2 democracy index, which I draw from the Polity
IV data set. This variable measures the extent to which “authority patterns are institutionalized”
in a given country. It takes into account how the executive isselected, the degree of checks on
executive power, and the form of political competition (Marshall et al., 2010). This indicator is
highly sensitive, it employs a twenty-one-point scale (-10to 10) from more autocratic to more
democratic, and offers good historical coverage (1800-2013).
To create a stock measurement of democracy I first add up each person’s Polity2 score from
1905 to one year before their year of birth and also up to when they are 20 years of age. I also
8
consider the stock of democracy between 30 years before their year of birth and 20 years after, and
between their year of birth and 20 years after, as benchmarks. I assume that the stock of democracy
depreciates at a rate ofr per year, withr ∈ [0,1]. This captures the possibility that democratic stock
does not accumulate linearly over time. Now, given that for every individual born in any given year
(t) belonging to any given country (p) the value of the stock would be the same, I compute the
simple average of the proxy for the three birth years that compose the cohort to obtain the cohort
average.
To estimater it is precise to specify how a particular historical path in country p up to yeart
maps into a value of the stock of democracySp,t. The simplest way to do this might be to assume
that democratic capital accumulates and is discounted geometrically at the rate (1− r):
Sp,t = Dp,t +(1− r)×Sp,t−1,
whereDp,t denotes the value of Polity2 for the yeart and countryp.
We can solve backwards to obtain
S(r)p,t =t
∑s=t0
Dp,s(1− r)t−s,
where t0 = 1905. Thus, democratic experience is more valuable the closer to the present it is.
Person and Tabellini (2009) find thatr lies between 0.01 and 0.06; that is, the stock of democracy
depreciates at a rate between 1% and 6%. I use the lower value of the depreciation rate for my
main exercises, although for values greater than 1% my conclusions do not change.
Summarizing, my main variables of interest are the depreciated democracy stock of countyp in
the birth-yeart, averaged for cohortc, defined by:
Dc,p =13 ∑
t∈c
(
t−1
∑s=1905
0,99t−sDp,s
)
, (a)
Dc,p =13 ∑
t∈c
(
t+20
∑s=1905
0,99t−sDp,s
)
, (b)
Dc,p =13 ∑
t∈c
(
t+20
∑s=t−30
0,99t−sDp,s
)
, (c)
Dc,p =13 ∑
t∈c
(
t+20
∑s=t
0,99t−sDp,s
)
. (d)
Figure 1, panel a, illustrates that younger cohorts have “experienced” a higher stock of democ-
9
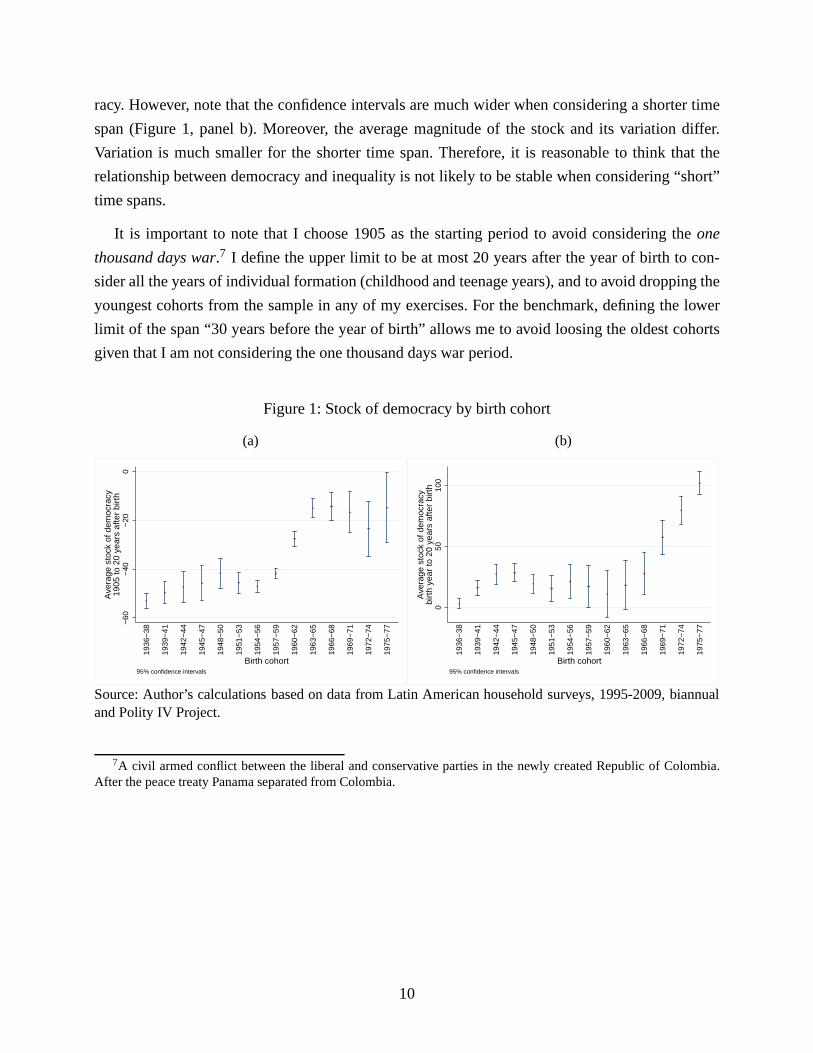
racy. However, note that the confidence intervals are much wider when considering a shorter time
span (Figure 1, panel b). Moreover, the average magnitude ofthe stock and its variation differ.
Variation is much smaller for the shorter time span. Therefore, it is reasonable to think that the
relationship between democracy and inequality is not likely to be stable when considering “short”
time spans.
It is important to note that I choose 1905 as the starting period to avoid considering theone
thousand days war.7 I define the upper limit to be at most 20 years after the year of birth to con-
sider all the years of individual formation (childhood and teenage years), and to avoid dropping the
youngest cohorts from the sample in any of my exercises. For the benchmark, defining the lower
limit of the span “30 years before the year of birth” allows meto avoid loosing the oldest cohorts
given that I am not considering the one thousand days war period.
Figure 1: Stock of democracy by birth cohort
(a)
−60
−40
−20
0
Ave
rage
sto
ck o
f dem
ocra
cy19
05 to
20
year
s af
ter
birt
h
1936
−38
1939
−41
1942
−44
1945
−47
1948
−50
1951
−53
1954
−56
1957
−59
1960
−62
1963
−65
1966
−68
1969
−71
1972
−74
1975
−77
Birth cohort95% confidence intervals
(b)0
5010
0
Ave
rage
sto
ck o
f dem
ocra
cybi
rth
year
to 2
0 ye
ars
afte
r bi
rth
1936
−38
1939
−41
1942
−44
1945
−47
1948
−50
1951
−53
1954
−56
1957
−59
1960
−62
1963
−65
1966
−68
1969
−71
1972
−74
1975
−77
Birth cohort95% confidence intervals
Source: Author’s calculations based on data from Latin American household surveys, 1995-2009, biannualand Polity IV Project.
7A civil armed conflict between the liberal and conservative parties in the newly created Republic of Colombia.After the peace treaty Panama separated from Colombia.
10
4. Approach
Given the panel settings of my data (panel of successive cross-sections), we can model the
relationship between democracy and inequality as follows:
Yc,g,p,e = α +βDc,p+ρc,g,p,e+ εc,g,p,e, (1)
whereYc,g,p,e denotes the Gini index of birth-cohortc, of genderg, of countryp and surveye; D is a
proxy on the accumulated quality of democratic institutions;ρ corresponds to cohort fixed effects.
ε denotes the idiosyncratic error. This equation, however, is misspecified.
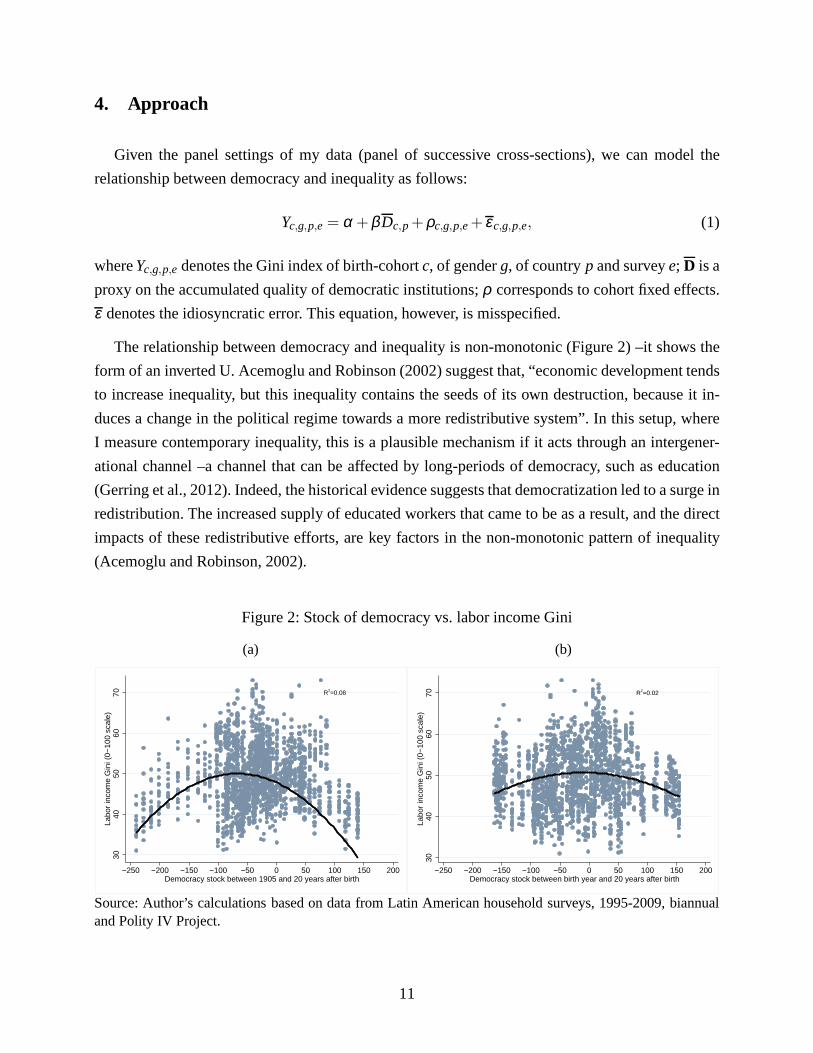
The relationship between democracy and inequality is non-monotonic (Figure 2) –it shows the
form of an inverted U. Acemoglu and Robinson (2002) suggest that, “economic development tends
to increase inequality, but this inequality contains the seeds of its own destruction, because it in-
duces a change in the political regime towards a more redistributive system”. In this setup, where
I measure contemporary inequality, this is a plausible mechanism if it acts through an intergener-
ational channel –a channel that can be affected by long-periods of democracy, such as education
(Gerring et al., 2012). Indeed, the historical evidence suggests that democratization led to a surge in
redistribution. The increased supply of educated workers that came to be as a result, and the direct
impacts of these redistributive efforts, are key factors inthe non-monotonic pattern of inequality
(Acemoglu and Robinson, 2002).
Figure 2: Stock of democracy vs. labor income Gini
(a)
R2=0.08
3040
5060
70La
bor
inco
me
Gin
i (0−
100
scal
e)
−250 −200 −150 −100 −50 0 50 100 150 200Democracy stock between 1905 and 20 years after birth
(b)
R2=0.02
3040
5060
70La
bor
inco
me
Gin
i (0−
100
scal
e)
−250 −200 −150 −100 −50 0 50 100 150 200Democracy stock between birth year and 20 years after birth
Source: Author’s calculations based on data from Latin American household surveys, 1995-2009, biannualand Polity IV Project.
11
D is endogenous. Indeed, some researchers attribute the persistently high level of inequality
in Latin America to the long lasting effects of colonial institutions. The encomienda (which gave
Spanish conquistadors the right to Amerindian labor), the mita (a system of forced labor used in the
mines), the repartimiento (the forced sale of goods to Indians, typically at highly inflated prices),
the resguardo (which organized the Amerindian labor to be provided in theHaciendasand mines)
and slavery, established important sources of economic andpolitical inequality that endured after
the region gained independence from their colonial mastersand despite significant social, economic
and political changes during the 20th century (Perry et al.,2003). This would likely lead to omitted
variable bias,E(Dc,p,εc,g,p,e) 6= 0.
To address the potential misspecification problems I rewrite Equation (1) as follows:
Yc,g,p,ewc,g,p,e= [α +βDc,p+δD2c,p+ρc,g,p,e+ηg+φp+ϕe+ψp,e+ εc,g,p,e]wc,g,p,e, (2)
whereη, φ , ϕ andψ denote fixed effects by gender, country, survey, and an interaction between
survey and country fixed effects respectively. The gender fixed effects capture the differences in
socioeconomic conditions between men and women, for example gender roles and other gender
differences which are prevalent in the region (Nopo, 2012). The country fixed effects, survey fixed
effects, and their interaction allow to control for long-run and short-run country-level economic
changes, such as GDP growth, social public spending, inflation, etc., changes in survey lifting,
and other possible effects of long-lasting legacies. In other words, this set of fixed effects should
attenuate endogeneity by eliminating unobserved country,survey, gender, country level trends and
cohort specific unobservables. Also, note that I multiply both sides of the equation bywc,g,p,e,
which is equal to√
Nc,g,p,e, with N the cohort size. The reason for this is to correct for underlying
heteroscedasticity due to variation between periods in cohort sizes. Finally,D2c,p captures the non-
monotonic relationship between democracy and inequality.
Given that I have a number of time invariant variables I use ordinary least squares (OLS) to
estimate my main regression. On this regard, if grouping variables are exogenous and relevant and
cohort sizes are large enough (as they indeed are) I can estimate Equation (1) using OLS (Moffitt,
1983; Verbeek and Vella, 2005).8
8Girma (2000) and Collado (1997) provide other methods to estimate pseudo-panel models that are useful in thepresence of time-invariant variables. However, these do not offer any gain in terms of consistency, and provide lessefficient estimators (Verbeek and Vella, 2005). Thus, I do not consider these approaches.
12
5. Results
Table 1 shows the estimates of democracy on inequality for several specifications of the pseudo-
panel model. Each duplet of columns corresponds to computing Equation (2) using equations (a),
(b), (c) and (d) respectively to measure the stock of democracy. The first column of each duplet
shows the results obtained after estimating Equation (2) not including gender, country, survey and
survey-country fixed effects; the second column adds the complete set of fixed effects. In general,
columns (1), (3), (5) and (7) suggest that democracy is negatively related to inequality, and that
this relationship is non monotonic (δ < 0 and statistically significant). Nonetheless, by controlling
for the set of fixed effects I obtain a lower value forβ for (2) and (4); for columns (6) and (8)
the value ofβ is larger, and in column (8), it is actually positive. On the one hand, these results
provide evidence that benchmark specifications do not provide stable results (as expected). On
the other hand, focusing on columns (1) to (4), we have a senseof the direction of the bias due to
non-observable covariates:β is likely to be biased upwards –it is likely that the region’sdemocratic
institutions are failing as a commitment device that prevents ruling minorities from erecting barriers
to the excluded (Perry et al., 2003), and as a result the effect of democracy on inequality is under-
13
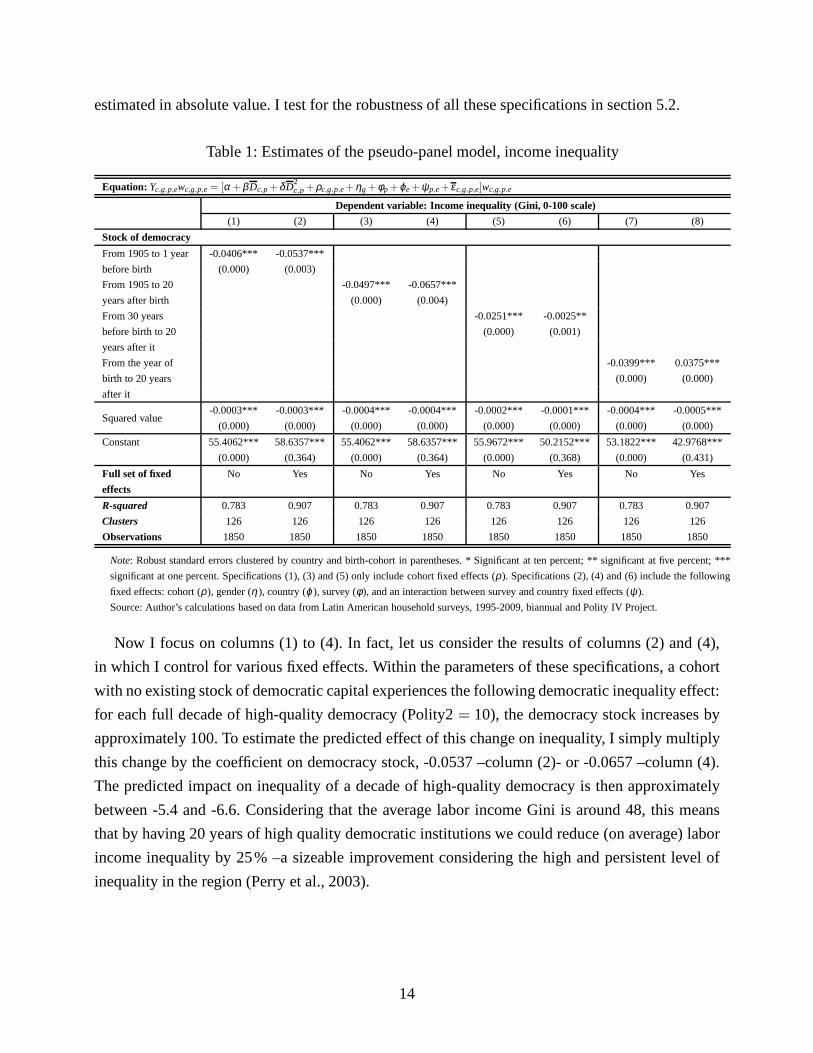
estimated in absolute value. I test for the robustness of allthese specifications in section 5.2.
Table 1: Estimates of the pseudo-panel model, income inequality
Equation: Yc,g,p,ewc,g,p,e = [α +βDc,p+δD2c,p+ρc,g,p,e+ηg+φp+ϕe+ψp,e+ εc,g,p,e]wc,g,p,e
Dependent variable: Income inequality (Gini, 0-100 scale)
(1) (2) (3) (4) (5) (6) (7) (8)
Stock of democracy
From 1905 to 1 year
before birth
-0.0406*** -0.0537***
(0.000) (0.003)
From 1905 to 20
years after birth
-0.0497*** -0.0657***
(0.000) (0.004)
From 30 years
before birth to 20
years after it
-0.0251*** -0.0025**
(0.000) (0.001)
From the year of
birth to 20 years
after it
-0.0399*** 0.0375***
(0.000) (0.000)
Squared value-0.0003*** -0.0003*** -0.0004*** -0.0004*** -0.0002*** -0.0001*** -0.0004*** -0.0005***
(0.000) (0.000) (0.000) (0.000) (0.000) (0.000) (0.000) (0.000)
Constant 55.4062*** 58.6357*** 55.4062*** 58.6357*** 55.9672*** 50.2152*** 53.1822*** 42.9768***
(0.000) (0.364) (0.000) (0.364) (0.000) (0.368) (0.000) (0.431)
Full set of fixed
effects
No Yes No Yes No Yes No Yes
R-squared 0.783 0.907 0.783 0.907 0.783 0.907 0.783 0.907
Clusters 126 126 126 126 126 126 126 126
Observations 1850 1850 1850 1850 1850 1850 1850 1850
Note: Robust standard errors clustered by country and birth-cohort in parentheses. * Significant at ten percent; ** significant at five percent; ***
significant at one percent. Specifications (1), (3) and (5) only include cohort fixed effects (ρ). Specifications (2), (4) and (6) include the following
fixed effects: cohort (ρ), gender (η), country (ϕ), survey (φ ), and an interaction between survey and country fixed effects (ψ).
Source: Author’s calculations based on data from Latin American household surveys, 1995-2009, biannual and Polity IV Project.
Now I focus on columns (1) to (4). In fact, let us consider the results of columns (2) and (4),
in which I control for various fixed effects. Within the parameters of these specifications, a cohort
with no existing stock of democratic capital experiences the following democratic inequality effect:
for each full decade of high-quality democracy (Polity2= 10), the democracy stock increases by
approximately 100. To estimate the predicted effect of thischange on inequality, I simply multiply
this change by the coefficient on democracy stock, -0.0537 –column (2)- or -0.0657 –column (4).
The predicted impact on inequality of a decade of high-quality democracy is then approximately
between -5.4 and -6.6. Considering that the average labor income Gini is around 48, this means
that by having 20 years of high quality democratic institutions we could reduce (on average) labor
income inequality by 25% –a sizeable improvement considering the high and persistent level of
inequality in the region (Perry et al., 2003).
14
5.1. The role of education
It is plausible to regard democracy as an important institutional factor in the development of
education. Political elites in a democracy have electoral incentives to improve the quality of life for
the least advantaged; these incentives are present to a muchsmaller degree in authoritarian systems.
Indeed, studies have shown that democratic rule translatesinto improvements in education (Baum
and Lake, 2003; Brown and Hunter, 2004; Ansell, 2008; Huber and Stephens, 2012; Harding and
Stasavage, 2014).
Because of the long-lived nature of human capital, the longer a democracy is in place, the more
pronounced we can expect its impact on human capital to be (Gerring et al., 2012). Democracy
might change the education output, mapping democracy onto long-run changes in the distribution
of human capital and then onto contemporary changes in income inequality. Education, therefore,
might be a suitable mechanism to explain the link between democracy and income inequality. This
is indeed plausible, the level and the dispersion of educational attainment and income inequality
are highly correlated (Figure 3).
The pseudo-panel models for the level and dispersion of educational attainment follow that of
Equation 2. Although for these equationsD is also endogenous,9 the set of fixed effects should
deal with endogeneity. It is also important to note the number of years of education has serial
correlation. Although I restrict myself to individuals ages 24 years and older to avoid truncation in
the distribution of educational attainment, individuals might still attain more education with time
(e.g., graduate studies). Therefore, I also introduce a lagof the dependent variable as a regressor to
control for serial correlation when analyzing the level of educational attainment.10
9Governments in Latin America, particularly democratic governments, conducted substantial efforts to expandprimary education during the 20th century, the elite was able to procure schooling services for their own childrenand resist subsidize services for others (Bethell, 1997; Perry et al., 2003; Schiefelbein, 2007). Indeed, governmentsdidnot provide adequate access to education to most people until the second half of the 20th century. Furthermore, thedifferences in the quality of education between the wealthyand the poor of the population prevailed. This would likelylead to omitted variables bias.
10Verbeek and Vella (2005) show that if grouping variables areexogenous and relevant and cohorts sizes are largeenough, it is possible to obtain and appropriate measure ofYc,g,p,e−1, equivalent to the lagged value ofYc,g,p,e.
15
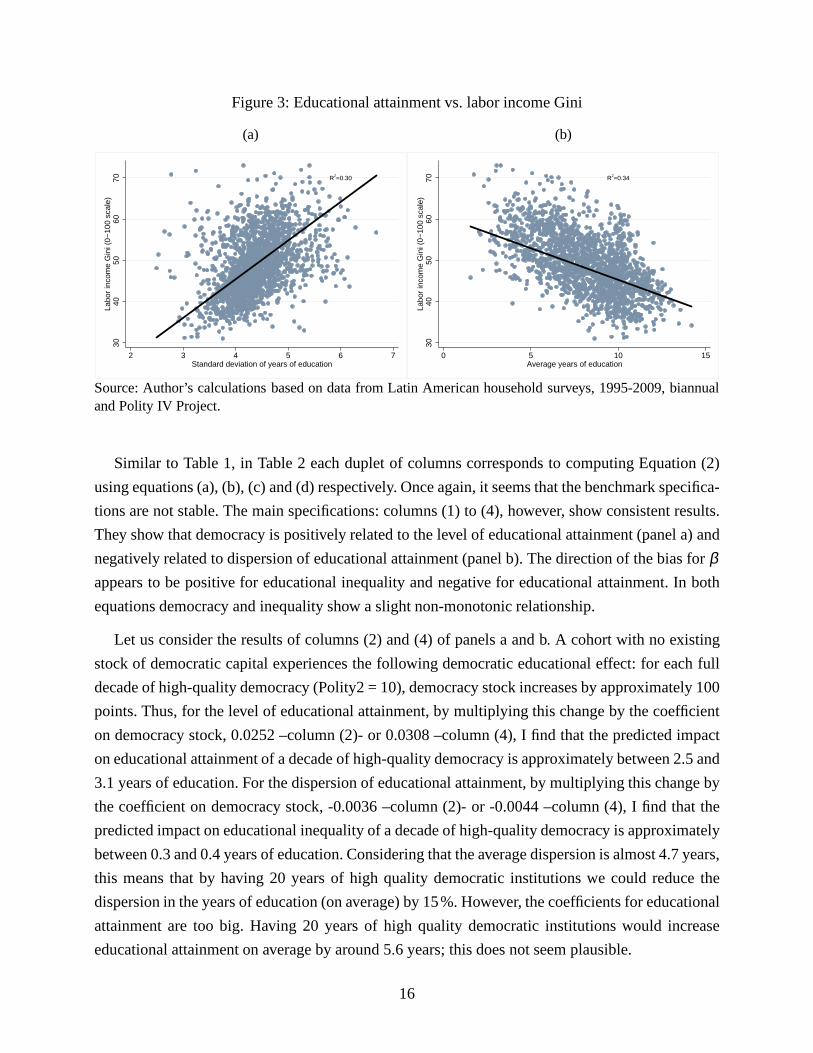
Figure 3: Educational attainment vs. labor income Gini
(a)
R2=0.30
3040
5060
70La
bor
inco
me
Gin
i (0−
100
scal
e)
2 3 4 5 6 7Standard deviation of years of education
(b)
R2=0.34
3040
5060
70La
bor
inco
me
Gin
i (0−
100
scal
e)
0 5 10 15Average years of education
Source: Author’s calculations based on data from Latin American household surveys, 1995-2009, biannualand Polity IV Project.
Similar to Table 1, in Table 2 each duplet of columns corresponds to computing Equation (2)
using equations (a), (b), (c) and (d) respectively. Once again, it seems that the benchmark specifica-
tions are not stable. The main specifications: columns (1) to(4), however, show consistent results.
They show that democracy is positively related to the level of educational attainment (panel a) and
negatively related to dispersion of educational attainment (panel b). The direction of the bias forβappears to be positive for educational inequality and negative for educational attainment. In both
equations democracy and inequality show a slight non-monotonic relationship.
Let us consider the results of columns (2) and (4) of panels a and b. A cohort with no existing
stock of democratic capital experiences the following democratic educational effect: for each full
decade of high-quality democracy (Polity2 = 10), democracystock increases by approximately 100
points. Thus, for the level of educational attainment, by multiplying this change by the coefficient
on democracy stock, 0.0252 –column (2)- or 0.0308 –column (4), I find that the predicted impact
on educational attainment of a decade of high-quality democracy is approximately between 2.5 and
3.1 years of education. For the dispersion of educational attainment, by multiplying this change by
the coefficient on democracy stock, -0.0036 –column (2)- or -0.0044 –column (4), I find that the
predicted impact on educational inequality of a decade of high-quality democracy is approximately
between 0.3 and 0.4 years of education. Considering that theaverage dispersion is almost 4.7 years,
this means that by having 20 years of high quality democraticinstitutions we could reduce the
dispersion in the years of education (on average) by 15%. However, the coefficients for educational
attainment are too big. Having 20 years of high quality democratic institutions would increase
educational attainment on average by around 5.6 years; thisdoes not seem plausible.
16
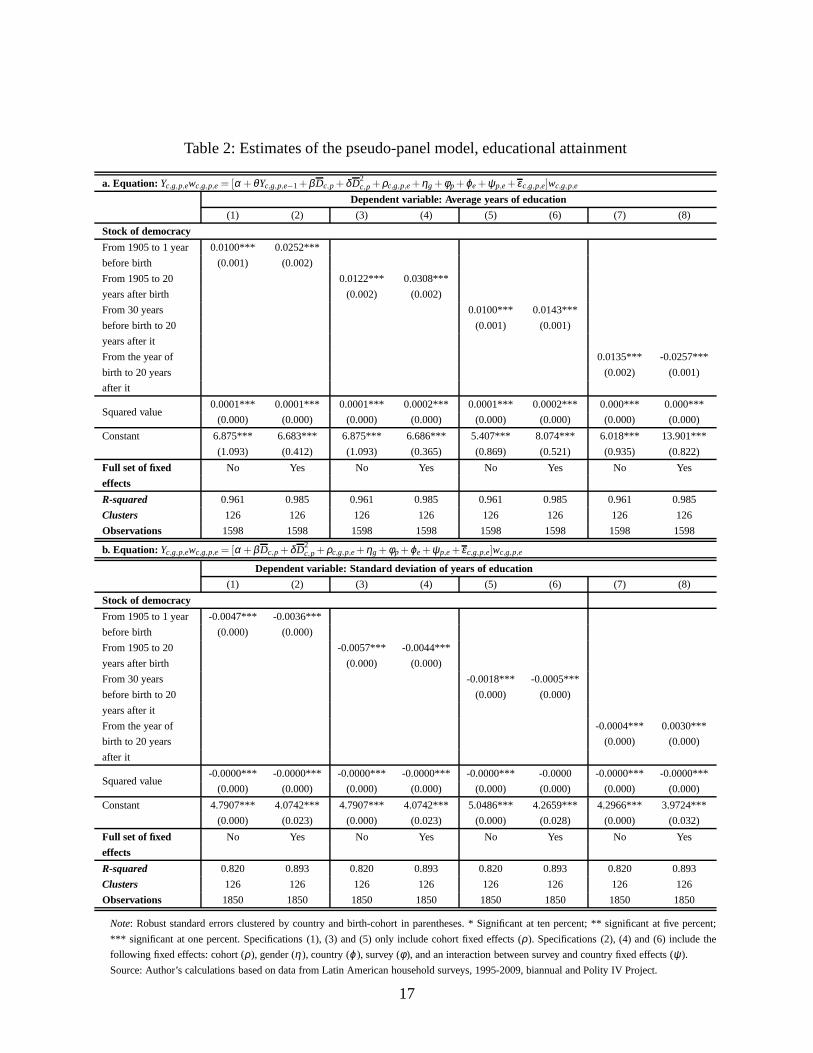
Table 2: Estimates of the pseudo-panel model, educational attainment
a. Equation: Yc,g,p,ewc,g,p,e = [α +θYc,g,p,e−1+βDc,p+δD2c,p+ρc,g,p,e+ηg+φp+ϕe+ψp,e+ εc,g,p,e]wc,g,p,e
Dependent variable: Average years of education
(1) (2) (3) (4) (5) (6) (7) (8)
Stock of democracy
From 1905 to 1 year
before birth
0.0100*** 0.0252***
(0.001) (0.002)
From 1905 to 20
years after birth
0.0122*** 0.0308***
(0.002) (0.002)
From 30 years
before birth to 20
years after it
0.0100*** 0.0143***
(0.001) (0.001)
From the year of
birth to 20 years
after it
0.0135*** -0.0257***
(0.002) (0.001)
Squared value0.0001*** 0.0001*** 0.0001*** 0.0002*** 0.0001*** 0.0002*** 0.000*** 0.000***
(0.000) (0.000) (0.000) (0.000) (0.000) (0.000) (0.000) (0.000)
Constant 6.875*** 6.683*** 6.875*** 6.686*** 5.407*** 8.074*** 6.018*** 13.901***
(1.093) (0.412) (1.093) (0.365) (0.869) (0.521) (0.935) (0.822)
Full set of fixed
effects
No Yes No Yes No Yes No Yes
R-squared 0.961 0.985 0.961 0.985 0.961 0.985 0.961 0.985
Clusters 126 126 126 126 126 126 126 126
Observations 1598 1598 1598 1598 1598 1598 1598 1598
b. Equation: Yc,g,p,ewc,g,p,e = [α +βDc,p+δD2c,p+ρc,g,p,e+ηg+φp+ϕe+ψp,e+ εc,g,p,e]wc,g,p,e
Dependent variable: Standard deviation of years of education
(1) (2) (3) (4) (5) (6) (7) (8)
Stock of democracy
From 1905 to 1 year
before birth
-0.0047*** -0.0036***
(0.000) (0.000)
From 1905 to 20
years after birth
-0.0057*** -0.0044***
(0.000) (0.000)
From 30 years
before birth to 20
years after it
-0.0018*** -0.0005***
(0.000) (0.000)
From the year of
birth to 20 years
after it
-0.0004*** 0.0030***
(0.000) (0.000)
Squared value-0.0000*** -0.0000*** -0.0000*** -0.0000*** -0.0000*** -0.0000 -0.0000*** -0.0000***
(0.000) (0.000) (0.000) (0.000) (0.000) (0.000) (0.000) (0.000)
Constant 4.7907*** 4.0742*** 4.7907*** 4.0742*** 5.0486*** 4.2659*** 4.2966*** 3.9724***
(0.000) (0.023) (0.000) (0.023) (0.000) (0.028) (0.000) (0.032)
Full set of fixed
effects
No Yes No Yes No Yes No Yes
R-squared 0.820 0.893 0.820 0.893 0.820 0.893 0.820 0.893
Clusters 126 126 126 126 126 126 126 126
Observations 1850 1850 1850 1850 1850 1850 1850 1850
Note: Robust standard errors clustered by country and birth-cohort in parentheses. * Significant at ten percent; ** significant at five percent;
*** significant at one percent. Specifications (1), (3) and (5) only include cohort fixed effects (ρ). Specifications (2), (4) and (6) include the
following fixed effects: cohort (ρ), gender (η), country (ϕ), survey (φ ), and an interaction between survey and country fixed effects (ψ).
Source: Author’s calculations based on data from Latin American household surveys, 1995-2009, biannual and Polity IV Project.
17
5.2. Robustness
In this section I verify if my results survive statistical scrutiny. I check whether my findings
hold after controlling for periods of wars and economics crises. Both wars and economic crises can
lead to regime transitions and affect socioeconomic outcomes. They can destroy or deplete capital
assets, reducing top capital incomes (Piketty and Saez, 2003). They can also raise the income of
the poor, for example, by employing them in the arms industry(as in the case of the United States
during the Second World War) or reduce it, by leaving poor people jobless.
These phenomena can also have effects on human capital. For example, UNESCO (2010) re-
ported that conflict often results in smaller shares of the population with formal schooling, fewer
average years of education, and decreased literacy rates, which persist over time and might affect
particularly marginalized groups. Economic crises might also affect human capital. In Latin Amer-
ica, for example, the economic crisis and structural adjustment during the 1980s economic crisis
led to declines in family income, which may have resulted in growing inequality of educational
opportunity (Fernandez and Lopez-Calva; Torche, 2010).
Wars and economic crises can also hasten regime transitionsby destabilizing political regimes.
In Latin America, in many opportunities regime changes wereresult of a war that replaced the
incumbent head of government with another. In Brazil, for example, after the end of World War II,
Getulio Vargas regime became unsustainable because during the period of the war the threat of a
German attack did not materialize, leading him to be swiftlyoverthrown in a military coup that “re-
stated” democracy. In the ArgentineRevolucion Libertadora(1955), the Peron regime was deposed
for a military dictatorship in a coup d’etat by military forces. Economic crisis also preceded regime
transitions. The economic depression of the 1930s weakenedthe legitimacy of emerging democrat-
ic institutions, which led to social and political unrest between liberal movements and oligarchs and
eventually to a military dictatorship in most countries backed up by the right-wing (which sought
to protect thestatus quo). The economic crisis of the 1980s brought important economic problems
for dictatorships to deal with: high unemployment, inflation, and growth stagnation, which had
deligitimazing effects. Eventually the economic crisis ofthe 1980s led non-democratic regimes to
an end and to the birth of representative democracies. (Bethell, 1997; Hagopian and Mainwaring,
2005.)
The effects of wars and economic crises can be far reaching, and although we can consider
them as shocks, they might have long-lasting consequences.Given that these two phenomena can
precede regime transitions I test for the stability of my proxy of democracy by including proxies that
account for these events in my main regressions. However, given their transitory nature it would not
be wise to measure wars and economic crisis as stock variables. Instead, I compute several proxies
18
as level variables at different periods around a person’s year of birth. For both wars and economic
crisis I compute the percentage of years of war or crisis thatan individual born in yeart experienced
betweent −30 andt −1; t −20 andt −1; t −10 andt −1; t andt +10; t andt +20 ; t −30 and
t +20 ; t −20 andt +20, andt −10 andt +10. These comprise a comprehensive set of proxies.
Table A3, in the appendix, presents the periods of wars and economic crisis that took place in the
countries of interest.
Given that for every individual born in any given year (t) belonging to any given country (p),
and for a given time interval, the percentage of years of war or crisis would be the same, I compute
the simple average of the proxy for the three birth years thatcompose the cohort to obtain the cohort
average. That is
Hc,p =13 ∑
t∈cHt,c,p, (3)
whereHt,c,p denotes the percentage of years of war or economic crisis forthe birth yeart belonging
to cohortc and countryp, and for a given time interval.
I run 216 different regressions, which come from including each proxy in my main regressions
with replacement. To save space, I include the regressions in an online appendix.11 My main re-
sults hold for the relationship between inequality in laborincome and educational attainment and
democracy; that is,β < 0 and statistically significant. However, this parameter isnot stable when
using equations (c) and (d) –my benchmark specifications. This comes as no surprise because when
considering shorter time periods we reduce variation in theindependent variable. Moreover, we no
longer consider the very long-run and cumulative effect of historical legacies. Thus I ask the read-
er to consider only the results I obtain when using equations(a) and (b) to measure the stock of
democracy. For the related specifications I find robust evidence of a non-monotonic relationship
between democracy and labor income inequality and educational attainment inequality (although
subtle for the latter one).
For the case of the level of educational attainment, I not only find that the absolute value ofβis much smaller, but I also do not find robust evidence thatβ > 0 (or the opposite). In other words,
I find that there is no robust relationship between the stock of democracy and the average years of
education.11https://sites.google.com/site/cfbalcazars/misc
19
6. Conclusions
Despite many research documents assessing the link betweendemocracy and inequality, empir-
ical research is still not conclusive on whether and how democracy and inequality relate. This rela-
tionship is a complex and multidimensional process that involves many socioeconomic phenomena.
Empirical research usually resorts to cross-country paneldata sets, but these impose several mea-
surement error and endogeneity problems that are hard to solve. This paper tries to overcome many
of these difficulties using pseudo-panel data built from several household surveys of nine Latin
American countries, exploiting panel data techniques to control for endogeneity due to unobserved
factors, and proposing a renewed approach which seeks to determine if long-run historical patterns
in the degree of democracy relate to contemporary income inequality.
My findings show that democracy is negatively related to income inequality, and that it is al-
so related to lower dispersion in educational attainment. My interpretation of these results is: It
seems plausible to regard democracy as an important institutional factor in the development of
education. Political elites in a democracy have electoral incentives to improve the quality of life
for the least advantaged; incentives that are present to a much smaller degree in authoritarian sys-
tems. By changing the education output, political regimes map democracy onto long-run changes
in the distribution of human capital and then onto contemporary changes in income inequality in a
non-monotonic fashion.
One of the concrete implications of these results is that if democratic institutions contribute
to secular-historical changes in policy outcomes, then it is inappropriate to judge the results of
institutional reforms on the basis of immediate policy gains. The immediate effects of institutional
change are often negative since such change introduces uncertainties and information costs in the
short run-positive changes are likely to take longer to materialize, since they depend upon the
establishment of a new equilibrium. (Gerring et al., 2005.)It is unrealistic to expect such reforms
to show instantaneous results.
Many important points remain to be considered, I focus on a few important ones. First, what
would happen if we consider younger cohorts by having accessto recent household survey data –
those born after the third democratic wave (Mainwaring and Hagopian, 2005). These cohorts should
show larger democracy stocks. Based on the results shown above, we could guess that the estimated
effect of democracy on inequality is likely to be larger thanthe one I estimate here. Second, I did
not spend much time analyzing the non-monotonic relationship between the stock of democracy
and inequality from the theoretical perspective. It is precise to rethink Acemoglu and Robinson’s
theory of the political Kuznets curve from the inter-generational perspective, introducing the role
of political change (Person and Tabellini, 2006). However,this is a task that I defer to future work.
20
References
Acemoglu, D. (2008). Oligarchic vs. democratic societies.Journal of the European Economic
Association, 6(1):1–44.
Acemoglu, D., Daron, Naidu, S., Restrepo, P., and Robinson,J. (2013). Democracy, redistribution
and inequality. National Bureau of Economic Research, Working Paper 19746.
Acemoglu, D. and Dell, M. (2010). Productivity differencesbetween and within countries.Ameri-
can Economic Journal: Macroeconomics, 2(1):169–88.
Acemoglu, D. and Robinson, J. (1998). Why did the west extendthe franchise? democracy, in-
equality, and growth in historical perspective.Quarterly Journal of Economics, 115(4):1167–69.
Acemoglu, D. and Robinson, J. (2002). The political economyof the kuznets curve.Review of
Development Economics, 6(2):183–203.
Alesina, A. and Rodrik, D. Distributive politics and economic growth. The Quarterly Journal of
Economics, 109(2):465–490.
Amendola, A., Easaw, J., and Savoia, A. (2013). Inequality in developing economies: the role of
institutional development.Public Choice, 155(1):43–60.
Ansell, B. (2008). Traders, teachers, and tyrants: Democracy, globalization, and public investment
in education.International Organization, 62(2):289–322.
Atkinson, A. and Brandolini, A. (2001). Promise and pitfalls in the use of ’secondary’ data-sets:
Income inequality in oecd countries as a case study.Journal of Economic Literature, 39(3):771–
799.
Bardhan, P. (2005).Scarcity, conflict and cooperation: Essays in political andinstitutional eco-
nomics of development, chapter History, Institutions, and Underdevelopment, pages 1–27. Mas-
sachusetts: MIT Press.
Baum, M. and Lake, D. (2001). The invisible hand of democracy: Political control and the provision
of public services.Comparative Political Studies, 34(6):587–621.
Baum, M. and Lake, D. (2003). The political economy of growth: Democracy an human capital.
American Journal of Political Science, 47:333–334.
Bethell, L. (1997).Historia de America Latina: Polıtica y Sociedad desde 1930. Barcelona: Cam-
bridge University Press.
Billor, N., Hadi, A., and Velleman, P. (2000). Bacon: Blocked adaptive computationally efficient
outlier nominators.Computational Statistics and Data Analysis, 34(3):279–298.
Brown, D. and Hunter, W. (2004). Democracy and human capitalformation education spending in
21
latin america, 1980 to 1997.Comparative Political Studies, 37(7):842–864.
Chong, A. (2004). Inequality, democracy, and persistence:Is there a political kuznets curve?Eco-
nomics and Politics, 16(2):189–212.
Collado, M. D. (1997). Estimating dynamic models from time series of independent cross-sections.
Journal of Econometrics, 82(1):37–62.
Deaton, A. (1985). Panel data from time series of cross-sections.Journal of Econometrics, 30:109–
126.
Engerman, S., Mariscal, E., and Sokoloff, K. (2000).Political Institutions and Economic Growth in
Latin America, chapter Schooling, Suffrage, and the Persistence of Inequality in the Americas,
1800-1945, pages 159–217. Stanford: Hoover Institution Press.
Engerman, S. and Sokoloff, K. (1997).How Latin America Fell Behind, chapter Factor endow-
ments, institutions, and differential paths of growth among new world economies: a view from
economic historians of the United States. Stanford: Stanford University Press.
Engerman, S. and Sokoloff, K. (2000). History lessons: Institutions, factor endowments, and paths
of development in the new world.Journal of Economic Perspectives, 14(3):217–232.
Fernandez, A. and Lopez-Calva, L. (2010). Transitory shocks, permanent effects: impact of the
economic crisis on the well-being of households in latin america and the caribbean.Estudios
Economicos, 1(49):3–35.
Gerring, J., Bond, P., Barndt, W., and Moreno, C. (2005). Democracy and economic growth: A
historical perspective.World Politics, 57:323–336.
Girma, S. (2000). A quasi-differencing approach to dynamicmodelling from a time series of
independent cross-sections.Journal of Econometrics, 98(2):365–383.
Glaeser, E., Porta, R. L., de Silanes, F. L., and Schleifer, A. (2004). Do institutions cause growth?
Journal of Economic Growth, 9(3):271–303.
Gradstein, M., Milanovic, B., and Ying, Y. (2001). Democracy and income inequality: an empirical
analysis. CESifo Working Paper No. 411.
Harding, R. and Stasavage, D. (2014). hat democracy does (and doesn’t do) for basic services:
School fees, school inputs, and african elections.The Journal of Politics, 76(1):229–245.
Huber, E. and Stephen, J. (2012).Democracy and the left: social policy and inequality in Latin
America. University of Chicago Press.
Katz, L. and Autor, D. (1999).Handbook of Labor Economics, volume 3, chapter Changes in the
wage structure and earnings inequality, pages 1463–1555. San Diego, CA: North-Holland.
22
Li, H., Squire, L., and fu Zou, H. (1998). Explaining international and intertemporal variations in
income inequality.The Economic Journal, 108:26–43.
Lindert, P. (2004).Growing Public: Social Spending and Economic Growth since the Eighteenth
Century. Cambridge: Cambridge University Press.
Mainwaring, S. and Hagopian, F., editors (2005).The Third Wave of Democratization in Latin
America: Advances and Setbacks. Cambridge: Cambridge University Press.
Marshall, M., Jaggers, K., and Gurr, T. (2010). Political regime characteristics and transitions,
1800-2010: Dataset users’ manual. Technical report, Center for Systemic Peace.
McKenzie, D. (2004). Asymptotic theory for heterogeneous dynamic pseudopanels.Journal of
Econometrics, 120(2):235–262.
Meltzer, A. and Richard, S. (1981). A rational theory of the size of government.Journal of Political
Economy, 89(5):914–927.
Milanovic, B. (2000). The median-voter hypothesis, incomeinequality, and income redistribution:
an empirical test with the required data.European Journal of Political Economy, 16(3):367–410.
Moffit, R. (1993). Identification and estimation of dynamic models with a time series of repeated
cross-sections.Journal of Econometrics, 59:99–123.
Nikoloski, Z. (2009). Economic and political determinantsof income inequality. Master’s thesis,
University College London.
Nikoloski, Z. (2010). Democracy and income inequality: Revisiting the long- and short-term rela-
tionship. University of College London.
Nopo, H. (2012).New Century, Old Disparities: Gender and Ethnic Earnings Gaps in Latin Amer-
ica and the Caribbean. New York: Inter-American Development Bank and The World Bank.
Palma, J. (2011). Homogeneous middles vs. heterogeneous tails, and the end of the ’inverted-u’:
It’s all about the share of the rich.Development and Change, 42(1):87–153.
Perry, G., Ferreira, F., and Walton, M. (2003).Inequality in Latin America and the Caribbean,
Breaking with history. The World Bank.
Persson, T. and Tabellini, G. (1994). Is inequality harmfulfor growth. The American Economic
Review, 84(3):600–621.
Persson, T. and Tabellini, G. (2009). Democratic capital: The nexus of political and economic
change.American Economic Journal: Macroeconomics, 1(2):88–126.
Piketty, T. and Saez, E. (2003). Income inequality in the united states , 1993-1998.The Quarterly
Journal of Economics, 518 (1):1–39.
23
Reuveny, R. and Li, Q. (2003). Economic openness, democracyand income inequality: An empir-
ical analysis.Comparative Political Studies, 36(5):575–601.
Rodrik, D. (1999). Democracies pay higher wages.Quarterly Journal of Economics, 114(3):707–
738.
Sachs, J. (2012). Reply to acemoglu and robinson’s responseto my book review. Retrieved from:
http://jeffsachs.org/2012/12/reply-to-acemoglu-and-robinsons-response-to-my-book-review/.
Saint-Paul, G. and Verdier, T. (1993). Education, democracy and growth.Journal of Development
Economics, 42(2):399–407.
Sarkees, M. and Wayman, F. (2010). Resort to war: 1816 - 2007.CQ Press.
Savoia, A., Easaw, J., and Mckay, A. (2010). Inequality, democracy, and institutions: A critical
review of recent research.World Development, 38(2):142–154.
Scheina, R. (2003).Latin America’s Wars Volume II: The Age of the Professional Soldier, 1900-
2001. Dulles: Potomac Books, Inc.
Schiefelbein, E. (2007).Universalization of Primary Education in the Historical and Develop-
mental Perspective, chapter Universalization of Primary Education in Latin America: The Poor
Results and Their causes, pages 141–177. IDE-JETRO.
Schumpeter, J. (1942).Capitalism, Socialism and Democracy. New York: Harper Brothers.
Stinchcombe, A. (1965).Handbook of Organizations, chapter Social Structure and Organizations.
Chicago: Rand McNally.
Thorbecke, E. and Charumilind, C. (2002). Economic inequality and its socioeconomic impact.
World Development, 30:1477–1495.
Timmons, J. (2010). Does democracy reduce economic inequality? British Journal of Political
Science, 40(4):741–757.
Torche, F. (2010). Economic crisis and inequality of educational opportunity in latin america.
Sociology of Education, 83 (2):85–110.
UNESCO (2010). The quantitative impact of conflict on education. Think piece prepared for the
Education for All Global Monitoring Report 2011.
Verbeek, M. (2008).The Econometrics of Panel Data: Fundamentals and Recent Developments in
Theory and Practice, chapter Pseudo panels and repeated cross-sections, pages369–384. Berlin:
Springer.
Verbeek, M. and Nijman, T. (1993). Minimum mse estimation ofa regression model with fixed
effects from a series of cross-sections.Journal of Econometrics, 59(ss):125–136.
24
Verbeek, M. and Vella, F. (2005). Estimating dynamic modelsfrom repeated cross-sections.Jour-
nal of Econometrics, 127:83–102.
You, J. and Khagram, S. (2004). Inequality and corruption. Harvard University, Kennedy School
of Government, RWP04-001.
25
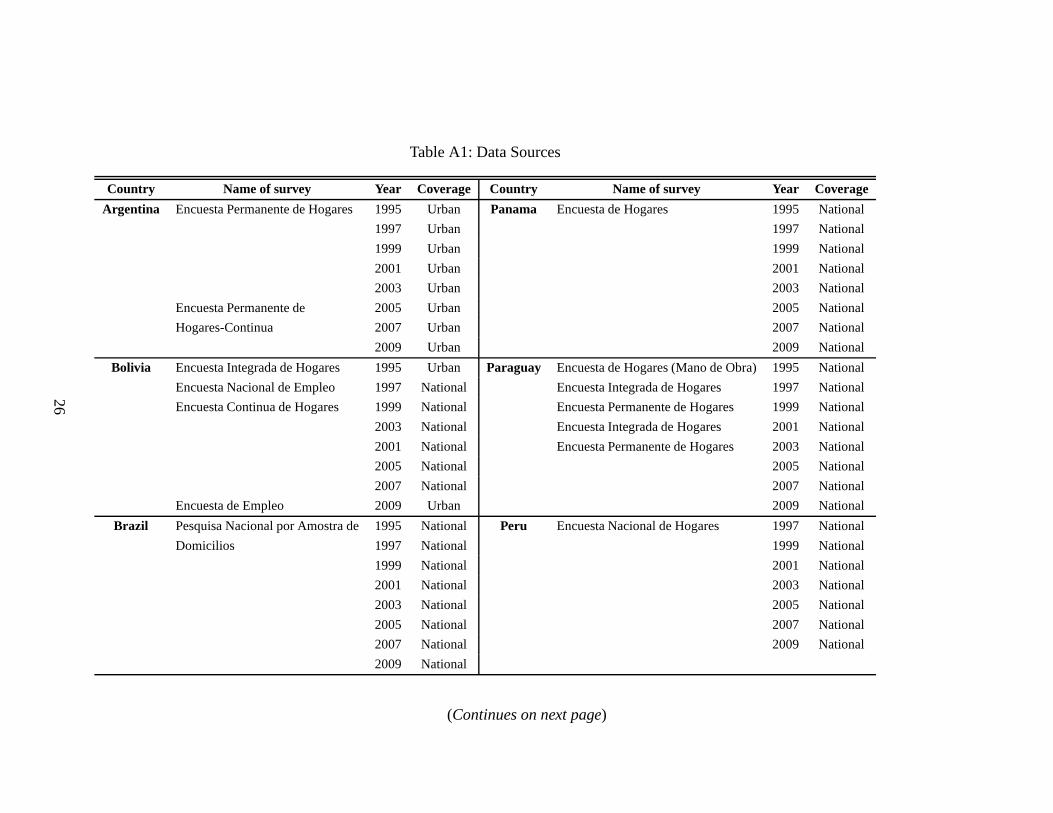
Table A1: Data Sources
Country Name of survey Year Coverage Country Name of survey Year Coverage
Argentina Encuesta Permanente de Hogares 1995 UrbanPanama Encuesta de Hogares 1995 National
1997 Urban 1997 National
1999 Urban 1999 National
2001 Urban 2001 National
2003 Urban 2003 National
Encuesta Permanente de 2005 Urban 2005 National
Hogares-Continua 2007 Urban 2007 National
2009 Urban 2009 National
Bolivia Encuesta Integrada de Hogares 1995 UrbanParaguay Encuesta de Hogares (Mano de Obra) 1995 National
Encuesta Nacional de Empleo 1997 National Encuesta Integrada de Hogares 1997 National
Encuesta Continua de Hogares 1999 National Encuesta Permanente de Hogares 1999 National
2003 National Encuesta Integrada de Hogares 2001 National
2001 National Encuesta Permanente de Hogares 2003 National
2005 National 2005 National
2007 National 2007 National
Encuesta de Empleo 2009 Urban 2009 National
Brazil Pesquisa Nacional por Amostra de 1995 National Peru Encuesta Nacional de Hogares 1997 National
Domicilios 1997 National 1999 National
1999 National 2001 National
2001 National 2003 National
2003 National 2005 National
2005 National 2007 National
2007 National 2009 National
2009 National
(Continues on next page)
26
Country Name of survey Year Coverage Country Name of survey Year Coverage
Colombia Encuesta Nacional de Hogares-Fuerza 1995 NationalUruguay Encuesta Continua de Hogares 1995 Urban
de Trabajo 1997 National 1997 Urban
1999 National 1999 Urban
Encuesta Continua de Hogares 2001 National 2001 Urban
2003 National 2003 Urban
2005 National 2005 Urban
Gran Encuesta Integrada de Hogares 2007 National 2007 Urban
2009 National 2009 Urban
Honduras Encuesta Permanente de Hogares de 1997 National
Propositos Multiples 1999 National
2001 National
2003 National
2005 National
2007 National
2009 National
Source: Author’s compilations based on data from Latin American household surveys, 1995-2009, biannual.
27

Table A2: Sample Size
Birth cohort Number of cohorts by year Number of individuals
(years) 1995 1997 1999 2001 2003 2005 2007 2009Unweighted Weighted
1936-38 14 18 18 18 18 18 18 18 29237 10034004
1939-41 14 18 18 18 18 18 18 18 42596 14354638
1942-44 14 18 18 18 18 18 18 18 54768 18299629
1945-47 14 18 18 18 18 18 18 18 75225 25036860
1948-50 14 18 18 18 18 18 18 18 95509 32201858
1951-53 14 18 18 18 18 18 18 18 117188 39522084
1954-56 14 18 18 18 18 18 18 18 139507 47440640
1957-59 14 18 18 18 18 18 18 18 159606 54468349
1960-62 14 18 18 18 18 18 18 18 175293 60275779
1963-65 14 18 18 18 18 18 18 18 191295 66839428
1966-68 14 18 18 18 18 18 18 18 188610 66279462
1969-71 14 18 18 18 18 18 18 18 198280 68779300
1972-74 0 18 18 18 18 18 18 18 178815 62720401
1975-77 0 0 18 18 18 18 18 18 165060 57798437
Total 168 216 216 216 216 216 216 216 1467114 503532031
Source: Author’s calculations based on data from Latin American household surveys, 1995-2009, biannual.
28
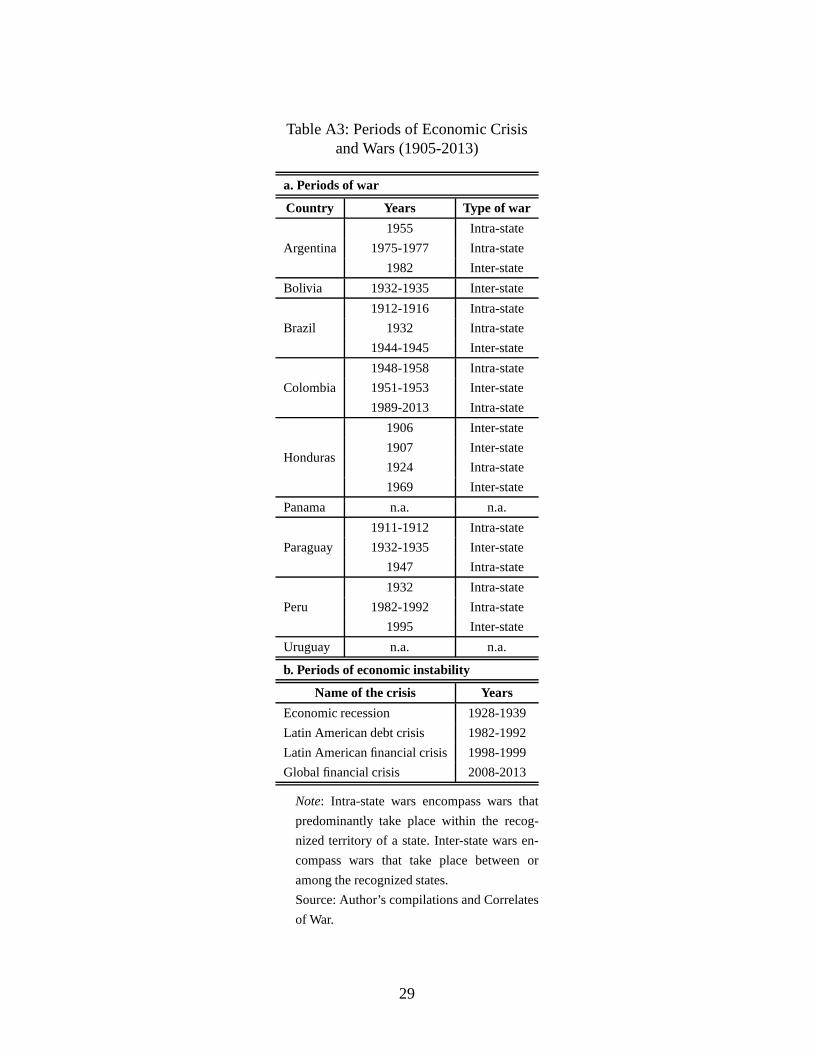
Table A3: Periods of Economic Crisisand Wars (1905-2013)
a. Periods of war
Country Years Type of war
Argentina
1955 Intra-state
1975-1977 Intra-state
1982 Inter-state
Bolivia 1932-1935 Inter-state
Brazil
1912-1916 Intra-state
1932 Intra-state
1944-1945 Inter-state
Colombia
1948-1958 Intra-state
1951-1953 Inter-state
1989-2013 Intra-state
Honduras
1906 Inter-state
1907 Inter-state
1924 Intra-state
1969 Inter-state
Panama n.a. n.a.
Paraguay
1911-1912 Intra-state
1932-1935 Inter-state
1947 Intra-state
Peru
1932 Intra-state
1982-1992 Intra-state
1995 Inter-state
Uruguay n.a. n.a.
b. Periods of economic instability
Name of the crisis Years
Economic recession 1928-1939
Latin American debt crisis 1982-1992
Latin American financial crisis 1998-1999
Global financial crisis 2008-2013
Note: Intra-state wars encompass wars that
predominantly take place within the recog-
nized territory of a state. Inter-state wars en-
compass wars that take place between or
among the recognized states.
Source: Author’s compilations and Correlates
of War.
29