long-run comparisons of spending per pupil across ... education... · • aim to incorporate...
TRANSCRIPT

Chris Belfield Luke Sibieta
Long-Run Comparisons of Spending per Pupil across Different Stages of Education

Introduction
© Institute for Fiscal Studies Long-Run Comparisons of Spending per Pupil across Different Stages of Education

Education spending over the long-run
© Institute for Fiscal Studies Long-Run Comparisons of Spending per Pupil across Different Stages of Education
0%
1%
2%
3%
4%
5%
6%
0
20
40
60
80
100
120 19
55–5
6 19
58–5
9 19
61–6
2 19
64–6
5 19
67–6
8 19
70–7
1 19
73–7
4 19
76–7
7 19
79–8
0 19
82–8
3 19
85–8
6 19
88–8
9 19
91–9
2 19
94–9
5 19
97–9
8 20
00–0
1 20
03–0
4 20
06–0
7 20
09–1
0 20
12–1
3 20
15–1
6
Shar
e of
nat
iona
l inc
ome
£bill
ion
(201
6-17
pri
ces)
Share of national income (RHS)
Real-terms level (LHS)
Importance of understanding long-run trends in spending per pupil at different stages
Trends in overall education spending can mask changing spending priorities across different phases
How have funding reforms and changing participation levels affected spending per student at different stages?
How do current changes compare with past changes?
Important to understand given empirical evidence showing differential effectiveness of investments at different ages
Not currently possible to track spending across different stages over long-run and in a consistent manner
Aim: create consistent series of spending per pupil or student across main stages of education over long period, which we can update annually
© Institute for Fiscal Studies Long-Run Comparisons of Spending per Pupil across Different
Stages of Education

Overall framework for creating measuring of spending per pupil
Focus on day-to-day spending in England only
• Aim to incorporate capital spending and UK-wide comparisons in the future
Examine education spending from early years to higher education
• Early years – ages 3-4
• Schools- ages 5-16
• Further education and sixth forms – ages 16-18
• Higher education – ages 18-21
All figures presented in 2016-17 price and all changes are in real-terms
© Institute for Fiscal Studies Long-Run Comparisons of Spending per Pupil across Different
Stages of Education

Early Years
© Institute for Fiscal Studies Long-Run Comparisons of Spending per Pupil across Different Stages of Education

Policymaker focus on early years spending
Increasing focus on early years education as means to increase maternal employment and improve child outcomes
Total spending up from less than £100m in early 90s to £5.4bn in 2015-16
• Entitlement to 15 hours free early education for 3 and 4 year olds (£2.3bn)
• Extended to disadvantaged 2 year olds (£540m)
• Sure Start (£1.0bn)
• Demand-side subsidies through Working Tax Credit (£1.2bn in 2014-15)
• Tax-free employer childcare vouchers (£750m)
Focus on entitlement to free early education for 3 and 4 year olds as closer to education spending, rather than childcare
© Institute for Fiscal Studies Long-Run Comparisons of Spending per Pupil across Different Stages of Education

© Institute for Fiscal Studies Long-Run Comparisons of Spending per Pupil across Different Stages of Education
Increase in spending on early years education
£0
£500
£1,000
£1,500
£2,000
£2,500
£3,000 19
97–9
8
1998
–99
1999
–00
2000
–01
2001
–02
2002
–03
2003
–04
2004
–05
2005
–06
2006
–07
2007
–08
2008
–09
2009
–10
2010
–11
2011
–12
2012
–13
2013
–14
2014
–15
2015
–16
2016
–17
2017
–18
2018
–19
2019
–20
£ pe
r ch
ild (2
016-
17 p
rice
s)
Financial Year
Spending per head Spending per child aged 3 or 4 taking up place
Introduction of free entitlement in 1998 for 4 year olds: 12.5 hrs for 33 weeks

© Institute for Fiscal Studies Long-Run Comparisons of Spending per Pupil across Different Stages of Education
Increase in spending on early years education
£0
£500
£1,000
£1,500
£2,000
£2,500
£3,000 19
97–9
8
1998
–99
1999
–00
2000
–01
2001
–02
2002
–03
2003
–04
2004
–05
2005
–06
2006
–07
2007
–08
2008
–09
2009
–10
2010
–11
2011
–12
2012
–13
2013
–14
2014
–15
2015
–16
2016
–17
2017
–18
2018
–19
2019
–20
£ pe
r ch
ild (2
016-
17 p
rice
s)
Financial Year
Spending per head Spending per child aged 3 or 4 taking up place
Extended to 3 yr olds
Extended to 38 weeks
Extended to 15 hrs

© Institute for Fiscal Studies Long-Run Comparisons of Spending per Pupil across Different Stages of Education
Increase in spending on early years education
£0
£500
£1,000
£1,500
£2,000
£2,500
£3,000 19
97–9
8
1998
–99
1999
–00
2000
–01
2001
–02
2002
–03
2003
–04
2004
–05
2005
–06
2006
–07
2007
–08
2008
–09
2009
–10
2010
–11
2011
–12
2012
–13
2013
–14
2014
–15
2015
–16
2016
–17
2017
–18
2018
–19
2019
–20
£ pe
r ch
ild (2
016-
17 p
rice
s)
Financial Year
Spending per head Spending per child aged 3 or 4 taking up place
17% cut since 2008 driven by falls in spending by
local authorities
© Institute for Fiscal Studies Long-Run Comparisons of Spending per Pupil across Different Stages of Education
Increase in spending on early years education
£0
£500
£1,000
£1,500
£2,000
£2,500
£3,000 19
97–9
8
1998
–99
1999
–00
2000
–01
2001
–02
2002
–03
2003
–04
2004
–05
2005
–06
2006
–07
2007
–08
2008
–09
2009
–10
2010
–11
2011
–12
2012
–13
2013
–14
2014
–15
2015
–16
2016
–17
2017
–18
2018
–19
2019
–20
£ pe
r ch
ild (2
016-
17 p
rice
s)
Financial Year
Spending per head Spending per child aged 3 or 4 taking up place
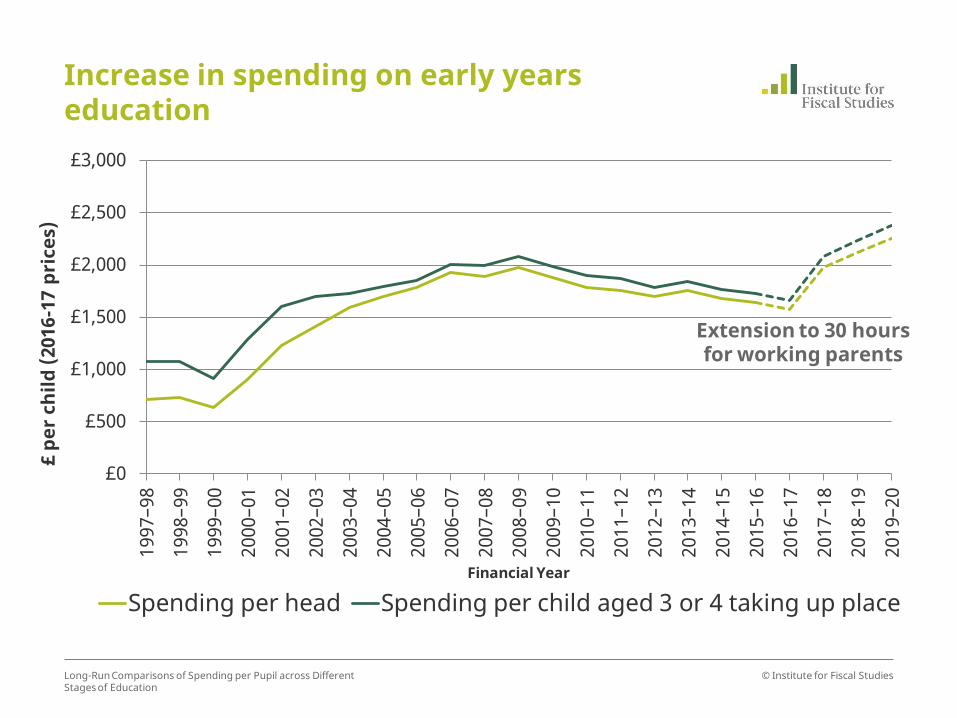
Extension to 30 hours for working parents

Summary of changes over time
Increase in spending per child aged 3 or 4 taking up free place from £1,100 in 1997-98 to £1,700 in 2015-16
• Offer by local authorities expanded before legal entitlement changed
• Falling spending per head since 2008 as local authorities have chosen to spend less
Extra £1bn to deliver extension from 15 to 30 hours for working parents likely to increase spending per child aged 3 or 4 to around £2,400 in 2019-20
• Sufficient to ensure quality of provision?
Other elements of early years spending grown from near zero, but are falling back
• Spending on Sure Start and Childcare Element of WTC fallen by one third since 2010-11
• Spending on childcare vouchers up from around £500m in 2010-11 to £750m in 2015-16
© Institute for Fiscal Studies Long-Run Comparisons of Spending per Pupil across Different
Stages of Education
Schools
© Institute for Fiscal Studies Long-Run Comparisons of Spending per Pupil across Different Stages of Education

£0
£1,000
£2,000
£3,000
£4,000
£5,000
£6,000
£7,000 19
78–7
9
1980
–81
1982
–83
1984
–85
1986
–87
1988
–89
1990
–91
1992
–93
1994
–95
1996
–97
1998
–99
2000
–01
2002
–03
2004
–05
2006
–07
2008
–09
2010
–11
2012
–13
2014
–15
2016
–17
2018
–19
£ pe
r pu
pil (
2016
-17
pric
es)
Financial years
© Institute for Fiscal Studies Long-Run Comparisons of Spending per Pupil across Different Stages of Education
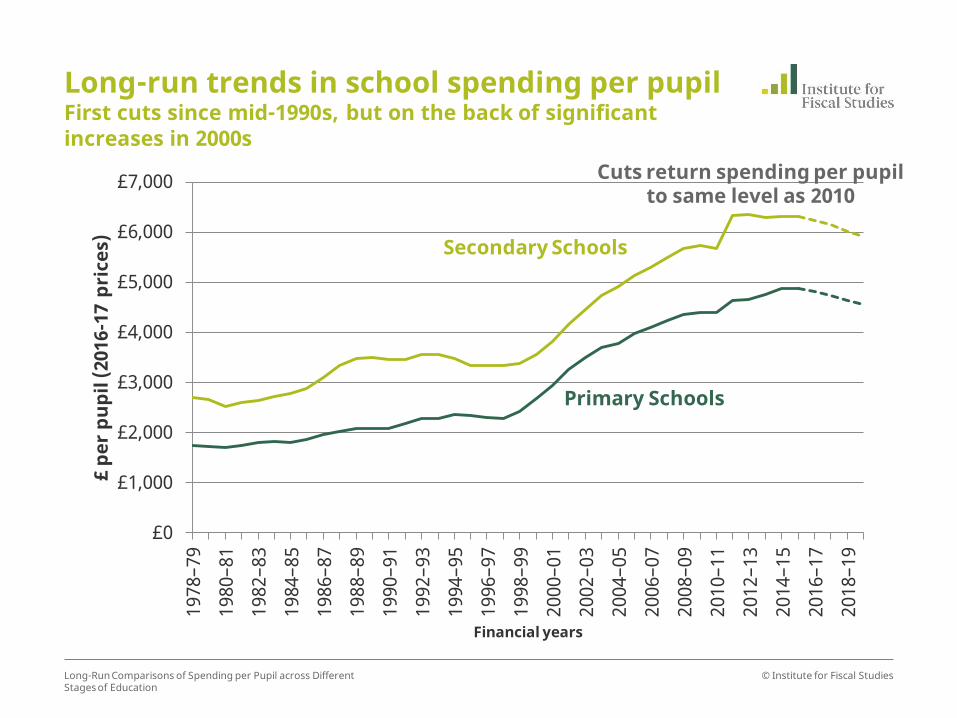
Long-run trends in school spending per pupil First cuts since mid-1990s, but on the back of significant increases in 2000s
Primary Schools
Secondary Schools
1995 to 2015: near doubling in real-terms

£0
£1,000
£2,000
£3,000
£4,000
£5,000
£6,000
£7,000 19
78–7
9
1980
–81
1982
–83
1984
–85
1986
–87
1988
–89
1990
–91
1992
–93
1994
–95
1996
–97
1998
–99
2000
–01
2002
–03
2004
–05
2006
–07
2008
–09
2010
–11
2012
–13
2014
–15
2016
–17
2018
–19
£ pe
r pu
pil (
2016
-17
pric
es)
Financial years
© Institute for Fiscal Studies Long-Run Comparisons of Spending per Pupil across Different Stages of Education
Long-run trends in school spending per pupil First cuts since mid-1990s, but on the back of significant increases in 2000s
Primary Schools
Secondary Schools
2015-16 to 2019-20: 6.5% cut
£0
£1,000
£2,000
£3,000
£4,000
£5,000
£6,000
£7,000 19
78–7
9
1980
–81
1982
–83
1984
–85
1986
–87
1988
–89
1990
–91
1992
–93
1994
–95
1996
–97
1998
–99
2000
–01
2002
–03
2004
–05
2006
–07
2008
–09
2010
–11
2012
–13
2014
–15
2016
–17
2018
–19
£ pe
r pu
pil (
2016
-17
pric
es)
Financial years
© Institute for Fiscal Studies Long-Run Comparisons of Spending per Pupil across Different Stages of Education
Long-run trends in school spending per pupil First cuts since mid-1990s, but on the back of significant increases in 2000s
Primary Schools
Secondary Schools
Cuts return spending per pupil to same level as 2010

£0
£1,000
£2,000
£3,000
£4,000
£5,000
£6,000
£7,000 19
78–7
9
1980
–81
1982
–83
1984
–85
1986
–87
1988
–89
1990
–91
1992
–93
1994
–95
1996
–97
1998
–99
2000
–01
2002
–03
2004
–05
2006
–07
2008
–09
2010
–11
2012
–13
2014
–15
2016
–17
2018
–19
£ pe
r pu
pil (
2016
-17
pric
es)
Financial years
© Institute for Fiscal Studies Long-Run Comparisons of Spending per Pupil across Different Stages of Education
Long-run trends in school spending per pupil First cuts since mid-1990s, but on the back of significant increases in 2000s
Primary Schools
Secondary Schools
1992 to 1997: 6% real-terms cut
1992 to 1997: real-terms freeze

Pressures on school spending
Plans imply 6.5% cut to school spending per pupil between 2015 and 2020
Will take school spending per pupil to 2010 level, but still over 70% higher than in 1990
New national funding for schools in England from 2018-19 onwards
• Long overdue reform that will rationalise the schools funding system
• Inevitably creates winners and losers
• Tough given tight schools settlement
• Significant transitionary protections up to 2019-20
© Institute for Fiscal Studies Long-Run Comparisons of Spending per Pupil across Different
Stages of Education

Further Education and Sixth Forms
© Institute for Fiscal Studies Long-Run Comparisons of Spending per Pupil across Different Stages of Education

Further Education and Sixth Forms
Big increase in education participation amongst 16-18 year olds in England
• From around 50% of 16-18 year olds in mid-1980s to around 75% by 2015
Further Education and Sixth Form Colleges
• Total spending of £3.7bn in 2015-16
• Attended by around 720,000 Some part-time, some full-time
• Combination of academic and vocational qualifications (full and part-time)
School Sixth Forms
• Total spending of £2.2bn in 2015-16
• Attended by around 430,000 16-18 year olds in 2015
• Full-time academic qualifications
© Institute for Fiscal Studies Long-Run Comparisons of Spending per Pupil across Different Stages of Education

£0
£1,000
£2,000
£3,000
£4,000
£5,000
£6,000
£7,000
£ pe
r fu
ll-ti
me
equi
vale
nt s
tude
nt
(2
016-
17 p
rice
s)
Financial years
© Institute for Fiscal Studies Long-Run Comparisons of Spending per Pupil across Different Stages of Education
Long-term squeeze on further education spending
Further Education
1990s: 19% cut
2000s: over 40% rise 2010 to 2020: 13% cut
Similar level in 2020 to that in 1990

£0
£1,000
£2,000
£3,000
£4,000
£5,000
£6,000
£7,000
£ pe
r fu
ll-ti
me
equi
vale
nt s
tude
nt
(2
016-
17 p
rice
s)
Financial years
© Institute for Fiscal Studies Long-Run Comparisons of Spending per Pupil across Different Stages of Education
School sixth form spending per pupil falls behind that in FE
School Sixth Forms
Further Education 23% cut since 2010

FE and Sixth Forms have been a low spending priority for policymakers
Spending per student in FE will be about the same in 2020 as it was in 1990
• Public spending has doubled and national income up 77% over same period
Larger cuts than schools spending when there are spending cuts
Smaller rises when there are increases in public spending
Why is it such a low priority?
© Institute for Fiscal Studies Long-Run Comparisons of Spending per Pupil across Different Stages of Education

Higher Education
© Institute for Fiscal Studies Long-Run Comparisons of Spending per Pupil across Different Stages of Education

Measuring higher education spending
• Measuring spending on Higher Education is more complicated because it is made up of teaching grants and tuition fees
‒ Maintenance grants/loans shown separately
• Two main measures:
‒ Upfront resources available for universities – includes teaching grants and all tuition fees
‒ Long-run government subsidy – includes teaching grants and non-repaid tuition fee loans
• Defined at the cohort level
‒ E.g. Spending per pupil on the cohort of students entering HE in 2012/13 to cover their entire degree
© Institute for Fiscal Studies Long-Run Comparisons of Spending per Pupil across Different Stages of Education

Higher Education funding in England
£0
£5,000
£10,000
£15,000
£20,000
£25,000
£30,000
£35,000 19
90–9
1
1991
–92
1992
–93
1993
–94
1994
–95
1995
–96
1996
–97
1997
–98
1998
–99
1999
–00
2000
–01
2001
–02
2002
–03
2003
–04
2004
–05
2005
–06
2006
–07
2007
–08
2008
–09
2009
–10
2010
–11
2011
–12
2012
–13
2013
–14
2014
–15
2015
–16
2016
–17
£ pe
r st
uden
t (20
16-1
7 pr
ices
)
Academic year of entry into higher education
Teaching grant Fee loan subsidy Total subsidy Total resources
© Institute for Fiscal Studies Long-Run Comparisons of Spending per Pupil across Different Stages of Education
Real value of teaching grants falling in per pupil terms

Higher Education funding in England
£0
£5,000
£10,000
£15,000
£20,000
£25,000
£30,000
£35,000 19
90–9
1
1991
–92
1992
–93
1993
–94
1994
–95
1995
–96
1996
–97
1997
–98
1998
–99
1999
–00
2000
–01
2001
–02
2002
–03
2003
–04
2004
–05
2005
–06
2006
–07
2007
–08
2008
–09
2009
–10
2010
–11
2011
–12
2012
–13
2013
–14
2014
–15
2015
–16
2016
–17
£ pe
r st
uden
t (20
16-1
7 pr
ices
)
Academic year of entry into higher education
Teaching grant Fee loan subsidy Total subsidy Total resources
© Institute for Fiscal Studies Long-Run Comparisons of Spending per Pupil across Different Stages of Education
£1,000 per year tuition fees introduced in 1998

Higher Education funding in England
£0
£5,000
£10,000
£15,000
£20,000
£25,000
£30,000
£35,000 19
90–9
1
1991
–92
1992
–93
1993
–94
1994
–95
1995
–96
1996
–97
1997
–98
1998
–99
1999
–00
2000
–01
2001
–02
2002
–03
2003
–04
2004
–05
2005
–06
2006
–07
2007
–08
2008
–09
2009
–10
2010
–11
2011
–12
2012
–13
2013
–14
2014
–15
2015
–16
2016
–17
£ pe
r st
uden
t (20
16-1
7 pr
ices
)
Academic year of entry into higher education
Teaching grant Fee loan subsidy Total subsidy Total resources
© Institute for Fiscal Studies Long-Run Comparisons of Spending per Pupil across Different Stages of Education
Tuition fees raised in £3,000 per year in 2006. Tuition fee loans introduced.
Higher Education funding in England
£0
£5,000
£10,000
£15,000
£20,000
£25,000
£30,000
£35,000 19
90–9
1
1991
–92
1992
–93
1993
–94
1994
–95
1995
–96
1996
–97
1997
–98
1998
–99
1999
–00
2000
–01
2001
–02
2002
–03
2003
–04
2004
–05
2005
–06
2006
–07
2007
–08
2008
–09
2009
–10
2010
–11
2011
–12
2012
–13
2013
–14
2014
–15
2015
–16
2016
–17
£ pe
r st
uden
t (20
16-1
7 pr
ices
)
Academic year of entry into higher education
Teaching grant Fee loan subsidy Total subsidy Total resources
© Institute for Fiscal Studies Long-Run Comparisons of Spending per Pupil across Different Stages of Education
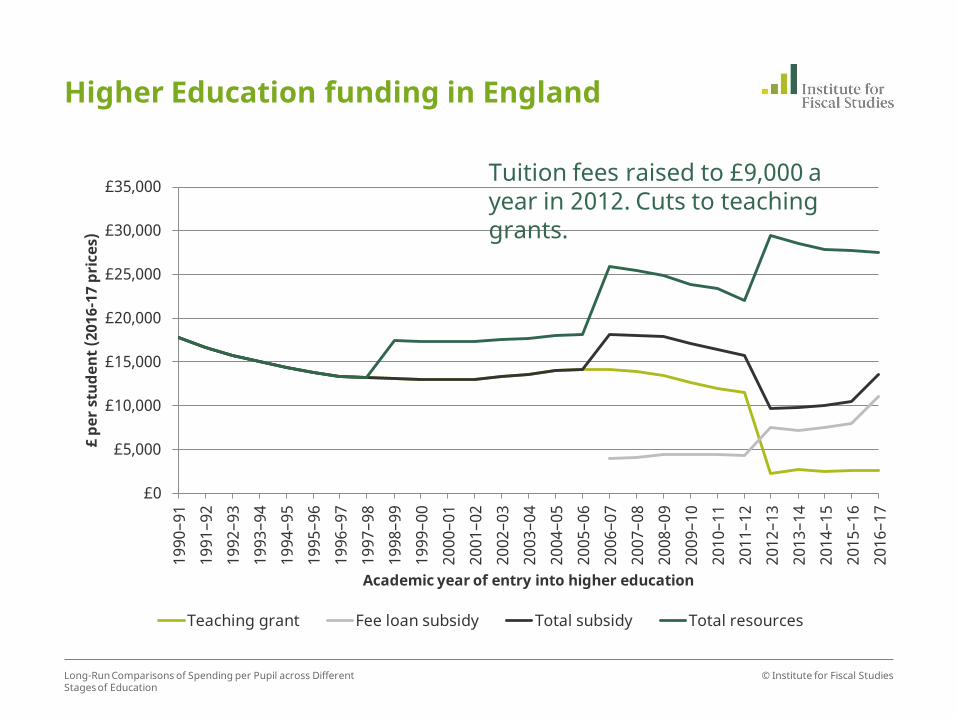
Tuition fees raised to £9,000 a year in 2012. Cuts to teaching grants.

Higher Education funding in England
£0
£5,000
£10,000
£15,000
£20,000
£25,000
£30,000
£35,000 19
90–9
1
1991
–92
1992
–93
1993
–94
1994
–95
1995
–96
1996
–97
1997
–98
1998
–99
1999
–00
2000
–01
2001
–02
2002
–03
2003
–04
2004
–05
2005
–06
2006
–07
2007
–08
2008
–09
2009
–10
2010
–11
2011
–12
2012
–13
2013
–14
2014
–15
2015
–16
2016
–17
£ pe
r st
uden
t (20
16-1
7 pr
ices
)
Academic year of entry into higher education
Teaching grant Fee loan subsidy Total subsidy Total resources
© Institute for Fiscal Studies Long-Run Comparisons of Spending per Pupil across Different Stages of Education
Real value of resources per pupil fell in 18 of the past 26 years…
…but the total value of resources has increased by 50% since 1990

Higher Education funding in England
£0
£5,000
£10,000
£15,000
£20,000
£25,000
£30,000
£35,000 19
90–9
1
1991
–92
1992
–93
1993
–94
1994
–95
1995
–96
1996
–97
1997
–98
1998
–99
1999
–00
2000
–01
2001
–02
2002
–03
2003
–04
2004
–05
2005
–06
2006
–07
2007
–08
2008
–09
2009
–10
2010
–11
2011
–12
2012
–13
2013
–14
2014
–15
2015
–16
2016
–17
£ pe
r st
uden
t (20
16-1
7 pr
ices
)
Academic year of entry into higher education
Teaching grant Fee loan subsidy Total subsidy Total resources
© Institute for Fiscal Studies Long-Run Comparisons of Spending per Pupil across Different Stages of Education
But the long-run government subsidy is lower than in 1990

Higher Education funding in England
£0
£5,000
£10,000
£15,000
£20,000
£25,000
£30,000
£35,000 19
90–9
1
1991
–92
1992
–93
1993
–94
1994
–95
1995
–96
1996
–97
1997
–98
1998
–99
1999
–00
2000
–01
2001
–02
2002
–03
2003
–04
2004
–05
2005
–06
2006
–07
2007
–08
2008
–09
2009
–10
2010
–11
2011
–12
2012
–13
2013
–14
2014
–15
2015
–16
2016
–17
£ pe
r st
uden
t (20
16-1
7 pr
ices
)
Academic year of entry into higher education
Teaching grant Fee loan subsidy Total subsidy Total resources
© Institute for Fiscal Studies Long-Run Comparisons of Spending per Pupil across Different Stages of Education
Graduate contribution
The difference is made up by an increasing graduate contribution

Higher Education funding in England
£0
£5,000
£10,000
£15,000
£20,000
£25,000
£30,000
£35,000 19
90–9
1
1991
–92
1992
–93
1993
–94
1994
–95
1995
–96
1996
–97
1997
–98
1998
–99
1999
–00
2000
–01
2001
–02
2002
–03
2003
–04
2004
–05
2005
–06
2006
–07
2007
–08
2008
–09
2009
–10
2010
–11
2011
–12
2012
–13
2013
–14
2014
–15
2015
–16
2016
–17
£ pe
r st
uden
t (20
16-1
7 pr
ices
)
Academic year of entry into higher education
Teaching grant Fee loan subsidy Total subsidy Total resources
© Institute for Fiscal Studies Long-Run Comparisons of Spending per Pupil across Different Stages of Education
In 2016-17 teaching grants only made up 9% of HE funding

Student support
£0
£1,000
£2,000
£3,000
£4,000
£5,000
£6,000 19
91–9
2 19
92–9
3 19
93–9
4 19
94–9
5 19
95–9
6 19
96–9
7 19
97–9
8 19
98–9
9 19
99–0
0 20
00–0
1 20
01–0
2 20
02–0
3 20
03–0
4 20
04–0
5 20
05–0
6 20
06–0
7 20
07–0
8 20
08–0
9 20
09–1
0 20
10–1
1 20
11–1
2 20
12–1
3 20
13–1
4 20
14–1
5
£ pe
r st
uden
t (20
16-1
7 pr
ices
)
Academic year
Average support
© Institute for Fiscal Studies Long-Run Comparisons of Spending per Pupil across Different Stages of Education
Support to cover students’ living costs has doubled over the last 25 years

Student support
£0
£1,000
£2,000
£3,000
£4,000
£5,000
£6,000 19
91–9
2 19
92–9
3 19
93–9
4 19
94–9
5 19
95–9
6 19
96–9
7 19
97–9
8 19
98–9
9 19
99–0
0 20
00–0
1 20
01–0
2 20
02–0
3 20
03–0
4 20
04–0
5 20
05–0
6 20
06–0
7 20
07–0
8 20
08–0
9 20
09–1
0 20
10–1
1 20
11–1
2 20
12–1
3 20
13–1
4 20
14–1
5
£ pe
r st
uden
t (20
16-1
7 pr
ices
)
Academic year
Maintenance grants Maintenance loans Average support
© Institute for Fiscal Studies Long-Run Comparisons of Spending per Pupil across Different Stages of Education
Maintenance grants were phased out in 2000, reintroduced in 2006, and abolished again in 2016.

Future Challenges
• Pattern of steadily declining resources has continued in recent years
• Potentially corrected by the introduction of the Teaching Excellence Framework
‒ Although this might create additional issues
• The cap on student numbers has been removed
© Institute for Fiscal Studies Long-Run Comparisons of Spending per Pupil across Different
Stages of Education

Summary
• Total upfront resources available per student have fallen in 18 out of the past 26 years
‒ Historically, because growth in student numbers has outstripped increases in teaching grants
‒ Recently, because tuition fees have been held fixed in nominal terms
• However, periodic tuition fee hikes has meant that total upfront resources are more than 50% higher than in 1990
• This has been funded by an increasing graduate contribution
© Institute for Fiscal Studies Long-Run Comparisons of Spending per Pupil across Different
Stages of Education

Comparisons
© Institute for Fiscal Studies Long-Run Comparisons of Spending per Pupil across Different Stages of Education

Spending across stages of education
£0
£2,000
£4,000
£6,000
£8,000
£10,000 19
89–9
0 19
90–9
1 19
91–9
2 19
92–9
3 19
93–9
4 19
94–9
5 19
95–9
6 19
96–9
7 19
97–9
8 19
98–9
9 19
99–0
0 20
00–0
1 20
01–0
2 20
02–0
3 20
03–0
4 20
04–0
5 20
05–0
6 20
06–0
7 20
07–0
8 20
08–0
9 20
09–1
0 20
10–1
1 20
11–1
2 20
12–1
3 20
13–1
4 20
14–1
5 20
15–1
6 20
16–1
7 20
17–1
8 20
18–1
9 20
19–2
0
Real
spe
ndin
g pe
r pup
il p
er y
ear (
2016
/17
pric
es)
Academic year
Early years Secondary school
Further education Higher education subsidy
© Institute for Fiscal Studies Long-Run Comparisons of Spending per Pupil across Different Stages of Education
Early years spending has grown from near zero in the early 1990s

Spending across stages of education
£0
£2,000
£4,000
£6,000
£8,000
£10,000 19
89–9
0 19
90–9
1 19
91–9
2 19
92–9
3 19
93–9
4 19
94–9
5 19
95–9
6 19
96–9
7 19
97–9
8 19
98–9
9 19
99–0
0 20
00–0
1 20
01–0
2 20
02–0
3 20
03–0
4 20
04–0
5 20
05–0
6 20
06–0
7 20
07–0
8 20
08–0
9 20
09–1
0 20
10–1
1 20
11–1
2 20
12–1
3 20
13–1
4 20
14–1
5 20
15–1
6 20
16–1
7 20
17–1
8 20
18–1
9 20
19–2
0
Real
spe
ndin
g pe
r pup
il p
er y
ear (
2016
/17
pric
es)
Academic year
Early years Secondary school
Further education Higher education subsidy
© Institute for Fiscal Studies Long-Run Comparisons of Spending per Pupil across Different Stages of Education
Primary school spending grew by more than 5% per year during the 2000s

Spending across stages of education
£0
£2,000
£4,000
£6,000
£8,000
£10,000 19
89–9
0 19
90–9
1 19
91–9
2 19
92–9
3 19
93–9
4 19
94–9
5 19
95–9
6 19
96–9
7 19
97–9
8 19
98–9
9 19
99–0
0 20
00–0
1 20
01–0
2 20
02–0
3 20
03–0
4 20
04–0
5 20
05–0
6 20
06–0
7 20
07–0
8 20
08–0
9 20
09–1
0 20
10–1
1 20
11–1
2 20
12–1
3 20
13–1
4 20
14–1
5 20
15–1
6 20
16–1
7 20
17–1
8 20
18–1
9 20
19–2
0
Real
spe
ndin
g pe
r pup
il p
er y
ear (
2016
/17
pric
es )
Academic year
Early years Secondary school
Further education Higher education subsidy
© Institute for Fiscal Studies Long-Run Comparisons of Spending per Pupil across Different Stages of Education
Secondary school spending has seen similar growth and protections to primary spending
Spending across stages of education
£0
£2,000
£4,000
£6,000
£8,000
£10,000 19
89–9
0 19
90–9
1 19
91–9
2 19
92–9
3 19
93–9
4 19
94–9
5 19
95–9
6 19
96–9
7 19
97–9
8 19
98–9
9 19
99–0
0 20
00–0
1 20
01–0
2 20
02–0
3 20
03–0
4 20
04–0
5 20
05–0
6 20
06–0
7 20
07–0
8 20
08–0
9 20
09–1
0 20
10–1
1 20
11–1
2 20
12–1
3 20
13–1
4 20
14–1
5 20
15–1
6 20
16–1
7 20
17–1
8 20
18–1
9 20
19–2
0
Real
spe
ndin
g pe
r pup
il p
er y
ear (
2016
/17
pric
es)
Academic year
Early years Secondary school
Further education Higher education subsidy
© Institute for Fiscal Studies Long-Run Comparisons of Spending per Pupil across Different Stages of Education
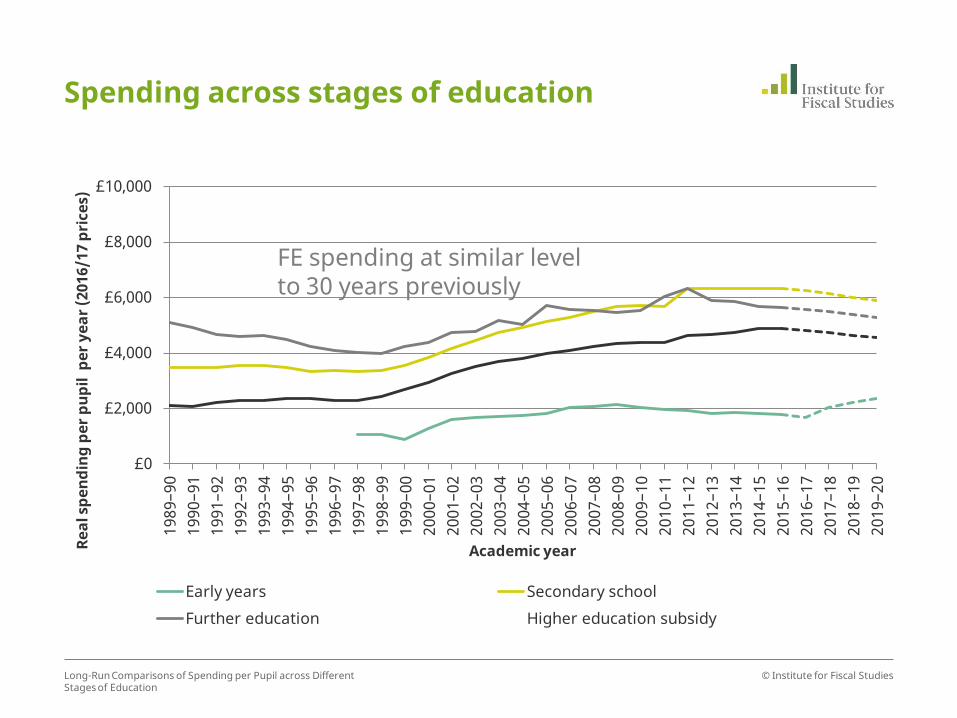
FE spending at similar level to 30 years previously

Spending across stages of education
£0
£2,000
£4,000
£6,000
£8,000
£10,000 19
89–9
0 19
90–9
1 19
91–9
2 19
92–9
3 19
93–9
4 19
94–9
5 19
95–9
6 19
96–9
7 19
97–9
8 19
98–9
9 19
99–0
0 20
00–0
1 20
01–0
2 20
02–0
3 20
03–0
4 20
04–0
5 20
05–0
6 20
06–0
7 20
07–0
8 20
08–0
9 20
09–1
0 20
10–1
1 20
11–1
2 20
12–1
3 20
13–1
4 20
14–1
5 20
15–1
6 20
16–1
7 20
17–1
8 20
18–1
9 20
19–2
0
Real
spe
ndin
g pe
r pup
il p
er y
ear (
2016
/17
pric
es)
Academic year
Early years Secondary school
Further education Higher education subsidy
© Institute for Fiscal Studies Long-Run Comparisons of Spending per Pupil across Different Stages of Education
HE resources have increased but long-run government subsidy has fallen

Spending across stages of education
0.0
0.5
1.0
1.5
2.0
2.5
3.0 19
89–9
0 19
90–9
1 19
91–9
2 19
92–9
3 19
93–9
4 19
94–9
5 19
95–9
6 19
96–9
7 19
97–9
8 19
98–9
9 19
99–0
0 20
00–0
1 20
01–0
2 20
02–0
3 20
03–0
4 20
04–0
5 20
05–0
6 20
06–0
7 20
07–0
8 20
08–0
9 20
09–1
0 20
10–1
1 20
11–1
2 20
12–1
3 20
13–1
4 20
14–1
5 20
15–1
6 20
16–1
7 20
17–1
8 20
18–1
9 20
19–2
0
Rati
o of
spe
ndin
g to
pri
mar
y sc
hool
spe
ndin
g pe
r pu
pil
Academic year Early years Secondary school
Further education Higher education resources
Higher education subsidy
© Institute for Fiscal Studies Long-Run Comparisons of Spending per Pupil across Different Stages of Education

Summary
• Following further cuts over the next five year Further Education spending will be no higher than 30 years previously.
• Increases Higher Education spending have been the result of the three major tuition fee reforms and represent increase graduate contributions
• The pattern of later (older) stages of education attracting higher levels of funding per student has significantly declined over the last 30 years.
© Institute for Fiscal Studies Long-Run Comparisons of Spending per Pupil across Different Stages of Education