long live the alien: is high genetic diversity a pivotal ... · logically very close (mohr 1965;...
TRANSCRIPT

Long live the alien: is high genetic diversity a pivotalaspect of crested porcupine (Hystrix cristata) long-lastingand successful invasion?
EMILIANO TRUCCHI ,*† BENOIT FACON,‡ PAOLO GRATTON,§ EMILIANO MORI,¶NILS CHR. STENSETH* and SISSEL JENTOFT***
*Centre for Ecological and Evolutionary Synthesis, Department of Biosciences, University of Oslo, PO Box 1066, Blindern
NO-0316, Norway, †Department of Botany and Biodiversity Research, University of Vienna, Rennweg 14, 1030 Vienna,
Austria, ‡INRA, UMR1062, CBGP, Avenue du Campus Agropolis, 34980 Montferrier-sur-Lez, France, §Department of
Primatology, Max Planck Institute for Evolutionary Biology, Deutscher Platz 6, 04130 Leipzig, Germany, ¶Department of
Agriculture, Forest and Food Science, University of Turin, L.go P. Braccini 2, 10095 Grugliasco, Italy, **Department of Natural
Sciences, University of Agder, 4604 Kristiansand, Norway
Abstract
Studying the evolutionary dynamics of an alien species surviving and continuing to
expand after several generations can provide fundamental information on the relevant
features of clearly successful invasions. Here, we tackle this task by investigating the
dynamics of the genetic diversity in invasive crested porcupine (Hystrix cristata) popu-lations, introduced to Italy about 1500 years ago, which are still growing in size, distri-
bution range and ecological niche. Using genome-wide RAD markers, we describe the
structure of the genetic diversity and the demographic dynamics of the H. cristatainvasive populations and compare their genetic diversity with that of native African
populations of both H. cristata and its sister species, H. africaeaustralis. First, we
demonstrate that genetic diversity is lower in both the invasive Italian and the North
Africa source range relative to other native populations from sub-Saharan and South
Africa. Second, we find evidence of multiple introduction events in the invasive range
followed by very limited gene flow. Through coalescence-based demographic recon-
structions, we also show that the bottleneck at introduction was mild and did not
affect the introduced genetic diversity. Finally, we reveal that the current spatial
expansion at the northern boundary of the range is following a leading-edge model
characterized by a general reduction of genetic diversity towards the edge of the
expanding range. We conclude that the level of genome-wide diversity of H. cristatainvasive populations is less important in explaining its successful invasion than spe-
cies-specific life-history traits or the phylogeographic history in the native source
range.
Keywords: gene surfing, inbreeding, invasive species, population dynamics, RAD sequencing
Received 27 March 2015; revision received 18 April 2016; accepted 2 May 2016
Introduction
One of the most relevant and debated questions in
invasive biology concerns the importance of standing
genetic diversity for successful invasions and
colonization of a novel range (Reed & Frankham 2003;
Frankham 2004; Facon et al. 2006; Roman & Darling
2007). In addition to the initial bottleneck at introduc-
tion, which may (Schmid-Hempel et al. 2007; Ciosi et al.
2008; Dlugosch & Parker 2008; Chapple et al. 2013) or
may not (Kolbe et al. 2004; Roman & Darling 2007;
Estoup & Guillemaud 2010; Hufbauer et al. 2013)
decrease the genetic diversity of the introduced propag-
ule, subsequent range expansion can also negatively
affect diversity (Edmonds et al. 2004; White et al. 2013),Correspondence: Emiliano Trucchi
E-mail: [email protected]
© 2016 John Wiley & Sons Ltd
Molecular Ecology (2016) 25, 3527–3539 doi: 10.1111/mec.13698

thus likely limiting the adaptive potential of invasive
populations and, ultimately, their further spread and/
or persistence (Shine et al. 2011). Nevertheless, low neu-
tral genetic diversity of the invasive species per se does
not necessarily result in reduced adaptive capability
(Dlugosch & Parker 2008). Rapid genetic adaptation in
response to changed selective pressures encountered in
the novel environment has been suggested as a possible
explanation of very successful colonization events
(Prentis et al. 2008) and, in a few cases, fast genetic
changes in relevant genes have been discovered (Van-
depitte et al. 2014). Indeed, past investigations have
often reported cases of successful biological invasions
despite low genetic diversity (e.g. Lavergne & Molofsky
2007; Hardesty et al. 2012). As such, other factors
related to ecological traits of the exotic species and/or
of the invaded ecosystem and coincidental events may
be more important than initial genetic diversity in
determining the success of an invasive population
(Zayed et al. 2007). However, the vast majority of stud-
ies of biological invasions have so far utilized systems
with a recent history of introduction and thus lack a
deeper temporal perspective (Strayer et al. 2006) leaving
us with a dearth of assessments on the long-term adap-
tive potential of successful biological invaders (but see
Cooling et al. 2012).
The crested porcupine, Hystrix cristata, was histori-
cally introduced to Italy (Italian peninsula and Sicily),
making it an excellent study system to test the impor-
tance of initial genetic diversity for an invasive popula-
tion to persist and spread. Ancient Romans very likely
brought this animal from North Africa as an exotic pet
for their villas and as a delicacy for their banquets: a
genetic survey based on three mitochondrial genes
identified the most likely source in North Africa (i.e.
Tunisia) and estimated the introduction event between
2500 and 1500 years ago (Trucchi & Sbordoni 2009).
Independent analyses of archaeological evidence and
iconographic documentation suggested that the intro-
duction occurred in late Antiquity or the early middle
ages (1500–1200 years ago) and that the species’ pres-
ence in Sicily is not supported before early modern
times (Masseti et al. 2010). Nevertheless, we expect a
lag time between the accidental release of captive ani-
mals and their spread into the invasive range, that is
when it would have been common enough to be found
in archaeological sites. Based on this, we can assume
that the introduction of H. cristata into peninsular Italy
likely started around 1500 years ago, and its popula-
tions are viable and still expanding after several hun-
dred generations. In this species, sexual maturity is
achieved at the age of ca. 1 year and the following
interlitter interval is about 91–112 days (Mohr 1965;
Weir 1974).
Records of the distribution of the porcupine in Italy
reveal a dramatic range expansion in the last
40–50 years (Angelici & Amori 1999; Mori et al. 2013).
During this period, the invasive population crossed the
Apennines and colonized the eastern side of the Italian
peninsula, passing the Po River in the Padana Plain
and getting as far north as the southern edge of the
Alps. Intriguingly, the newly colonized area is climati-
cally distinct from the pre-expansion range: warm tem-
perate continental climate vs. Mediterranean coastal
climate (Blasi et al. 2014). As the former climate type is
not present in the source area (North Africa), this sud-
den range shift may have been driven by a novel adap-
tation. In stark contrast with the range expansion in
North Italy, the extant populations in North Africa are
currently declining due to intense anthropic pressure
(Saleh & Basuony 1998; Nowak 1999; Cuzin 2003;
Mohamed 2011) and the ongoing aridification of the
region (Thuiller et al. 2006; Kr€opelin et al. 2008). Addi-
tionally, the species still commonly occurs in sub-
Saharan Africa, from Senegal to Ethiopia and Tanzania.
A sibling species, H. africaeaustralis (Cape porcupine), is
found in austral Africa, from the Democratic Republic
of Congo and Tanzania to South Africa (Nowak 1999).
These two sister species are phylogenetically and eco-
logically very close (Mohr 1965; Trucchi & Sbordoni
2009) and their ranges of distribution largely overlap in
East Africa, meaning that H. africaeaustralis can be used
as an excellent comparison with H. cristata for assessing
the level of genetic diversity in native populations.
Employing a vast RAD sequencing data set of more
than 30 000 loci, we describe the genetic structure and
diversity of the invasive Italian H. cristata population
and compare it to the populations of H. cristata and
H. africaeaustralis found in Africa. We also investigate
the smaller scale genetic pattern of the Italian popula-
tion that is currently expanding northwards. Finally, we
assess how the introduction and expansion processes
have affected the genetic diversity along the whole colo-
nization trajectory, and investigate whether high gen-
ome-wide diversity was, and still is, an important
aspect of H. cristata’s successful invasion.
Methods
Sampling
A total of 280 H. cristata samples (244 from Italy and 36
from North-Central Africa) and 43 H. africaeaustralis
samples from southern Africa were collected in the field
between 2004 and 2012 from Egypt, Ivory Coast, Ghana,
Nigeria, Tanzania, Mozambique, Zambia and Namibia.
Most of the samples were quills collected on the
ground, but eight of them (of H. cristata from Italy)
© 2016 John Wiley & Sons Ltd
3528 E. TRUCCHI ET AL.

were from muscle tissue (roadkill). Age and quality of
preservation varied greatly across samples. DNA was
extracted using the DNase Blood and Tissue kit (Qia-
gen) following manufacturer’s instructions. Quality and
quantity of DNA was checked to identify high-quality
samples suitable for genomic analysis. Concentration of
DNA was measured using a fluorimetric method
(Qubit; Invitrogen), and quality was checked using a
spectroscopic method (Nanodrop) and by visual inspec-
tion of degradation after gel electrophoresis. Given the
uneven quality and DNA preservation of the sampled
materials, ca. 80% of the samples were discarded as
unsuitable for genomic analyses because of strong DNA
degradation, and ca. 10% of the remaining samples
failed in the sequencing run.
A total of 50 samples of H. cristata (38 from the inva-
sive Italian populations and 12 from native African
populations) and 11 samples of H. africaeaustralis were
selected for RAD sequencing (Fig. 1, Table S1, Support-
ing information). Samples were grouped according to
species (H. cristata: H.cri; H. africaeaustralis: H.afr) and
geographic origin (H.cri-SS: sub-Saharan Africa; H.cri-NA:
North Africa; H.cri-IT-Sicily: Sicily, Italy; H.cri-IT-south:
South Italy; H.cri-IT-centre: Central Italy; H.cri-IT-north:
North Italy). In addition, samples in H.cri-IT-north
were further grouped according to the year of estab-
lishment of a population (Angelici et al. 2003; Mori
et al. 2013) in the area they were sampled (H.cri-IT-
north-1959: distribution in 1959; H.cri-IT-north-1999:
distribution in 1999; H.cri-IT-north-2012: distribution in
2012).
RAD sequencing
The RAD sequencing protocol from Baird et al. (2008)
was slightly modified to prepare the libraries. Approxi-
mately 100 ng of genomic DNA per sample was
digested with the restriction enzyme SbfI (NEB). Each
sample was ligated to a unique barcoded P1 adapter
prior to pooling in a single library. Libraries were
sheared by sonication on a Bioruptor (Diagenode)
where the target size range fraction of 300–500 bp was
Fig. 1 Distribution of the genotyped individuals in Africa (left panel) and Italy (right panel). Colours identify a priori groups defined
in the text: H.afr (light blue), H.cri-SS (orange), H.cri-NA (purple), H.cri-IT-Sicily (blue), H.cri-IT-south (light purple), H.cri-IT-centre
(green), H.cri-IT-north (red). The recent range expansion documented in North Italy is also shown: the black solid line represents the
north-easternmost distribution in 1959 (H.cri-IT-north-1959); the large-dashed black line represents the northernmost distribution in
1999 (H.cri-IT-north-1999); and the small-dashed black line represents the northernmost distribution in 2012 (H.cri-IT-north-2012)
according to Angelici & Amori (1999) and Mori et al. (2013). Individuals from Italy included in both the global and the invasive_re-
duced data set are not marked with an asterisk; in the text, we refer to this group of samples as H.cri-IT.
© 2016 John Wiley & Sons Ltd
INVASIVE CRESTED PORCUPINE GENOMICS 3529

achieved after seven cycles of sonication (30 s ON, 30 s
OFF). After concentration to 25 lL by DNA capture on
magnetic beads (beads solution: DNA = 0.8:1), libraries
were size selected by gel electrophoresis and manual
excision. Capture on magnetic beads (beads solution:
DNA = 0.8: 1) was then employed in all following
purification steps (i.e. after blunt-end repairing, poly-A
tailing, P2 adapter ligation and library enrichment by
PCR). To reduce amplification bias, PCRs were split in
8 9 12.5 lL aliquots per library, separately amplified
and then pooled again. Libraries were quantified by a
fluorimetric-based method (Qubit, Invitrogen), and
molarity was checked on an Agilent Bioanalyzer chip
(Invitrogen). A final volume of ca. 20 lL per library
with a DNA concentration of 20–25 ng/lL was submit-
ted for paired-end 100-bp sequencing (two lanes on a
ILLUMINA HiSeq2000) at the Norwegian Sequencing
Centre, University of Oslo.
Bioinformatic analyses
Raw reads were processed using the scripts included in
the Stacks package (Catchen et al. 2013) on the ABEL
cluster server facility at the University of Oslo. Raw
reads were quality filtered and demultiplexed according
to individual barcodes using the script process_radtags.pl
in the Stacks package with default settings. Cleaned
reads were then aligned into loci and SNPs called
across individuals using the script denovo_map.pl in the
Stacks package: the minimum coverage to call a stack of
identical reads was set to 10 (option -m), the maximum
number of mismatches allowed when joining stacks into
the same locus to 7 (option -n), and the maximum num-
ber of mismatches allowed when joining loci across
individuals to 7 (option -N). To capture different levels
of genetic variability within and between populations of
the two species, we built three separate catalogs: (i) one
catalog including all Italian and North Africa individu-
als (invasive data set, 42 individuals), (ii) one catalog
including a subset of the Italian individuals taking into
account both an even representation of the invasive
range and the highest average coverage across
genotyped loci (invasive_reduced data set, 16 samples:
H.cri-IT; Fig. 1) and (iii) one catalog including the same
subset of high-coverage Italian individuals as in the
previous catalog as well as all of the African individu-
als (global data set, 39 individuals). We included only a
small subset of the invasive samples (16) in the global
catalog to avoid overweighting the genetic diversity in
the invasive population, where the largest proportion of
samples were analysed, and to minimize the SNPs
ascertainment bias in this data set as a result. The func-
tion export_sql.pl in the Stacks package was used to
extract loci information from each catalog applying a
global threshold of 25% to the maximum number of
missing sample per locus and 10 to the maximum num-
ber of SNPs per locus. This high threshold for the maxi-
mum number of SNPs per locus, especially in the case
of the invasive population, was justified by the consid-
eration that filtering loci on the basis of their shallow
variation might introduce a severe bias towards recent
coalescent events. In the case of the invasive popula-
tion, the only possibility to retrieve the genetic signa-
ture of a bottleneck is to find divergent alleles whose
coalescence time is deeper than the bottleneck itself and
that can provide information about the prebottleneck
ancestral population size. In addition, the accumulation
of substitutions along the genome is a random process
with a mean rate and extreme cases are expected. A
careful screening of putative paralogous loci or nonran-
dom distribution of SNPs along each locus was then
performed as follows. We wrote custom Python scripts
(see Supplementary Materials) to further filter the data
set in order to exclude loci with more than two alleles
per individual, with heterozygosity above 0.75, or
deleveraged by the Stacks algorithm. We found an
increase in the number of SNPs called in the last 10
positions across all of the loci (Fig. S1, Supporting infor-
mation); trimming the raw reads of 10 bp and perform-
ing again the SNP calling produced the same pattern.
We believe this is an artefact of the SNP calling algo-
rithm, so any SNP recorded in the last 10 base pairs of
each locus was considered unreliable and discarded.
Further filtering to reduce missing data was applied on
a case-by-case basis, according to each downstream
analysis.
Genetic structure of native and invasive populations
The global data set was used to infer the overall
structure among native and invasive populations of
the two porcupine species. Following Wagner et al.
(2013), loci were concatenated into a single sequence
per sample, coding heterozygous sites as ambiguities
in agreement with the IUPAC code. The whole
sequence of each locus was included to get empirical
estimates of base composition and percentage of
invariant sites. A maximum-likelihood algorithm with
a GTR + G + I substitution model was employed to
reconstruct the phylogenetic tree of our samples using
100 rapid bootstrap inferences and thereafter a thor-
ough ML search in RAXML 7.2.8 (Stamatakis 2006).
Results were visualized and edited in FigTree 1.4
(http://tree.bio.ed.ac.uk/software/figtree/). Although
this cannot be considered a true phylogenetic recon-
struction, this random concatenation of recombining
genomic fragments has proven to be informative
(Wagner et al. 2013).
© 2016 John Wiley & Sons Ltd
3530 E. TRUCCHI ET AL.

The invasive data set was then used to study the
fine-scale geographic structure of the H. cristata invasive
population and its relationship with North Africa
source population. First, using all of the SNPs in each
locus and all of the samples in the data set (H.cri-IT
and H.cri-NA; Fig. 1), we performed a neighbour-join-
ing network (NeighborNet) analysis (Bryant & Moulton
2004) based on uncorrelated p-distances in Splitstree
(Huson & Bryant 2006). We then performed a principal
component analysis (PCA) reducing our data set to only
one randomly chosen SNP per locus. To better capture
the variance in the invasive range, only individuals
belonging to the invasive population (H.cri-IT; Fig. 1)
were included in the PCA, while individuals from
North Africa were excluded. Given that PCA is very
sensitive to missing data (in this case, missing loci in
each individual), we further filtered our data set,
removing four individuals with more than 50% missing
loci (EMR01, ITA09, SSC01 and LRM03). The strict fil-
tering in this second analysis was necessary because
samples with too many missing loci tend to be unas-
signed (e.g. appear at the centre of the axes). The glPca
function in the R packages ‘adegenet’ was used for calcu-
lations.
Demography of the invasive population
We used RAD loci genotyped in the high-coverage Ital-
ian individuals (H.cri-IT; Fig. 1) to reconstruct the
demographic history of the invasive population follow-
ing an approach recently proposed by Trucchi et al.
(2014) that has been proven to be particularly efficient
in reconstructing recent demographic events (tutorial
available at http://www.emilianotrucchi.it/images/
EBSP_RADseq_tutorial.pdf). In short, a selection of
highly variable RAD loci with more than 3 SNPs per
locus are used as short sequences in a coalescent the-
ory-based multilocus analysis (Extended Bayesian Sky-
line plot; Heled & Drummond 2008) implemented in
BEAST 1.7.4 (Drummond & Rambaut 2007). Four random
selections of 50 loci with 4–9 SNPs (no loci with more
than nine SNPs passed our filtering criteria) from the
invasive_reduced data set were used in four replicated
runs and checked for convergence. Analyses were per-
formed as follows: (i) nucleotide substitution models,
clock models and tree prior models were unlinked
across loci; (ii) the nucleotide substitution model was
set as a HKY with empirical base frequency; (iii) a strict
molecular clock was set for each marker with a uniform
prior distribution of the substitution rate bounded
within 0.5 and 0.005 sub/s/Myr; (iv) the Extended
Bayesian Skyline plot (EBSP) was selected as a tree
prior model. A total of 200 million iterations were set as
run length. In addition, we ran the EBSP analyses
adding the mtDNA Control Region sequences of the
invasive population published in Trucchi & Sbordoni
(2009) to a random selection of 50 RAD loci. We used
this analysis to calibrate our demographic reconstruc-
tion, applying a substitution rate of 0.2 substitution/
site/Myr to the mtDNA marker only and leaving the
substitution rates for the RAD loci to be estimated in
the analysis. The substitution rate employed for the cali-
bration was derived from the rate estimated in another
rodent species (Mus musculus; Rajabi-Maham et al. 2008)
and corrected for the longer generation time in porcu-
pines. An HKI with Gamma (4 classes) and Invariant
site substitution model and a strict clock model were
implemented for the mtDNA Control Region. Three
replicates were checked for convergence. All analyses
were run on a 24 CPUs server at the University of Oslo.
Results were checked on TRACER 1.6 (http://
tree.bio.ed.ac.uk/software/tracer), and the plot of the
EBSP data was drawn in R (R Development Core Team
2011). To take into account the structure in the invasive
population, we also repeated the EBSP analysis using
samples from only one of the groups (H.cri-IT-north).
Heterozygosity estimates
Events of introduction into a new range are expected to
induce a reduction in heterozygosity in the invasive
population, and quick range expansions in the invasive
range could produce a further clinal reduction in
heterozygosity towards the expansion front. Neverthe-
less, levels of individual heterozygosity ultimately
depend on levels of inbreeding (Hoffman et al. 2014),
and are influenced by a variety of demographic process
at different temporal and spatial scales. Observed and
expected heterozygosity were estimated in native and
invasive populations/groups of individuals (Fig. 1)
using the global and the invasive data sets. To test for
the effects of the introduction event, we used the global
data set, using the following partition of native and
invasive individuals: H.afr, H.cri-SS, H.cri-NA and
H.cri-IT. To test for local effects in the different invasive
populations, we used the invasive data set and the
groups H.cri-IT-north, H.cri-IT-central, H.cri-IT-south,
H.cri-IT-Sicily and H.cri-NA. To test for the effects of
the recent range expansion in north Italy, we used the
invasive data set and the groups H.cri-IT-north-1959,
H.cri-IT-north-1999 and H.cri-IT-north-2012.
Despite their relevance as proxies for levels of
inbreeding (Slate & Pemberton 2002), accurate estimates
of individual observed heterozygosity from multilocus
data are difficult to calculate (see Aparicio et al. 2006
for a review). We first estimated individual observed
heterozygosity as the number of heterozygous loci
divided by the number of genotyped loci in each
© 2016 John Wiley & Sons Ltd
INVASIVE CRESTED PORCUPINE GENOMICS 3531

individual (Ho ind). As our RADseq loci were not
mapped to a reference genome, a fraction of nonorthol-
ogous loci could have been included in the analysis and
may appear as loci with artificially high heterozygosity.
To address this issue, we downweighted the contribu-
tion of each locus according to its observed heterozy-
gosity across individuals (Ho ind-norm). To apply this
correction, we first calculated the observed locus-by-
locus heterozygosity across all of the individuals in the
data set (Ho loc = number of heterozygous genotypes/
number of genotype at a locus). Then, we recalculated
the individual observed heterozygosity correcting the
contribution of each locus by a factor 1 � Ho loc.
Another important aspect to take into account when
estimating observed individual heterozygosity from
next-generation data is that the probability of scoring a
heterozygous genotype at a locus is a function of its
depth of coverage. To correct for this, we included the
coverage depth of each individual as a predictor of
individual observed heterozygosity in a linear model
and we calculated the deviation of each individual from
the model (i.e. analysis of model’s residuals). Individ-
ual-based residuals were then grouped as described
above and compared. An additional analysis using log-
transformed values for depth of coverage was also per-
formed to take into account the fact that the probability
of retrieving both alleles at a heterozygous locus is
expected to reach a plateau. The significance of differ-
ences in observed heterozygosity among geographic
groups of samples was assessed by F-test comparing a
linear model where observed heterozygosity was pre-
dicted by both the number of reads and the geographic
origin of the sample with a reduced model with the
number of reads as the only predictor. When the F-test
revealed at least a statistical trend (p < 0.1), the statisti-
cal significance of all pairwise contrasts among geo-
graphically defined groups of samples was calculated
by running the full linear model N � 1 times (with
N = number of groups) and setting, each time, a differ-
ent group as the reference level for the ‘group’ factor.
Analyses were performed using custom Python scripts
(available as Supplementary Material) and basic R func-
tions.
Expected heterozygosity (i.e. gene diversity; He) was
also estimated for each of the groups described above
according to the formula in Nei (1978). A minimum
number of three individuals genotyped per group were
required to include a locus in the analysis. As com-
pared to Ho ind, He is less biased by the individual
sequencing coverage because rare alleles in the popula-
tion still have 50% probability to be sequenced in those
individuals that carry them. Even if information on the
population structure in the native range was scarce,
estimation of population-level Watterson’s theta and p
was also calculated for both native and invasive
populations. Analyses were performed using custom
Python scripts (available as Supplementary Material).
Results
RAD sequencing data
After demultiplexing, the average number of single
reads retained per individual was between ca. 500 000
and ca. 7 100 000. The starting quality of the DNA
strongly influenced this inequality across individuals,
with extractions from muscle tissue resulting in a much
higher sequencing yield than extractions from quills.
The total number of loci retained in each catalog after
filtering was as follows: 17 504 in the invasive_reduced,
30 506 in the invasive and 19 559 in the global data set
with an average coverage per allele per individual of
ca. 15X. Distribution of SNPs per position and of indi-
viduals genotyped per locus is shown in Fig. S2 (Sup-
porting information).
Genetic structure of native and invasive populations
The maximum-likelihood tree reconstructed using the
information provided by the global data set showed a
clear differentiation between H. africaeaustralis and
H. cristata (Fig. 2); samples belonging to H. africaeaus-
tralis formed a cluster of mostly unresolved relation-
ships with little or no geographic structure in the
genetic diversity. On the other hand, H. cristata popula-
tions showed a marked geographic differentiation. In
this species, the genetic diversity mirrored its distribu-
tion from East Africa (Tanzania and Ethiopia), where
H. cristata overlaps with H. africaeaustralis, to the west
(Nigeria, Ivory Coast, Burkina Faso and Senegal), and
then northward, to the Mediterranean coast of Africa
and Italy (Morocco, Tunisia, Egypt, Italy). In the inva-
sive range, the genetic structure of H. cristata samples
clearly followed their geographic origin with clusters of
individuals corresponding to H.cri-IT-north, H.cri-IT-
centre, H.cri-IT-south and H.cri-IT-Sicily. The latter also
included individuals from Tunisia and Egypt (from the
group H.cri-NA).
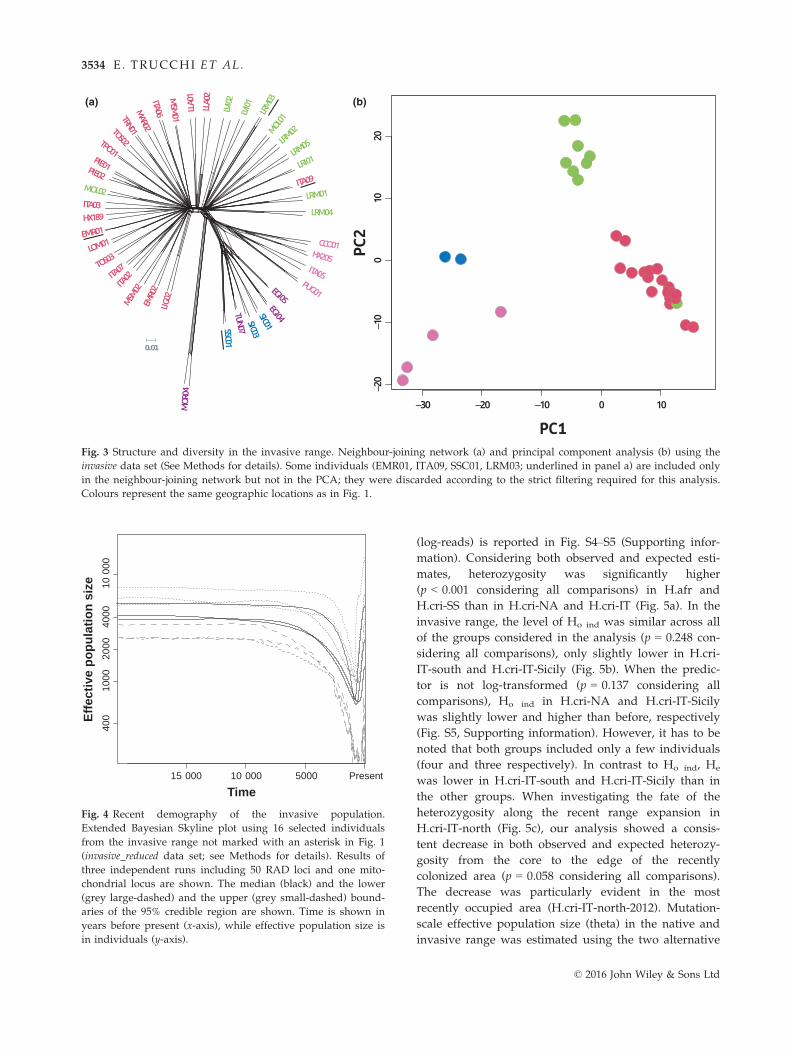
The structure of the genetic diversity in the H. cristata
invasive range was investigated in detail using the inva-
sive data set. Results of the neighbour-joining network
analysis (Fig. 3a) and of the PCA (Fig. 3b) were consis-
tent with each other and with the maximum-likelihood
tree estimated on the global data set. The same four
clusters, as described above, clearly characterized the
invasive range. Only two individuals did not cluster
according to their geographic origin (Fig. 1): ITA09
(from the group H.cri-IT-north), sampled at the early
© 2016 John Wiley & Sons Ltd
3532 E. TRUCCHI ET AL.

stage of the range expansion in the northernmost area
occupied in Italy, and MOL02 (from the group H.cri-IT-
centre), sampled in central Italy. In all of the analyses,
these two samples clustered in H.cri-IT-centre and
H.cri-IT-north, respectively.
Demography of the invasive population
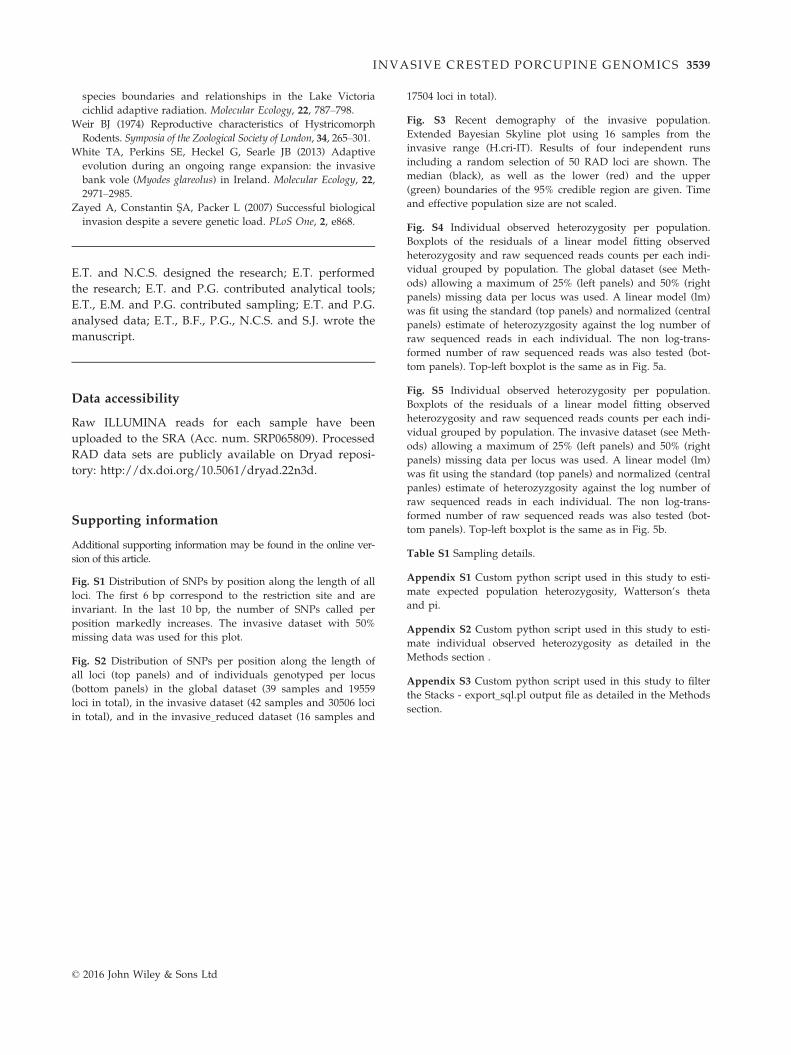
The reconstruction of the past demography of the inva-
sive population showed a clear signature of a recent,
although mild, bottleneck (Fig. 4). According to our
result, the coalescent effective population size at intro-
duction corresponded to few hundred individuals, and
it was only five times lower than before. The time of
the bottleneck is estimated to be within the last
2000 years when taking into account the 95% confi-
dence intervals. The calibrated demography showed a
decrease in population size starting well before the
putative introduction event, and this decrease
corresponds to the end of the African Humid Period
(AHP), when the green Sahara was turning into a desert
(deMenocal et al. 2000). The bottleneck was also found
when the RAD loci only and no mtDNA markers were
included in the analyses (Fig. S3, Supporting informa-
tion), but it was not detectable when the mtDNA was
analysed on its own (Trucchi & Sbordoni 2009).
Independent runs employing only individuals from
H.cri-IT-north produced the same demographic recon-
struction, ruling out structure in the invasive popula-
tion as a source of the observed pattern (not shown).
Heterozygosity estimates
Estimates of individual observed and population
expected heterozygosity are shown in Fig. 5. Robustness
of this analysis to the amount of missing data, to the
correction for highly heterozygous loci (Ho ind-norm),
and to the log-transformation of the predictor
Fig. 2 Global genetic structure. Maximum-likelihood tree built using the global data set (all individuals not marked with an asterisk
in Africa and Italy in Fig. 1). Nodes with bootstrap support of >99% are shown (grey filled circles). Colours represent the same geo-
graphic locations as in Fig. 1.
© 2016 John Wiley & Sons Ltd
INVASIVE CRESTED PORCUPINE GENOMICS 3533
(log-reads) is reported in Fig. S4–S5 (Supporting infor-
mation). Considering both observed and expected esti-
mates, heterozygosity was significantly higher
(p < 0.001 considering all comparisons) in H.afr and
H.cri-SS than in H.cri-NA and H.cri-IT (Fig. 5a). In the
invasive range, the level of Ho ind was similar across all
of the groups considered in the analysis (p = 0.248 con-
sidering all comparisons), only slightly lower in H.cri-
IT-south and H.cri-IT-Sicily (Fig. 5b). When the predic-
tor is not log-transformed (p = 0.137 considering all
comparisons), Ho ind in H.cri-NA and H.cri-IT-Sicily
was slightly lower and higher than before, respectively
(Fig. S5, Supporting information). However, it has to be
noted that both groups included only a few individuals
(four and three respectively). In contrast to Ho ind, He
was lower in H.cri-IT-south and H.cri-IT-Sicily than in
the other groups. When investigating the fate of the
heterozygosity along the recent range expansion in
H.cri-IT-north (Fig. 5c), our analysis showed a consis-
tent decrease in both observed and expected heterozy-
gosity from the core to the edge of the recently
colonized area (p = 0.058 considering all comparisons).
The decrease was particularly evident in the most
recently occupied area (H.cri-IT-north-2012). Mutation-
scale effective population size (theta) in the native and
invasive range was estimated using the two alternative
(a) (b)
Fig. 3 Structure and diversity in the invasive range. Neighbour-joining network (a) and principal component analysis (b) using the
invasive data set (See Methods for details). Some individuals (EMR01, ITA09, SSC01, LRM03; underlined in panel a) are included only
in the neighbour-joining network but not in the PCA; they were discarded according to the strict filtering required for this analysis.
Colours represent the same geographic locations as in Fig. 1.
Fig. 4 Recent demography of the invasive population.
Extended Bayesian Skyline plot using 16 selected individuals
from the invasive range not marked with an asterisk in Fig. 1
(invasive_reduced data set; see Methods for details). Results of
three independent runs including 50 RAD loci and one mito-
chondrial locus are shown. The median (black) and the lower
(grey large-dashed) and the upper (grey small-dashed) bound-
aries of the 95% credible region are shown. Time is shown in
years before present (x-axis), while effective population size is
in individuals (y-axis).
© 2016 John Wiley & Sons Ltd
3534 E. TRUCCHI ET AL.

estimators p and Watterson’s: 0.27 and 0.30 in H.afr,
0.35 and 0.32 in H.cri-SS, 0.22 and 0.18 in H.cri-NA,
0.22 and 0.20 in H.cri-IT.
Discussion
Pivotal drivers of successful invasions
The H. cristata populations introduced in Italy more
than 1500 years ago – and still expanding – are the
result of an extremely successful invasion (Trucchi &
Sbordoni 2009; Masseti et al. 2010; Mori et al. 2013). Our
analyses demonstrate that both genetic diversity, mea-
sured as expected heterozygosity (He), and inbreeding,
measured as individual observed heterozygosity (Ho
ind), in the invasive populations are lower than in the
natural populations of both H. cristata and H. africaeaus-
tralis from sub-Saharan and South Africa (Fig. 5a).
However, genetic diversity in the native populations of
H. cristata from the source range in North Africa is sim-
ilar or slightly lower than in the invasive range. Includ-
ing only four individuals from different geographic
areas, the sample from North Africa is rather small and
does not allow us to get conclusive information on the
genetic diversity of the source population. Nevertheless,
it has to be noted that individuals from Sicily, cluster-
ing together with those from Tunisia and Egypt (Fig. 3),
show very similar levels of genetic diversity (Fig. 5b)
and support the hypothesis that genetic diversity in the
source population was lower than in other sub-Saharan
populations. On the other hand, the main finding of
our study (i.e. successful invasion and colonization
despite low genetic diversity) is supported by the com-
parison between the invasive population and the two
native populations from sub-Saharan and South Africa.
Relative effective population sizes of native and inva-
sive populations, calculated both on the basis of segre-
gating sites and pairwise differences, are consistent
with the heterozygosity estimates and also support the
conclusion that the introduction bottleneck left a minor,
if not negligible, signature on the invasive population.
The effective population size in the source population
(H.cri-NA) is lower as compared to other native popu-
lations (H.cri-SS and H.afr) supporting a past history of
(a)
(b)
(c)
Fig. 5 Observed and expected heterozygosity in native and
invasive populations. Residuals of the model Ho ind ~ log(raw
reads) and He as deviation from the mean are analysed across
the native and invasive range (p < 0.001 considering all com-
parisons) using the global data set (a), across the invasive and
the source native range (p = 0.237 considering all comparisons)
using the invasive data set (b), and across the recent expansion
range (p = 0.058 considering all comparisons) using the invasive
data set (c). Pairwise significance between populations/groups
is reported only in case the p-value for the geographic factor
across all comparisons was below 0.1 (a and c panels). p-value
pairwise: ‘.’ <0.1; ‘*’ <0.05; ‘**’ <0.01; ‘***’ <0.001. Colours
and patterns represent the same geographic locations as in
Fig. 1.
© 2016 John Wiley & Sons Ltd
INVASIVE CRESTED PORCUPINE GENOMICS 3535

contraction and fragmentation in the North Africa
range.
Our demographic reconstruction of the invasive popu-
lations clearly showed a mild bottleneck (with a few hun-
dred individuals at the lowest point) that can be
calibrated at the introduction time (Fig. 4). Nevertheless,
the marked genetic structure found in the invasive range
(Fig. 3) supports a multiple introduction scenario (in con-
trast to a single massive introduction and naturalization
of hundreds of individuals), where many small propag-
ules were introduced over time by continuous commer-
cial trading. Indeed, Sicily and South Italy could have
even been colonized at a later stage as suggested by the
higher genetic (Fig. 2, 4) and morphological (Angelici
et al. 2003) similarity with North African populations and
further supported by the analysis of historical records
(Masseti et al. 2010). Interestingly, very limited admix-
ture among different propagules should have character-
ized the demographic dynamics of the invasive
populations to retrieve such a clear structure today. Thus,
increased genetic diversity through admixture in the
newly colonized area was not necessary for the long per-
sistence of this invasive species. In such cases, limiting
connectivity among different invasive propagules would
be of little to no help in preventing the colonization (see
Rius & Darling 2014 for a review).
Another important implication of our study is that
initial genome-wide diversity does not necessarily
explain an invasive species’ success. Even if high
genetic diversity appears to be positively correlated
with success in the early phases of colonization (Fors-
man 2014), the correlation between genetic diversity
and long-term viability (and evolvability) of an invasive
species could be less straightforward than it intuitively
seems (Dlugosch et al. 2015). Indeed, several studies
described successful invasions despite an initial low
genetic diversity (e.g. Zayed et al. 2007; Harrison &
Mondor 2011) or, alternatively, reporting an increased
diversity in the invasive range (e.g. Lavergne & Molof-
sky 2007; Signorile et al. 2014). We suggest that a thor-
ough understanding of the phylogeographic history as
well as the phenotypic and genomic traits of the source
populations is necessary to clearly identify common fea-
tures of highly invasive species.
In the case of H. cristata, introduced individuals were
likely sourced from North African populations that
already had low genetic diversity. In fact, North African
populations were (and still are) suffering from the ongo-
ing desertification of the Sahara, which started approxi-
mately 6000 years ago (deMenocal et al. 2000). This long
history of habitat fragmentation after the African Humid
Period is likely to have caused contraction and isolation
of North African populations, thus increasing inbreeding
and decreasing (local) genetic diversity. One of the short-
term effects of inbreeding is an increased probability that
an individual could carry recessive deleterious alleles in
homozygosity, decreasing its fitness and, in general,
reducing the viability of the small population (Charles-
worth & Willis 2009). Nevertheless, if a small population
survives a long period of inbreeding, the expectation is
that some (or most) of the deleterious alleles have already
been exposed to selection and likely purged from its gene
pool (Crow 1970), making that population more resistant
to further inbreeding (but see Crnokrak & Barrett 2002
for a review). This has been shown in laboratory experi-
ments where higher fitness was found in invasive popu-
lations that experienced mild bottlenecks and high
inbreeding in the past compared to native populations
that never experienced a bottleneck (Facon et al. 2011;
Tayeh et al. 2013). The long history of fragmentation and
isolation of H. cristata in North Africa could have then
favoured the purging of several deleterious alleles in the
source gene pool. Individuals originating from these pop-
ulations could have been less susceptible to the negative
effects of small population size at introduction and, as a
result, more efficient in establishing a viable population
in the invasive range.
Recent invasive evolutionary dynamics
In this study, we further demonstrate that the dramatic
range expansion of H. cristata recorded in the last
50 years in Italy is following a leading-edge pattern
(Hewitt 1996), with the north population acting as the
only colonization source (Fig. 1, 2, 4). One exception in
our data set is the sample collected in North Italy
(ITA09), at an early stage of the range expansion, which
is genetically similar to the Central Italy population
(H.cri-IT-centre). This mismatch could be explained by
labelling error or could actually be the result of long-
distance dispersal due to human-mediated translocation
of individuals (Mori et al. 2013). The same reasoning
could be applied to the sample in Central Italy
(MOL02) that clusters with the northern group.
Our analyses reveal a clear decrease in the genetic
diversity with the year of colonization (Fig. 5c), mainly
as individual observed heterozygosity but also in terms
of expected heterozygosity at the northernmost edge of
the expansion. The overall pattern of genetic diversity
is consistent with expectations drawn from the gene
surfing model (Edmonds et al. 2004; DeGiorgio et al.
2011). According to this model, genetic diversity is
reduced at the leading edge of the expansion, whereas
local gene flow and admixture is expected to balance
the diversity loss at the trailing edge. However, if there
is any spatial constraint in the newly colonized area
(mountain ridges, rivers), it will be more difficult to re-
establish the level of diversity present at the original
© 2016 John Wiley & Sons Ltd
3536 E. TRUCCHI ET AL.

core of the expansion (Excoffier et al. 2009). The moun-
tain ridge along the Italian peninsula (Apennines) and
the main river in the Padana Plain (Po) could act as
constraints to future gene flow in the expansion range.
It remains to be investigated what the main driver of
the observed range expansion is. At least three hypothe-
ses can be proposed as an explanation: (i) the reduced
anthropic pressure due to the wide-scale abandonment
of the countryside after the Second World War and the
legal protection of this species since 1980, (ii) the effect
of ongoing climate change (for analyses of climate
change in Italy cf. Brunetti et al. 2006) and (iii) an
emerging adaptation in the north population that
allowed the colonization despite relatively novel climate
conditions (from Mediterranean subcoastal to warm
temperate areas; Blasi et al. 2014). Based on the solid
background about the structure and the dynamics of
the neutral genetic diversity provided in this study, fur-
ther analyses should focus on putative adaptive
response(s) in the expanding invasive population, aim-
ing at disentangling the effects of demographic pro-
cesses from those of selection.
Acknowledgements
We would like to thank all of the colleagues and friends who
kindly helped providing samples from all over Africa. We
thank Anna Mazzarella for helpful comments on the early ver-
sion of the manuscript and four anonymous reviewers for their
excellent contribution. This study was supported by Marie
Curie Intra European Fellowships (FP7-PEOPLE-IEF-2010,
European Commission; project no. 252252 to E.T.) and by the
Centre for Ecological and Evolutionary Synthesis, Department
of Biosciences, University of Oslo, Norway.
References
Angelici FM, Amori G (1999) Distribution of the Crested porcu-
pine Hystrix cristata L., 1758 in peninsular Italy and Sicily. Bol-
lettino del Museo Regionale di Scienze Naturali (Torino), 16, 83–88.Angelici FM, Capizzi D, Amori G, Luiselli L (2003) Morphomet-
ric variation in the skulls of the crested porcupine Hystrix cris-
tata from mainland Italy, Sicily, and northern Africa.
Mammalian Biology – Zeitschrift f€ur S€augetierkunde, 68, 165–173.Aparicio JM, Ortego J, Cordero PJ (2006) What should we
weigh to estimate heterozygosity, alleles or loci? Molecular
Ecology, 15, 4659–4665.Baird NA, Etter PD, Atwood TS, et al. (2008) Rapid SNP dis-
covery and genetic mapping using sequenced RAD markers.
PLoS One, 3, e3376.
Blasi C, Capotorti G, Copiz R et al. (2014) Classification and
mapping of the ecoregions of Italy. Plant Biosystems, 148,
1255–1345.Brunetti M, Maugeri M, Monti F, Nanni T (2006) Temperature
and precipitation variability in Italy in the last two centuries
from homogenised instrumental time series. International
Journal of Climatology, 26, 345–381.
Bryant D, Moulton V (2004) Neighbor-net: an agglomerative
method for the construction of phylogenetic networks. Molec-
ular Biology and Evolution, 21, 255–265.Catchen J, Hohenlohe PA, Bassham S, Amores A, Cresko WA
(2013) Stacks: an analysis tool set for population genomics.
Molecular Ecology, 22, 3124–3140.Chapple DG, Miller KA, Kraus F, Thompson MB (2013) Diver-
gent introduction histories among invasive populations of
the delicate skink (Lampropholis delicata): has the importance
of genetic admixture in the success of biological invasions
been overemphasized? Diversity and Distributions, 19,
134–146.Charlesworth D, Willis JH (2009) The genetics of inbreeding
depression. Nature Reviews Genetics, 10, 783–796.Ciosi M, Miller NJ, Kim KS et al. (2008) Invasion of Europe by
the western corn rootworm, Diabrotica virgifera virgifera: mul-
tiple transatlantic introductions with various reductions of
genetic diversity. Molecular Ecology, 17, 3614–3627.Cooling M, Hartley S, Sim DA, Lester PJ (2012) The wide-
spread collapse of an invasive species: Argentine ants (Linep-
ithema humile) in New Zealand. Biology Letters, 8, 430–433.Crnokrak P, Barrett SCH (2002) Perspective: purging the
genetic load: a review of the experimental evidence. Evolu-
tion, 56, 2347–2358.Crow JF (1970) Genetic loads and the cost of natural selection.
In: Mathematical Topics in Population Genetics. Springer, New
York.
Cuzin F (2003) Les grands mammif�eres du Maroc m�eridional
(Haut Atlas, Anti Atlas et Sahara): Distribution, Ecologie et
Conservation. Ph.D. Thesis, Laboratoire de Biog�eographie et
Ecologie des Vert�ebr�es, Ecole Pratique des Hautes Etudes,
Universit�e Montpellier II.
DeGiorgio M, Degnan JH, Rosenberg NA (2011) Coalescence-
Time distributions in a serial founder model of human evo-
lutionary history. Genetics, 189, 579–593.Dlugosch KM, Parker IM (2008) Invading populations of an
ornamental shrub show rapid life history evolution despite
genetic bottlenecks. Ecology Letters, 11, 701–709.Dlugosch KM, Anderson SR, Braasch J, Cang FA, Gillette HD
(2015) The devil is in the details: genetic variation in intro-
duced populations and its contributions to invasion. Molecu-
lar Ecology, 24, 2095–2111.Drummond AJ, Rambaut A (2007) BEAST: Bayesian evolution-
ary analysis by sampling trees. BMC Evolutionary Biology, 7,
214.
Edmonds CA, Lillie AS, Cavalli-Sforza LL (2004) Mutations
arising in the wave front of an expanding population. Pro-
ceedings of the National Academy of Sciences of the United States
of America, 101, 975–979.Estoup A, Guillemaud T (2010) Reconstructing routes of inva-
sion using genetic data: why, how and so what? Molecular
Ecology, 19, 4113–4130.Excoffier L, Foll M, Petit RJ (2009) Genetic consequences of
range expansions. Annual Review of Ecology, Evolution, and
Systematics, 40, 481–501.Facon B, Genton BJ, Shykoff J et al. (2006) A general eco-evolu-
tionary framework for understanding bioinvasions. Trends in
Ecology & Evolution, 21, 130–135.Facon B, Hufbauer RA, Tayeh A et al. (2011) Inbreeding
depression is purged in the invasive insect Harmonia axyridis.
Current Biology, 21, 424–427.
© 2016 John Wiley & Sons Ltd
INVASIVE CRESTED PORCUPINE GENOMICS 3537

Forsman A (2014) Effects of genotypic and phenotypic
variation on establishment are important for conservation,
invasion, and infection biology. Proceedings of the National
Academy of Sciences, 111, 302–307.Frankham R (2004) Resolving the genetic paradox in invasive
species. Heredity, 94, 385–385.Hardesty BD, Le Roux JJ, Rocha OJ et al. (2012) Getting here
from there: testing the genetic paradigm underpinning intro-
duction histories and invasion success. Diversity and Distribu-
tions, 18, 147–157.Harrison JS, Mondor EB (2011) Evidence for an invasive Aphid
“Superclone”: extremely low genetic diversity in Oleander
Aphid (Aphis nerii) populations in the Southern United
States. PLoS One, 6, e17524.
Heled J, Drummond AJ (2008) Bayesian inference of popula-
tion size history from multiple loci. BMC Evolutionary Biol-
ogy, 8, 289.
Hewitt GM (1996) Some genetic consequences of ice ages, and
their role in divergence and speciation. Biological Journal of
the Linnean Society, 58, 247–276.Hoffman JI, Simpson F, David P et al. (2014) High-throughput
sequencing reveals inbreeding depression in a natural popula-
tion. Proceedings of the National Academy of Sciences, 111, 3775–3780.
Hufbauer RA, Rutschmann A, Serrate B, Vermeil de Conchard
H, Facon B (2013) Role of propagule pressure in colonization
success: disentangling the relative importance of demo-
graphic, genetic and habitat effects. Journal of Evolutionary
Biology, 26, 1691–1699.Huson DH, Bryant D (2006) Application of phylogenetic net-
works in evolutionary studies. Molecular Biology and Evolu-
tion, 23, 254–267.Kolbe JJ, Glor RE, Rodr�ıguez Schettino L et al. (2004) Genetic
variation increases during biological invasion by a Cuban
lizard. Nature, 431, 177–181.Kr€opelin S, Verschuren D, L�ezine A-M et al. (2008) Climate-
Driven ecosystem succession in the Sahara: the Past 6000
years. Science, 320, 765–768.Lavergne S, Molofsky J (2007) Increased genetic variation and evo-
lutionary potential drive the success of an invasive grass. Pro-
ceedings of the National Academy of Sciences, 104, 3883–3888.Masseti M, Albarella U, De Grossi Mazzorin J (2010) The
crested porcupine, Hystrix cristata L., 1758, in Italy. Anthropo-
zoologica, 45, 27–42.deMenocal P, Ortiz J, Guilderson T et al. (2000) Abrupt onset
and termination of the African Humid Period: rapid climate
responses to gradual insolation forcing. Quaternary Science
Reviews, 19, 347–361.Mohamed WF (2011) The Crested Porcupine Hystrix cristata
(Linnaeus, 1758) in Misurata, Libya. European Journal of Bio-
logical Sciences, 3, 9–12.Mohr E (1965) Altweltliche Stachelschweine (eds Ziemsen Verlag
A, Westarp W), Wittenberg Lutherstadt, Germany.
Mori E, Sforzi A, Di Febbraro M (2013) From the Apennines to
the Alps: recent range expansion of the crested porcupine
Hystrix cristata L., 1758 (Mammalia: Rodentia: Hystricidae) in
Italy. Italian Journal of Zoology, 80, 469–480.Nei M (1978) Estimation of average heterozygosity and genetic dis-
tance from a small number of individuals. Genetics, 89, 583–590.Nowak RM (1999) Walker’s Mammals of the World. The Johns
Hopkins University Press, Baltimore and London.
Prentis PJ, Wilson JRU, Dormontt EE, Richardson DM, Lowe
AJ (2008) Adaptive evolution in invasive species. Trends in
Plant Science, 13, 288–294.R Development Core Team (2011) R Foundation for Statistical
Computing, Vienna, URL http://www.R-project.org.
Rajabi-Maham H, Orth A, Bonhomme F (2008) Phylogeography
and postglacial expansion of Mus musculus domesticus
inferred from mitochondrial DNA coalescent, from Iran to
Europe. Molecular Ecology, 17, 627–641.Reed DH, Frankham R (2003) Correlation between Fitness and
Genetic Diversity. Conservation Biology, 17, 230–237.Rius M, Darling JA (2014) How important is intraspecific
genetic admixture to the success of colonising populations?
Trends in Ecology & Evolution, 29, 233–242.Roman J, Darling JA (2007) Paradox lost: genetic diversity and
the success of aquatic invasions. Trends in Ecology & Evolu-
tion, 22, 454–464.Saleh MA, Basuony M (1998) A contribution to the mammal-
ogy of the Sinai Peninsula. Mammalia, 62, 557–575.Schmid-Hempel P, Schmid-Hempel R, Brunner PC, Seeman
OD, Allen GR (2007) Invasion success of the bumblebee,
Bombus terrestris, despite a drastic genetic bottleneck. Hered-
ity, 99, 414–422.Shine R, Brown GP, Phillips BL (2011) An evolutionary process
that assembles phenotypes through space rather than
through time. Proceedings of the National Academy of Sciences,
108, 5708–5711.Signorile AL, Wang J, Lurz PWW et al. (2014) Do founder size,
genetic diversity and structure influence rates of expansion
of North American grey squirrels in Europe? Diversity and
Distributions, 20, 918–930.Slate J, Pemberton JM (2002) Comparing molecular measures
for detecting inbreeding depression. Journal of Evolutionary
Biology, 15, 20–31.Stamatakis A (2006) RAxML-VI-HPC: maximum likelihood-
based phylogenetic analyses with thousands of taxa and
mixed models. Bioinformatics, 22, 2688–2690.Strayer DL, Eviner VT, Jeschke JM, Pace ML (2006) Under-
standing the long-term effects of species invasions. Trends in
Ecology & Evolution, 21, 645–651.Tayeh A, Estoup A, Hufbauer RA et al. (2013) Investigating the
genetic load of an emblematic invasive species: the case of
the invasive harlequin ladybird Harmonia axyridis. Ecology
and Evolution, 3, 864–871.Thuiller W, Broennimann O, Hughes G et al. (2006) Vulnerabil-
ity of African mammals to anthropogenic climate change
under conservative land transformation assumptions. Global
Change Biology, 12, 424–440.Trucchi E, Sbordoni V (2009) Unveiling an ancient biological
invasion: molecular analysis of an old European alien, the
crested porcupine (Hystrix cristata). BMC Evolutionary Biology,
9, 109.
Trucchi E, Gratton P, Whittington JD et al. (2014) King penguin
demography since the last glaciation inferred from genome-
wide data. Proceedings of the Royal Society B: Biological
Sciences, 281, 20140528.
Vandepitte K, de Meyer T, Helsen K et al. (2014) Rapid genetic
adaptation precedes the spread of an exotic plant species.
Molecular Ecology, 23, 2157–2164.Wagner CE, Keller I, Wittwer S et al. (2013) Genome-wide
RAD sequence data provide unprecedented resolution of
© 2016 John Wiley & Sons Ltd
3538 E. TRUCCHI ET AL.
species boundaries and relationships in the Lake Victoria
cichlid adaptive radiation. Molecular Ecology, 22, 787–798.Weir BJ (1974) Reproductive characteristics of Hystricomorph
Rodents. Symposia of the Zoological Society of London, 34, 265–301.White TA, Perkins SE, Heckel G, Searle JB (2013) Adaptive
evolution during an ongoing range expansion: the invasive
bank vole (Myodes glareolus) in Ireland. Molecular Ecology, 22,
2971–2985.Zayed A, Constantin S�A, Packer L (2007) Successful biological
invasion despite a severe genetic load. PLoS One, 2, e868.
E.T. and N.C.S. designed the research; E.T. performed
the research; E.T. and P.G. contributed analytical tools;
E.T., E.M. and P.G. contributed sampling; E.T. and P.G.
analysed data; E.T., B.F., P.G., N.C.S. and S.J. wrote the
manuscript.
Data accessibility
Raw ILLUMINA reads for each sample have been
uploaded to the SRA (Acc. num. SRP065809). Processed
RAD data sets are publicly available on Dryad reposi-
tory: http://dx.doi.org/10.5061/dryad.22n3d.
Supporting information
Additional supporting information may be found in the online ver-
sion of this article.
Fig. S1 Distribution of SNPs by position along the length of all
loci. The first 6 bp correspond to the restriction site and are
invariant. In the last 10 bp, the number of SNPs called per
position markedly increases. The invasive dataset with 50%
missing data was used for this plot.
Fig. S2 Distribution of SNPs per position along the length of
all loci (top panels) and of individuals genotyped per locus
(bottom panels) in the global dataset (39 samples and 19559
loci in total), in the invasive dataset (42 samples and 30506 loci
in total), and in the invasive_reduced dataset (16 samples and
17504 loci in total).
Fig. S3 Recent demography of the invasive population.
Extended Bayesian Skyline plot using 16 samples from the
invasive range (H.cri-IT). Results of four independent runs
including a random selection of 50 RAD loci are shown. The
median (black), as well as the lower (red) and the upper
(green) boundaries of the 95% credible region are given. Time
and effective population size are not scaled.
Fig. S4 Individual observed heterozygosity per population.
Boxplots of the residuals of a linear model fitting observed
heterozygosity and raw sequenced reads counts per each indi-
vidual grouped by population. The global dataset (see Meth-
ods) allowing a maximum of 25% (left panels) and 50% (right
panels) missing data per locus was used. A linear model (lm)
was fit using the standard (top panels) and normalized (central
panels) estimate of heterozyzgosity against the log number of
raw sequenced reads in each individual. The non log-trans-
formed number of raw sequenced reads was also tested (bot-
tom panels). Top-left boxplot is the same as in Fig. 5a.
Fig. S5 Individual observed heterozygosity per population.
Boxplots of the residuals of a linear model fitting observed
heterozygosity and raw sequenced reads counts per each indi-
vidual grouped by population. The invasive dataset (see Meth-
ods) allowing a maximum of 25% (left panels) and 50% (right
panels) missing data per locus was used. A linear model (lm)
was fit using the standard (top panels) and normalized (central
panles) estimate of heterozyzgosity against the log number of
raw sequenced reads in each individual. The non log-trans-
formed number of raw sequenced reads was also tested (bot-
tom panels). Top-left boxplot is the same as in Fig. 5b.
Table S1 Sampling details.
Appendix S1 Custom python script used in this study to esti-
mate expected population heterozygosity, Watterson’s theta
and pi.
Appendix S2 Custom python script used in this study to esti-
mate individual observed heterozygosity as detailed in the
Methods section .
Appendix S3 Custom python script used in this study to filter
the Stacks - export_sql.pl output file as detailed in the Methods
section.
© 2016 John Wiley & Sons Ltd
INVASIVE CRESTED PORCUPINE GENOMICS 3539