long life asphalt and concrete pavement and fast-track ... · pdf filelong life asphalt and...
TRANSCRIPT

Seminar Univ of Waterloo 5 April, 2012
Long Life Asphalt and Concrete
Pavement and Fast-Track
Construction
Integrating Design, Construction, and Traffic
for Rapid Highway Rehabilitation Projects
John Harvey
UCPRC, UC Davis

Outline of presentation
• California context for pavement
rehabilitation design and construction
• Problem definition and approach:
Long-life pavement rehabiltation
strategies (LLPRS)
• Long-life pavement design approaches
– Concrete
– Asphalt
• Construction analysis and optimization
• Some examples 2
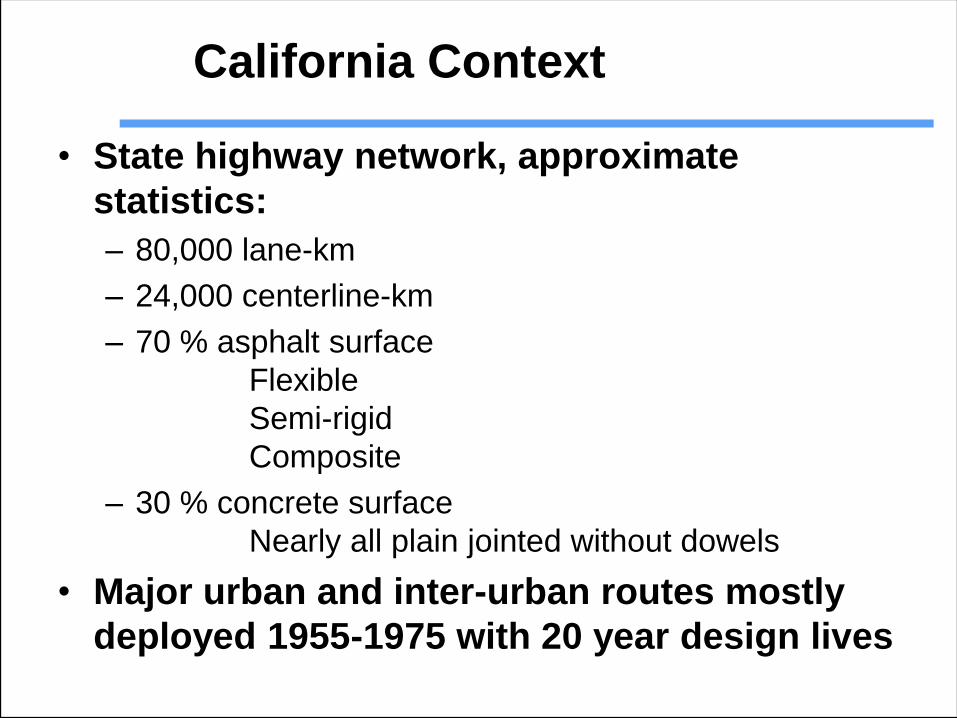
California Context
• State highway network, approximate
statistics:
– 80,000 lane-km
– 24,000 centerline-km
– 70 % asphalt surface
Flexible
Semi-rigid
Composite
– 30 % concrete surface
Nearly all plain jointed without dowels
• Major urban and inter-urban routes mostly
deployed 1955-1975 with 20 year design lives

4
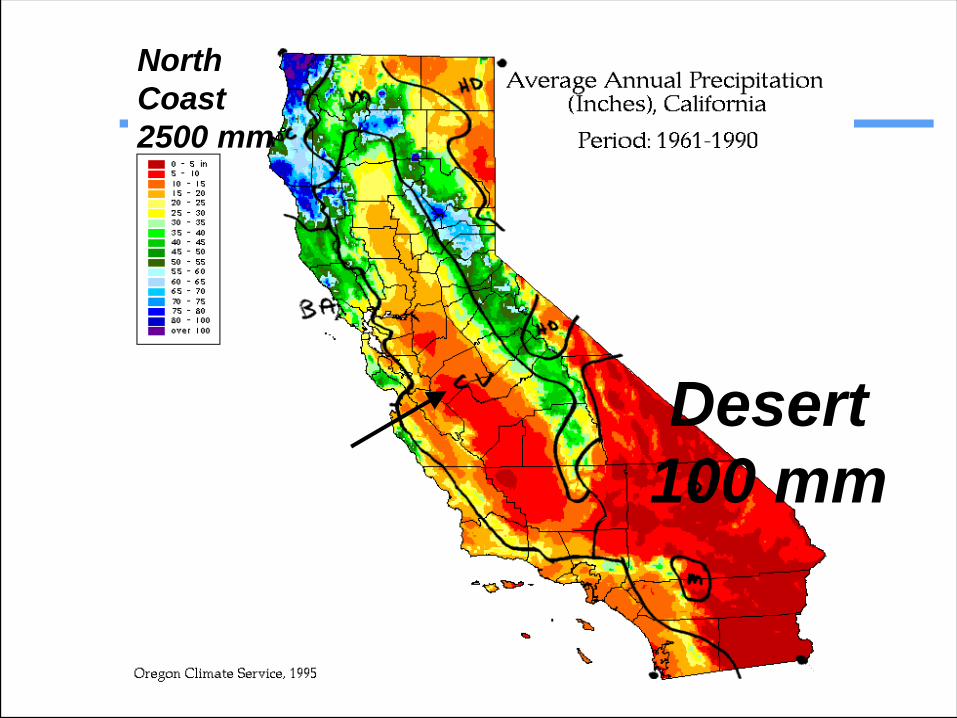
Desert
100 mm
North
Coast
2500 mm


7

8
9
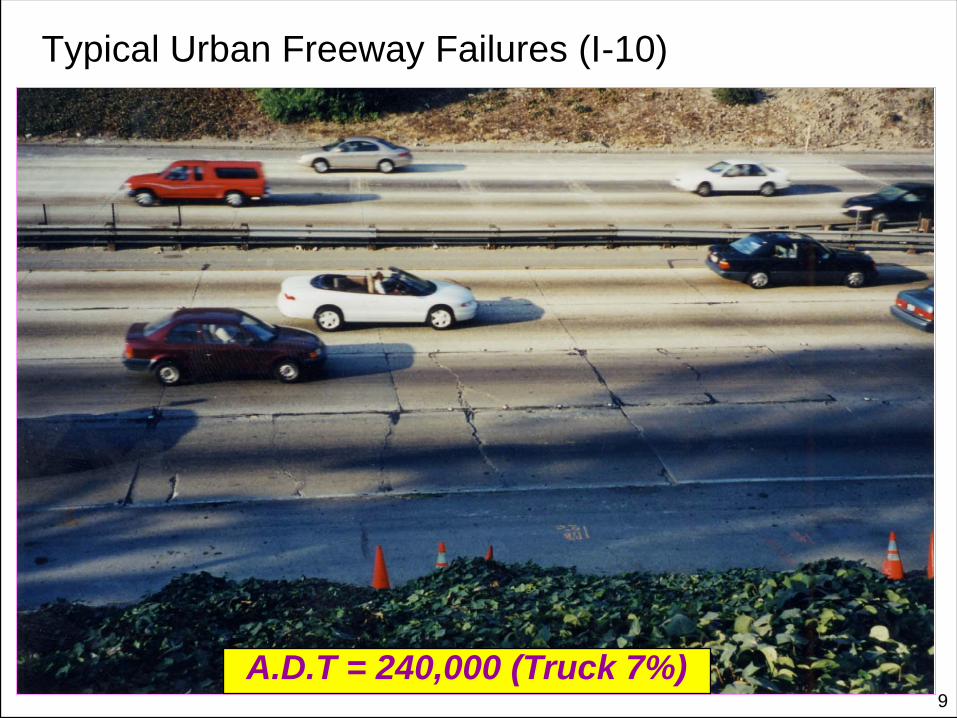
Typical Urban Freeway Failures (I-10)
A.D.T = 240,000 (Truck 7%)

Long-Life Pavement Rehabilitation
Strategies (LLPRS)
• Long-Life requires poor condition
and >150,000 ADT or >15,000 ADTT
– 2,000 lane-km meet these criteria
• Funding limitations
• Design and Construction criteria:
– 30+ year design lives, minimum maintenance
– 55-hour weekends or 72-hour weekday
construction closures
– Minimize lane closures
10

11
Problem: How to Optimize Long Life
Rehabilitation Strategies on Multiple Criteria
• Want Long Life and Fast Construction and
Minimum Traffic Delay
– pavement design strategies:
• longer life pavements take longer to construct
– construction windows/traffic delays:
• shorter windows less efficient for construction
• some strategies can’t be built in 7 to 10 hour windows
• which windows minimize total traffic delay:
55 hour weekend, 72 hour weekday, continuous?
• Requires Integration
– Pavement Engineering + Construction Engineering
+ Traffic Engineering

Current Long-Life Rehab Strategies
200-225 mm PCC
or HMA
100-150 mm CTB
or AB
CSOL
Crack and Seat PCC,
Place Thick AC Overlay
FDAC
Remove existing,
Replace with full-
depth HMA structure
Remove PCC or
overlay HMA, with
200-300 mm PCC
Retain or replace
existing base
Typical now
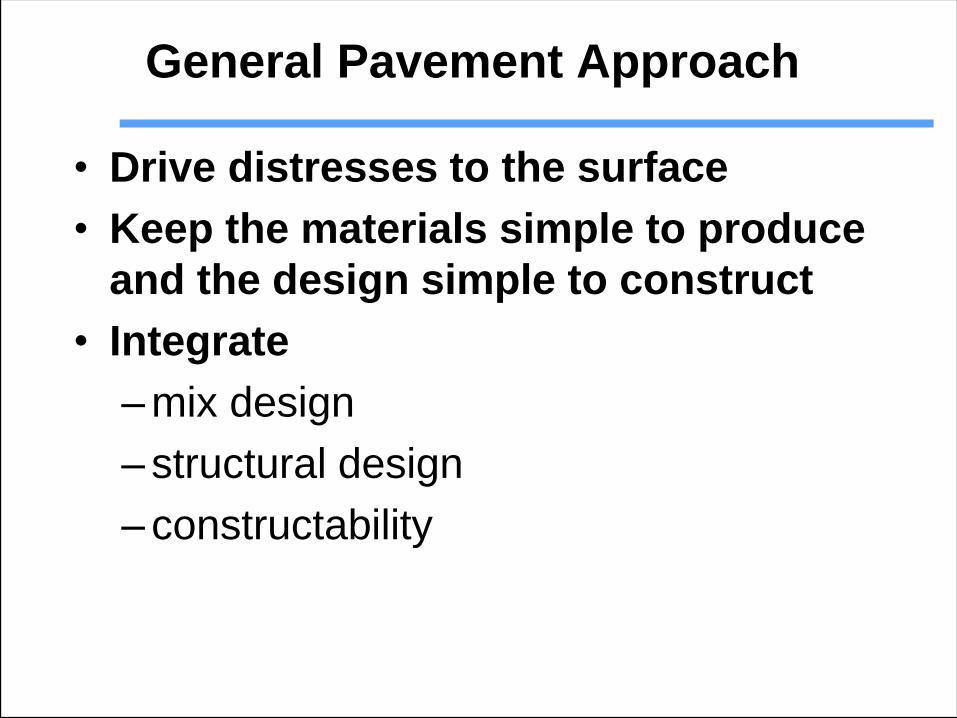
General Pavement Approach
• Drive distresses to the surface
• Keep the materials simple to produce
and the design simple to construct
• Integrate
–mix design
–structural design
–constructability
Concrete Pavement Design
• Prior to 2005:
– Empirical thickness design catalog
– All jointed plain concrete
• After 2005:
– Developed new JPC design catalog using
MEPDG, with state calibration
– Experimenting with pre-cast for rapid
rehabilitation
– New CRC design catalog and specifications
since 2009
14
Status of MEPDG
implementation in CA
• MEPDG nationally calibrated
– 13 of the 183 calibration sites are from CA
• Process to validate the models before implementing them
– Sensitivity Analysis
– Validate using Accelerated Pavement Testing (some, mostly effects of dowels, widened lanes)
– Calibration using field data
• Catalog developed with locally calibrated 0.8 version of the software
– Slab/base bonding most significant variable for cracking

Sensitivity Analysis
• Generally results are reasonable
• Some issues with the models
–Subgrade effect counter-intuitive
–Subbase thickness and type has no effect
–CTE & surface absorptivity very sensitive
• Results:
–Dowels
–Use previous empirical subbase designs
–Designs for traffic and climate regions

0 50 100 150 200 250 300 350
Age(months)
0
20
40
60
80
SA 0.65
SA 0.85
% s
labs
crack
ed
Effect of surface absorptivity on transverse cracking
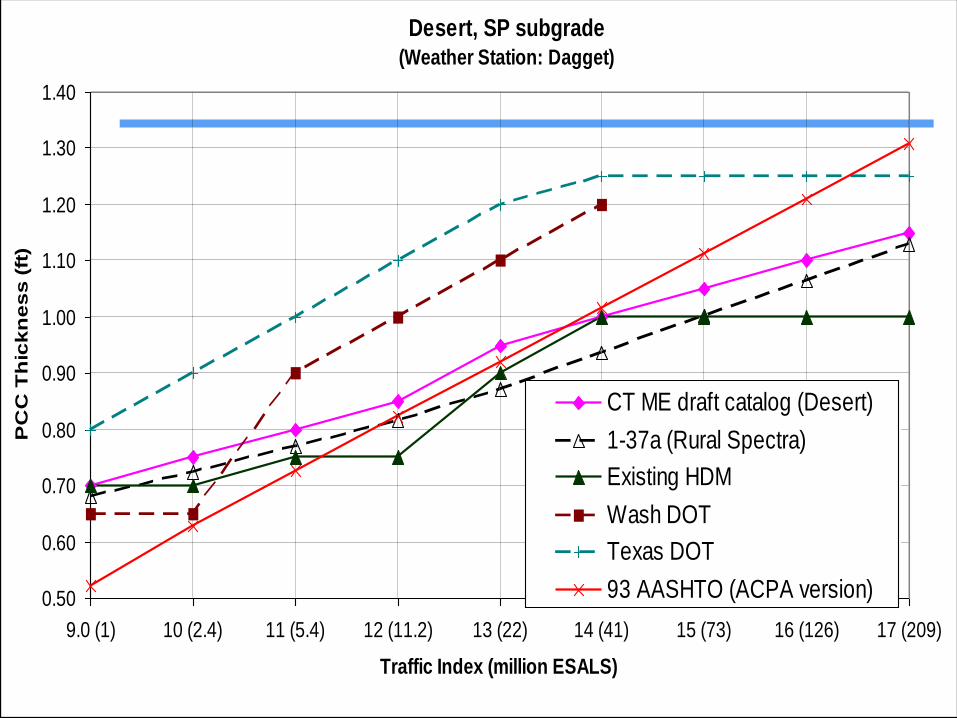
Desert, SP subgrade(Weather Station: Dagget)
0.50
0.60
0.70
0.80
0.90
1.00
1.10
1.20
1.30
1.40
9.0 (1) 10 (2.4) 11 (5.4) 12 (11.2) 13 (22) 14 (41) 15 (73) 16 (126) 17 (209)
Traffic Index (million ESALS)
PC
C T
hic
kn
es
s (
ft)
CT ME draft catalog (Desert)
1-37a (Rural Spectra)
Existing HDM
Wash DOT
Texas DOT
93 AASHTO (ACPA version)

Longitudinal & Corner Cracking Significant
in CA, not in MEPDG
Low humidity:
shrinkage gradients +
truck traffic
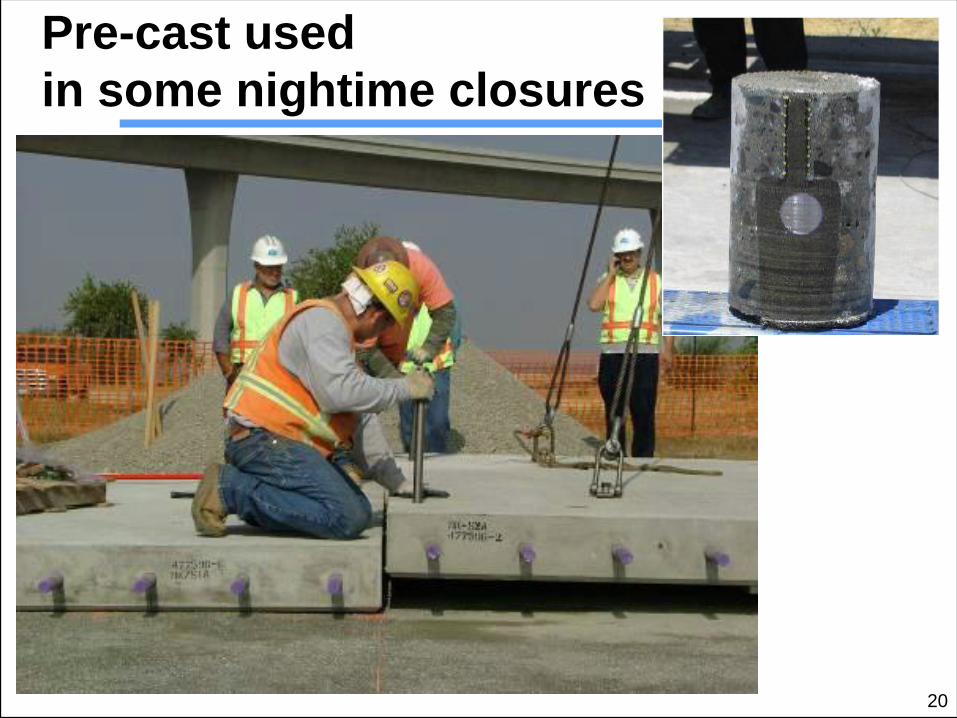
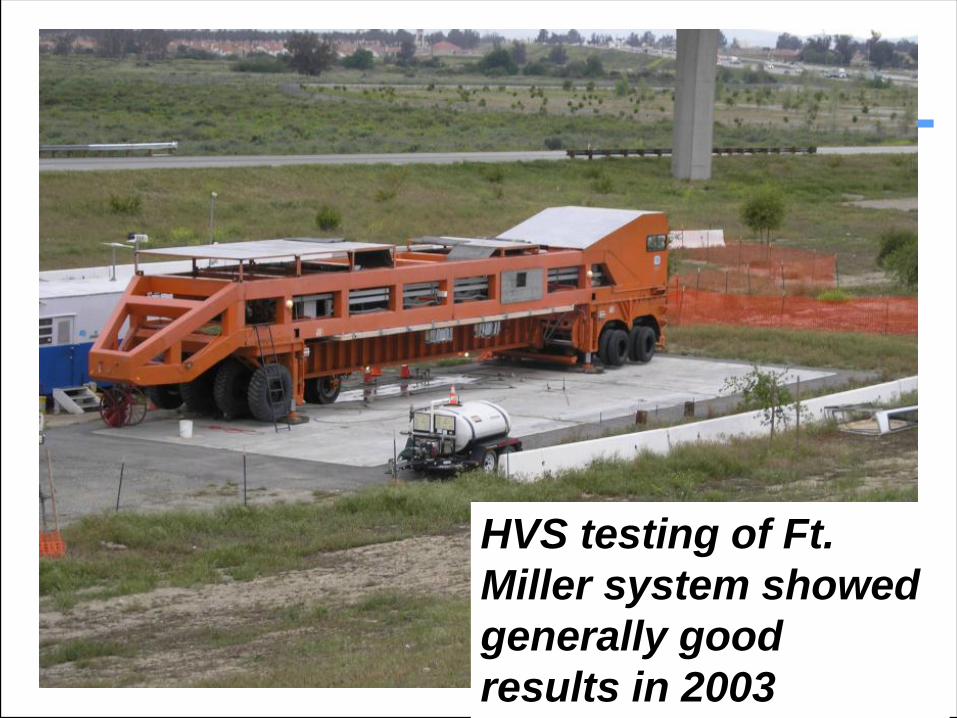
Pre-cast used
in some nightime closures
20
21
HVS testing of Ft.
Miller system showed
generally good
results in 2003
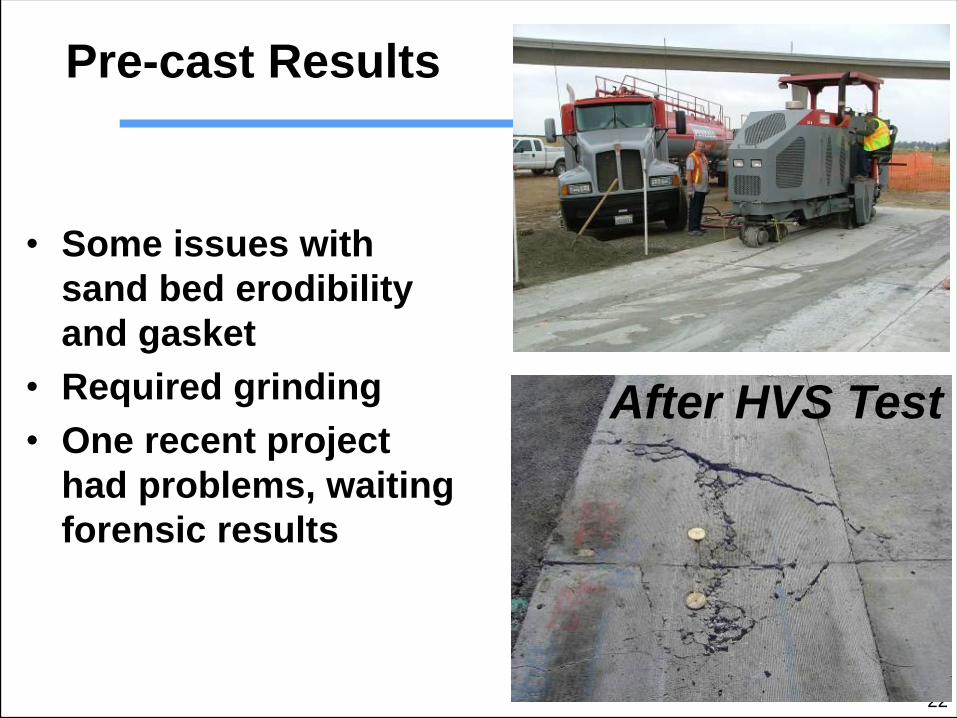
Pre-cast Results
• Some issues with
sand bed erodibility
and gasket
• Required grinding
• One recent project
had problems, waiting
forensic results
22
After HVS Test
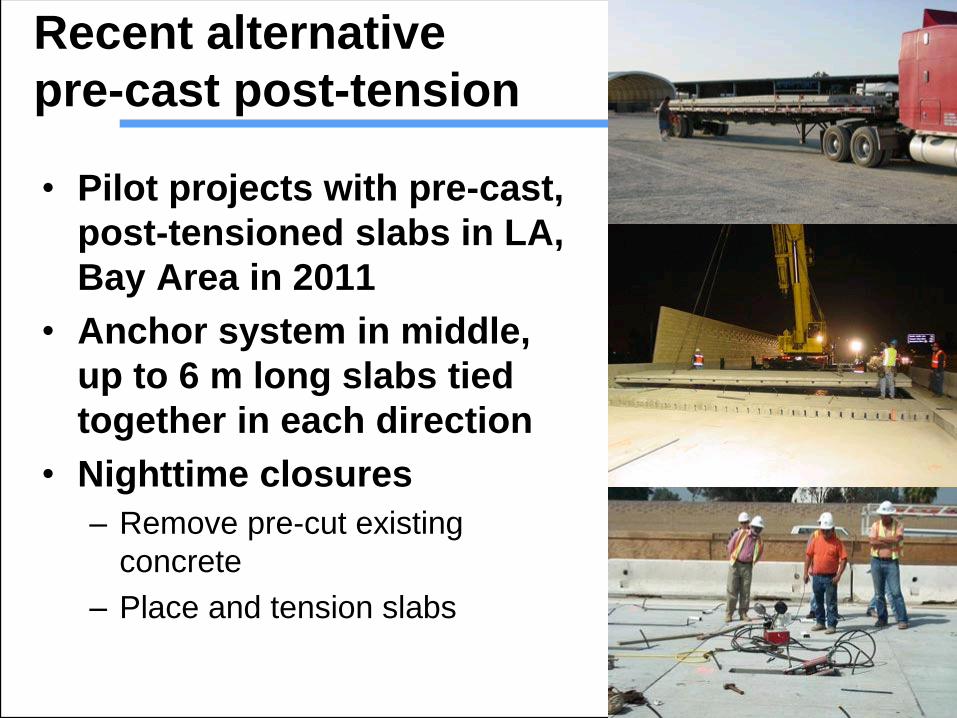
Recent alternative
pre-cast post-tension
• Pilot projects with pre-cast,
post-tensioned slabs in LA,
Bay Area in 2011
• Anchor system in middle,
up to 6 m long slabs tied
together in each direction
• Nighttime closures
– Remove pre-cut existing
concrete
– Place and tension slabs
23

Asphalt Pavement Design
• Prior to 2002
– R-value method (empirical)
• 2002
– ME design long-life asphalt I-710
• 2002-current
– Development of CalME mechanistic design
models and software (alternative to MEPDG)
• 2011
– ME designs on three projects designed with
CalME, specifications based on ME input
24

I-710 Crack, Seat and Overlay (CSOL)
between bridges
Bottom layer - cracking
Middle layer – cracking, rutting
Top layer – rutting, cracking
Base layers
Sacrificial layer – safety, noise
Cracked and Seated PCC
25-50 mm
fabric
75-100 mm
Varying
thickness
30 mm
subgrade
Existing grade

Full-Depth Asphalt Concrete (FDAC)
under bridges
Rich Bottom layer - cracking
Middle layer – cracking, rutting
Top layer – rutting, cracking
subgrade
Sacrificial layer – safety, noise
granular base (recycled PCC)
25-50 mm
75-100 mm
Varying
thickness
50-75 mm
0 or 150 mm
Existing grade

125 mm, 5 % air-voids,
AR-8000
75 mm, Rich Bottom
75 mm PBA-6a
I-710 Reduction of Full-Depth
Pavement Thickness Under Bridges
535 mm thick
asphalt concrete
8 % air-voids,
same mix design
throughout
Asphalt Institute design
Mechanistic design
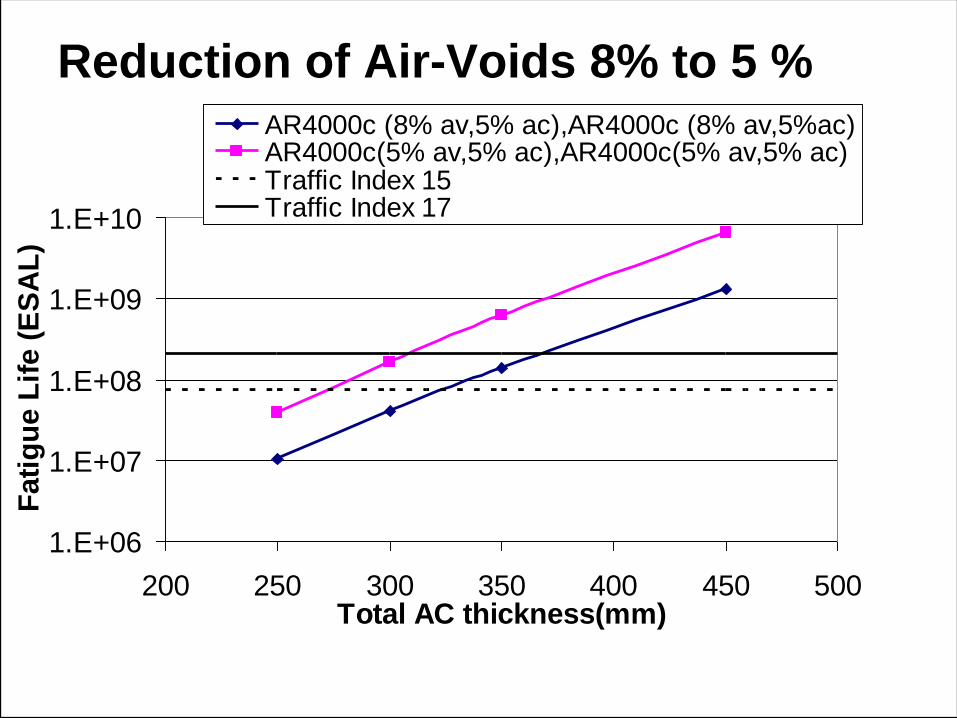
Reduction of Air-Voids 8% to 5 %
1.E+06
1.E+07
1.E+08
1.E+09
1.E+10
200 250 300 350 400 450 500Total AC thickness(mm)
Fati
gu
e L
ife (
ES
AL
)
AR4000c (8% av,5% ac),AR4000c (8% av,5%ac)AR4000c(5% av,5% ac),AR4000c(5% av,5% ac)Traffic Index 15Traffic Index 17

Reduction of Air-Voids 8% to 5 %
0.000
0.002
0.004
0.006
0.008
200 250 300 350 400 450 500Total AC thickness(mm)
$/E
SA
L
AR4000c (8% av,5% ac),AR4000c (8% av,5%ac)
AR4000c(5% av,5% ac),AR4000c(5% av,5% ac)
Initial cost only considered

Rich-Bottom Design
• Definition
– Same mix as middle layer
– 0 to 3 % air-voids
– Bitumen content increased 0.5% to facilitate compaction
• Benefit is from increased compaction, not increased asphalt content
• Must be out of zone of rutting risk
– More than about 150 mm below surface depending on climate, traffic

Effect of Rich Bottom
1.E+06
1.E+07
1.E+08
1.E+09
1.E+10
1.E+11
200 250 300 350 400 450 500Total AC thickness (mm)
Fati
gu
e L
ife
AR4000c (8% av,5% ac),AR4000c (8% av,5%ac)AR4000c(5% av,5% ac),AR4000c(5% av,5% ac)AR4000c (5% av,5% ac), AR4000c (2%av ,5% ac)AR4000c (5% av,5% ac), AR4000c(2% av,5.5% ac)Traff ic Index 15
Traff ic Index 17

Full-depth: Paving 75mm AR-8000 Rich-bottom
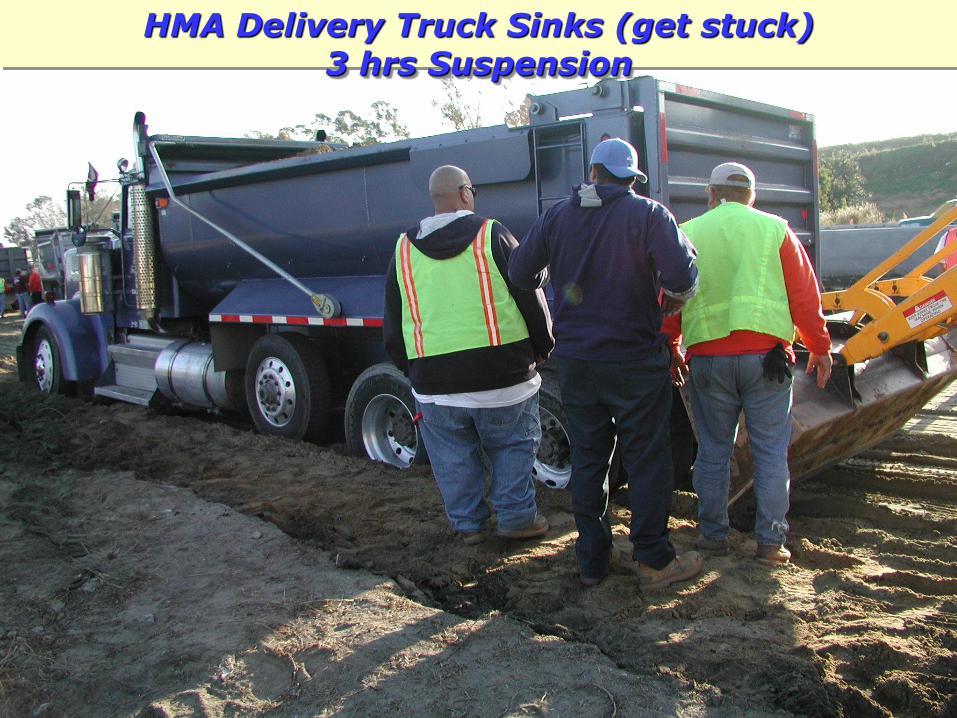
HMA Delivery Truck Sinks (get stuck) 3 hrs Suspension

Concrete Crushing Plant (Source of SG Aggregate)

Mix Type Asphalt
Content
Air-Void
Content
G* at 100
repetitions
(MPa)
RSST-CH
repetitions
to 5 %
permanent
shear strain
RAC-G 7.6 13.7 30 120
AR4000 5.1 7.2 79 5,992
PBA-6a 4.7 3.8 32 1,230,000
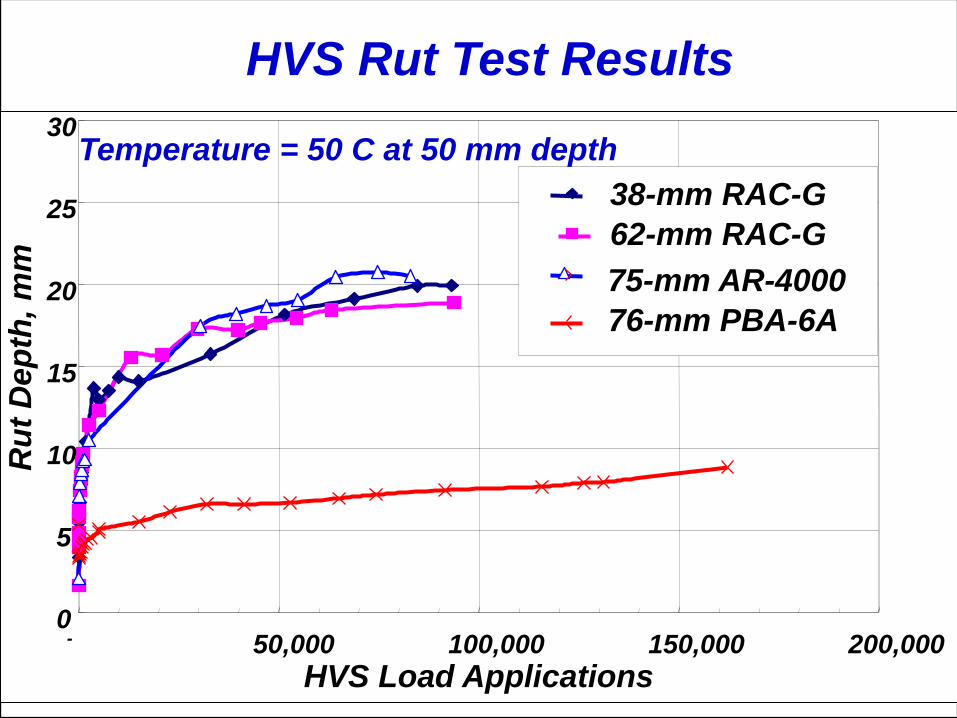
Surface Mix Rutting
• Stiffest mix may not be most rut resistant
– Especially conventional vs polymer modified
Tested at 50 C
0
5
10
15
20
25
30
- 50,000 100,000 150,000 200,000
HVS Load Applications
Ru
t D
ep
th,
mm
38-mm RAC-G
62-mm RAC-G
75-mm AR-4000
76-mm PBA-6A
HVS Rut Test Results
Temperature = 50 C at 50 mm depth
Unbound Layers Rutting
• Subgrade strain models often control
design thickness for very high traffic
pavements
– Extrapolated beyond calibration data
• Probably overly conservative, because
– Thick AC layers reduce stresses on unbound
layers
– Neglect previous compaction by traffic
• Use stress/strength type relationships

HVS testing,
mostly 100 kN wheel loads at 7 km/hr
0
2
4
6
8
10
12
- 2,000,000 4,000,000 6,000,000
HVS Load Applications
To
tal R
ut
at
To
p o
f
Ag
gre
gate
Base m
m
500/514
502/515
225 mm AC
traffic on overlay
150 mm AC
initial traffic

Performance Testing
• Specimen Fabrication
– Caltrans LLP – AC1 “Sample Preparation Design and Testing for Long Life Hot Mix Asphalt Pavements”
– AASHTO PP3-94 Rolling Wheel Compaction:

Modified Mix Design – Shear & Fatigue Testing

Modified Mix Design – Hamburg Wheel Tracking for Moisture Sensitivity

2011 Perf Specifications (Red Bluff I-5) (all with confidence interval in favor of contractor)
• PG64-28PM surface
– 6 % air-voids
– RSST-CH (AASHTO T 320) min repetitions
• PG64-16 middle layer with 25% RAP
– 6 % air-voids
– RSST-CH (AASHTO T 320) min repetitions
– Flexural fatigue (AASHTO T 321) min repetitions
– Flexural stiffness
• PG64-16 rich bottom layer
– 3 % air-voids, + 0.5 % binder
– Flexural fatigue (AASHTO T 321) min repetitions
– Flexural stiffness
42