long island sound ambient water quality monitoring program
TRANSCRIPT
LONG ISLAND SOUND
AMBIENT WATER QUALITY MONITORING
PROGRAM
WATER QUALITY AND HYDROGRAPHIC SURVEYS
STANDARD OPERATING PROCEDURES MANUAL
Revision
March 2017
STATE OF CONNECTICUT
DEPARTMENT OF ENERGY AND ENVIRONMENTAL PROTECTION
BUREAU OF WATER PROTECTION AND LAND REUSE
PLANNING AND STANDARDS DIVISION
79 Elm Street
Hartford, Connecticut 06106-5127

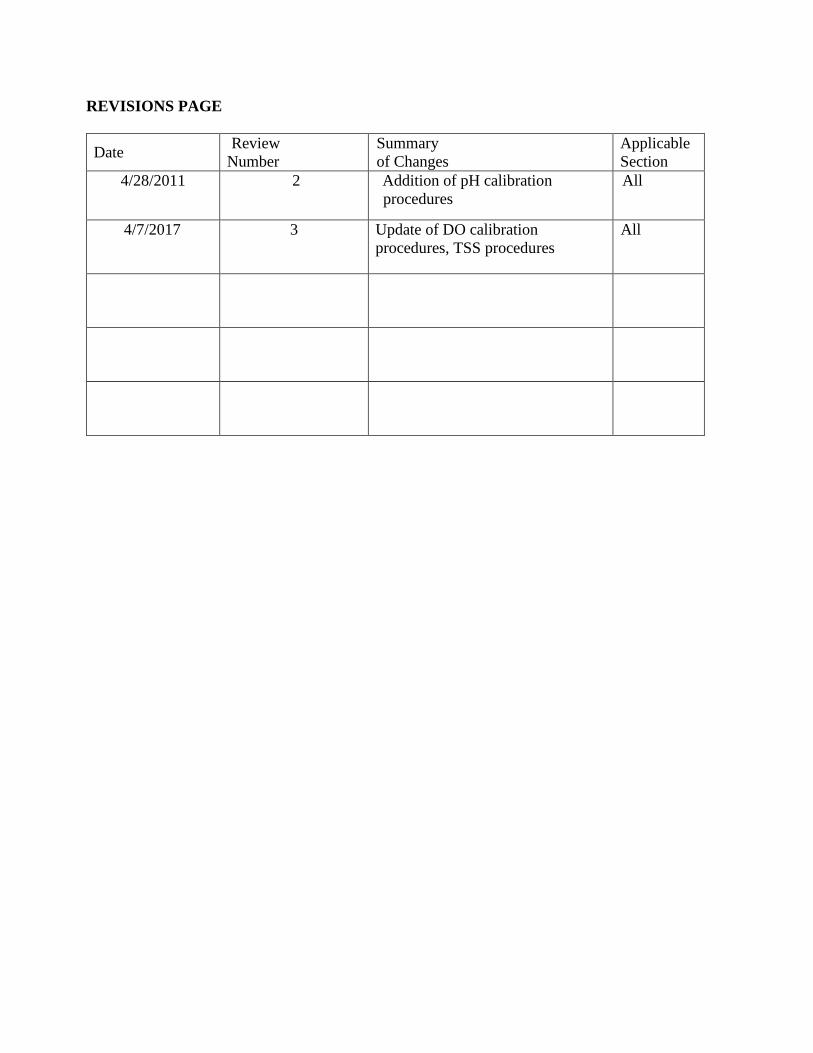
REVISIONS PAGE
Date Review
Number
Summary
of Changes
Applicable
Section
4/28/2011 2 Addition of pH calibration
procedures
All
4/7/2017 3 Update of DO calibration
procedures, TSS procedures
All

Long Island Sound Water Quality Monitoring Program SOP Manual 1
TABLE OF CONTENTS
Table Of Contents ........................................................................................................................... 1
Background ..................................................................................................................................... 4
Objectives ....................................................................................................................................... 5
General Overview Of Methods ....................................................................................................... 7
Health & Safety Warnings .............................................................................................................. 8
Personnel Qualifications And Training .......................................................................................... 9
Data And Records Management ..................................................................................................... 9
Survey Preparation ........................................................................................................................ 10
Sample Bottles And Labels ........................................................................................................... 10
Equipment And Supplies .............................................................................................................. 11
Equipment Handling ..................................................................................................................... 14
References ..................................................................................................................................... 14
Standard Operating Procedures..................................................................................................... 15
Standard Operating Procedure For The Calibration Of The Seabird Seacat Profiler (SBE-19)
Dissolved Oxygen Sensor ....................................................................................................... 16
Standard Operating Procedure For Determining Dissolved Oxygen Content Of Seawater Using
The Azide-Winkler Method .................................................................................................... 22
Standard Operating Procedure For Calibration Of The Seabird 18 pH Sensor ............................ 27
Standard Operating Procedure For Field Sampling Using A Ctd/Rosette Sampler Aboard The
R/V John Dempsey ................................................................................................................. 30
Standard Operating Procedure For The Collection Of Secchi Disk Depth Measurements .......... 40
Standard Operating Procedure For The Collection Of Water For Biochemical Oxygen Demand41
Standard Operating Procedure For Filtering Water Samples For Particulate Phosphours (PP),
Dissolved Nutrients, Biogenic Silica (BioSi), And Dissolved Silica Analysis ...................... 42
Standard Operating Procedure For Filtering Water Samples For Particulate Carbon (PC),
Particulate Nitrogen (PN), Chlorophyll A (Chl a), And High Performance Liquid
Chromatography (HPLC) Analysis......................................................................................... 48
Standard Operating Procedure For Filtering Water Samples For Total Suspended Solids (TSS)
Analysis................................................................................................................................... 52
Standard Operating Procedure For The Collection Of Zooplankton Samples ............................. 56
Attachments .................................................................................................................................. 62
Attachment A ................................................................................................................................ 63
Attachment B ................................................................................................................................ 82
Attachment C ............................................................................................................................... 87
Attachment D ............................................................................................................................... 88
Attachment E ............................................................................................................................... 89
Attachment F ............................................................................................................................... 92
Attachment G ............................................................................................................................... 99

Long Island Sound Water Quality Monitoring Program SOP Manual 2
List of Tables and Figures
Table 1. List of supplies to be obtained from UConn CESE prior to monthly surveys...........11
Table 2. Survey Preparation Checklist.....................................................................................12
Figure 1. CT DEEP monthly water quality monitoring stations in Long Island Sound ................ 6
Figure 2. CT DEEP summer hypoxia survey stations in Long Island Sound ................................. 6
Figure 3. R/V John Dempsey .......................................................................................................... 7
Figure 4. Rosette, CTD, and Niskin sampling array ..................................................................... 14
Figure 7. COMM Port Configuration ........................................................................................... 21
Figure 8. pH probe ........................................................................................................................ 27
Figure 9. Stern of the R/V John Dempsey showing the placement of the electromechanical cable
....................................................................................................................................................... 30
Figure 10. Niskin Bottle ................................................................................................................ 31
Figure 11. Niskin bottles in the sampling array. ........................................................................... 31
Figure 12 ....................................................................................................................................... 32
Figure 13. CTD in cage ................................................................................................................. 34
Figure 14. Deck Command Unit ................................................................................................... 38
Figure 15. PP/BioSi Filtering Apparatus ...................................................................................... 42
Figure 17. Diagram of filter set up for PC/PN, Chl a analysis. Surface water is filtered for HPLC
analysis. Filters are set up following PC/PN and chl a filtering in the spaces marked above as chl
a surface. ....................................................................................................................................... 49
Figure 15. TSS Filtering Apparatus .............................................................................................. 52
Figure 18. Whole Water Zooplankton Sample Processing ........................................................... 57
Figure 20. Bongo Plankton Net being towed through water column ........................................... 58

Long Island Sound Water Quality Monitoring Program SOP Manual 3
List of Acronyms
BIOSI Biogenic Silica
BOD Biochemical Oxygen Demand
CESE Center for Environmental Science and Engineering
Chl a Chlorophyll a
COC Chain of Custody
CT DEP Connecticut Department of Environmental Protection
CTD Conductivity, Temperature, Depth recorder
DI De-ionized
DO Dissolved Oxygen
EMAP Environmental Monitoring and Assessment Program
EPA Environmental Protection Agency
HPLC High-performance Liquid Chromatography
LISS Long Island Sound Study
LISWQMP Long Island Sound Water Quality Monitoring Program
MSDS Material Safety Data Sheet
NCA National Coastal Assessment
PAR Photosynthetically Active Radiation
PC/PN Particulate Carbon /Particulate Nitrogen
PFD Personal Flotation Device
PP Particulate Phosphorus
QA/QC Quality Assurance/Quality Control
SOP(s) Standard Operating Procedure(s)
UConn University of Connecticut
UMass University of Massachusetts

Long Island Sound Water Quality Monitoring Program SOP Manual 4
Background
The Connecticut Department of Energy and Environmental Protection (CT DEEP), with support
from the Environmental Protection Agency (EPA), initiated the Long Island Sound Ambient
Water Quality Monitoring Program (LISWQMP) in January 1991, following a series of
comprehensive field surveys conducted during 1988, 1989 and 1990 as part of the initialization,
calibration, and verification of the National Estuary Program's Long Island Sound Study (LISS)
coupled hydrodynamic-water quality model. The monitoring program, performed by the CT
DEEP's Bureau of Water Protection and Land Reuse, continues today. A total of seventeen (17)
stations are sampled monthly throughout Long Island Sound (Figure 1). Additionally, summer
monitoring (referred to as the hypoxia surveys) to determine the areal and temporal extent of low
dissolved oxygen conditions in the Sound is performed bi-weekly from late June through early
September along a grid of fixed stations, concentrated in the western and central Sound (Figure
2).
During the monthly water quality survey, water samples are collected for water quality analyses
(including nutrients, suspended solids and chlorophyll a) and water column profiles of
temperature, salinity, dissolved oxygen, pH, and photosynthetically-active radiation (PAR) are
collected. The data collected are considered essential to ongoing data set development, to
continued evaluation of model predictions, to help in an ongoing evaluation of monitoring and
research needs, and, over the long-term, to monitor the effectiveness of management actions
taken in response to findings of the LISS.
The LISWQMP receives requests for assistance with data collections or special projects. One
such ongoing project, funded through the Long Island Sound Study research grant program
(2004), seeks to “quantify the impact of anthropogenic nitrogen loading to Long Island Sound
with respect to natural resources” (LISS undated). The principle investigators are Dr. Mark
Altabet from the University of Massachusetts- Dartmouth, School of Marine Science and
Technology and Dr. Johan Varekamp from Wesleyan University. LISWQMP collects water
samples for the project, fills pre-cleaned and acidified sample bottles provided by the project,
and ships the bottles back to UMass- Dartmouth for analysis. Data collection for these special
projects is performed following standard operating procedures specified by the principal
investigator and are not included in this manual.
The LISWQMP also began a project in April 2002 to examine the phytoplankton community
structure of Long Island Sound through High Performance Liquid Chromatography (HPLC)
phytopigment analysis. Water collected at selected sites during the monthly surveys is vacuum
filtered and filters are sent to the University of Maryland’s Horn Point Laboratory for analysis.
The SOP for filtering is included with this manual.

Long Island Sound Water Quality Monitoring Program SOP Manual 5
Objectives
The objectives of this survey are many. One objective is to develop and initiate a long-term
monitoring program that will assist in evaluating the success of management actions in the
future. This objective has been met in part through equipment acquisition, staff training, and the
successful implementation of a monthly water quality monitoring survey, and CT DEEP plans to
continue this monthly survey indefinitely. Cooperation with other research and monitoring
efforts on Long Island Sound, providing data, arranging for shared boat time, and adding
locations and parameters to the sampling scheme, for example, also help to further the effort of
evaluating the Long Island Sound system and identifying research needs.
The second objective is to supplement the data set developed by the 1988 through 1990 surveys
of water quality and hydrographic parameters from the East River to Block Island Sound.
Although the current data set being collected and compiled is more limited in the number of
stations than the earlier surveys, the continuity is valuable. In addition, an intensive hypoxia
monitoring survey, performed during the summer months at a large number of stations
concentrated in the western Sound provides information on areal and temporal extent of hypoxia
each summer.
A third objective is to provide quality assured data to meet Clean Water Act obligations.

Long Island Sound Water Quality Monitoring Program SOP Manual 6
Figure 2. CT DEEP summer hypoxia survey stations in Long Island Sound
Figure 1. CT DEEP monthly water quality monitoring stations in Long Island Sound

Long Island Sound Water Quality Monitoring Program SOP Manual 7
General Overview of Methods
State of Connecticut bond authorizations earmarked funds for Long Island Sound water quality
monitoring to equip the 50 foot CT DEEP research vessel, the
R/V John Dempsey (Figure 3), with a state-of-the-art water
sampling and monitoring system. This system includes a
conductivity-temperature-depth (CTD) water column profiling
unit (Sea-Bird model SBE-19 SeaCat Profiler) equipped with
dissolved oxygen, pH and PAR sensors as well as an in line
fluorometer. This unit has an internal memory, and is capable
of creating and storing data files on depth, temperature,
salinity, dissolved oxygen, pH, chlorophyll and PAR at a rate of twice per second as the unit is
lowered through the water column. These data can be reviewed in real-time (i.e., as the cast is
taking place) via the onboard computer or can be uploaded onto the computer after cast
completion.
As technology advances and equipment becomes obsolete and in order to provide more uniform
data reporting and make our data consistent across all LIS and freshwater sampling, new water
column profiling instruments may be utilized. In 2016, CT DEEP acquired two YSI EXO2 series
multi-parameter water quality sondes. Side-by-side testing will occur in 2017 to determine data
comparability with the existing platform and develop Standard Operating Procedures for the
calibration and use of the EXOs.
Generally the CTD unit is mounted on a rosette water sampling device (General Oceanics model
1015 Rosette Multi-Bottle Array) which also holds up to ten five-liter water sampling bottles
(Niskin model 1010 Water Sampling Bottles). These bottles are open as the rosette is deployed
and can be closed (i.e., a water sample collected) when the real-time readout from the CTD
indicates that the appropriate water sampling depths have been reached. The rosette triggering
device is powered through an electromechanical cable on which the unit is lowered. This cable is
attached to a deck command unit in the onboard laboratory and together this system allows
remote actuation of a sequence of water sampling bottles.
Water samples are collected at a minimum of two depths for full nutrient analyses. The bottom
water is sampled at approximately five meters off the bottom and surface water is sampled at a
depth of two meters. These depths were chosen by the LISS consultant who developed the water
quality model as the most appropriate depths for evaluating nutrient concentrations within the
water column. Additional water samples may be collected for dissolved oxygen and chlorophyll
determinations at mid-depths (between the surface and bottom nutrient samples), and near-
bottom (within a meter of the actual bottom).
Water collected is filtered in the onboard laboratory, and filters and filtrate are delivered to an
analytical laboratory for analyses for nutrients, including particulate carbon, nitrogen,
phosphorus and silica (biogenic), and dissolved forms including nitrite, nitrate, ammonium,
orthophosphate, and silicate, as well as chlorophyll a, total suspended solids, and 30-day
biological oxygen demand.
Figure 3. R/V John Dempsey

Long Island Sound Water Quality Monitoring Program SOP Manual 8
Health & Safety Warnings
Sampling from a research vessel in various weather conditions, the use of reagents and acid
preservatives, and handling of unknown sample constituents provide occasions for possible
hazardous situations to the field monitor. The following should be taken into consideration to
ensure the safety of personnel in the field.
General boating safety practices must be observed. The ship's captain and engineer are
knowledgeable in safety and emergency procedures and equipment. All crewmembers are
expected to follow their instructions AT ALL TIMES. This includes during the performance of
regular activities aboard the research vessel, as well as when any emergency situation arises. All
crew members should be familiar with where on the vessel safety and emergency equipment is
located, such as life jackets, throw-ring, immersion suits, life raft, fire extinguishers, radio, and
the first aid kit.
Personal flotation devices (i.e., life jackets, float coats, Mustang work suits) are to be worn when
outside of the vessel cabin in rough seas; when deploying gear off the rear or side-deck; when
assisting with securing the vessel to, or releasing the vessel from a dock; and when outside
forward of the pilot house (bow). Hard hats are required in certain instances when there exists
any potential danger from overhead gear, such as deploying the rosette.
There are always hazards when working aboard a vessel, and these hazards are increased
whenever there is gear in the water. Be familiar with the operations of the boat, any cables and
equipment that are on the deck, the winches and net reel, and any equipment being deployed.
Most importantly, be aware of what is going on around you.
Some vessel safety factsheets, CT DEEP directive and vessel rules, and an emergency radio
communication guide are included as Attachment A to this manual. The Fishing Vessel Safety
Factsheets contain some information that does not necessarily apply to our work aboard the R/V
John Dempsey, but is useful for a general understanding of safety equipment, and should prompt
questions (most appropriately directed to the ship captain) concerning the specifics of safety gear
available on the Dempsey.
The chemicals used on-board for the purpose of preserving samples can be very dangerous. They
should be handled with care and should never be left open when unattended. Gloves and safety
glasses should be worn when handling (dispensing) these chemicals. Report any spills
IMMEDIATELY.
Eyewash bottles are available and are kept above the sink in the laboratory area.
If you suffer ANY injury while working on the research vessel, let someone know immediately
(captain, supervisor). First aid kits are available on the boat.
When deploying the rosette, keep hands and fingers off the circular base to avoid the possibility
of having them caught between the rosette and the boat. Instead, hold the frame along the support
bars radiating from the weights.

Long Island Sound Water Quality Monitoring Program SOP Manual 9
Personnel Qualifications and Training
At least one permanent staff person of the LIS Water Quality Monitoring Program will be
present on the Research Vessel for each survey. Such person will have proven their ability with
all aspects of survey preparation and implementation to a senior project scientist. Lower level
staff, such as new permanent staff or temporary/ seasonal staff, who participate in field
operations will be trained in each field function they will be required to perform (equipment
handling, filtering tasks, titrations, etc.) prior to participation in a survey. All staff that will
participate in field activities on a regular basis will be required to review applicable SOPs and
receive safety training annually. Performance of new staff or temporary/seasonal staff will be
closely observed. Staff will not be allowed to proceed unsupervised unless and until they have
shown proficiency in each particular survey preparation and field activity as determined by the
senior project scientist. Staff performance can continue to be evaluated by observations by the
senior project scientist or field lead scientist. The project scientist or lead field scientist will
correct any errors as they occur and demonstrate proper technique if necessary. If staff continues
to make errors, retraining will occur and he/she will be allowed to continue with supervision
until they demonstrate consistent proper technique.
Data and Records Management
All field data shall be recorded on the appropriate field data sheet and laboratory chain-of-
custody form. CTD data not available in real-time shall be uploaded to the field computer as
soon as possible and reviewed to ensure that a full cast was recorded. The field team leader shall
be responsible for the accuracy and completeness of all data recorded in the field and the
subsequent completion of field data entry into the Program database. All original field data
sheets shall be archived, making them available for future reference if necessary. Archives will
be maintained.
Raw CTD data shall be reviewed by experienced Program staff. The downcast will be reviewed
for significant outliers (spikes) and functional problems such as system clogging. Acceptable
casts will be averaged into 0.2 meter bins and corrected with the use of a regression. Processed
CTD files will be uploaded into the Program database.
Water samples and filters shall generally be delivered to the analytical laboratory the day they
are collected. The analytical laboratory will assign a unique laboratory sample code to each
sample, and such code will be recorded directly on to the chain-of-custody form delivered with
the samples. The laboratory will keep the original chain-of-custody form and will return a copy
to Program staff. Analytical results will be provided in both electronic (via e-mail) and hardcopy
forms. Upon receipt, Program staff will review results and associated Quality Assurance/Quality
Control (QA/QC) data and upload the results into the Program database.
All data in the Program database (1991 through current) are available upon request, and Program
staff frequently fill requests for data. Summary reports of Summer Hypoxia Survey results are
produced and distributed to interested parties immediately following each survey. These reports
include surface and bottom temperature, salinity and dissolved oxygen (DO) data and a map of
minimum DO levels throughout the Sound.

Long Island Sound Water Quality Monitoring Program SOP Manual 10
Survey Preparation
Sample Bottles and Labels
The University of Connecticut Center for Environmental Science and Engineering (CESE) in
Storrs, CT generally performs the laboratory analyses of water samples for the LISWQMP. Prior
to each monthly survey, sample bottles, centrifuge tubes, and pre-weighed foil cups with filters
(Table 1) must be obtained from the lab (directions are provided as Attachment B). Bottle labels
are pre-printed prior to each survey with the following information.
STA ID- Station Identification (e.g., M3)
S or B= surface or bottom sample
LISS- Long Island Sound Study
Date- MM/DD/YY (current year- to be filled out in the field by project scientists)
Type of container
CENT= centrifuge tube
125 mL NALG= 125 mL wide mouth Nalgene bottle
250 mL NALG= 250 mL wide mouth Nalgene bottle
BOD= 2 L poly bottles for BOD analyses
Labels are also pre-printed for foil packets that will contain filters for nutrient analysis.
PC/PN= particulate carbon/particulate nitrogen
CHLA= chlorophyll a
HPLC= high performance liquid chromatography
PP= Particulate phopshorus
Table 1. List of supplies to be obtained from UConn CESE prior to monthly surveys.
Nalgene poly bottles for filtrate storage and delivery (125 ml)
Nalgene poly bottles (250 ml)
Centrifuge tubes for BioSi filter storage and delivery
BioSi filters (47mm polycarbonate membrane filter with a pore size of 0.4um)
PC/PN filters (precombusted 25mm GF/F (glass fiber) filter with a pore size of 0.7um)
Chl a filters (25mm GF/F filter with a pore size of 0.7um)
TSS/PP filters (preweighed, precombusted 47mm GF/F filter with a pore size of 0.7um)
Two-liter poly bottles for BOD samples
M3 S LISS
05/30/06 CENT
M3 S LISS
05/30/06 PC/PN

Long Island Sound Water Quality Monitoring Program SOP Manual 11
The University of Connecticut Marine Science Department at the Avery Point Campus in
Groton, CT generally performs the laboratory analyses of plankton samples for the LISWQMP.
Prior to each monthly survey, sample bottles must be obtained from the lab (directions are
provided as Attachment B). Bottle labels are pre-printed prior to each survey with the following
information.
STA ID- Station Identification (e.g., M3)
S or B= surface or bottom sample
(Researchers Name i.e., Dr. Hans Dam, Dr. McManus, Dr.Lin)
Date- MM/DD/YY (current year- to be filled out in the field by project scientists)
Type of Preservative (i.e., 5% Lugol’s, 2.5% Formaldehyde, 10% Formalin, Lugol’s)
Equipment and Supplies
The Long Island Sound Water Quality Monitoring Program shares the R/V John Dempsey with
the CT DEEP’s Bureau of Natural Resources, Marine Fisheries Division. The Marine Fisheries
Division uses the vessel to conduct surveys of the fish populations of Long Island Sound from
April to June and September to October. Therefore, sampling equipment and gear used by the
LISWQMP must be loaded on and off the boat prior to and following surveys during these
months. Equipment is stored in two locations, the Marine Fisheries Division Headquarters at 33
Ferry Road in Old Lyme and at the CT DEEP’s Field Station, 9 Windsor Ave, Windsor.
Directions to these locations are provided as Attachment B. To facilitate loading and offloading,
the following checklists are provided (Table 2). These should be used to ensure that all needed
equipment, reagents, and supplies are accounted for.

Long Island Sound Water Quality Monitoring Program SOP Manual 12
Table 2. Survey Preparation Checklist
CTD (Sea-Bird model SBE-19
SeaCat Profiler with auxiliary
DO, PAR, pH, and Fluorometer
sensors) or YSI EXO sonde
Windsor
Laptop computer for CTD
communication and real-time
operation
Windsor
or
Hartford
Electromechanical deployment
cable and backup shielded
electrical cable for real time
CTD operation
Windsor
Deionized water in carboys, (2) Windsor
Foil packets labeled with date
and station, for PC/PN, PP and
Chl-a filter storage and delivery
Windsor
Nitrile gloves Windsor
Safety goggles Windsor
Wash bottles Windsor
zip-seal plastic bags Windsor
Slotted screwdriver Windsor
sample bottle loading rod Windsor
volt meter Windsor
Kimwipes Windsor
CRC Marine Formula 6-66 Windsor
Coolers Windsor
Storage
Location Loaded on Boat Off Loaded Comments
Field notebook with coins Hartford
Field data sheets (17 for monthly
surveys, 40 for hypoxia surveys) Hartford
Chain-of-custody forms (3 BOD
COCs per survey, 3 route
specific COCs per survey)
Hartford
Map/site visit plan Hartford
Field writing implements-
Permanent marker for labeling,
Rite-in-rain pen, pencil, etc.
Hartford

Long Island Sound Water Quality Monitoring Program SOP Manual 13
Table 2 (continued). Survey Preparation Checklist
Storage
Location Loaded on Boat Off Loaded Comments
Rosette multi-bottle array
(General Oceanics model 1015) Old Lyme
Niskin model 1010 water
sampling bottles (10) Old Lyme
25 mm filtering apparatus
(Hoeffer filtering manifold with
filtrate collection tank)
Old Lyme
47 mm filtering apparatus for PP
and BioSI (home-made filtering
manifold with 4 1000-ml
filtering flasks and 500 ml
overflow flask)
Old Lyme
47 mm filtering apparatus for
TSS (home-made filtering
manifold with 2 1000-ml
filtering flasks)
Old Lyme
Filtering funnels, bases, and
holders (frit glass and stainless
steel)
Old Lyme
Vacuum filtration pump with
hoses (Remains on the boat) Old Lyme
Graduated cylinders (250 ml) Old Lyme
Filter forceps Old Lyme
Clamp for filtration tank outflow
tubing Old Lyme
Tygon tubing, several lengths, to
use as sample bottle outflow
hose
Old Lyme
Bongo Net Old Lyme
Small (~8 in diameter) sieve
(<64 uM) Old Lyme
Large (~12 in diameter) sieve
<64 Old Lyme
Large (~12 in diameter) sieve
>64 Old Lyme
Saltwater wash bottle Old Lyme
Funnel, white plastic Old Lyme
Plankton Sample Bottles-
Six 125 mL Nalgene containers Windsor
26 250 mL Nalgene containers
(amber)
Windsor
twelve 500 mL wide mouth
containers
Windsor
Twelve 250 mL Nalgene
containers (amber)
Windsor
Life Jackets Windsor
Float Coats Windsor

Long Island Sound Water Quality Monitoring Program SOP Manual 14
Equipment Handling
The primary pieces of equipment used for this monitoring
program are the CTD profiler, Niskin water sampling
bottles, and a rosette multi-bottle array which allows for the
deployment of up to ten sampling bottles and the CTD at
the same time. A laptop computer allows the CTD data to
be viewed in real-time. The rosette, CTD, and Niskin water
sampling bottle array is shown in Figure 4 to the right.
This equipment is state-of-the-art oceanographic equipment
and it is costly to repair. The utmost care should be
taken at all times when handling this equipment. When
gear is being deployed crewmembers should be very careful
to watch for potential hazards, such as lobster pot lines or
the wakes from passing vessels that could cause the
instrument to be swept beneath the research vessel or
entangled. Should any such hazards present themselves, let
the captain or ship engineer know immediately. At any
indication of such a problem, the deployed gear should be
hauled back immediately. In general the ship's captain and
engineer are very aware of the hazards in the water about
them, but if you should see something that you think they
are not aware of do not hesitate to bring it to their attention. This equipment is too valuable to
take chances.
Whenever the vessel is moving, all equipment must be secured in such a way to avoid tipping
and sliding and to avoid any possible damage from other equipment nearby. The same applies
whenever the equipment is transported by vehicle.
References
Long Island Sound Study. Undated. [Online] Research Project Summaries. Accessed 27 January
2017 from http://longislandsoundstudy.net/research-monitoring/lis-research-grant-
program/2004-research-project-descriptions/
Figure 4. Rosette, CTD, and Niskin
sampling array

Long Island Sound Water Quality Monitoring Program SOP Manual 15
Standard Operating Procedures
Standard Operating Procedure For The Calibration Of The Seabird Seacat Profiler (SBE-19)
Dissolved Oxygen Sensor ....................................................................................................... 16
Standard Operating Procedure For Determining Dissolved Oxygen Content Of Seawater Using
The Azide-Winkler Method .................................................................................................... 22
Standard Operating Procedure For Calibration Of The Seabird 18 pH Sensor ............................ 27
Standard Operating Procedure For Field Sampling Using A Ctd/Rosette Sampler Aboard The
R/V John Dempsey ................................................................................................................. 30
Standard Operating Procedure For The Collection Of Secchi Disk Depth Measurements .......... 40
Standard Operating Procedure For The Collection Of Water For Biochemical Oxygen Demand41
Standard Operating Procedure For Filtering Water Samples For Particulate Phosphours (PP),
Dissolved Nutrients, Biogenic Silica (BioSi), And Dissolved Silica Analysis ...................... 42
Standard Operating Procedure For Filtering Water Samples For Particulate Carbon (PC),
Particulate Nitrogen (PN), Chlorophyll A (Chl a), And High Performance Liquid
Chromatography (HPLC) Analysis......................................................................................... 48
Standard Operating Procedure For Filtering Water Samples For Total Suspended Solids (TSS)
Analysis................................................................................................................................... 52
Standard Operating Procedure For The Collection Of Zooplankton Samples ............................. 56

Long Island Sound Water Quality Monitoring Program SOP Manual 16
STANDARD OPERATING PROCEDURE FOR THE CALIBRATION OF THE
SEABIRD SEACAT PROFILER (SBE-19) DISSOLVED OXYGEN SENSOR
In August 2010, CT DEP upgraded the dissolved oxygen sensor on its CTDs to the SeaBird SBE
43 Dissolved Oxygen Sensor, a polarographic membrane sensor. This sensor requires calibration
less frequently, annually by the manufacturer. SeaBird states that electrochemical drift exists
below the calibration certainty of 1 µmol/kg and has not been observed in years of factory
calibration data nor in long deployments. Therefore any drift is attributed to fouling of the
membrane. SeaBird recommends post survey validation whereby the DO and drift are checked
against replicate water collections and Winkler Titrations. See Standard Operating Procedure
for Determining Dissolved Oxygen Content of Seawater Using the Azide-Winkler Method for
instructions on performing Winkler titrations. The calibration coefficients SOC and BOC can be
adjusted to the Winkler results following procedures outlined later in this document. If the
adjustment is greater than 20% the unit should be returned to SeaBird for recalibration.
Selected text adapted from:
Sea Bird Electronics Inc. Application Note 64-2 Revised June 19, 2012 SBE 43 Dissolved
Oxygen Sensor Calibration and Data Corrections
Summary
The CTD dissolved oxygen sensor is calibrated at least 24 hours prior to each survey at the CT
DEEP laboratory in Windsor. Additionally, the CTD and DO sensor are returned to Sea-Bird
Electronics for manufacturer calibration annually. This SOP outlines the steps necessary for
successful calibration.
Equipment/Apparatus
SeaBird Seacat Profiler equipped with SBE 43 Dissolved Oxygen Sensor
Deionized Water
Calibration Tank (100 gallons) Filled with fresh water
Aquarium Pump, airline tubing, air stone
Siphon hose
Laptop computer equipped with SeaSave and Term19 (MS Dos) software
Electro-mechanical cable
Calibration notebook
Writing implement
Sodium sulfite solution
2 Winkler bottles
Winkler reagents (see Winkler SOP)

Long Island Sound Water Quality Monitoring Program SOP Manual 17
Procedure
1. During the winter when water temperatures are colder, drain and refill the calibration
tank with fresh water from the tap. Otherwise, place air stone into tank approximately six
inches from the surface (greater depth will tend to supersaturate the water because the air
will be injected at a pressure higher than atmospheric pressure). Plug in aquarium pump.
2. Connect CTD to computer with the cable. Be careful not the bend the pins.
3. Remove plastic tubing protecting the conductivity cell. Remove short section of tubing
on top of the “Y” connector at the top of the Tygon tubing.
4. Put CTD cage and all into the calibration tank and let soak for at least one hour with the
power OFF.
5. Gather additional items needed to calibrate CTD.
- CTD calibration Notebook,
- Sodium Sulfite,
- Sodium Thiosulfate,
- Manganous Sulfate,
- Alkali-iodide-azide Reagent,
- Starch Solution,
- Sulfuric Acid,
- pH buffers- 7, 10, 4
- Winkler titration bottles,
- rubber hose,
- digital buret,
- Erlenmeyer flasks
- Automatic Pipetter
- Pipette tips
- Shower test bucket
6. Following the one hour soak time, turn on the laptop and log in following the prescribed
security procedures.
7. Double click on the Term19 icon.
a. Press <F6> to wake up the CTD and establish communication.
b. Type DS (Display Status) at the S> prompt to check to make sure the battery is
sufficiently charged (Vmain should be >10 for calibration). Also note the
conductivity value and pump delay.
c. Next, at the S> prompt, type SP (Set Pump) to change the minimum conductivity
value.
i. Set the Minimum Conductivity for Pump Turn On to zero (this insures that
the pump will come on in the fresh water) but do not change the pump
delay (should be 45 seconds). You must type 45 seconds and hit enter (Do
not just hit enter because a value of 0 will be saved). To double check if
the pump settings are correct, hit DS at the S> prompt and be sure that
minimum conductivity is 0 and pump delay is 45.

Long Island Sound Water Quality Monitoring Program SOP Manual 18
To ensure data are not lost from the previous survey, Press <F9> to upload data stored on
the CTD to a temporary file. You will be prompted to enter a file name. Then hit Return.
When the screen appears prompting you to enter Header information hit escape. Once
completed, open the temporary file and confirm all have been uploaded.
Once all the data have been uploaded, Press <F8> to Initialize the Log. At the prompt
asking “Do You Really Want to Initialize Logging?” select Yes.
The message “Profiler is ready for deployment” should appear and TERM19 should close
out, if it doesn’t Push F10 to exit. Select Yes.
8. Double click on the Seasave7 icon.
a. Click on RealtimeData on the Menubar.
b. Select Start Acquisition.
c. Click on Select[.CON]File.
d. It should default to the previous survey’s CON file; however, be sure it is the one
you desire. If not, navigate to the correct file. Select it and Click Open.
e. Click on Enter Output Data File Name.
f. Navigate to the Desktop. Create a new folder and enter the survey name (e.g.,
WQJAN17). Click Open.
g. Type first for file name. Click OK.
h. Click Start Acquisition.
i. In the Header Information Window, enter first as the station name and the time
under Latitude (or Time).
j. Click OK.
k. A pop up window will appear that says “Turn on the SBE19 using the magnetic
switch.” And it will count down for 60 seconds. After about 15 seconds have
elapsed off the clock, turn the CTD on using the tool fashioned for this purpose
(metal wire attachment on the pipe).
9. Let CTD run for at least 500 scans (readings should be stable). After the readings have
stabilized record real-time temperature and DO data displayed on screen into calibration
notebook.
10. In the meantime, place two BOD bottles in the shower collection bucket. Place the
stopper end of rubber hose into the tank {the stopper adds weight). Pinch the tubing about
6 inches from the end not in the water. Place tubing in water up to where you pinched it.
Draw out quickly to start a siphon. With water flowing, place the end of the tube into the
bottom of the BOD bottle. Allow the water to overflow until the bottom of the bucket is
just covered with water (~20 seconds). Continue with second bottle. Begin to perform
Winkler Titrations following the Standard Operating Procedure for Azide-Winkler
Titrations attached herewith this manual.
11. If the CTD value is within +/- 0.2 mg/L of the average Winkler value, the calibration is
complete. If the value is greater than +/- 0.2 mg/L proceed with the steps below to adjust
the SOC coefficient. If the unit drifts greater than 20% it needs to be returned to Sea-Bird
for recalibration.

Long Island Sound Water Quality Monitoring Program SOP Manual 19
SOC coefficient adjustment
SeaBird states that “any sensor drift with time is primarily attributed to fouling of the membrane,
either biological or waterborne contaminants (i.e., oil). Adverse fouling might take several weeks
to months to occur. Fouling of the membrane eventually causes the sensor to read low of correct.
When the SBE 43 sensor starts to show drift from fouling, the effect on the sensor calibration is
linear, and therefore can be corrected by adjusting the linear slope term of the calibration
equation (Soc term…)”.
Follow these simple steps to derive a correction factor to adjust Soc
1. Compute the correction ratio between the Reference value (Winkler) and corresponding
SBE 43 sensor value.
Ratio = Reference / SBE 43
*Be sure the units for each method are consistent (i.e., ml/L; mg/L; µmol/kg).
2. Multiply the correction ratio by the previous Soc in the configuration (.con or .xmlcon)
file or on the calibration sheet.
NewSoc = PreviousSoc * (Reference / SBE 43)
3. Modify the .xmlcon file
a. Click on Configure Inputs on the Menu Bar.
b. Click the Modify Button.
c. Double click Oxygen, SBE 43
d. Update the calibration date with today’s date in MM/DD/YY format
e. Click in the SOC box. Update with the newly calculated SOC.
f. Click in BOC box to ensure your changes are accepted in the SOC box.
g. Click OK.
h. Click Save As.
Navigate to the Desktop and your new survey folder (e.g., WQJAN17). Enter
survey name as the new xmlcon file name. Click Save. Click Exit, Click OK.
4. Perform a check of the new SOC.
a. Click Real-time data. Click Select Output File name.
b. Enter POST as the file name. Click Save. Click Start. Enter post as the station
name and input the time.
c. Turn on the CTD. Allow the CTD to run for 1500 scans.
d. Record the DO value in the field calibration notebook. The new DO value should
be within +/- 0.2 mg/L of the average Winkler value.
5. Perform a QA oxygen check after calibration.
a. Click on RealTimeData, Select Start Acquisition.
b. Click on Select [.CON] File. Use the new .CON file you just saved. Click OK.

Long Island Sound Water Quality Monitoring Program SOP Manual 20
c. Enter the output data file name as “post”.
d. Click Start Acquire, Turn the CTD on.
e. Let CTD run for at least 1500 scans; readings should be stable.
f. Record CTD oxygen measurement in the calibration notebook under the post
heading.
6. Turn CTD off, remove from the tank, and set on the counter to dry. Attach the syringe
filled with DI water over the conductivity cell and carefully dispense until water comes
up through the plenum into the tubing. Draw back the water until the water level is not
covering the membrane (want 100% humid environment, but do not want membrane to
be submersed).
7. Return to the laptop and double click on Term19. Press <F6> to wake up the CTD. Type
“SP” at the DOS prompt. Change the pump turn on setting for conductivity back to 3270
Hz and be sure that the delay is set to 45 seconds. Press <F10> to exit.
8. Disconnect the cable and reinstall the pin protectors and outlet tubing.
9. Load CTD into vehicle to be brought to boat for survey or return to storage cabinet. The
CTD must not be stored in the vehicle overnight- if you bring the vehicle home, bring the
CTD inside. The CTD also must not be left in vehicles when temperatures exceed 75ºF.
Problems and possible causes:
Oxygen value just keeps decreasing - Pump not operating (make sure you have changed
the 'conductivity for pump turn-on' to zero in TERM19!) or plumbing not connected
properly. Oxygen sensor consumes oxygen, so if a constant flow of water is not
maintained across the membrane, the oxygen value will steadily decline.
No values appear in the SeaSav1:2 window – Check the COMM Port Configuration in
SeaSave. Select RealTimeData from the menu bar, Select Start Acquisition. Click on
COMM Port Configuration. The settings should be as shown below. Also check the
Communication Set Up in TERM19. Double Click on Term19, Press <F2> for Setup.
Arrow down until Communication Set Up = is highlighted. Hit Enter. Set the parameters
to match those in Figure X below.

Long Island Sound Water Quality Monitoring Program SOP Manual 21
Figure 7. COMM Port Configuration
Routine (post-cruise) Cleaning (no visible deposits or marine growths on sensor) — Follow
this two-step procedure:
1. Flush the sensor for 1 minute with a 1% solution of Triton X-100 warmed to 30 ºC (86
ºF) using syringe and tubing. Drain and flush with warm (not hot) fresh water for 5
minutes.
2. Soak the sensor for 1 minute in a 500 - 1000 ppm solution of Bleach. After the
soak, drain and flush with warm (not hot) fresh water for 5 minutes.
Dilute concentrated household bleach to 50 to 1 (50 parts water to 1 part bleach) to
produce the proper concentration to clean the oxygen sensor.

Long Island Sound Water Quality Monitoring Program SOP Manual 22
STANDARD OPERATING PROCEDURE FOR DETERMINING DISSOLVED
OXYGEN CONTENT OF SEAWATER USING THE AZIDE-WINKLER METHOD
Summary
The Azide-Winkler Method is used to determine the dissolved oxygen content of the seawater
and act as a quality control check of the CTD Dissolved Oxygen sensor. Winkler titrations are
performed in the laboratory prior to each survey to determine if the DO sensor has drifted.
Explanation of the Winkler titration (Azide modification)
The Azide modification is used to eliminate the interference from Nitrite in the water.
The reaction begins with the addition of two reagents Manganous Sulfate and Alkaline
Potassium Iodide Azide. These reagents react to form a Floc of Manganous Hydroxide. The
Oxygen in the water reacts with the Manganous Hydroxide oxidizing it to Manganic Hydroxide.
This is a one to one relationship; for every molecule of Oxygen one molecule of Manganic
Hydroxide is formed. Sulfuric acid is then added to convert the Manganic Hydroxide to
Manganic Sulfate. At the same time Sulfate from the Manganic Sulfate reacts with the Alkaline
Potassium Iodide Azide to produce Potassium Sulfate and free Iodine. Since the Sulfate for the
reaction comes from the Manganic Sulfate the amount of Iodine released is directly proportional
to the amount of Oxygen in the water. The Sodium Thiosulfate titrant reacts with the free Iodine
to form Sodium Iodine, the solution turns clear when all the Iodine is converted to Sodium
Iodine, each ml of titrant is equivalent to one mg of Dissolved Oxygen. The Starch indicator is
added to enhance the end point.
Refer to Standard Methods for the Examination of Water and Wastewater Method # 4500-O
Oxygen (Dissolved) for additional information.
Equipment/Apparatus
Water Sample
2 Glass BOD bottles with stoppers
Rubber tubing with stopper attached
Safety glasses
N-Dex gloves
Dispensettes or Automatic Pipettes
Manganous Sulfate Reagent
Alkaline Potassium Iodide Azide Reagent
Sulfuric acid
Sodium Thiosulfate
Starch Indicator Solution
Digital Buret
250 mL graduated cylinder
2 Erlenmeyer flask(s)
Shower Testing Bucket
Safety Precautions
The chemicals used for dissolved oxygen determination can be dangerous. Safety glasses
and gloves must be worn whenever handling these chemicals. See Attachment C, which
contains Material Safety Data Sheets, for additional health and safety information.

Long Island Sound Water Quality Monitoring Program SOP Manual 23
Procedure
1) Two BOD bottles are placed into the shower testing bucket with stoppers removed. Place
the stopper end of the rubber tubing and the majority of the tubing into the calibration
tank. Pinch the tube closed underwater. Start a siphon by quickly pulling part of the
tubing out of the tank, release the tube, and placing it into the shower testing bucket.
Once the water is flowing freely, quickly place the tubing into a BOD bottle, getting the
outlet of the tubing all the way to the bottom of the bottle. Do this while the water is
running. DO NOT pinch off tubing.
If the water splashes into the bottom of the bottle as the bottle fills air is being
continuously added to the sample and the DO determination is useless. There
will be a slight addition of air just as the bottle begins to fill, but as long as the
tubing is kept at the bottom of the bottle it will not be too much, and should be
forced out as the bottle is overflowed.
2) Let the bottle overflow two or three times its volume. Allowing the bottle to fill and
overflow for thirty seconds will accomplish this. Alternatively, count while the bottle is
filling - if it takes to a count of 20 for the bottle to fill, then count to twenty two to three
more times and you will have allowed the bottle to overflow its volume by that many
times.
3) Slowly pull the tube out of the bottle with the WATER RUNNING. Stopper the bottle
carefully to exclude any air bubbles.
4) Leave the overflow that remains around the stopper - DO NOT tip bottle and pour this
out. This overflow is important for keeping air out when the reagents are added.
5) Repeat for the second bottle.
6) Standard stock reagents are then added to the samples using either bottle top dispensettes
or hand held automatic pipettes.
Add one milliliter (ml) of MnSO4 (manganous sulfate -reagent #1).
Procedure for using hand held pipette:
a) Check to see that the pipette is set to dispense 1 ml - the 1-ml line should be just
visible at the top of the notch.
b) Wipe outside of pipette tip off with a Kimwipe before filling with reagent.
c) Push the plunger down to the first stop point, submerse pipette tip in reagent, and let
plunger come up slowly. Releasing the plunger too rapidly will allow reagent to go up
into the pipette, and this can cause clogging or other problems that reduce the accuracy
of the pipette.
d) Lift the sample BOD bottle stopper only when you are ready to dispense the reagent.
e) Hold pipette tip just above the surface of the liquid when dispensing the reagents. DO
NOT submerse the pipette tip into the sample. This avoids contamination of the pipette
tip and so avoids contamination of the reagents.
f) Push down on the plunger to dispense reagent into the bottles, and when plunger
reaches the first stop, pull gently towards you so it will go all the way down, forcing
the last drop out of the tip.

Long Island Sound Water Quality Monitoring Program SOP Manual 24
Procedure for using Dispensette bottle top dispenser:
a. Remove the cap covering the tip of the dispenser.
b. Turn recycler valve to the dispensing position.
c. Unstopper the BOD sample bottle (one at a time) and place it beneath the
dispensing tip.
d. To dispense, gently lift the plunger up until it stops, and then gently push all
the way down. The dispensing tip should be within the bottle opening but not
touching the liquid.
e. Recap tip.
7) Add 1 mL of alkali-iodide-azide reagent (reagent #2) to all bottles in the same manner as
described in Step 6 above using either the dedicated dispensette or place a new clean tip
on the hand held pipette.
8) Turn the tap water on in the sink. Carefully remove the sample bottle(s) from the counter.
Place your forefinger on the stopper of the bottle to prevent leakage and entry of air into
the sample. Rinse the top of each bottle under running water so that reagents in the
puddle on top of the bottle do not go onto the counters or floor.
9) Keeping one finger on the stopper invert the bottles a few times to thoroughly mix the
water and the reagents. A flocculent will form and the bottles should be mixed enough so
that this flocculent is homogenous throughout the bottle. Return the bottle to the counter
to allow the floc to settle.
10) When the manganese hydroxide floc has settled to half the bottle volume, leaving clear
supernatant above, the third and final reagent, sulfuric acid, is added. Be very careful
with the dispensing of the acid. Wear gloves and safety glasses.
a) Remove the cap covering the tip of the dispenser.
b) Turn recycler valve to the dispensing position.
c) Unstopper the BOD sample bottle (one at a time) and place it beneath the
dispensing tip.
d) To dispense, gently lift the plunger up until it stops, and then gently push all the
way down. The dispensing tip should be within the bottle opening but not
touching the liquid.
Continue steps b, c, and d until all of the sample bottles have been acidified.
e) Turn recycler valve back to recycle position and replace cap on the tip of the
dispensing arm.
11) Thoroughly mix the bottles, being sure to keep a finger tightly on the stopper. Start the
mixing by inverting the bottle over the sink, rinsing the top of the bottle under running
water faucet to remove any acid from the bottle lip. Mix well by inverting bottle end to
end. Invert until all signs of flocculent are gone. Visible brownish specks in the bottle
indicate that the floc is not completely dissolved.

Long Island Sound Water Quality Monitoring Program SOP Manual 25
Titration
1) Unscrew the cap of the sodium thiosulfate solution. Assemble the digital buret by
inserting the filler tube into the buret. Place the buret onto the sodium thiosulfate. To
avoid air bubbles, it is helpful to have the tube reach close to the bottom of the reagent
bottle. Carefully screw the digital buret onto the bottle. Set the buret to recycle mode.
Turn on the buret. Turn the dispensing wheel towards you until you have “dispensed”
around 100mL. Next carefully remove the display panel to reveal the mechanism. Turn
the wheel a few more times watching as the liquid is drawn up into the tubes. Be certain
that no air bubbles are visible in the exposed tubing or at the dispensing tip. Replace the
panel. Turn the buret to dispense mode. Turn the wheel, allowing the chemical to fill the
dispensing tube and discharge about 5 mL into the sink to be sure all air bubbles are
removed from the dispensing tube. Clear the readout.
2) Pour approximately 15 mL into a 250 ml graduated cylinder (one with a hole drilled at
about 200 ml). Swirl and swish the cylinder to rinse thoroughly. .Dispose of the rinse
water down the drain. Leave the water running for a few minutes to completely flush the
sink pipes and dilute the waste. Repeat.
3) Measure out 201 ml into the graduated cylinder. Set the cylinder aside on the counter.
4) Pour the remaining sample from the BOD Bottle into the Erlenmeyer flask, swirl and
rinse. Drain the rinse water into sink, flush. Place the BOD bottle and stopper into the
sink for cleaning later.
5) Pour the 201 ml from the graduated cylinder into the flask. Place the flask beneath the
buret. Repeat for the second BOD bottle. Place the flasks on the right side of the buret in
the order to be titrated.
6) Double check that the buret is reading 0 mL.
7) Hold the flask in one hand. Slowly add titrant by turning the wheel while continuously
swirling the flask until the solution turns straw colored (light yellow).
8) Add a small amount of starch indicator solution (~2 mL by squirting the bottle twice
around the sides of the flask). This will turn the solution a blue-purple color.
9) Slowly continue to add titrant, swirling constantly. The solution will turn blue. As the
solution gets light blue titrant must be added ONE DROP AT A TIME. Give each drop a
chance to mix in fully before adding another. The endpoint is reached when the solution
turns clear. The solution will change from a very pale blue-grey to clear. The drop that
makes the difference should be obvious as the solution turns clear, check the color
against a white surface such as a sheet of paper.
10) Record the digital readout of the buret in the Winkler section of the CTD calibration
notebook. If you overshot the endpoint write O.S. on the field sheet for that bottle.
Repeat for the second BOD bottle.

Long Island Sound Water Quality Monitoring Program SOP Manual 26
[(If due to a spill, less than 201 ml of the sample are available, the titration can still be
performed. Be sure to record on the data sheet the volume of fixed sample available to
titrate. The dissolved oxygen (DO) is calculated using the following equation:
mg O2/liter = ml of titrant x 0.025 x 8mg/meq O2 x 1000 ml/liter
ml of sample
(0.025 = normality of sodium thiosulfate solution, the titrant)
NOTE: ml of sample in the above equation refers to original sample volume. The
original sample volume is modified by the addition of reagents. Therefore, if 201
ml can not be used due to a spill, calculate ml of sample (x) using the following
equation:
x = 298y/300
where y = the volume of fixed sample available to titrate; and
x = original sample volume after correction for sample loss by
displacement with reagents (to be used in above equation)
Example: Only 150 ml of the fixed sample are available to titrate due to a spill.
x = (298)(150)/300 = 149; ml of sample = 149.)]
11) Rinse the BOD bottles and stoppers thoroughly with water and then with Deionized
water. Place the bottles upside down in the wooden rack to dry.

Long Island Sound Water Quality Monitoring Program SOP Manual 27
STANDARD OPERATING PROCEDURE FOR CALIBRATION OF THE SEABIRD 18
pH SENSOR
Summary
In August 2010, CT DEEP upgraded its CTDs to include pH sensors. The SBE 18 pH
sensor is an add-on auxiliary sensor for profiling CTDs. The sensor uses a pressure-
balanced glass electrode/Ag/Ag-Cl reference pH probe to provide in situ
measurements at depths up to 1200 meters. The pH sensor is returned to the
manufacturer for annual calibration along with the CTD.
SeaBird software calculates pH as:
Vout = offset + [ slope * (R * T / F) * ln (10) * (pH - 7) ]
Where
R = gas constant = 8.31434
F = Faraday constant = 9.64867 x 10 -4
T = temperature (ºK)
Vout = output voltage from pH sensor (0 - 5 volts)
Substituting for R, F, and ln (10):
Vout = offset + [ slope * 1.98416 x 10 -4 * T * (pH - 7) ]
Therefore,
pH = 7 + (Vout - offset) / (1.98416 x 10 -4 x T * slope)
The following information was excerpted from SeaBird Application Notes No 18-1
SBE 18, 27, and 30, and AMT pH Sensor Calibration (PHFIT Version 2.0) and 18-2
pH Sensor Storage, Maintenance, and Calibration. Both notes were revised February
2010.
Equipment/Apparatus
pH buffer solution 4, 7, 10
Small plastic beaker (~50 mL)
Phillips screwdriver
Small gage calibration Wire
Wash bottle filled with deionized water
When the pH Sensor is Not in Use
1. Replace the soaker bottle over the plastic pH electrode by removing the soaker bottle cap,
sliding it along the plastic pH electrode as far as it will go, and threading the bottle up into the
cap. There should be enough fluid in the bottle to cover at least the glass electrode and Teflon
reference junction.
2. Remove the bottle by reversing the sequence.
When removing or installing the soaker bottle, do not force the pH electrode sideways. The
electrode’s outer shell is plastic, but the inner stem is glass and can break if the electrode is
handled roughly.
Figure 8. pH probe

Long Island Sound Water Quality Monitoring Program SOP Manual 28
The soaker fluid is pH 4 buffer solution saturated with KCL. The pH 4 solution is acidic, and
will eat away most fouling of the pH electrode. The sensor will tolerate the periodic absence of
the soaker bottle and can be returned to initial performance by soaking for a few hours. However,
exposure of the bare sensor to temperature extremes (e.g., strong direct sunlight on a hot
day) can cause a loss of internal electrolyte. Subsequent cooling will draw air into the sensor,
which will lead to pressure-related problems.
Note: The sensor contains a non-organic electrolyte and antibacterial inhibitors designed to
optimize its use in marine environments.
Prior to each survey, recalibrate the pH Sensor
Sea-Bird pH sensors are calibrated with commercial buffer solutions (±0.02 pH). Make periodic
corrections by comparison to buffers near the anticipated in situ pH, typically in the 7 - 8 pH
range. Best calibration of the sensor is obtained by soaking the sensor in deionized water for 30
minutes prior to standardization with buffers.
To calibrate:
Review the SeaBird pH calibration YouTube video http://www.seabird.com/ph-sensor-
calibration. This procedure is slightly different from our SOP, but it is helpful and
informative, just the same.
1. Run Seasave V7, set it up to display the pH voltage (the voltage channel for the pH data is volt
1), and start real-time data acquisition.
2. Connect a small-gauge wire to one of the screws at the connector end of the sensor housing
and the other end will be put into the small beaker containing the buffer solutions during the
calibration.
3. Rinse the beaker and pH probe with DI water. Discard. Next rinse both the probe and beaker
with pH 4 buffer- Fill the beaker to about 10 mL with buffer solution. Place the beaker over the
probe and gently swirl around. Discard the solution. Repeat. Again fill the beaker with pH buffer
4 solution, this time to about 25 mL. Put the pH probe in the buffer solution and wait 1 minute
for complete stabilization. Record the resulting voltage on the computer display in the calibration
notebook.
4. Repeat this process in order with pH 7 buffer and pH 10 buffer. Rinse the beaker and pH
electrode in deionized water between measurements in the different pH buffer solutions.
Note: In our SEASOFT V2 suite of programs, edit the CTD configuration (.con) file using the
Configure Inputs menu in Seasave V7 (real-time data acquisition software) or the Configure
menu in SBE Data Processing (data processing software). Select pH as a voltage sensor when
editing the configuration file; the software prompts for slope and offset.
Sea-Bird provides PHFIT software to use when calibrating their pH sensors. PHFIT is part of the
SEASOFT-DOS software package; the latest version of the software is available for download
from the SeaBird website.

Long Island Sound Water Quality Monitoring Program SOP Manual 29
5. If the probe reading varies from the standard by more than +/- 0.15 SU, Run PHFIT:
a) Double click on the PHFIT shortcut on the laptop desktop.
b) At the prompt, enter the sensor serial number and the temperature (in ºC) of the buffer
solutions (should be room temperature).
c) At the prompt, enter the pH of 4. Hit return. Enter the output voltage (Vout). Hit
return. Repeat for 7 and 10. . Once you entered the last value hit enter again. When
you have finished, the program outputs the offset and slope, along with the residuals.
6. Enter the new offset and slope in the CTD’s configuration (.con or .xmlcon) file.
a. Click on SBEDataProc.exe.
b. In the Configure menu, select the applicable CTD.
c. In the dialog box, click Open and select the applicable .con file for the CTD.
d. In the sensor list, double click on the pH sensor.
e. Enter the new offset and slope in the dialog box and click OK.
f. Click Save As and enter the survey date to save the changed configuration (.con)
file.
7. Run a QC Check using one of the pH standards to confirm the calibration was successful.
8. Rinse the pH probe with DI water. Replace the sensor soaker bottle. Clean up.

Long Island Sound Water Quality Monitoring Program SOP Manual 30
STANDARD OPERATING PROCEDURE FOR FIELD SAMPLING USING A
CTD/ROSETTE SAMPLER ABOARD THE R/V JOHN DEMPSEY
Summary
A SeaBird SeaCat SBE 19- CTD (Conductivity, Temperature, and Depth) Recorder equipped
with a LyCor PAR sensor, SBE 18 pH sensor, Wet Labs fluorometer and SBE 43 dissolved
oxygen sensor is used to obtain in situ water quality data from Long Island Sound. The CTD unit
is mounted to a Rosette multi-bottle array Water Sampling System. The Rosette accommodates
up to 10 General Oceanics Niskin bottles for the collection of water samples using “grab”
techniques. The bottles are actuated remotely from a deck command unit.
Equipment/Apparatus
Electromechanical cable(s)
CTD unit
Niskin Bottles
Rosette Sampler
½ inch socket driver
½ inch double end Hex Box wrench
Phillips head screw driver
Regular head screw driver (~1/8 inch wide)/loading rod
Coins
Laptop computer equipped with TERM19 and SEASAVE software
Procedure
A. Attach the electromechanical cable to the CTD and net reel
Before disembarking
from the dock, the
electromechanical cable
must be connected to
both the net reel and the
laptop computer.
Enter the onboard
laboratory. Remove the
foam plug from the hole
to the left of the desk on
the starboard side.
Bring the cable out on
deck. Place the end with
the green metal
connector carefully into
the hole through the
wall. Return inside.
Replace the foam plug
from the inside to
prevent water from
entering the cabin.
Connect the cable to the gray electrical box mounted to the wall above the hole. Go back out on
deck. Uncoil the cable and run it along the starboard side of the deck towards the net reel.
Carefully, climb up the support to attach the cable to the slip-ring mounted on the net reel. You
Hole
Cable here
Figure 9. Stern of the R/V John Dempsey showing the
placement of the electromechanical cable

Long Island Sound Water Quality Monitoring Program SOP Manual 31
can brace yourself on the rosette table and one foot on the net reel support. Remove the
protective tape wrap. Spray connections with CRC 6-66 silicon if needed. Connect the cable to
the slip-ring. Be sure to also connect the safety line.
B. Setting the Niskin Bottles in the Array
1. Insert the Niskin Bottle in to the array (Figure 10
and 11).
Grasp the bottle by the handle.
Hold the bottle in the upright position with the
air vent at the top and the stop cock on the
Bottom. Gently tilt the bottle so that the air
vent is pointing towards you.
Line up the hole on the bottom of the lower
mounting block with the pin on the array.
Slid the pushrod down. Tilt the bottle back to
the vertical position. Release the pushbar so
that the round white cap fits into the hole on
top of the array.
Continue placing bottles on the rosette working
counterclockwise starting in position #3. There
should be no empty positions between bottles.
Lanyard
Pushrod cap
Hole for Pin
Lower Mounting Block
Figure 10. Niskin Bottle
Top plug Bottom plug
Air vent Stop cock
Figure 11. Niskin bottles in the sampling
array.

Long Island Sound Water Quality Monitoring Program SOP Manual 32
2.Using a slotted screwdriver or a coin, turn the ramp/shaft at top center of the rosette until the
beveled edge points toward the location one position to the left (counterclockwise) of the first
bottle to be actuated (see Figure 12). If the first bottle is in position #1, then the beveled edge
should point towards #12; if the first bottle is in position #2, the beveled edge should point
towards #1, etc. The shaft will turn clockwise or counterclockwise, but remember: a
counterclockwise turn towards an untriggered bottle will trigger that bottle (it will scare
you and can hurt you if you are not expecting it!); and the shaft will not turn clockwise if a
bottle at the clockwise position is set.
3. Unclip the lanyard from the bottom plug.
4. Pull open the top plug.
5. Holding the lanyard against the closing force, insert the lanyard loop (at the end of the short
extension) into the lanyard opening at the top of the rosette.
6. Using the loading rod (small flat head screwdriver with flat side pointed away from you),
gently push the release pin down and forward toward the loop (see Figure 12). A faint click
should be heard when the release pin has locked, and the little white ball will move forward
and lock the lanyard loop in place. If you miss the loop and the ball locks, gently push the pin
up and back. Repeat for all bottles on the rosette working counterclockwise.
7. Pull the bottom plug open and snap the clip on the long extension of the top lanyard through
the loop attached to the bottom plug. Do this connection on the right side of the bottle. Be
Figure 12

Long Island Sound Water Quality Monitoring Program SOP Manual 33
sure that the white ball in the center of the long lanyard extension is not caught behind or
between neighboring bottles. It is important that this ball be on the outside of the bottles so
that the bottles are free to close. It is also necessary that the bottles are all set in the same
direction, in other words, that the lanyards connecting the top and bottom all be on the same
side of the bottles - to the right when you are looking at the bottles. This ensures that no
bottle interferes with the operation of another. Repeat for all bottles on the rosette working
counterclockwise.
8. Close all air vents by turning clockwise until tightened. These are the screw closures on the
top of each bottle. It is imperative that these air vents be closed because no air should be
introduced into the water before it is drawn from the bottle for dissolved oxygen
determination.
9. Close all stopcock assemblies. These are at the bottom of each bottle and are used to draw
water from the bottle. Pull out the outer ring (away from the bottle) until a click is heard (or
felt), and then rotated slightly so that the small hole in it no longer lines up with the pin
beneath.
10. Check that the lead weights attached to the bottom of the rosette frame are secured. These
are held on with hose clamps, with some tie wraps providing additional support. A daily
check that these are secure will avoid the loss of a weight.

Long Island Sound Water Quality Monitoring Program SOP Manual 34
C. Moving CTD between the Cage and the Rosette
The CTD is always transported and stored in its cage and so must be
removed from the cage (Figures 11 and 13) and secured in place on
the rosette mount (Figure 11). NOTE: When you are ready to
remove the CTD to move it between the rosette and the cage stay
with it. Do not leave it half secured in either place and do not put
it down on any surface. Avoid transferring the CTD from the cage
to the rosette when conditions are rough and the rear deck is being
constantly sprayed with saltwater. Under such conditions, request
that the captain slow the vessel in order to make the transfer with a
minimum risk of bare electrical connectors coming in contact with
saltwater.
The CTD must first be moved from the cage to the rosette. The rosette
mount attaches to the rosette. Following the day’s activities the CTD
can be stored in the on- board lab in the mount. The mount is secured
to the wall in the Niskin holder assembly on the port side of the
vessel.
1) Unscrew and remove the bolts and associated plastic washers
attaching the base of the CTD to the lower crossbar of the cage.
Unscrew the stainless steel thumbscrew from the top of the CTD
mount.
2) Loosen bolts securing the upper support, but do not remove these bolts yet.
3) It may be necessary to unplug the two cables on the bottom of the CTD if they are around
the lower crossbar (usually happens upon return from factory calibration). Loosen the
collar by turning it to the left (counter clockwise). Carefully, pull the connectors off
STRAIGHT. It is very important that these cables be released and re-secured very
carefully. The connectors are pins and if they are removed or plugged in without extreme
care the pins can bend, weakening them and making them more likely to break. Do not
unplug them unless you are ready to move the instrument. If possible reconnect the
cables so that they are free from the crossbar.
4) Finish loosening the bolts securing the upper ring and carefully remove CTD from cage.
Immediately take the CTD to the rosette or place it in the Niskin assembly. The CTD
mount is fashioned out of a repurposed Niskin bottle equipped with a stainless steel
pushrod and a locking washer and thumbscrew. Mount the CTD onto the rosette or into
the in lab assembly exactly as if mounting a Niskin. Be sure to install and tighten the
thumbscrew to prevent the pushrod from
5) Carefully unplug the cap from the connector. Unplug the cap from the cable attached to
the rosette. Carefully push the connector from the cable onto the connector from the
CTD. Always pull connectors off and push them on STRAIGHT to avoid bending the
pins. When it is cold, the rubber of these connectors is not pliable and it is more difficult
than usual to plug the connectors in. Do not force them. Most of the connectors have a
raised bump on the outside that corresponds to the position of the largest pinhole; this
Figure 13. CTD in
cage

Long Island Sound Water Quality Monitoring Program SOP Manual 35
bump should be lined up with the largest pin. Do not leave the instrument unattended
when any of the connectors are unplugged. Salt water is very damaging to these
connectors so it is imperative that they not get wet. A silicone o-ring compound is used
to keep moisture out. If it appears that the grease is gone, add a very small amount
around the rubber ring beneath the pins. If the pins get some salt water spray on them,
carefully wipe off with a damp (fresh water) towel and then dry thoroughly before
plugging in.
6) Be sure that all locking rings around the electrical connectors are secure; but DO NOT
over-tighten.
D. Preparing CTD for Deployment
1) An ice pack is secured against the dissolved oxygen sensor to keep the sensor from
heating up while on the deck between casts. It is important to secure the ice pack at the
start of each day so that the CTD will be ready for the first cast. (During some times of
year this may not be necessary because air and water temperatures are very similar. An
ice pack can also work to conserve heat though, so if there is risk of freezing while unit is
on deck, an ice pack can help avoid this.)
2) Remove the syringe with tygon tubing that attaches to the bottom of the conductivity cell.
Put this syringe in a safe place in the lab. The conductivity cell is glass and should be
handled especially carefully - DO NOT force any tubing on or off. This tubing can
remain off during the course of a day. Remove the plastic cap over the tubing at the top
of the CTD.
3) Check to be sure that the plumbing is hooked up correctly (see Figure) and that all of the
connections are secure. The correct hook-ups allow water pumped in through the bottom
of the conductivity cell to move across the DO sensor, through the fluorometer and then
through the pump and out the outlet at the back of the pump.
4) Check the screws on the magnetic ON/OFF switch. These screws have a tendency to
loosen and should be checked daily. Do not over tighten. Switch should move freely but
not slide on its own.
5) Check to be sure that all cables are connected and that all locking sleeves are tightened.
The I/O port of the CTD needs to be connected to the Y-cable that connects the end of the
electromechanical cable to both the rosette and the CTD, or to a separate real-time cable.
6) Leave ice pack in place until just before cast is to begin.
E. Start/set up Laptop
In general, the CTD memory is cleared at the beginning of each day. Be sure that all stored
files have been uploaded to the computer before initializing the log. If the unit is operating in
real-time mode the files are automatically uploaded to the computer. It doesn’t hurt to double
check the C:/windows/survey name directory before initializing the log.

Long Island Sound Water Quality Monitoring Program SOP Manual 36
Initialize the log
1) Plug the communication cable from the CTD (from the gray box in the lab) into the com
port on the computer. Turn on the computer.
2) Double click the TERM19 icon. At the prompt hit the F6 key to wake up the CTD.
3) At the S:> prompt type DS to check instrument status.
Check main battery voltage, which should be at least 10.3. If less than 10.3, a freshly
charged battery should be installed (batteries are rechargeable nickel-cadmium battery
pack or 9 alkaline D-cells). See end of this section for directions.
Check Minimum Conductivity for Pump Turn-on: 3270 for the open sound (or 0 for near
shore waters (NCA)). Check date and time; sample rate: 1 scan per 0.5 seconds; etc. If
the pump turn-on is set to zero, type sp at the prompt to set pump. Type desired setting
and then make sure pump delay is set to 45 seconds.
4) Press F8 to clear the CTD memory (initialize the log). Select Yes at the prompt. The
computer will say please wait, then it will say logger prepared for deployment and it will
exit TERM19.
Enable real-time acquisition
1. Double click on the SEASAVE icon.
2. Select the proper .CON file when prompted at the start. Be sure that the scroll display
(SEASAV1:3) has the display file survey.dsf selected under setup. Also change the
headers to match the survey. On the menu bar click configure and then header.
3. Next click "Real Time Data" from the menu bar.
4. Then select "Start Acquisition".
5. Go to "Enter output data file name" make sure that the path is correct and enter the file
name e.g. A4080206 (station name/month/day/year).
6. Click "Start Acquire" with the mouse and enter the station name and the time on station.
7. Press enter to start acquiring data.
8. The computer will begin to count down and you have 60 seconds to turn the CTD unit on
at the rosette.
NOTE: CTD downcast should be continuous; at a rate of approximately 0.2 meters/second
(slower is OK).
F. Rosette Deployment
1) Don hardhat and life jacket. Proceed to the rosette table at the stern of the boat.
2) TURN ON THE CTD. Be sure to push the magnetic switch up firmly and fully.
3) There should always be two crewmembers handling the rosette at deployment time.
When assisting with this deployment, be careful to keep track of where the arms of the
net reel are. Hold onto the rosette by the frame along the radiating support bars not
where the weights are. DO NOT grab onto a sampling bottle or to the CTD to maneuver
the rosette. Help to guide the rosette up off of its stand, keeping it from banging into the
arms of the net reel. If the rosette swings be careful to keep hands on radiating
support bars of the rosette and not on the outer rim of the circular base where there
Long Island Sound Water Quality Monitoring Program SOP Manual 37
is the danger of hands and fingers getting caught between the rosette and the boat.
4) Guide the rosette off the stern, pushing it out slightly and keeping it stable so it does not
swing and/or bang up against the stern of the boat. Continue to push it out and guide it as
it is lowered into the water. Look for air bubbles coming from the CTD as the rosette is
lowered. This ensures that the plumbing is not clogged. If working with a real-time data
cable separate from the electromechanical cable, this cable must be fed out as the rosette
is lowered. DO NOT allow this cable to slack as it could be drawn beneath the vessel
and become tangled with the propeller (very bad).
5) Let the hydraulics operator know when the CTD is submersed just enough to cover the
small extension of tubing that extends from the tubing connector - where the air is forced
out of the plumbing system through a small release hole. Be sure that the CTD is
submersed enough so that the tubing extension remains submersed. If the water is
choppy the rosette will need to be set slightly deeper, because if the small tubing
extension comes out of the water, air can get into the system and the pump can lose its
prime.
6) The rosette must be allowed to soak beneath the surface of the water for at least three
minutes before the downcast is started.
This serves a number of purposes: it allows the CTD to come to equilibrium with
the surrounding water - this is especially important for temperature. If the unit
has been on the deck for a couple of hours and been warmed by the sun, it needs
time to cool down to the temperature of the water. The equilibration period gives
the plumbing system a chance to fill with water, pushing out any air, and gives the
pump a chance to turn on - there is a 45-second delay between the time the CTD
enters the water and the time the pump turns on (this allows the plumbing to fill
with water, the pump will not pump water effectively if any air is trapped in the
plumbing, the pump can be damaged by prolonged operation in air). Finally, the
three-minute equilibration period allows the dissolved oxygen sensor time to
polarize, which is essential for adequate response time and performance.
While the rosette is soaking record station observations on the field data sheet- % cloud
cover, current weather, sea state, latitude/longitude from the boat’s Global Positioning
System, the station depth from the boat’s depth finder, time on station, etc. See
Attachment E for an example field sheet and explanations for cloud cover, sea state, etc.
G. CTD Cast and Water Sample Collection
1) Following the equilibration period, notify the hydraulics operator to lower the rosette to the
bottom. When the rosette reaches the bottom, tell the hydraulics operator that the bottom
had been reached and record the depth on the field sheet under the CTD depth field.
The downcast is performed without stopping the rosette until it reaches the bottom. The
descent rate should be approximately 0.2 meters per second. The hydraulics operator
must be told if the descent rate is too fast. The boat’s depth-finder provides an
approximate depth at the station, and the real-time readout on the computer screen
provides the actual depth of the rosette. The real-time readout will indicate when the

Long Island Sound Water Quality Monitoring Program SOP Manual 38
bottom has been reached - by depth readings that do not change - there is a delay in this
readout. During regular monthly water quality surveys the rosette should immediately be
raised 5 m off the bottom.
During hypoxia surveys when a near-bottom sample is to be collected instruct the
hydraulics operator to raise the CTD to 1 meter off the bottom.
Record the CTD data on the field sheet.
If a separate real-time data cable is used, this must be hauled in by hand as the upcast is
underway. Wind this cable neatly back into the grey tote as the rosette is raised through
the water column. This will ensure that the cable will unwind freely for the next
deployment.
2) Collect bottom water samples by pushing the red sample (trigger) button on the rosette deck
command unit; a yellow light comes on, there is a delay before the
trigger actually closes the bottle - a click can be heard and the dial
advances to the bottle location number that was just actuated; the
green light then comes on. [During this operation, a stepping motor
in the rosette rotates the shaft and ramp one position at a time. At
each step the ramp frees a release pin which in turn releases the nylon lanyard and trips the
corresponding sampling bottle.] Repeat the procedure to collect successive samples. The
number of bottles collected at each station varies with the type of survey being performed
(e.g., monthly or hypoxia). Refer to Attachment G as a guide to the number of bottles
collected at each station and depth. Generally, two bottles are filled at this depth.
To ensure samples are actually being collected, connect the volt meter to the deck
command unit. When the readings on the volt meter are 52+ 2 the bottles have been
triggered.
3) Mid-depth samples are taken on the upcast at stations where plankton samples are collected.
The rosette will be stopped at appropriate depths withthe depth of these samples
approximately evenly spaced between surface and bottom samples. The depth of sample,
from the real-time computer readout, must be recorded on the appropriate data sheet. The
up-cast rate of retrieval should also be 0.2 meters/second.
4) Lastly, the rosette is brought up to a depth of 2 meters (surface sample), and the procedure
for recording CTD data on the field sheet and filling bottles is repeated; generally two
bottles are filled at this depth.
H. Retrieving the Rosette
1) The same care taken when the rosette was deployed should be taken upon retrieval. Be
ready to keep the rosette from swinging and banging against the stern of the boat, and grab
the base and help guide the rosette onto its stand. TAKE CARE TO KEEP
HANDS/FINGERS OFF THE OUTER EDGE OF THE ROSETTE BASE TO AVOID THE
Figure 14. Deck Command Unit

Long Island Sound Water Quality Monitoring Program SOP Manual 39
POSSIBILITY OF HAVING THEM CAUGHT OR CRUSHED BETWEEN THE
ROSETTE AND THE BOAT.
2) TURN THE CTD OFF.
3) Secure ice pack around dissolved oxygen sensor.
I. Water sample handling
1). One crew person will remove the Niskin bottle containing the bottom sample and one will
remove the bottle containing the surface water sample. These bottles are brought into the
laboratory in the wheelhouse. The bottom sample is placed in the right slot in the rack and
the surface sample is placed in the left slot.
During hypoxia surveys, where no filtering is to take place or where near bottom and
mid samples are collected, sample bottles for DO determination are usually filled on
deck. Additionally, bottles for special projects such as the Altabet study may also be
filled on deck.
Water for biochemical oxygen demand analysis is also drawn on the deck (See BOD
SOP below).
At select stations (see phytoplankton section) water is composited from the Niskin
bottles into a large carboy for plankton analysis. This may require a second cast with
the rosette.
J. Reset Niskin Bottles for the next station
K. Repeat above steps F-H for remaining stations.
L. End-of-Day Equipment Care
Make sure the CTD is turned OFF.
Return the CTD to the storage rack in the wheelhouse if sampling the following day or to the
cage at the end of the survey. Reattach the syringe and flush DI water through the conductivity
cell into the tygon tubing above the DO sensor by pushing and pulling the plunger a few times.
Store the CTD with DI water in the chamber but not covering the membrane to keep 100%
humidity environment. Remove all Niskin bottles from the rosette and store in plastic crates on
board.

Long Island Sound Water Quality Monitoring Program SOP Manual 40
STANDARD OPERATING PROCEDURE FOR THE COLLECTION OF SECCHI DISK
DEPTH MEASUREMENTS
Summary
One of the major diagnostic tools in the analysis of eutrophication is the measurement of water
transparency. Algal blooms decrease light penetration by light absorption, and scattering water
transparency and light penetration are proportional to the density of the algal bloom.
A simple method of estimating light penetration in the vertical direction is with a Secchi disk,
where the disappearance depth is defined as the Secchi depth. The Secchi disk is submerged into
the water from the shady side of an anchored boat or from the end of a pier. The Secchi disk is
lowered to a point where it is no longer visible and then raised to a level where it again becomes
visible. The Secchi Depth at this point is measured (meters) and recorded.
Safety Warnings
Take care when leaning over the gunwales of a boat not to fall in. Be sure to wear a lifejacket.
Equipment/Apparatus
Weighted 8 inch (20cm) Secchi disk with alternating black and white quadrants
Calibrated, Non-stretch Line (tenths of meters)
Procedure
1. Position yourself on the shady side of the boat.
2. Remove sunglasses.
3. Slowly lower the Secchi disk into the water until it is no longer visible. Note the depth at
the waterline.
4. Slowly raise the Secchi until it becomes just visible again. Note this depth.
5. Average the two depths and record on the Field Data Sheet.
Interferences
There are many types of interferences or sources of variation for Secchi disk readings. These
include but are not limited to surface glare, ripples and waves, angle of the sun, cloudy vs.
clear sky, variations in eyesight of the observers, shadows of the boat, weeds, and
resuspension of sediments from the bottom. Additional variations are caused by variations in
size of disks used (20 cm is used here), variations in color (white is commonly used also, but
a black and white disk is used here) and use of a viewscope to reduce glare.
Quality Assurance/Quality Control
Quality control involves participation in a yearly field training session for new staff. During
field training, new staff must replicate readings taken by experienced staff following
procedure above, and must agree within 20 percent.
Annual checks of the calibrated line against a meter stick are performed to ensure the line has
not stretched and to remark the calibrations in the event of fading.

Long Island Sound Water Quality Monitoring Program SOP Manual 41
STANDARD OPERATING PROCEDURE FOR THE COLLECTION OF WATER FOR
BIOCHEMICAL OXYGEN DEMAND
Summary
The Biochemical Oxygen Demand (BOD) is an empirical test in which standardized laboratory
procedure is used to determine the relative oxygen requirements of wastewaters, effluents, and
polluted waters. The test measures the oxygen required for the biochemical degradation of
organic material (carbonaceous demand) and the oxygen used to oxidize inorganic materials,
such as sulfides and ferrous iron.
The method consists of placing a sample in a full, airtight bottle and incubating the bottle
under specified conditions for a specific time. Dissolved Oxygen (DO) is measured
initially and after incubation. The BOD is computed from the difference between the
initial and final DO. For specific analytical procedures, refer to the CESE SOP.
References 1979 US EPA Manual entitled, “Methods for Chemical Analysis of Water and Wastes,” EPA 600/4-79-
020, Revised 3/83, Method 405.1, (p. 405.1).
“Standard Methods for the Examination of Water and Wastewater,” 18th Edition 1992, Method
5210 B, (p. 5 - 2-6). Equipment/Apparatus
Niskin Bottle filled with sample water
Tygon tubing
Pre-labeled 2 L plastic sample containers
Procedure
1. Sample rinse the collection bottle twice before collecting the sample.
Attach small tygon tube to the stopcock of the Niskin. Push in the stopcock, open the air
vent and allow water to flow out of tube. Pinch tube gently at the stopcock to remove air
bubbles. Pinch the tube to stop the flow. Remove the cap from the BOD sample bottle,
fill with a small volume of the appropriate sample, remove tube (pinch to stop flow),
recap the bottle and mix to rinse. Pour out. Repeat.
2. Collect the sample. Remove the cap again. Allow the water to flow out of the tube. Insert the
tygon tubing all the way to the bottom of the sample container and allow the bottle to fill until
overflowing. Remove the tube with the water still flowing. Squeeze the bottle slightly and
recap so that a minimum amount of air is trapped in the bottle.
3. Samples must be kept cool (4ºC) and in the dark. Place the sample bottles in the appropriate
cooler.
4. Deliver to the laboratory within the 24 hour hold time, usually immediately after the day’s
sampling. Be sure to include the completed chain of custody form. See Attachment F for an
example COC.
If samples cannot be delivered to CESE and the analysis started within 36 hours of collection
time (e.g., collected on a Friday), consult with senior project scientist for direction on whether
or not to even collect BOD samples.

Long Island Sound Water Quality Monitoring Program SOP Manual 42
STANDARD OPERATING PROCEDURE FOR FILTERING WATER SAMPLES FOR
PARTICULATE PHOSPHOURS (PP), DISSOLVED NUTRIENTS, BIOGENIC SILICA
(BIOSI), AND DISSOLVED SILICA ANALYSIS
Summary
Water samples are filtered to separate dissolved nutrient components from particulate nutrient
components and suspended solids. The filtrate from this apparatus is used for dissolved nutrient
analyses-the filtrate from the PP filters is used for dissolved nitrogen, phosphorus, and carbon;
the filtrate from the BioSi filters is used for dissolved silica (silicate) analysis.
Equipment/Apparatus
Oil-free Vacuum pump
Filtering manifold
4-1000 ml filtering flasks
2 glass fitted filter supports
2 glass funnels
2 metal clamps
2 plastic filter supports
2 magnetic plastic funnels
4-250 mL plastic graduated cylinders
with holes drilled slightly above the
250 mL mark.
2-250mL plastic graduated cylinders
with holes drilled at the 202 mL mark
47 mm GF/F filters (0.7 µM pore-
size) Whatman 1825-47
47mm polycarbonate membrane filter
(0.4um pore size)
2 Stainless steel forceps
Nalgene wash bottle
125 mL Nalgene sample bottles
250 mL Nalgene sample bottles
Centrifuge tubes
Foil packets
Sample labels
Deionized Water
Note: The oil free vacuum pump is stored on the R/V John Dempsey and is located under the
sink. The pump is turned on and off via a switch located on the underside of the counter to the
left of the sink.
The two flasks on the right of the apparatus are designated for Biogenic silica (and associated
dissolved nutrients). The two on the left are designated for PP (and associated dissolved
nutrients).
Note: the filter set up on the right is now composed
of a magnetic plastic filter support and funnel
PP BIOSI
Figure 15. PP/BioSi Filtering Apparatus

Long Island Sound Water Quality Monitoring Program SOP Manual 43
Procedure
1) Rinse all graduated cylinders, filtering funnels, and filter holders (frit glass or stainless
steel) 2 times with DI water before setting up new filter pads. Connect the vacuum
tubing. Place the filter supports on the filtering flasks.
2) Set up the PP filters.
a) The PP filters come from the lab in a cardboard box but are stored in a plastic
box. Rinse the dedicated PP forceps with DI water. Shake off excess water.
Using the forceps, remove the filter from the box. The filters have two sides, a
smooth side and a rough side. The smooth side will have a waffle pattern, the
rough side, will not. Place the filter onto the fritted glass support of the filtering
apparatus rough side up. Be sure the filter is centered so that the sample cannot
get around the filter.
b) Repeat for the second filter.
c) Place the glass filter funnel on top of the filter and secure with the clamp. Be
careful not to move the filter. Repeat for the second filter.
3) Set up the BIOSI filters
a) The BIOSI filters are stored in a plastic box with circles of paper separating each
filter. Rinse the dedicated BioSi forceps with DI water. Shake off excess water.
Use the forefinger of one hand to gently push back the paper and expose the filter.
Using the forceps in the other hand, pick up the filter by the edge.
b) The filter is placed on the support shiny side down. Generally, the filters come
packaged shiny side up. Double check that this is the case. Maneuver the filter so
the shiny side is down.
c) Bring the filter to the edge of the support. Carefully slide the filter up the edge
and onto the support. This is somewhat tricky. It is highly likely that you will end
up with folds/creases/wrinkles in the filter. The support has two gaps that allow
you to place the forceps under the filter and reposition it. You can also carefully
smooth the forceps over the filter to push the fold to the edges. Repeat for the
second filter.
d) Once the filter is centered on the support and free from folds, turn the vacuum
pump on for ~10 seconds. This will firmly seat the filter and draw out any tiny
wrinkles.
e) Place the magnetic funnel over the filter. Attach the clamp.
4) Mix the surface water sample in the Niskin bottle on the left side of the rack in the lab.
Remove the Niskin bottle from the rack and invert (shake) end to end several times.
The water sample in the bottle must be kept well mixed as suspended material in the
water settles to the bottom of the bottle making some samples very concentrated and
leaving other samples very dilute.
If not previously done, attach small tygon tube to the stopcock of the Niskin. Push in
the stopcock, open the air vent and allow water to flow out of tube. Pinch tube gently
at the stopcock to remove air bubbles. Pinch the tube to stop the flow. Wrap the tube
through the lanyard and secure against the rack until ready to dispense the sample.
5) Sample rinse the 4-250 mL-graduated cylinders with the holes drilled just above the
250 mL mark. To do this, fill one of the cylinders with ~10 mL of sample. Swirl the

Long Island Sound Water Quality Monitoring Program SOP Manual 44
water around the cylinder to rinse, shake, and then dump into the sink. Repeat. Begin
to fill the cylinder to the 250 mL mark. Continue until all four have been rinsed and
filled. If you overfill, pour out the hole. Place the cylinders in the holding rack above
the filtering apparatus.
6) Sample rinse and fill one 250 mL cylinder to the 200mL mark as in Step 5 above.
Place the filled cylinder on the shelf of the filtering apparatus behind the left BioSi
flask.
7) Mix the Niskin bottle containing bottom water. Rinse one 250 mL cylinder and then
fill to the 200 mL mark as above. Place this cylinder on the shelf behind the right
BioSi flask or on the counter to the right of the apparatus.
This filtering process is time consuming and you will need to multitask to complete the filtering
between stations. It is best to filter for PP and BIOSI at the same time.
8) Begin the process of filtering for PP (500mL)
a) Turn the vacuum pump on to the left flask for PP analysis.
b) This flask needs to be sample rinsed 2 times before collecting filtrate for
dissolved nutrient analysis.
c) Pour ~20 mL of sample into the funnel and allow to pass through the filter.
Turn off the vacuum. Disconnect the tubing. Remove the filter support and
funnel. Place into the wooden hole at the back of the apparatus. Swirl filtrate
around the flask and then discard. Reconnect tubing and the filter support and
funnel. Repeat.
d) Pour remaining 440 mL through the funnel. Turn off the vacuum once all the
sample has passed through the filter.
e) Turn on the vacuum pump to the flask on the right in the PP station.
f) Pour ~200 mL of sample carefully into the glass funnel again being careful to
pour down the side of the funnel rather than directly onto the filter.
g) Swirl remaining ~50 mL to re-suspend settled materials and pour into funnel.
h) Repeat with second 250 mL. Turn off the vacuum once all the sample has
passed through the filter.
9) In the meantime, proceed to filter for BIOSI (200 mL)
a) Turn on the vacuum pump to the BioSi filters.
b) Surface and bottom samples will be collected at the same time for
BIOSI analysis. The filter flasks are labeled Surface on the left and
Bottom on the right. The flasks will collect the filtrate for dissolved silica
analysis and must be sample rinsed a minimum of two times.
c) Pour ~10 mL of sample from the surface cylinder into the funnel on the
left and allow to pass through the filter. Turn off vacuum pump.
Disconnect vacuum hose. Remove the filter support and funnel as one
piece and carefully set into wooden hole on the back of the apparatus.
Swirl the 10mL around the flask then discard. Reconnect the vacuum
tubing and the filter support and funnel. Repeat.
d) Slowly pour remaining sample into the plastic funnel. Use caution to pour
down the side of the funnel and not directly onto the filter.
e) Swirl the last 30 mL of sample to re-suspend settled materials and pour
into the funnel. Allow the entire sample to filter through.

Long Island Sound Water Quality Monitoring Program SOP Manual 45
f) Repeat for the bottom water sample.
10) Sample rinse the dissolved nutrient sample bottle.
Select the correct 250mL Nalgene sample bottle (surface) to sample rinse before filling
with sample. Disconnect the vacuum tubing from the filter flask on the left. Remove the
entire filter assembly as you did for sample rinsing the flask and place it into the hole.
Remove the cap from the sample bottle but do not set it down on anything (i.e., keep it in
your hand while you hold the bottle). Pour a small amount ~10 mL from the flask into the
sample bottle. Replace cap. Swirl and shake to rinse. Discard rinse water. Repeat.
11) Collect the filtrate for the dissolved nutrient analyses using the bottle you sample
rinsed in Step 10. Fill the sample bottle with sample water to the shoulder. As these
samples are frozen, it is important to leave headspace (~1/4 inch) to allow for
expansion. Recap the bottle. Replace the filter assembly on the flask and connect the
vacuum tubing. Place the sample bottle in the freezer.
12) VERY IMPORTANT: THE FILTERS MUST BE RINSED WITH DI WATER
before removing them from the filter holder/funnel assembly. This step is for
comparison purposes with the TSS filters. This rinsing removes the salt from the
filter, which would otherwise invalidate the analysis for TSS.
a) Using the wash bottle, squirt DI around the sides of the graduated cylinders that
were used to measure the samples for the filter to the 10 mL mark. Carefully,
pour both of these together into the funnel, being sure not to pour directly onto
the filter. Turn on the vacuum and draw through. Repeat.
b) Using the wash bottle, squirt DI water around the inside of the funnel, about
three turns (5-10 ml). Do not squirt or otherwise force water directly onto the
filter - this can damage the filter or force some of the particulate material on it
through.
c) Repeat steps a and b for the second filter.
d) Allow the vacuum to remove excess water from the filter. Turn off the vacuum.
Disconnect the tubing.
e) Disconnect the clamp holding the funnel onto the support.
f) Lift the funnel off the support and place in the hole on the shelf behind the
apparatus. Make sure that the filter stays on the filter support.
g) Rinse the designated PP forceps with DI water, shake to remove excess.
Carefully open the correctly labeled foil pack by sliding the forceps into the
foil and opening the forceps. Then, carefully slide one side of the forceps under
the filter, grab the filter by the edge only, where there is no sample, and gently
fold over. Use the flat side of the forceps to flatten the filter out at the fold.
Remove filter and place in the foil packet.
h) Repeat for the second flask. Place the filter into the same foil packet.
i) Fold the top of the foil packet over three times to secure the filters inside. Place
the packet into the freezer.

Long Island Sound Water Quality Monitoring Program SOP Manual 46
10) Return to the BIOSI filters
By now the sample should have filtered and the filter should be dry.
a) Turn off the vacuum and remove the tubing from the filtrate flasks.
b) Remove the magnetic funnels and place on the shelf behind the apparatus.
c) Open the correctly labeled surface centrifuge tube. Hold the cap in your hand
with the tube.
d) Rinse the designated BioSi forceps with DI Water. Using the forceps, gently
lift a corner of the filter. Grasp the filter on the edge and fold it in half.
e) Place the filter into the centrifuge tube. Try to get the filter to the bottom of the
tube. Recap the tube.
f) Repeat for second filter.
g) Place the tubes in the freezer.
h) Sample rinse the 125mL Nalgene bottle labeled for the surface sample twice as
for the filtrate from the PP apparatus.
i) Fill the sample bottle to the neck, leaving headspace. Place this sample bottle in
the freezer.
j) Repeat for the bottom water sample.
11) Once the filtrate has been collected empty the flasks into the sink or out the door.
12) Rinse all supports, funnels, and flask that hold filtrate with DI water.
13) Set up the apparatus again.
14) Repeat the procedure for the PP filters for the bottom sample.
15) Once finished with the bottom sample, set up the apparatus for the next station.
16) At the end of the trip, all “glassware” is rinsed in DI water. The flasks are turned upside
down in the holders to dry. The supports and funnels are placed in the holes in the shelves
to dry.
17) Record volumes filtered on the filtering information data sheet. The results of the
chemical analyses are on a per volume basis, so an accurate record of the volume filtered
is necessary.
Changes to the standard volume filtered can (and should) be made if suspended material
concentrations are high and it is taking 5 minutes or more to filter a sample. In such a case, the
pores of the filter clog, changing the relative pore size of the filter and thus changing the size of
the material that is being caught by the filter. In addition, if suspended material concentrations
are very low and little or no color is visible on the filter, the volume filtered should be increased.
Always record the volume filtered on the data sheet, and be sure that all replicate filters have
identical amounts of sample filtered through them.

Long Island Sound Water Quality Monitoring Program SOP Manual 47
Quality Control/Quality Assurance
Duplicates
For quality assurance purposes, surface duplicate samples are filtered at stations M3, A4,
and E1 following the same procedures as outlined above. Duplicate surface samples are
collected before bottom samples. On the BioSi apparatus, the surface and surface
duplicates are run at the same time, followed by the blank (See below) and bottom
samples.
Field Filter Blanks
Filter blanks are prepared and included with the other samples for analysis. These Blanks
provide a way to measure any background contamination on the filters caused by field
handling procedures. The Blank filters should be treated in the very same manner as a
sample filter, except that no sample is filtered. Blanks are generally prepared following
filtering at stations M3, A4, and E1 but can be run at any time during the day after the
first station has been filtered.
a) Set up filters and assemblies as you would to prepare for sample filtering.
b) For PP filter blank only: Rinse graduated cylinders 2 times with DI water and
rinse the funnel as above.
c) For BioSi: turn on vacuum pump briefly to draw any DI water off that the filter
picked up from rinse water on the holder. DO NOT run any DI water through
these filters.
d) Handle filters only by the edges and only with forceps.
e) Place filters in appropriate foil packet or centrifuge tube and freeze.
Check to be sure that the sample code on the foil pack or container corresponds to the
sample that was prepared.
Sample Delivery
Foil packets, centrifuge tubes, and 250 mL Nalgene sample bottles (dissolved nutrients)
are placed into the freezer after all filtering is completed until the vessel arrives at the
dock. Dissolved silica samples (125 mL Nalgene bottles) are also stored in the freezer
until arrival at the dock. At the dock, foil packets, centrifuge tubes, and TSS tins are
placed together into a large Ziploc bag and then into a cooler along with the dissolved
nutrients and BOD samples to be transported to the analytical lab (CESE at UConn in
Storrs, CT). Chain of custody (COC) sheets (Attachment F) are filled out and accompany
the samples to the lab. Samples are relinquished to a freezer/refrigerator designated by
the laboratory. The 125mL dissolved silica samples are placed into the refrigerator (right
side of the refrigerator/freezer) at CESE. All other samples are placed into the freezer
(left side). Copies of the completed COCs are returned (faxed) to LISWQMP staff with
the data package.

Long Island Sound Water Quality Monitoring Program SOP Manual 48
STANDARD OPERATING PROCEDURE FOR FILTERING WATER SAMPLES FOR
PARTICULATE CARBON (PC), PARTICULATE NITROGEN (PN), CHLOROPHYLL
A (CHL A), AND HIGH PERFORMANCE LIQUID CHROMATOGRAPHY (HPLC)
ANALYSIS
Summary
Surface and bottom water samples collected from Long Island Sound are filtered through a
Hoefer filtering manifold. The filters are analyzed for particulate carbon/particulate nitrogen,
chlorophyll a content and undergo high performance liquid chromatography analysis, which
separates and quantifies pigments to determine phytoplankton composition. This SOP describes
the process for filtration.
Equipment/Apparatus
25mm filtering apparatus (Hoefer filtering
manifold with filtrate collection tank, associated
vacuum tubing)
250 mL graduated cylinder with hole drilled at
200 mL
plastic funnels
precombusted 25mm GF/F (glass fiber) filters
(0.7um pore size) for PC/PN analysis
25mm GF/F (glass fiber) filter (0.7um pore size)
for chl a and HPLC analysis
foil packets
2 pairs of forceps
*oil free vacuum pump
* Vacuum pump is the same as that used for
TSS/PP/BIOSI filtering. The pump remains on the vessel
under the sink. The power switch is located under the
counter to the left of the sink.
Procedure
SET UP
PC/PN filtration will take place on the left side of the apparatus and chl a will take place on the
right. The apparatus is labeled as such. Additionally, surface and bottom samples are filtered at
the same time. From left to right the apparatus should be set up to filter surface sample PC/PN,
bottom sample PC/PN, surface sample chl a, and bottom sample chl a. See Figure 17. PC/PN and
chl a filters are kept in separate labeled plastic boxes under the filtrate collection tank.
Figure 16. Chl a, PC/PN, and HPLC
Filtration Apparatus

Long Island Sound Water Quality Monitoring Program SOP Manual 49
1) Rinse the flat tipped forceps with DI Water.
2) Using the rinsed forceps, select a PC/PN filter from the box. The filters have two sides,
a smooth side and a rough side. The smooth side will have a waffle pattern, the rough
side, will not. Place the PC/PN filter on the filter holder rough side up beginning with
the space designated PC/PN surface (Figure 17). This allows larger particles to be
caught first by the filter, while smaller particles get through the first couple of layers
and are caught later. The filter pad will not clog as fast if set-up properly and so the
pore size is not as likely to be affected.. Continue to place PC/PN filters on the
apparatus from back to front then left to right, Rinse the forceps with DI water Repeat
the process for the chl a filters.
3) Carefully grasp the funnel by the metal funnel holder. Firmly seat the metal funnel
holder onto the filter. Be aware that there is a metal ring on the bottom of the holder that
can cut the filter.
4) Turn the vacuum on at the red-valved manifold coming from the pump. Next turn the
vacuum on to each filter to confirm that the funnel and filter are properly positioned.
If a hissing is heard, adjust the funnel by turning it gently. If the hissing persists, lift
off the funnel and check to make sure the filter is not damaged, replace any damaged
filters. Be sure the valves to the center two slots without filters are off. Turn off the
vacuum at the red valve until ready to filter.
FILTRATION
1) Begin filtering with the bottom sample. Carefully remove the Niskin bottle from the right
side of the wall rack. Invert the bottle a few times to fully mix the sample. Return the
bottle to the rack.
2) If not previously done, attach small tygon tube to the stopcock of the Niskin. Push in the
PC/PN
Surface
PC/PN
Bottom
Chl a
Surface
Chl a
Bottom
EMPTY
Figure 17. Diagram of filter set up for PC/PN, Chl a analysis. Surface
water is filtered for HPLC analysis. Filters are set up following PC/PN
and chl a filtering in the spaces marked above as chl a surface.
PC/PN
Surface PC/PN
Bottom EMPTY
Chl a
Surface Chl a
Bottom

Long Island Sound Water Quality Monitoring Program SOP Manual 50
stopcock, open the air vent and allow water to flow out of tube. Pinch tube gently at the
stopcock to remove air bubbles. Pinch the tube to stop the flow. Wrap the tube through
the lanyard and secure against the rack until ready to dispense the sample.
3)
4) Sample rinse the 200 mL graduated cylinder by twice then fill to 200 mL mark. Re-wrap
the tygon tubing
5) If it isn’t already on, turn on the pump. Open the red valve to the filters.
6) Begin by pouring the sample into the funnel for bottom water PC/PN. Brace yourself by
putting one foot under the cabinet.. Extend thumb and index finger to act as brace. Place
cylinder against fingers while pouring. DO NOT brace against “funnels”. If seas are
extremely rough, rinse milk jug cap with DI and place inside the top of the cylinder to
prevent over pouring.
7) Refill graduated cylinder with bottom water. Pour into the second funnel.
8) Continue on to the chl a filters with the bottom water, working back to front.
9) Mix surface water sample. Rinse the graduated cylinder two times with sample water. Fill
to the 200 mL mark. Pour into the funnels labeled surface samples, proceeding from back
to front, left to right.
10) Allow the vacuum to remove excess water from the filter. Turn off the vacuum. Open the
valves to the unoccupied filters to release the pressure.
11) Carefully remove stainless steel holders/funnels and set on a paper towel on the counter
to the left of the Hoeffer unit.
12) Rinse both sets of forceps with DI water. Carefully open the foil packet by sliding the
closed flat forceps into the packet and then allowing them to open gently. Be sure that the
label on the foil packet corresponds to the sample that was filtered.
13) Begin with the surface PC/PN filter and work from back to front, left to right. Slide the
pointed forceps down the slot in the manifold. Gently lift the filter. Using the flat forceps,
grasp the filter on the edge. Fold filter in half. Using the flat foreceps, place the filter in
the foil packet in the bottom of one corner. Repeat for second replicate filter. It’s
important that they NOT TOUCH one another.
14) Fold foil over twice to ensure a complete seal. Rinse the forceps in between with DI
water. Proceed to the next set of filters. Once all filters have been removed, place foil
packets in freezer.
15) Once the procedure is complete for the PC/PN and chl a filters, remove the filter support.
Rinse with DI water. Rinse the holder/funnel with DI water. Surface water is now filtered
for HPLC analysis.
Place two of the chl a filters on the apparatus in the surface chl a spots. Put the
filter holders/funnels over the filters. Turn on the vacuum. Sample rinse the

Long Island Sound Water Quality Monitoring Program SOP Manual 51
graduated cylinder and fill to the 200mL mark. Pour 200 mL of surface sample
into each of the funnels. Allow vacuum to remove excess water. Remove
holder/funnel. Using the forceps place the filters into the foil packet as above.
IMPORTANT NOTES-
Rinse all holders, funnels, and the filter support with DI water in between stations.
Sample rinse the graduated cylinder between surface and bottom samples and between
stations.
The filtrate from this filtering apparatus is not used for any chemical analyses. However,
this filtered water is used in the plankton processing.
Watch the water level in the filtrate collection carboy. It must be emptied periodically so
that water is not sucked into vacuum line.
Quality Control/Quality Assurance
Duplicates
For quality assurance purposes, surface duplicate samples are filtered at stations M3, A4,
and E1 following the same general procedures as outlined above. However, it is preferred
that the apparatus is set up to filter all surface samples at once (i.e., surface PC/PN,
surface DUP PC/PN, surface chl a, surface DUP chl a) followed by bottom samples.
Blanks
Blanks are prepared following filtering at stations M3, A4, and E1 for PC/PN, chl a, and
HPLC analysis. Blanks can be done at any time after the first station is filtered, however
they are generally collected at the same time as the bottom samples from stations M3,
A4, and E1. Set up the apparatus as usual. Pour the bottom water through the funnels as
usual. Do not pour any water through the surface spaces. The blanks will be collected
from the surface spaces on the filtering unit. Place the filters into the foil packs as
outlined above.
Sample Delivery
Chl a and PC/PN samples are placed into a Ziploc bag and delivered to CESE (UConn,
Storrs) on ice along with the nutrient samples.
HPLC samples are stored in the boat’s freezer until the end of the survey then brought
back to the Department‘s Windsor Ave laboratory and stored in the freezer. The HPLC
samples are then sent overnight delivery in batches on dry ice to Horn Point at the
University of Maryland via a commercial carrier such as UPS. Samples are sent Monday-
Wednesday to ensure staff at Horn Point are available to receive the samples.
Chain of custody forms (Attachment F) are completed and accompany the samples to the
labs.

Long Island Sound Water Quality Monitoring Program SOP Manual 52
STANDARD OPERATING PROCEDURE FOR FILTERING WATER SAMPLES FOR
TOTAL SUSPENDED SOLIDS (TSS) ANALYSIS
Summary
Water samples are filtered to separate dissolved nutrient components from suspended solids.
Two filters from each sample are provided to the laboratory.
Equipment/Apparatus
Oil-free Vacuum pump
Filtering manifold
2-1000 ml filtering flasks
2 metal clamps
2 plastic filter supports
2 magnetic plastic funnels
1-250 mL plastic graduated cylinder
with hole drilled slightly above the
250 mL mark.
Pre-weighed 47 mm GF/F filters (0.7
µM pore-size) Whatman 1825-47 in
foil tins (with bar codes from lab)
Stainless steel forceps
Nalgene wash bottle
Deionized Water
Note: The oil free vacuum pump is stored on
the R/V John Dempsey and is located under
the sink. The pump is turned on and off via a
switch located on the underside of the counter
to the left of the sink.
Procedure
1) Rinse all graduated cylinders, filtering flasks, filtering funnels, and filter holders 2 times
with DI water before setting up new filter pads. Connect the vacuum tubing. Place the filter
supports on the filtering flasks.
2) Set up the TSS filters.
a) The TSS filters come from the lab in a box with four stacks of foil tins. Select
one stack from the box. Rinse the dedicated TSS forceps with DI water. Shake
off excess water. Using the forceps, remove the filter from the first foil tin.
Note that the filter has a waffle pattern on one side and a more random, stringy,
rough pattern on the other. Place it on the support of the filtering apparatus
closest to the wall (labeled surface) rough side up. Be sure the filter is centered
so that the sample cannot get around the filter.
b) Remove the filter from the second tin and place it on the filter support in the
front (labelled bottom), rough side up.
c) Place the plastic magnetic filter funnel on top of the filter. Be careful not to
move the filter.
d) Turn the two empty foil tins 180 degrees from the others (so you know which
have been used).
Figure 18. TSS Filtering Apparatus
Long Island Sound Water Quality Monitoring Program SOP Manual 53
3) Mix the bottom water sample in the Niskin bottle on the right side of the rack in the
lab. Remove the Niskin bottle from the rack and invert (shake) end to end several
times. The water sample in the bottle must be kept well mixed as suspended material
in the water settles to the bottom of the bottle making some samples very
concentrated and leaving other samples very dilute.
4) Sample rinse the 250 mL-graduated cylinder with the hole drilled just above the 250
mL mark. To do this, fill one of the cylinders with ~10 mL of sample. Swirl the water
around the cylinder to rinse and then dump into the sink. Repeat. Fill the cylinder to
the 250 mL mark. Replace the tygon fill tube on the Niskin bottle.
5) Turn on the vacuum to the front (bottom) flask in the TSS station.
6) Pour ~200 mL of sample carefully into the funnel being careful to pour down the side
of the funnel rather than directly onto the filter.
7) Swirl remaining ~50 mL to re-suspend settled materials and pour into funnel.
8) Repeat with second 250 mL.
VERY IMPORTANT: THE TSS FILTERS MUST BE RINSED WITH DI WATER
BEFORE REMOVING THEM FROM THE FILTER HOLDER/FUNNEL
ASSEMBLY. This rinsing removes the salt from the filter, which would otherwise
invalidate the analysis for TSS.
9) Using the wash bottle, wash down the sides of the graduated cylinder that was used to
measure the samples for the filter, using approximately 15 mL. Pour into the funnel.
Turn on the vacuum and draw through. Repeat.
10) Using the wash bottle, squirt DI water around the inside of the funnel, about three
turns (5-10 ml). Do not squirt or otherwise force water directly onto the filter - this can
damage the filter or force some of the particulate material on it through.
11) Allow the vacuum to remove excess water from the filter.
12) Turn off the vacuum pump.
13) Mix the surface water sample bottle in the Niskin bottle on the left side of the rack.
Sample rinse the graduated cylinder twice, fill to the 250 mL mark.
14) Turn the vacuum pump on to the back (surface) flask for TSS analysis. Filter 500mL
of bottom water sample as above. DI Rinse the filter as above.
15) Turn off the vacuum pump.
16) Disconnect the tubing.
17) Lift the funnels off the supports (one at a time) and place on the shelf behind the
apparatus. Make sure that the filter stays on the filter support.

Long Island Sound Water Quality Monitoring Program SOP Manual 54
18) Rinse the forceps with DI water, shake to remove excess. Pick up the stack of foil tins
in one hand and the forceps in the other. Carefully open the stack to the tin that
corresponds to the filter. It is imperative that each filter be returned to its original tin.
19) Carefully slide one side of the forceps under the filter, then grab filter by the edge
only, where there is no sample, and gently fold over. Use the flat side of the forceps to
flatten the filter out at the fold. Remove filter and place in appropriate foil tin. If the
filter should tear, be sure to place all pieces into the tin as TSS is determined by
weight. If a portion of the filter is lost (e.g., torn with missing piece, dropped on the
floor, etc.) discard the filter and the foil tin it was in and re-run the sample. Repeat for
the second flask.
As conditions allow and especially if it’s a hot day, tins should be placed into the freezer in
between stations.
Quality Control/Quality Assurance
Duplicates
For quality assurance purposes, surface duplicate samples are filtered at stations M3, A4,
and E1 following the same procedures as outlined above.
Blanks
Filter blanks are prepared and included with the other samples for analysis. These Blanks
provide a way to measure any background contamination on the filters caused by field
handling procedures. The Blank filters should be treated in the very same manner as a
sample filter, except that no sample is filtered. Blanks are generally prepared following
filtering at stations M3, A4, and E1 but can be run at any time during the day after the
first station has been filtered.
a) Set up filters and assemblies as you would to prepare for sample filtering.
b) Rinse graduated cylinders 2 times with DI water and rinse the funnel as above.
c) Handle filters only by the edges and only with forceps.
d) Place filters in appropriate foil tin and freeze.
Check to be sure that the sample code on the foil pack or container corresponds to the
sample that was prepared.
Sample Delivery
Tins for TSS are placed into the freezer after all filtering is completed until the vessel
arrives at the dock. For delivery to the analytical lab (CESE at UConn in Storrs, CT) tins
are placed into a Ziploc bag and then placed on ice and transported in coolers.
Chain of custody (COC) sheets (Attachment F) are filled out and accompany the samples
to the lab. Samples are relinquished to a freezer/refrigerator designated by the laboratory.
Copies of the completed COCs are returned (faxed) to LISWQMP staff with the data
package.

Long Island Sound Water Quality Monitoring Program SOP Manual 55
STANDARD OPERATING PROCEDURE FOR THE COLLECTION OF PHYTOPLANKTON SAMPLES
Summary
Water samples for phytoplankton identification will be collected from ten stations (B3, D3, F2,
H4, I2, K2, A4, C1, E1, and J2) using 5-L Niskin bottles mounted on the General Oceanics
Rosette Multi-bottle sampling array. Samples will be collected on the upcast from the bottom
and at 2 m below the surface of the water.
Equipment/Apparatus Rosette with Niskin bottles
250 mL graduated cylinder
250 mL Amber Nalgene sample bottles
Lugol’s solution (40 g resublimed Iodine, 60 g granular Potassium Iodine, 1000 mL
Deionized water)
Safety Precautions
Be sure to wear eye protection and gloves when preserving samples with Lugol’s solution (eye
and skin irritant). See MSDSs (Attachment C) for additional health and safety information.
Procedure
Samples may be obtained either following collection of BOD samples on the deck, or following
the collection of nutrient samples in the laboratory.
1) Remove the surface Niskin bottle from the rack and mix the sample thoroughly by
inverting the bottle a few times. Return the bottle to the rack.
2) Sample rinse the graduated cylinder two times with ~10 mL of sample water.
3) Fill the graduated cylinder to the 200 mL mark.
4) Remove the top from the pre-labeled sample bottle. Pour the sample into the bottle.
Recap. If the bottle is being re-used from previous surveys, be sure to rinse with DI water
prior to filling.
5) Repeat for the bottom water.
6) Using the automatic pipette, preserve with 4 mL of Lugol’s solution. Gently swirl the
bottle to ensure ample mixing of the preservative throughout the sample. Store in the
refrigerator at 4 ºC in darkness until delivery to Dr. Senjie Lin at UConn, Avery Point.
Samples will be delivered with appropriate chain of custody forms (Attachment F).

Long Island Sound Water Quality Monitoring Program SOP Manual 56
STANDARD OPERATING PROCEDURE FOR THE COLLECTION OF
ZOOPLANKTON SAMPLES
Summary
Mesozooplankton are defined as those animal species within the plankton that are collected with
a 200-micron mesh net, whereas, microzooplankton are those plankton species that will pass
through a 200 micron mesh net. The primary goals of the Long Island Sound mesozooplankton
analysis are to (1) evaluate the spatial and temporal variation in mesozooplankton species
composition and abundance, (2) evaluate relationships between mesozooplankton or particular
species abundance and nutrient or hydrographic conditions, and (3) provide direct
mesozooplankton biomass data for model applications. Mesozooplankton samples will be
collected with paired 200 µm mesh, 0.5 m diameter, 2.5 m long plankton nets (SeaGear Corp,
Melbourne, FL) each fitted with a calibrated flowmeter attached within the opening to provide an
estimation of sampling effort. Microzooplankters are fragile and hence easily damaged or
destroyed by nets or pumps. Whole water samples will be collected with the use of 5-liter Niskin
bottles from discreet depths within the water column and composited.
Equipment/Apparatus Rosette with Niskin bottles
50L Nalgene carboy
8 lengths of Tygon tubing to drain Niskin bottles
Bongo plankton net fit with 200µm codends and in line flow meters
(side winch, shackle, 30 lb weight with line)
>64 µm stainless steel sieve
180 µm stainless steel sieve
2 mm stainless steel sieve
250 mL graduated cylinder
filtered seawater (obtained from PC/PN filtering) in wash bottles
Nalgene sample bottles
Lugol’s solution
37% formaldehyde
Safety Precautions
Be sure to wear eye protection and gloves when preserving samples with Lugol’s solution (eye
and skin irritant) and 37% formaldehyde (irritant, corrosive). See attached MSDS (Attachment
C) for additional health and safety information.
Zooplankton samples are only collected from stations B3, D3, I2, F2, H4, and K2.

Long Island Sound Water Quality Monitoring Program SOP Manual 57
Procedure
Collection of composite sample for whole water plankton sample and >64 µm sample
Water for this plankton analysis is collected using the Niskin bottles on the rosette. Once on
station, the rosette is deployed for the CTD cast and to collect water for nutrient analysis. In
addition as bottles are available, samples are collected for the composite on the upcast at 4-6
meter intervals. Depending on station depth and the number of bottles necessary for nutrient
analysis, a second cast might be necessary, in which case, water is collected on the downcast.
1) Once the rosette is retrieved, rinse a large carboy (50L) with a small amount of sample
water and then drain.
2) Attach Tygon tubes to each of the Niskin bottle stopcocks.
3) Place the other end of the tubes into the top of the large carboy. Make sure the spigot on
the bottom of the carboy is turned to OFF!
4) Drain the water from the Niskin bottles into the carboy.
5) Once drained, remove the tubes from the carboy.
6) Replace the screw cap on the carboy and place the carboy in the shade until it can be
processed. Reset the Niskin bottles for the next station.
Processing Composite sample
Whole water sample
1) Thoroughly mix the composite sample by gently laying the carboy on its side and
lifting back up a minimum of three times.
2) After the sample is mixed place the carboy on a
cooler.
3) Loosen the screw top a few turns.
4) The pre-labeled 250mL Nalgene sample container
needs to be rinsed prior to collecting the sample.
5) Remove the top from the sample bottle, but don’t
put the top down.
6) Open the spigot and collect a small amount of
sample (~10mL) in the bottle.
7) Close the spigot.
8) Place the top on the bottle and shake/swirl to rinse.
9) Pour out the rinse water.
10) Repeat.
11) To collect the sample, open spigot on the
carboy, letting water run for a second.
12) Move the uncapped sample bottle under the
spigot and collect sample.
13) Pull the sample bottle out of the flow of water, then shut the spigot on the carboy.
14) Pour off a small amount of sample to leave headspace and room for the
preservative. Recap the sample bottle.
15) Whole water samples are preserved with 5% Lugols’ solution. Using the
dispensette, carefully squirt 8 mL of Lugol’s into the sample. (The dispensette is
set to dispense 4 mL of solution, so you will need to repeat the procedure twice.)
Samples are placed into the refrigerator.
16) Samples are delivered to Dr. McManus at UConn, Avery Point Campus.
Figure 19. Whole Water Zooplankton
Sample Processing

Long Island Sound Water Quality Monitoring Program SOP Manual 58
>64-µm sample
1) After collecting the whole water sample, tighten the top on
the carboy and place it back on the deck.
2) Mix the sample thoroughly by laying the carboy on its side
as above.
3) Note the level of water in carboy. This method requires
that 10L be filtered through a 64-micron mesh steel sieve.
4) Place the carboy on top of one of the other small stainless
steel sieves. Place the 64 uM sieve under the spigot.
Remove the cap from the carboy.
5) Open the valve and allow 10 L to filter through the sieve.
Close the valve.
6) (if not already full) Fill the designated filtered seawater wash bottle with water
collected from the chl-a/PCPN filtering station.
7) Using the wash bottle, rinse the contents of the sieve to one side.
8) Rinse the small white funnel with filtered seawater. Place the funnel into the pre-
labeled 125 mL Nalgene sample bottle.
9) Place the sieve on top of the funnel and with the least amount of rinse water
possible, carefully rinse the contents of sieve into the bottle.
10) Rinse around the inside of the funnel.
11) Cap the bottle.
12) >64 samples are preserved by adding ~1/8 sample volume of 37% formaldehyde.
13) Samples are placed into the refrigerator.
14) Samples are delivered to Dr. McManus at UConn, Avery Point Campus with
appropriate chain of custody forms.
Collecting net samples
1. Take the plankton net
out of the
carrying/storage bag and
unfurl.
2. Using a threaded
shackle attach the winch
cable from the side
winch to the top tow
ring in the yoke of the
net. Be sure that the
flow meter outside of
the nets is on the upper
side of the net frame.
3. Attach the weight to the
bottom tow ring.
4. Attach the codend buckets to the net. Slip the net into codend bucket. Line up the metal
retaining clips and close the clamps.
Figure 20. Bongo Plankton Net being towed through water
column

Long Island Sound Water Quality Monitoring Program SOP Manual 59
5. Record on the field data sheet the starting numbers for each of the three flow meters.
Flow Meter A corresponds to net A and meter B corresponds to Net B. The flow meter
that is attached to the yoke is labeled as meter D.
6. Once on station, don hardhat and life jacket.
7. The hydraulics operator will raise the net off the deck. IMPORTANT- DO NOT lift the
net off the deck; let the winch do the work. If you lift the net you could cause the line to
go slack and come off the block, damaging it. The operator will also usually lift the
weight over the gunwales as well. Assist the operator by putting the codends over the
gunwales. Keep the net from swinging into the operators head or the side of the boat.
8. Swing the net at the yoke so that the net is fully extended in the water with the codends
parallel to the boat. Be sure flow meter D is on top.
9. The net is lowered to the bottom at a moderate rate. The scientist will have contact with
the line as the net is lowered to determine when the bottom is contacted.
10. Once the weight contacts the bottom, pull up on the cable to keep the net from digging
into the bottom sediments and notify the hydraulics operator.
11. The net is then retrieved at a constant slow speed (without stopping).
12. Once the net has returned to the side of the boat, the operator will raise it up and bring in
the weight.
13. Using the saltwater deck hose, carefully rinse down the net over the side of the boat
(Watch out not to soak the hydraulics operator) from the opening to the codend. Be sure
to rinse from outside the net.
15) The net is then lowered to the deck. Leave the codends attached to the net and stand them
in an upright position until ready to process. Cover the entire net assembly with the
storage bag to block the sun and prevent degradation of the sample and net.
16) Record the flow meter readings on the field sheet.
If the net contacts bottom sediments, rinse out net and codends and recast net. Make sure you
record flow meter reading or reset to 0.
If flow meters in nets are reading significantly lower, more than 20%, than flow meter outside of
net, recast net after rinsing out net, ctenophores and brown micro-algae often clog net during
summer months.
Processing Net Samples
1) With the deck hose rinse down the last few feet of the net into the codend again by
holding the net over the gunwale and rinsing from the outside. This is to wash any
plankton that got stuck on the net into the cod end. Allow the water to drain to a level
below the codend bucket.

Long Island Sound Water Quality Monitoring Program SOP Manual 60
2) Stack the 2 mm mesh sieve onto the 180 micron mesh sieve. Tilt the 2 mm sieve at a 45-
degree angle and rest it over the 180. The 2 mm sieve is to retain larger zooplankton,
ichthyoplankton, and “gelatinous forms”.
3) Remove the codend bucket from the net. Rinse any material from the codend attachment
into the codend with the filtered seawater wash bottle.
4) Pour the contents of the codend through the sieve.
5) Rinse down the sides of the codend bucket with filtered seawater at least two times.
6) Carefully rinse the plankton through the 2 mm sieve into the 180 µm sieve.
7) If gelatinous forms are present measure their volume by pouring them from the 180 mm
sieve into the designated graduated cylinder. Record the total volume and species
composition on datasheet. After recoding volume and composition, dispose of gel forms
overboard.
8) Rinse the contents of the 180-micron sieve into the >64 µm sieve. This is done for ease of
getting the sample into the container with the smallest volume possible.
9) Rinse the contents of the >64 sieve to one side.
10) Set the sieve aside at an angle.
11) Select the smallest volume Nalgene sample bottle possible based on the contents of the
sieve allowing sufficient space for the sample, wash water, and preservative. Rinse the
funnel with filtered seawater and rinse the sample bottle.
12) Put the funnel into the sample bottle. Carefully rest the sieve on the funnel and using the
wash bottle, carefully rinse the plankton into the funnel and then into sample bottle. Be
sure to leave room for the fixative.
13) Repeat the entire procedure with net B.
14) Samples are preserved with 37% formaldehyde. Mark a line on the sample bottle to
indicate the volume of sample. Estimate one quarter this volume. Mark a line that is one
quarter above the sample volume line. Add formaldehyde to this line. Place sample in
refrigerator.
15) Rinse the sieves, graduated cylinder and codend bucket with saltwater and freshwater in
between tows.
16) Reattach the cod ends and reset the flow meters for the next station.
17) At the end of the day, disconnect net from the weight and side winch cable. Return the
net to the storage bag. If possible, rinse down the net with the freshwater hose and dry
slightly before storage.

Long Island Sound Water Quality Monitoring Program SOP Manual 61
18) Samples are delivered to Dr. Hans Dam at UConn, Avery Point in Groton with
appropriate chain of custody forms (Attachment F).

Long Island Sound Water Quality Monitoring Program SOP Manual 62
ATTACHMENTS

Long Island Sound Water Quality Monitoring Program SOP Manual 63
ATTACHMENT A
Research vessel policies, rules, and safety information
PFD Directive
Updated Dempsey Safety Manual
Fishing Vessel Sheet 1 - Cold Water
Fishing Vessel Sheet 2 - Boundary Line and Coastal Waters
Fishing Vessel Sheet 3 - Immersion Suits
Stearns Survival Suit
Fishing Vessel Sheet 4- Visual Distress Signals
Fishing Vessel Sheet 5 – Survival Craft
MARPOL treaty card

Long Island Sound Water Quality Monitoring Program SOP Manual 64
MANUAL CODE 5560
D 11
Department of
Environmental Protection
DIRECTIVE
SUBJECT: USE OF PERSONAL FLOTATION DEVICES BY DEP STAFF
PURPOSE: To establish department policy regarding the use of Personal Flotation Devices (Life Jackets) for department staff.
POLICY: It is the policy of the Department of Environmental Protection that all employees
in performance of their duties shall wear an appropriate Personal Flotation Device (PFD)
when aboard and underway on any vessel. This policy shall be extended to vessels at
anchor when conditions (i.e. weather, sea, work) and the safety of the employee dictate, or
the supervisor deems it appropriate, that an approved PFD be worn. Such PFD’s shall be
U.S. Coast Guard approved and in serviceable condition. For definitions of the different types of PFD’s and when they should be worn, see the Connecticut Boaters Guide.
The only exceptions to this policy are:
1. when on a vessel required to have a certificate of inspection issued by the Coast Guard
unless directed by the First Mate or the Captain (i.e. RV John Dempsey or any passenger ferry), or
2. when below deck or in an enclosed cabin or in the cabin of a large patrol vessel (i.e. 35
feet or longer), or
3. for Lifeguards, when engaged in patrol surveillance from a vessel where the use of a PFD
would endanger the lifeguard or hinder the rescue or ability to rescue. Lifeguards on patrol
surveillance shall possess rescue equipment required by DEP Lifeguard Policies and Procedures.
Supervisors are responsible for ensuring that their employees are aware of this policy and
that they have access to and training regarding the use of the appropriate equipment.
Employees in violation of this directive will be subject to disciplinary action.
______________________________________________________________
Issued by: /S/ Commissioner Amey Marrella
Date: April 19, 2010
Special Instructions: Replaces Manual Code 5560 D11 dated September 29, 2009
Distribution: Electronic

Long Island Sound Water Quality Monitoring Program SOP Manual 65

Long Island Sound Water Quality Monitoring Program SOP Manual 66

Long Island Sound Water Quality Monitoring Program SOP Manual 67

Long Island Sound Water Quality Monitoring Program SOP Manual 68

Long Island Sound Water Quality Monitoring Program SOP Manual 69
Long Island Sound Water Quality Monitoring Program SOP Manual 70

Long Island Sound Water Quality Monitoring Program SOP Manual 71
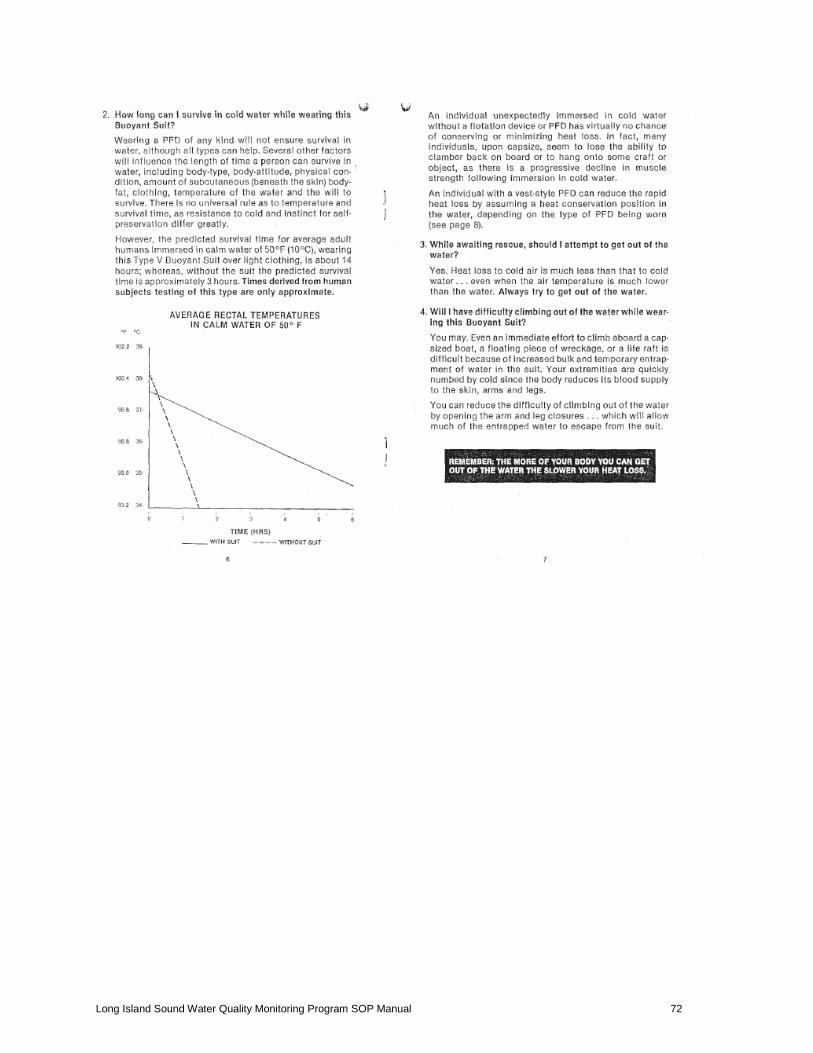
Long Island Sound Water Quality Monitoring Program SOP Manual 72

Long Island Sound Water Quality Monitoring Program SOP Manual 73

Long Island Sound Water Quality Monitoring Program SOP Manual 74

Long Island Sound Water Quality Monitoring Program SOP Manual 75

Long Island Sound Water Quality Monitoring Program SOP Manual 76

Long Island Sound Water Quality Monitoring Program SOP Manual 77

Long Island Sound Water Quality Monitoring Program SOP Manual 78

Long Island Sound Water Quality Monitoring Program SOP Manual 79
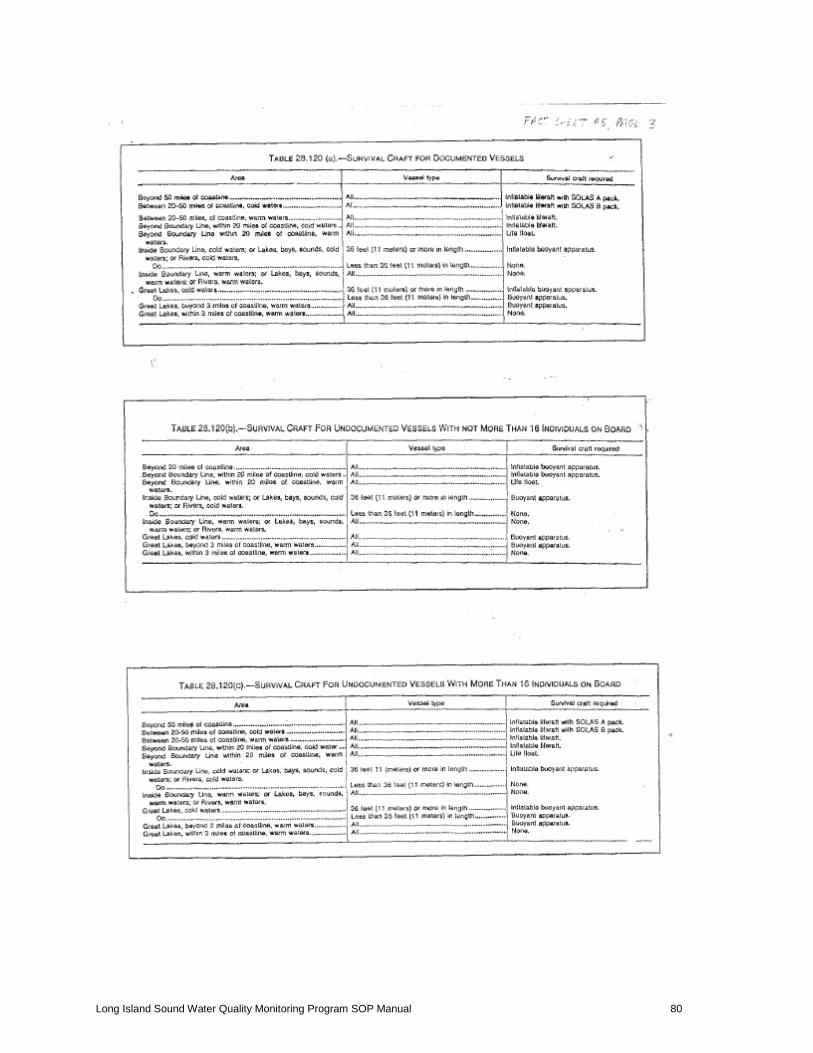
Long Island Sound Water Quality Monitoring Program SOP Manual 80

Long Island Sound Water Quality Monitoring Program SOP Manual 81

Long Island Sound Water Quality Monitoring Program SOP Manual 82
ATTACHMENT B Directions
Directions to Windsor Water Survey Prep Lab
9 Windsor Ave, Windsor, CT
From 79 Elm St., Hartford
Take Exit for Route 91 North.
Take Exit 34 Route 159 Windsor. At the bottom of the Exit turn Left.
Turn Left at the stop light. Pass under the highway, pass the Citgo gas station. The Windsor Lab
is the next driveway on the right.

Long Island Sound Water Quality Monitoring Program SOP Manual 83
Directions to Old Lyme, DEP Marine Fisheries
333 Ferry Road, Old Lyme, CT
From Hartford/Windsor take Route 91 South to Route 9 South to Route 95 North.
From I-95 North take exit 70, take right at bottom of ramp, take first right onto Ferry
Road, Marine Headquarters is on Left at end of road.
From I-95 South take exit 70, go straight at bottom of ramp. Go to end of road and take
a Left, you will go back under I-95. After you go under I-95 take first right onto Ferry Road,
Marine Headquarters is on Left at end of road.

Long Island Sound Water Quality Monitoring Program SOP Manual 84
Directions to Dept. of Agriculture, Bureau of Aquaculture
190 Rogers Ave, Milford, via Route 95
Take Exit 39A- Route 1 South off Route 95 South. At the bottom of the ramp, turn right and then
merge left. Bear slightly left/stay straight to travel on Cherry Street. Bear slight Left onto River
Street. In the center of town, turn Right onto North Broad Street. Turn Left in the center of the
green onto High Street. Go straight through the light. Take next Right onto Green Street. At the
end turn Left onto Rogers Ave.
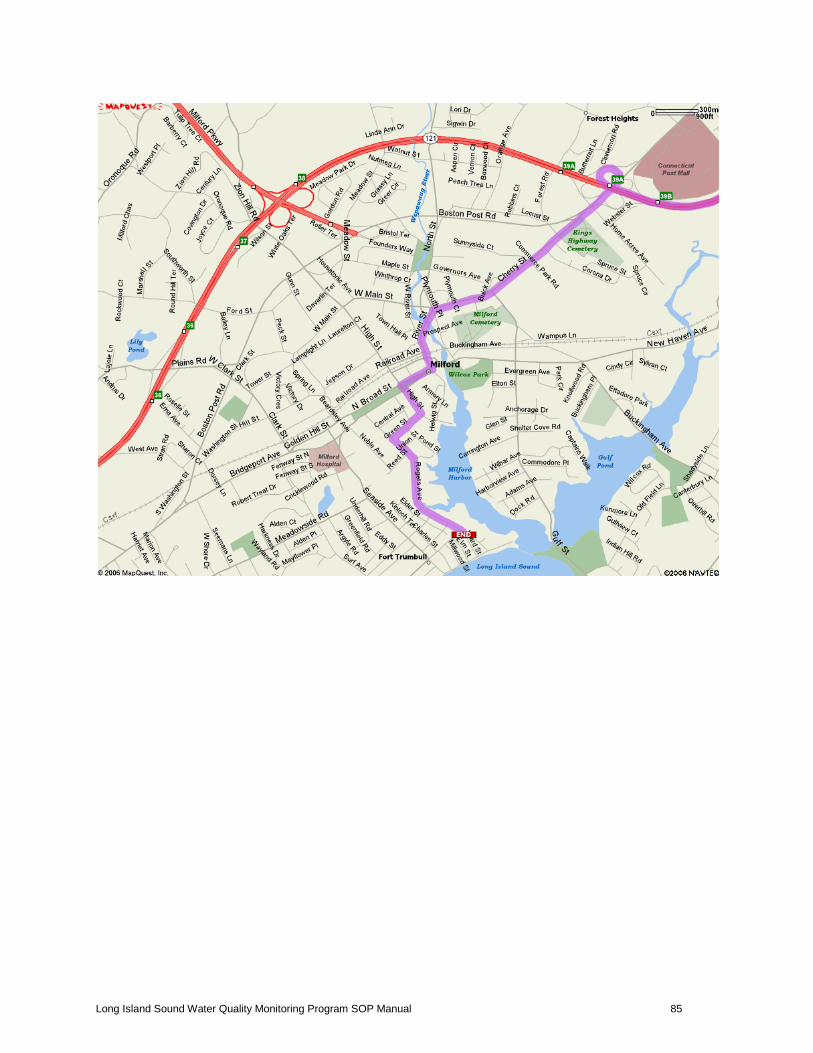
Long Island Sound Water Quality Monitoring Program SOP Manual 85

Long Island Sound Water Quality Monitoring Program SOP Manual 86
Directions to CESE in Storrs
From Hartford to Building 4 Annex, 3107 Horsebarn Hill Road, Storrs.
Take I-84 East.
Merge Onto I-384 East via Exit 59 Towards Providence.
I-384 East Becomes Rte 44 East. Route 44 becomes Middle Turnpike. Continue on Route 44.
Turn Right onto Route 195, Turn Left onto Horsebarn Hill Rd.
Alternately, continue on I-84 East to Exit 68, Route 195. Turn Right at the bottom of the exit
onto Rte. 195, travel for 6.6 miles, and turn Left onto Horsebarn Hill Rd.
CESE down here

Long Island Sound Water Quality Monitoring Program SOP Manual 87
ATTACHMENT C
MSDS Sheets Chemicals used by the Long Island Sound Monitoring Program are not necessarily obtained from
the manufacturers identified on these MSDS sheets. Copies of official MSDS sheets with
emergency contact information are stored in the senior project scientist’s cubicle and in the Right
to Know workstation at the laboratory in Windsor.
KCl
Iodine
Manganous Sulfate solution
Alkali-iodide-azide Reagent
Sulfuric acid
Starch Indicator Solution
Sodium Thiosulfate 1.0 Normal
Formaldehyde 37% Solution
pH buffer 4.0
pH buffer 7.0
pH buffer 10.0
Conductivity Standard

Long Island Sound Water Quality Monitoring Program SOP Manual 88
ATTACHMENT D
Memorandum- Winkler Waste Disposal Procedures
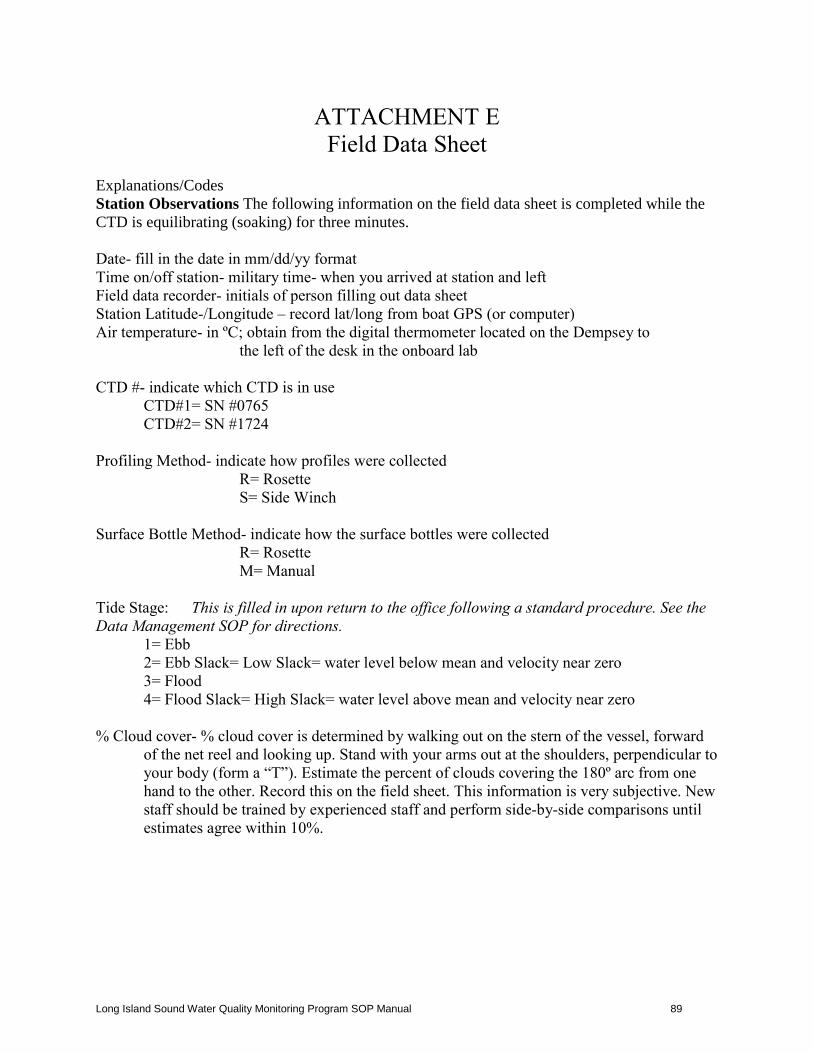
Long Island Sound Water Quality Monitoring Program SOP Manual 89
ATTACHMENT E
Field Data Sheet Explanations/Codes
Station Observations The following information on the field data sheet is completed while the
CTD is equilibrating (soaking) for three minutes.
Date- fill in the date in mm/dd/yy format
Time on/off station- military time- when you arrived at station and left
Field data recorder- initials of person filling out data sheet
Station Latitude-/Longitude – record lat/long from boat GPS (or computer)
Air temperature- in ºC; obtain from the digital thermometer located on the Dempsey to
the left of the desk in the onboard lab
CTD #- indicate which CTD is in use
CTD#1= SN #0765
CTD#2= SN #1724
Profiling Method- indicate how profiles were collected
R= Rosette
S= Side Winch
Surface Bottle Method- indicate how the surface bottles were collected
R= Rosette
M= Manual
Tide Stage: This is filled in upon return to the office following a standard procedure. See the
Data Management SOP for directions.
1= Ebb
2= Ebb Slack= Low Slack= water level below mean and velocity near zero
3= Flood
4= Flood Slack= High Slack= water level above mean and velocity near zero
% Cloud cover- % cloud cover is determined by walking out on the stern of the vessel, forward
of the net reel and looking up. Stand with your arms out at the shoulders, perpendicular to
your body (form a “T”). Estimate the percent of clouds covering the 180º arc from one
hand to the other. Record this on the field sheet. This information is very subjective. New
staff should be trained by experienced staff and perform side-by-side comparisons until
estimates agree within 10%.

Long Island Sound Water Quality Monitoring Program SOP Manual 90
Current Weather: Fill in the code that corresponds to the current weather while on station
00= Clear, no clouds at any level
01= Partly cloudy, scattered or broken
02= Continuous layers of clouds
03= Sandstorm, duststorm, blowing snow
04= Fog, thick dust, haze
05= Drizzle
06= Rain
07= Snow or mixed precipitation
08= Showers
09= Thunderstorms
Sea State: Fill in the code that is closest to the sate of the sea while on station
0= Calm-Glassy (0 meters)
1= Calm- Rippled (0-0.1 meters)
2= Smooth- Wavelet (0.1-0.5 meters; 0.33 -1.65 feet)
3= Slight (0.5-1.25 meters; 1.65 - 4.125 feet)
4= Moderate (1.25-2.5 meters; 4.125-8+feet)
Secchi Depth- Fill in the Secchi depth measurement in meters
Upcast Raw Data- These data are recorded as the CTD is being brought to the surface- the
upcast. Grab samples are collected at the bottom (defined as 5 meters up from the bottom) and
surface (defined as 2 meters below the surface of the water). Depending upon the survey (regular
monthly or hypoxia), additional samples are taken at near bottom depths (1 meter above the
bottom) and mid-depths (determined by the maximum depth of the station roughly divided in
half). After the on deck command unit is triggered to collect the grab samples, write down the in
situ data on the field sheet.
Sample depth
Depth code (NB= near bottom, B= bottom, M= mid, S= surface)
Time sample collected (the grab sample)
Water temperature (the I68 temperature not the oxygen temperature)
Salinity
Dissolved Oxygen
Winkler Data- Record the bottle numbers and corresponding depth codes for Winkler samples.
When the titrations are performed, the person titrating fills in his/her initials and enters the values
from the buret. The average of all the Winkler values from each depth is recorded in the Winkler
dissolved oxygen column.
Coastal 2000 Station Number- Fill in station number if collecting NCCA samples

Long Island Sound Water Quality Monitoring Program SOP Manual 91
Station Name
Field Data Sheet
Date (MMDDYY) Time ON Station Time Off Station Field Data Recorder
Station Latitude Station Longitude +/- Air Temp. (C)
Profiling Surface Bottle
CTD Method Method Tide Stage % Cloud Cover Current Weather Sea State
Station Depth (m) Station Depth (m) Raw PAR @ surface / Constant = Incident PAR
CTD DEPTH
READING FINDER
UPCAST RAW DATA - DO NOT USE IN DATA ANALYSIS
Sample Depth Depth Time Sample Water Temperature Salinity CTD Dissolved pH
(m) Code Collected (C) (PSU) Oxygen (mg/l)
Initials
Depth Winkler Winkler Winkler Dissolved
Code Bottle #'s Titrations Oxygen (mg/l) Secchi Depth (m)
First
Second
Third
Coastal 2000 Station Number
Notes (any changes to normal sampling methods, changes, etc.):
Cast #
Long Island Sound Ambient Water Quality Monitoring Program
WATER QUALITY SURVEY
Connecticut Department of Environmental Protection
Bureau of Water Protection and Land Reuse, Planning and Standards Division
W4 N
1.62
+7
m
m
m

Long Island Sound Water Quality Monitoring Program SOP Manual 92
ATTACHMENT F
Chain of Custody Sheets

Long Island Sound Water Quality Monitoring Program SOP Manual 93

Long Island Sound Water Quality Monitoring Program SOP Manual 94
CT DEP FIELD SAMPLING SHEET Long Island Sound Ambient Water Quality Monitoring Program
HPLC Phytopigment Project
Contact: Matt Lyman, (860) 424 3158, [email protected] OR Katie O’Brien-Clayton (860) 424-3176 [email protected]
Cruise Name:____WQSEP06________ Note: Please keep samples frozen. Transfer samples to the Health Department’s deep freezer as soon as possible. *** Please remember to record the volume filtered.
Station Date Volume filtered
Notes
K2 8/29/06 200 mL
Blank B 8/29/06
I2 8/29/06
J2 8/29/06
F2 8/30/06
H4 8/30/06
A4 8/31/06
B3 8/31/06
A4S-DUP 8/31/06
C1 8/31/06
D3 8/31/06
Additional notes:
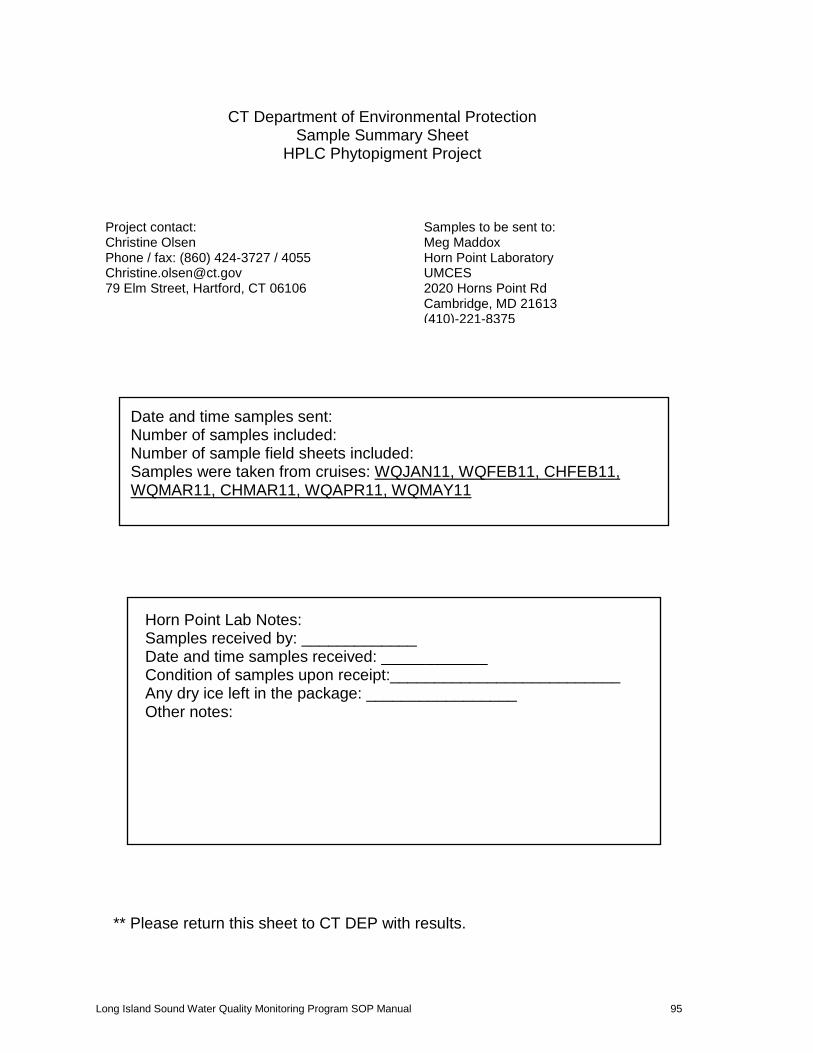
Long Island Sound Water Quality Monitoring Program SOP Manual 95
CT Department of Environmental Protection Sample Summary Sheet
HPLC Phytopigment Project
Samples to be sent to: Meg Maddox Horn Point Laboratory UMCES 2020 Horns Point Rd Cambridge, MD 21613 (410)-221-8375
Project contact: Christine Olsen Phone / fax: (860) 424-3727 / 4055 [email protected] 79 Elm Street, Hartford, CT 06106
Date and time samples sent: Number of samples included: Number of sample field sheets included: Samples were taken from cruises: WQJAN11, WQFEB11, CHFEB11, WQMAR11, CHMAR11, WQAPR11, WQMAY11
Horn Point Lab Notes: Samples received by: _____________ Date and time samples received: ____________ Condition of samples upon receipt:__________________________ Any dry ice left in the package: _________________ Other notes:
** Please return this sheet to CT DEP with results.

Long Island Sound Water Quality Monitoring Program SOP Manual 96
FIELD SAMPLES/DELIVERY RECORD
LONG ISLAND SOUND MicroZOOPLANKTON
TO: Laboratory of Dr. George McManus FROM:
UCONN Dept of Marine Sciences
1080 Shennecossett Road
Groton, CT 06340
(860) 405-9164
Date of Delivery:
K2 -W
K2 -64 10
I2 -W
I2 -64 10
F2 -W
F2 -64 10
H4 -W
H4 -64 10
D3 -W
D3 -64 10
B3 -W
B3 -64 10
-W
-64
-W
-64
-W
-64
-W = Whole water (composite) sample (250 ml); w/Lugol's -64 = sample from concentrating x -liters of whole water composite
with 64 u m sieve; w/formaldehyde (target volume 10-liters)
RELINQUISHED BY: (SIGNATURE) RECEIVED BY: (SIGNATURE) Date & Time
(860) 424-3158 (FAX 860-424-4055)
e-mail: [email protected]
Concentrated
Volume (liters)CommentsSample CodeDate of Collection
Date & Time
Matthew Lyman
CTDEP Bureau of Water Management
Long Island Sound Monitoring
79 Elm St.
Hartford, CT 06106-5127

Long Island Sound Water Quality Monitoring Program SOP Manual 97
FIELD SAMPLES/DELIVERY RECORD
LONG ISLAND SOUND MesoZOOPLANKTON
TO: Laboratory of Dr. Hans Dam FROM:
UCONN Dept of Marine Sciences
1080 Shennecossett Road
Groton, CT 06340
(860) 405-9164
Date of Delivery:
ALL SAMPLES CONTAIN FORMALIN (~10%)
K2 -A
K2 -B
I2 -A
I2 -B
F2 -A
F2 -B
H4 -A
H4 -B
D3 -A
D3 -B
B3 -A
B3 -B
-A
-B
-A
-B
-A
-B
-A = Zooplankton sample from Net A -B = Zooplankton sample from Net B
RELINQUISHED BY: (SIGNATURE) RECEIVED BY: (SIGNATURE) Date & Time
Date of Collection
Hartford, CT 06106-5127
(860) 424-3158 (FAX 860-424-4055)
e-mail: [email protected]
Volume Sampled
Date & Time
Sample Code Comments
Matthew Lyman
CTDEP Bureau of Water Management
Long Island Sound Monitoring
79 Elm St.

Long Island Sound Water Quality Monitoring Program SOP Manual 98
CT DEP FIELD SAMPLING/C-O-C SHEET
Long Island Sound Ambient Water Quality Monitoring Program
Phytoplankton Identification Project
Contact: Matt Lyman at (860) 424 3158
Or Katie O’Brien-Clayton at (860) 424 3176
Samples to:
Dr. Senjie Lin
UCONN Marine Sciences
Avery Point
(860) 405-9168
Cruise Name:____________________ Date of Sample Delivery:__________________
Samples included (all Surface water samples unless otherwise indicated):
Station Date
Sampled
Lugol
Yes No
Surface
Yes/No
Bottom
Yes/No
A4
B3
C1
D3
E1
F2
H4
I2
J2
K2
Notes:
Relinquished by:________________________________ Date/Time:______________

Long Island Sound Water Quality Monitoring Program SOP Manual 99
ATTACHMENT G Table 1. Sampling Matrix for the Long Island Sound Water Quality Monitoring Program
Station
Approximate
Maximum
Depth (m)
Latitude Longitude CTD BOD QA/QC
Parameters
TSS/PP Dissolved
nutrients BioSi
Dissolved
silica PC/PN Chl a HPLC
Phyto-
plankton
Plankton
Tow
Composite
Plankton
Cru
ise
Day
1-
Eas
t
K2 35-38 41.23433333 -72.26583333 X X X X X X X X X X X
M3 40-42* 41.23716667 -72.05333333 X to 40 m X surface duplicate X X X X X X
J2 12- 30 41.182 -72.457666670 X X X X X X X X X X
I2 26-28 41.1375 -72.655 X X X X X X X X X X X
H6 37-42 41.026 -72.9135 X X X X X X X X
H4 22-25 41.10166667 -72.934 X X X X X X X X X X X
H2 13-15 41.178 -72.9605 X X X X X X X
Cru
ise
Day
2-
Wes
t
9 10 41.07083333 -73.33616667 X X X X X X X
D3 35-44 40.99383333 -73.41133333 X X X X X X X X X X X X
C2 23 40.98433333 -73.50216667 X X X X X X X
C1 18-21 40.95583333 -73.58033333 X X X X X X X X X X
B3 18-23 40.91833333 -73.64283333 X X surface BOD duplicate X X X X X X X X X X
A4 34.2 40.8725 -73.73416667 X X surface duplicate X X X X X X X X
Cru
ise
Day
-3
Cen
tral
F2 18-21 41.08033333 -73.16533333 X X X X X X X X X X X
F3 38-42 41.01783333 -73.1445 X X X X X X X X
15 14-17 40.93133333 -73.22116667 X X X X X X X
E1 36-40 41.01933333 -73.29133333 X X surface duplicate X X X X X X X X
* M3 is sampled between 40 and 42 meters; station depths range up to 80m

Long Island Sound Water Quality Monitoring Program SOP Manual 100
Table 2. Depth Interval and number of sample bottles to be collected during LISWQMP surveys
Station
Bottom- up 5 m,
unless otherwise
noted, always
collected
"Depth Interval" - intermediate samples taken from
bottom depth to 2 meter depth at X meter intervals,
dependent on tide stage, for plankton analysis.
Depending upon the survey, samples may be collected
from mid-water depths and processed for nutrients
(e.g., NCA)
Surface- 2
meters, always
collected
Notes
Cru
ise
Day
1-
Eas
t K2 2 bottles up 4m- 1 bottle up 4 up 4 up 4 2 bottles
M3 2 bottles 3 bottles
J2 2 bottles 2 bottles
I2 3 bottles up 4m- 1 bottle up 4 up 4 up 4 3 bottles
H6 2 bottles 2 bottles
H4 2 bottles up 4m- 1 bottle up 4 up 4 up 4 2 bottles
H2 1 bottle 1 bottle
Cru
ise
Day
2-
Wes
t
9 up 3 meters, 1 bottle 1 bottle
D3 3 bottles Up 6 m – 1
bottle*
Up 6 – 1
bottle
Up 6 – 1
bottle
Up 6 – 1
bottle 3 bottles*
*will require 2nd cast due to station depth; 2nd cast bottles are collected on
down cast, stopping at 6 m intervals starting at the 2 m depth; 1 bottle at each
depth
C2 1 bottle 1 bottle
C1 2 bottles 2 bottles
B3 2 bottles Up 4m – 1
bottle* up 4* up 4* up 4* 2 bottles
* may require 2nd cast; if so, collect on down cast, stopping at 4 m intervals,
starting at the 2 m depth; 1 bottle at each depth
A4 2 bottles 3 bottles
Cru
ise
Day
-
3 C
entr
al F2 2 bottles up 4m- 1 bottle up 4 up 4 2 bottles
F3 2 bottles 2 bottles
15 1 bottle 1 bottle
E1 2 bottle 3 bottles