london the irish dimension
DESCRIPTION
An exploration of 2001 Census Data A report prepared for the This report, one of a suite of twenty four, is an outcome of a research project on the Irish data in the 2001 Census. The research project was funded by the Díon Committee. Printed by New Image Design and Print, Block D, Unit 1, Bounds Green Industrial Estate, Ring Way, London N11 2UD. Publication of this report is funded by the Díon Committee. First published by the Federation of Irish Societies in 2007.TRANSCRIPT

LONDON: THE IRISH DIMENSIONAn exploration of 2001 Census Data
A report prepared for the

This report, one of a suite of twenty four, is an outcome of a research project on the Irish data in the 2001 Census. The research project was funded by the Díon Committee.
Publication of this report is funded by the Díon Committee.
First published by the Federation of Irish Societies in 2007.
ISBN 978-1-906325-01-5
Copyright Source data - 2001 Census: Crown copyright. This report: FIS copyright.
Printed by New Image Design and Print, Block D, Unit 1, Bounds Green Industrial Estate, Ring Way, London N11 2UD.
The Federation of Irish Societies is a national umbrella body representing and providing services to its affiliated organisations throughout Britain. These organisations include welfare advice agencies, day centres, community care services, clubs, social and cultural organisations and housing providers; as well as projects to meet specific needs of particular sections of the community, such as women, elders, Irish travellers and prisoners.

London: the Irish dimension
An exploration of 2001 Census data
A report prepared for the Federation of Irish Societies, London

Contents:
FIS Foreword 2
Introduction 3
Using the data 7
Key data 8
Section 1. The nature of the population 9
Section 2. Economic activity and inactivity 14
Section 3. Types of work 19
Section 4. Unpaid carers 25
Section 5. Qualifications 33
Section 6. Home tenure and accommodation type 36
Section 7. Amenities 42
Section 8. Health 45
1

FIS foreword We are very pleased to be able to publish the suite of reports which FIS has commissioned from Word-Works and which focus on the Irish data in the 2001 Census. This data and commentaries are presented in a comparative context at national, regional and selected local levels, and on the basis of the full sixteen categories from the 2001 Census Ethnic Group Question. These reports indicate the diversity in the performance of ethnic minority groups in Britain. They show that the statistical profile of the identified white Irish places them closer to white British and Indian in many respects than, for example, more radically marginalised groups like Pakistanis, Bangladeshis, refugees and asylum seekers. Nevertheless, Irish deficits exist, most visibly in the area of health. They extend to related areas like levels of economic activity, where limiting long-term injury and disability contribute. The specific age profile of the white Irish population, with its bias towards older people, has implications in terms of care needs, as have the high proportions of white Irish single- and two-pensioner households. At the same time, the proportions of those white Irish without qualifications and working in the building industry point to the need for training/retraining towards integration/retention in the labour market. Indeed, government initiatives around health aspects of local regeneration, extension of working life, and reengagement of those with disabilities in the labour market, increase the importance of Irish community inclusion in order to achieve targets. It is important that the duality of the performance of the Irish in Britain – that combination of high achievement and disadvantage/social exclusion, which is by no means unique to the Irish community among British ethnic minority communities – should not distract attention from issues that need to be addressed. That there are sections of the Irish population who have multiple needs, are marginalised, and have information, support and service needs which need to be addressed was clearly indicated by the data provided by the FIS/AGIY Standardised Information System, collected from our front line agencies and published between 1994 and 2003. This and other documentation with a strong local thrust (for example, the valuable L Simpson et al., Ethnic minority populations and the Labour Market: an analysis of the 1991 and 2001 Censuses (DWP 2006)), emphasise the need for good local intelligence and greater and easier access to small-area statistics. We have been disappointed by the structuring of much of the analysis of ethnicity data from the 2001 Census published to date, particularly the use of various “combined ethnic group categories” and the failure to disaggregate the White “combined group” data. These procedures ignore one of the most significant findings of T Madood et al. Ethnic Minorities in Britain: Diversity and Disadvantage (PSI 1997) with relevance to policy formation, as well as such examples of good practice as Collecting ethnic category data: Guidance and training material for implementation of the new ethnic categories (DH 2001). Increasingly, micro-decisions about delivery of services take place at a local level. Those with local responsibility under the Race Relations Acts for addressing inequalities must have the best possible local data on all significant communities (including minority ethnic communities) at their disposal, and must use it in an inclusive way to inform their policies. We thank Word-Works for providing us with this suite of reports, which we commend to our affiliates, our partners in the British voluntary sector, and to those with a responsibility for policy formation and the delivery of services. We hope they will prove useful in raising the profile of the needs of ethnic minority populations, including our own.
Dr Mary Tilki, Chair
Federation of Irish Societies May 2007
Author’s Introduction The Census has long been the most extensive, if not the most comprehensive, source of information about the population of England and Wales.
This has not been the case for the Irish population however. Although previously asked whether they were members of other minority ethnic groups, it was not until the 2001 Census that they were asked whether they were Irish. In the 1991 Census, the Irish population was identified from a combination of country of birth data and those instances where people had taken the initiative to write in their Irish identity.
The Census is based largely on a series of tick box type questions which are quick to fill in and easy to understand. This approach means that highly complex topics have to be condensed into just a few words.
Ethnic origin is one area which can suffer greatly from this treatment as it is so very complex. Potential problems arising in relation to Irish identity are discussed in the reports, most comprehensively in Section 1 of England: the Irish dimension.
It is important to examine the information derived from the Census to learn about the Irish population, in order to identify any specific provisions appropriate to meeting their needs. It is to assist this process that the Federation is publishing this series of commissioned reports on the Irish dimension of Census 2001.
The Census has provided us with an enormous quantity of data. These reports examine key elements of that data and make comparison, where appropriate, with data relating to the white British population and other minority ethnic populations.
Summary findings of the analysis of the Irish dimension of the 2001 Census are set out below and in the series of key data to be found at the beginning of each report.
1. The age of the white Irish population
The white Irish population of England and Wales, indicated by the 2001 Census data, is a comparatively older population. In England, the proportion of children identified – those aged under 16 – is very low: 6% in comparison with 20% when looking at the population of England as a whole. In London and the South East, the proportion of white Irish children is slightly higher (7% and 6% respectively), whereas it is slightly smaller in the South West and the North West (both slightly under 5%).
The issue of the proportion of children recorded is complicated by the fact that children born to Irish parents may not be classified in the Census as white Irish. If they have one Irish parent and one British parent, for example, they may be classified as white British or white other.
At the other end of the age scale, the white Irish population has a large proportion of people who are of pensionable age. Between 20% (London) and 32% (the West Midlands) are aged 65 or older.
With between a fifth and a third of the population of this age, there are consequences for the population in terms of economic activity, health and welfare. For example, when looking at the white Irish population as a whole, the level of economic activity is low – this is due at least in part to the proportion of people who are retired.
The white Irish population also exhibits the highest level of people who describe themselves as being in ‘not good health’ of all the ethnic groups listed. When data is broken down by age, it can be seen that this is largely (although not solely) because the population has such a high proportion of older people, who are far more likely to describe themselves as being in ‘not good health’.
3

One of the consequences of an older population is a higher proportion of women – simply due to the greater longevity of women. In London for example, 58% of the white Irish population is female. In the South East 62% of the white Irish 65 and older population is female. In England as a whole, 53% of the white Irish population (of all ages) is female.
Another related consequence of an older population is the proportion of people who are living alone – typically women who have outlived their male spouses. A fifth of white Irish households comprise a pensioner living alone.
Given the older age profile of the white Irish population identified in the Census, as well as the proportion of white Irish households which are single or two pensioner households, provision of statutory and unpaid/informal care is a significant issue. The Census indicated that, in England, 4% of pensionable age white Irish men were themselves providing 50 or more hours a week of unpaid care, that 1.7% of working age white Irish men were providing the same amount of weekly care, and that 8.6% of working age white Irish women were providing 1 to 19 hours a week of unpaid care.
In addition to the informal and formal care being provided in the community, 0.44% of the white Irish population are being cared for in psychiatric hospitals and homes, nursing homes and residential homes, as opposed to 0.28% of the whole population.
2. Education and qualifications
The findings of the 2001 Census in this area present a mixed picture. At one level, the white Irish population performs very well, in terms of the proportion attaining the highest qualifications (levels 4/5 – degrees, PhDs, professional qualifications).
Among white Irish aged 25 to 34, the proportion so qualified reached 46% - with regional variations ranging from 36% (West Midlands) to 54% (North East England), proportions, in each case, more than double that found in the equivalent white British population. Even 22% of 16 to 24 year old white Irish people in England have qualifications at this level, although some of the qualifications would be outside their age range.
This pattern of relatively high attainment continues up to the age group 35 to 49. After this age, the attainment levels reduce to the levels of the white British population.
One of the main reasons for the comparatively low levels of economic activity amongst white Irish 16 to 24 year olds, is the large proportion of white Irish individuals who are in full-time education. The proportion here is much greater than in the equivalent white British population, rising to 69% in the North East of England. Levels of economic activity in this group range between 4% and 10% below the level of economic activity in the white British population.
The Census data suggests that, while a proportion of white Irish people in England have high level qualifications, there is also a significant proportion who have no qualifications at all. 12% of white Irish 16 to 24 year olds have no qualifications (from 9% in the North East to 17% in the West Midlands). This proportion rises with age. Amongst white Irish 65 to 74 year olds, 70% in England have no qualifications. This ranges from 60% in the South East to 77% in the West Midlands.
In each group over the age of 49, there is a greater proportion of white Irish people with no qualifications at all than in the population as a whole. For example 62% of white Irish people in England aged between 60 and 64 have no qualifications, in comparison with 54% of the general population.
4

3. Work
The 1991 and 2001 Censuses provide evidence that Irish men are commonly to be found working ‘on the buildings’. The 2001 Census found that this was true for around a fifth of white Irish men of working age. Between 13% in North East England and 22% in the West Midlands are working in construction – 20% in England as a whole. These are far higher proportions than those found in any other ethnic population. Working in construction has possible implications for other areas of life. It can have a seasonal or temporary element leaving numbers of men out of work for periods of time. It can also be dangerous and exhausting work. It is an industry which reflects the peaks and troughs of the economy. With so many white Irish people working ‘on the buildings’, there is inevitably a glut of people needing to retrain at times when there is an economic downturn or when individuals need to move on for other reasons such as age and illness.
Between a quarter and a third of white Irish women are working in health and social services. This is a far greater proportion than in the white British population and on a par with the Black African and Black Caribbean populations. Much care work and nursing work, while not seasonal or temporary, can be low-paid or may involve anti-social hours.
A significant proportion of white Irish men work in professional occupations. 15% of white Irish men in England are in professional occupations (compared to 12% of white British men). In some English regions, the picture is much more exaggerated. For example, in the North East, 27% of white Irish men are in professional occupations in comparison with 10% of white British men. Women show a similar, although less pronounced, pattern. 13% of white Irish women in England are in professional occupations in comparison with 11% of white British women.
So again, in this area, the 2001 Census presents a mixed picture. Further, the Census data relates to a period of time in which there was relative economic prosperity for the country and its regions. Certain indicators, such as levels of long-term unemployment were thus very low. It is important to recognise that during a less prosperous time, such indicators will be higher and there may be greater disparities between some of the ethnic groups.
4. Health
The Census provides data about limiting long-term illness and disability. In every region in England the proportion of white Irish men aged between 25 and 74 who are not working because of permanent illness or disability is higher than the proportion of white British men not working for the same reason. In England, 11% of white Irish men are not working because of illness or disability. There is one age group of white Irish men for whom findings in this area are exceptionally strong and consistent, men aged between 50 and 64. In this age group, between 25% (the South East) and 41% (the North West) of men have limiting long-term illness. In England as a whole, 29% of white Irish men of this age have limiting long-term illness, 4% more than amongst white British men of the same age.
The Census also asked about people’s view of whether they were in good health or not. 22% of men in England aged between 50 and 64 described their health as ‘not good’. In fact, for each age group, for both men and women, the trend is for more white Irish people than white British people to indicate ‘not good health’.
5. Housing and amenities
Census data relating to housing and amenities provides a complex picture in terms of the white Irish population. For example, a relatively high proportion of the population owns their own home outright (26%) but, similarly, a relatively high proportion of the white Irish population lives in social housing (21%). These proportions are relatively
5

high in comparison with both other minority ethnic populations listed in the Census and in comparison with the majority of the white British population.
Significantly, in England, the white Irish population has the highest proportion (1.2%) of people in medical and care communal establishments (including psychiatric units, prison, and those we might associate with an older population, residential and nursing homes). The population also has the highest proportion of people in households comprising a lone pensioner (18%). This is true of England as a whole and each of the country’s regions.
In terms of amenities, the white Irish population of England shows two interesting characteristics in comparison with the other ethnic populations listed in the Census. The first is in terms of central heating – 8% of the white Irish population has no central heating – and secondly, 40% of the white Irish population does not have a car. Both of these proportions are higher than those found in the white British population.
The report
The Census data is wholly descriptive and, as such, does not seek to explain particular phenomena, merely to tell us what it is. Thus, we cannot find out from Census data why a specific proportion of people live in social housing, for example. The following report attempts to describe the findings of the 2001 Census and, where appropriate, to suggest possible causes and effects.
Gudrun Limbrick Word-Works
May 2007
6

Using the data
All the data in this report is derived from the results of the 2001 Census which attempted to include all people living in England and Wales. As such, the report and its findings are entirely dependent on the coverage achieved by the Census, the terminology used and the questions asked.
The delineations used are those provided by the Census. For example, the age bands quoted are those designed by the Census. The data is represented as graphs in this report to provide an immediate visual to represent the bare figures. However, greater detail can be found in the accompanying tables of data. This report has a number of companion volumes which may provide useful comparative analysis to aid understanding.
National reports: Local reports: England Birmingham
Wales Bristol
Coventry
Regional reports: Leeds
East England Leicester
East Midlands Liverpool
London Luton
North East England Manchester
North West England Northampton
South East England Nottingham
South West England Portsmouth
West Midlands Sheffield
Yorkshire and the Humber Swindon Data Source: 2001 Census, [Key Statistics for Local Authorities]. Crown copyright 2004. Crown copyright material is reproduced with the permission of the Controller of HMSO.
7

London: Key data
The nature of the population - 66% of the white Irish population was born in the Republic of Ireland - 20% of the white Irish population is aged 65 or older Economic activity and inactivity - 63% of white Irish people aged 25 to 74 are economically active - 11% of white Irish men are not working because of permanent sickness or disability - 38% of white Irish 16 to 24 year olds are in full-time education Types of work - 22% of white Irish men are working in construction - 20% of white Irish men are managers or senior officials - 11% of white Irish men are in elementary-type occupations - 24% of white Irish women are working in health and social work Qualifications - 13% of white Irish 16 to 24 year olds have no qualifications - 27% of white Irish 16 to 24 year olds have qualifications at the highest levels Home tenure and accommodation type - 55% of white Irish people own their own home - 27% of white Irish people are in social housing - 14% of white Irish people are in privately rented accommodation - 16% of white Irish households are pensioners living alone Amenities - 48% of white Irish people do not own a car - 7% of the white Irish population does not have central heating - 17% of the white Irish population are living in households regarded as overcrowded Health - 12% of white Irish men aged 16 to 49 have long-term limiting illness - 31% of white Irish men aged 16 to 64 are in not good health - 25% of white Irish women aged 16 to 64 are in not good health
8

Section 1. The nature of the population of London _____________________________________________________________________ This section looks at the number of Irish people in London in comparison with other ethnic groups. The place of birth of Irish people is examined, differentiating between those Irish people born in Ireland and those born elsewhere. It also examines basic demographic information such as ethnic origin, gender and age. It is this data which is of fundamental importance when understanding other data in this report such as economic activity and health. In London 59.8% of the population classify themselves as white British1. In comparison, 87.0% of the population of England classify themselves as white British. The make-up of the remainder of the population is illustrated in the figure below. Figure 1. The proportion of the population in minority ethnic groups in London
0%
1%
2%
3%
4%
5%
6%
7%
8%
9%
White -
Irish
White -
Othe
r Whit
e
Mixed -
Whit
e and
Black C
aribb
ean
Mixed -
Whit
e and
Black A
frican
Mixed -
Whit
e and
Asian
Asian o
r Asia
n Briti
sh - I
ndian
Asian o
r Asia
n Briti
sh - P
akist
ani
Asian o
r Asia
n Briti
sh - B
angla
desh
i
Black o
r Blac
k Briti
sh - B
lack C
aribb
ean
Black o
r Blac
k Briti
sh - B
lack A
frican
Chines
e or O
ther E
thnic
Group -
Chin
ese
LondonEngland
In both London and England, the largest minority group is ‘white other’. In London it forms 8.3% of the population, in England, it comprises 2.7% of the population. The white Irish population forms 3.1% of London’s population and 1.3% of the population of England as a whole. It is probable that the proportion of Irish people recorded in the Census is an under-representation of the actual Irish community in London and this issue is discussed more fully in England: the Irish dimension – an exploration of 2001 Census data. Estimates2 suggest that the actual Irish population of London could be between 6.8% (487,833 individuals) and 8.2% (585,399 individuals) which is higher than the estimated proportional size of the Irish population of England (4.1%). These corrected figures would make the Irish population the second largest minority ethnic population in the region. 1 In the Census questionnaire, respondents were given five options: white, mixed, Asian, Black or Chinese. Within the ‘white’ option, respondents were asked to select either British, Irish or other white. For the purposes of this report, these options have been abbreviated to ‘white British’, ‘white Irish’ and ‘white other’. 2 Using the 2.5 and 3 correctional factors of the born-in-Ireland population suggested by Hickman MJ and Walter B Discrimination and the Irish Community in Britain CRE 1997.
9

Figure 2. Proportion of population of London born on the island of Ireland3
0.0%
0.5%
1.0%
1.5%
2.0%
2.5%
London England
Born in Northern Ireland
Born in the Republic ofIreland
0.9% of the population of England was born in the Republic of Ireland in comparison with 2.2% of the population of London. Of those people in London who described themselves in the Census as Irish, 66.4% were born in the Republic of Ireland. 6.3% were born in Northern Ireland. In total, 31.3% of those who described themselves as white Irish were born in the United Kingdom. Figure 3. Proportion of the population that is female
44%
46%
48%
50%
52%
54%
56%
58%
Female
s : to
tal
Whit
e - B
ritish
Whit
e - Iri
sh
Whit
e - O
ther W
hite
Mixed -
Whit
e and
Blac
k Cari
bbea
n
Mixed -
Whit
e and
Blac
k Afric
an
Mixed -
Whit
e and
Asia
n
Asian o
r Asia
n Briti
sh - I
ndian
Asian o
r Asia
n Briti
sh - P
akist
ani
Asian o
r Asia
n Briti
sh - B
angla
desh
i
Black o
r Blac
k Briti
sh - B
lack C
aribb
ean
Black o
r Blac
k Briti
sh - B
lack A
frican
Chines
e or O
ther E
thnic
Group -
Chin
ese
LondonEngland
Taking the population as a whole, in both London and England, the proportion of women is just over 51% (51.6% and 51.3% respectively). In London, there are some minority ethnic groups which have a much lower proportion of women – notably the Pakistani population (48.5%). Amongst the white Irish population, the proportion of women in England as a whole is 52.9% and in London is 53.2%. In London’s white British population, 51.2% are women.
3 The term island of Ireland used here includes both Northern Ireland and the Republic of Ireland.
10

Figure 4. The age distribution of the white Irish population in London
0%
5%
10%
15%
20%
25%
30%
35%
40%
45%
0-15 16-24 25-49 50-59 60-64 65-74 75 andolder
allwhite Irish
When compared with the population of London as a whole the above chart clearly illustrates that the white Irish population is an older population. There is parity in the 25 to 49 age group (both populations are at 41.0%) but in younger age groups, the proportion of white Irish people is smaller than the general population and, conversely, in the older age groups, the proportion of white Irish people is greater. 6.8% of white Irish people are aged under 16, in comparison with 20.2% of London’s population as a whole. 20.2% of the white Irish population is aged 65 or older, in comparison with 16.4% of the population as a whole. One factor to bear in mind is whether people in different age groups behaved differently in terms of completing and retuning the Census forms. Hickman and Walter (1997)4 suggest that there is likely to be an under-representation of younger Irish people completing the Census and there is also an issue of second and third generation Irish people who did not define as Irish5 in the Census. This would have an impact on the proportion of younger white Irish people counted in the Census. However, the issue of under-enumeration would not apply to those aged under 166 who are very poorly represented in the age distribution illustrated above. From the data the Census provides, it is not possible to say to what extent the skewed age profile above is the result of the under-count and to what extent there actually is a skewed age profile in the white Irish population.
4 Hickman MJ and Walter B Discrimination and the Irish Community in Britain CRE 1997. 5 This is discussed in England: the Irish Dimension - an exploration of 2001 Census data. 6 A significant feature of the age distribution of white Irish people is the small proportion who are aged 0 to 15 – far smaller than in any other of the region’s white British or minority ethnic populations. One can assume that, in most cases, parents or guardians will have completed Census forms on behalf of children of this age. It is thus the parents, in the main, who are making decisions about their children’s declared ethnicity. Most of the parents of the children of this age, will themselves be in the 24 to 49 age group in figure 4 – an age group of similar proportion in the white Irish population to the population of the region as a whole. This begs the question of why parents who reporting themselves to be white Irish did not record their children as white Irish.
11
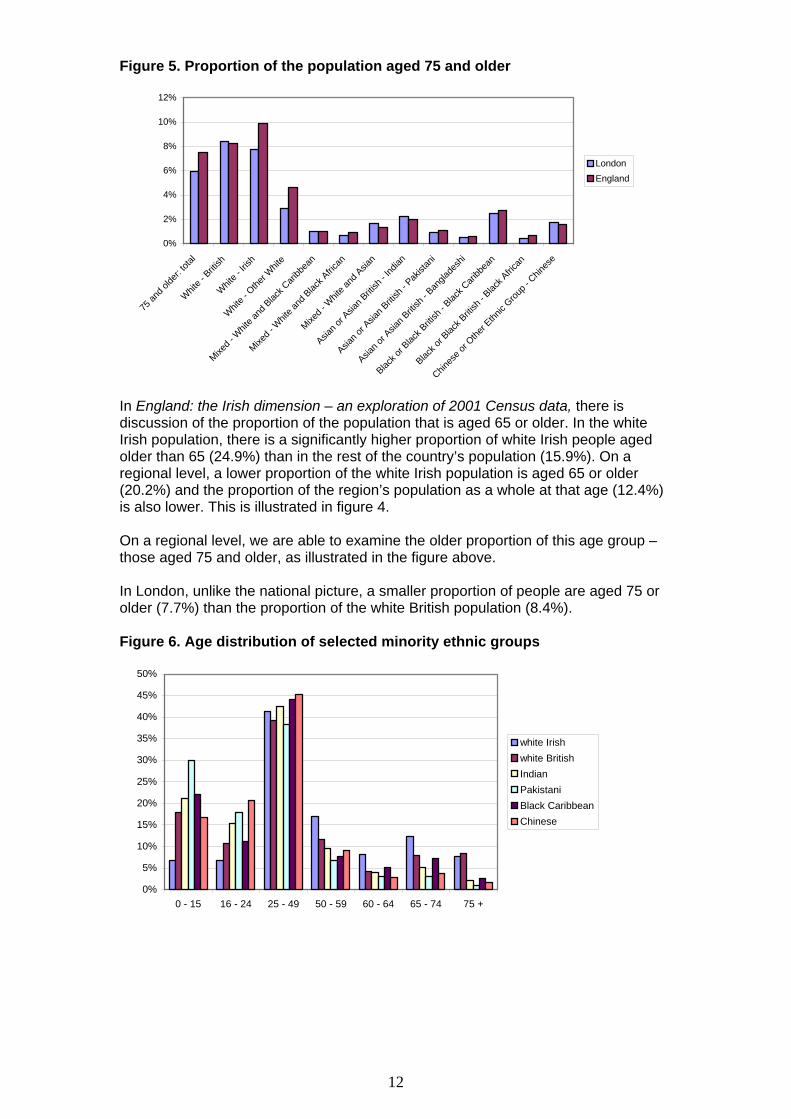
Figure 5. Proportion of the population aged 75 and older
0%
2%
4%
6%
8%
10%
12%
75 an
d olde
r: tota
l
White -
British
White -
Irish
White -
Othe
r Whit
e
Mixed -
Whit
e and
Black C
aribb
ean
Mixed -
Whit
e and
Black A
frican
Mixed -
Whit
e and
Asian
Asian o
r Asia
n Briti
sh - I
ndian
Asian o
r Asia
n Briti
sh - P
akist
ani
Asian o
r Asia
n Briti
sh - B
angla
desh
i
Black o
r Blac
k Briti
sh - B
lack C
aribb
ean
Black o
r Blac
k Briti
sh - B
lack A
frican
Chines
e or O
ther E
thnic
Group -
Chin
ese
LondonEngland
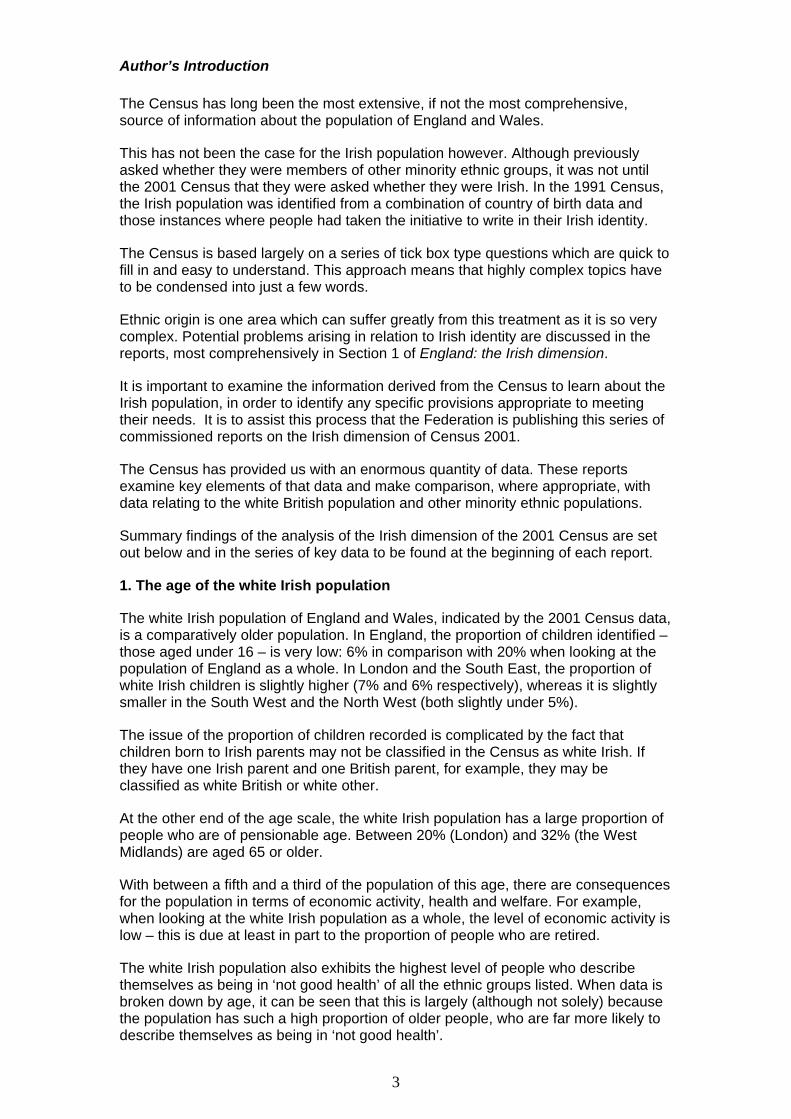
In England: the Irish dimension – an exploration of 2001 Census data, there is discussion of the proportion of the population that is aged 65 or older. In the white Irish population, there is a significantly higher proportion of white Irish people aged older than 65 (24.9%) than in the rest of the country’s population (15.9%). On a regional level, a lower proportion of the white Irish population is aged 65 or older (20.2%) and the proportion of the region’s population as a whole at that age (12.4%) is also lower. This is illustrated in figure 4. On a regional level, we are able to examine the older proportion of this age group – those aged 75 and older, as illustrated in the figure above. In London, unlike the national picture, a smaller proportion of people are aged 75 or older (7.7%) than the proportion of the white British population (8.4%). Figure 6. Age distribution of selected minority ethnic groups
0%
5%
10%
15%
20%
25%
30%
35%
40%
45%
50%
0 - 15 16 - 24 25 - 49 50 - 59 60 - 64 65 - 74 75 +
white Irishwhite BritishIndianPakistaniBlack CaribbeanChinese
12

There is no other (majority or minority) ethnic group in London which is structured in the same way as the white Irish population in terms of the age of its members. A relatively low proportion of under 25s (13.6%) is contrasted with a relatively high proportion in each age group over 50. In the white British population, 28.5% of the population are aged under 25, as is 33.3% of the Black Caribbean population and 47.8% of the Pakistani population. 58.2% of the white Irish population is in the potentially economically active 25 to 59 age group, but this is not as significantly different from other ethnic groups as it is in the lower and higher age groups. For example, 51.9% of the Black Caribbean population is aged between 25 and 59, as is 51.0% of the White British population and 45.1% of the Pakistani population is aged between 25 and 59. As the above series of graphs illustrates, in comparison with the other minority ethnic groups listed, the white Irish population is an ageing population – a larger proportion of the population is older (over 64) than is younger (under 25). A population of this structure will shrink as the numbers who die are not matched by those born, unless migration patterns change the general trend or unless there are changes in how sections of the population perceive their ethnicity7. Additionally, an aging population will have very different characteristics and needs in comparison to those with a younger population – more people will be retired and no longer economically active; care needs may be different and levels of ill-health and disability tend to be higher in populations which are older, for example. As suggested above (in discussion of figure 4), it is important to remember that a skewed age profile may be affected by different age groups having differing Census form return rates. This may or may not affect different ethnic groups in different ways. _____________________________________________________________________ In summary This section found that 3.1% of London’s population reported as white Irish. However this is likely to be an under-representation of actual figures. Self-declared ethnicity is a complicated issue – the white Irish population could be as high as 8.2% of the population of London. The reported white Irish population in London has a relatively small number of people who are aged under 25 and a relatively large proportion of people who are aged 50 and older, and 75 and older.
7 Commentators have suggested that for a variety of reasons (such as the complexities of ethnicity and identity, a confusion between ethnicity and nationality, and the construction of the ethnic group question in the Census form), a number of people born on the island of Ireland and second and third generation Irish people may not have taken the option of identifying as white Irish in the 2001 Census.
13

Section 2. Economic activity and inactivity _____________________________________________________________________ Any population has a bearing on the economy of the place in which it lives. This section examines the levels of economic activity of the white Irish population of London in comparison with the rest of the region’s population. Economic activity, as an indicator, is a count of the number of individuals who are either working or are available to work. To aid our understanding, this section also looks at what the Census has to say about economic inactivity. The first figures in this section look at those people aged between 16 and 24. The later figures look at the older age group – those aged between 25 and 74. Figure 7. Proportion of the population of London aged 16 to 24 years old which is economically active8
0%
10%
20%
30%
40%
50%
60%
70%
80%
Econo
mically
activ
e 16-2
4 yea
r olds
: total
White -
British
White -
Irish
White -
Othe
r Whit
e
Mixed -
Whit
e and
Black C
aribb
ean
Mixed -
Whit
e and
Black A
frican
Mixed -
Whit
e and
Asian
Asian o
r Asia
n Briti
sh - I
ndian
Asian o
r Asia
n Briti
sh - P
akist
ani
Asian o
r Asia
n Briti
sh - B
angla
desh
i
Black o
r Blac
k Briti
sh - B
lack C
aribb
ean
Black o
r Blac
k Briti
sh - B
lack A
frican
Chines
e or O
ther E
thnic
Group -
Chin
ese
LondonEngland
In London, 65.8% of the Irish population aged under 25 is economically active. This compares with 60.1% of the region’s population as a whole. Only the white British population has a higher level of economic activity in this age group – 69.0%. When looking at the white Irish population specifically, London is the English region in which the level of economic activity is highest, and comparatively high when compared with other ethnic populations.
8 Economically active is defined as the state of being available for work or working. Thus, someone who is unemployed is still defined as economically active. Someone who is retired, for example, is not defined as economically active.
14

Figure 8. Proportion of population aged 25 to 74 which are economically active
0%
10%
20%
30%
40%
50%
60%
70%
80%
Econo
mically
activ
e 25-7
4 yea
r olds
: total
White -
British
White -
Irish
White -
Othe
r Whit
e
Mixed -
Whit
e and
Black C
aribb
ean
Mixed -
Whit
e and
Black A
frican
Mixed -
Whit
e and
Asian
Asian o
r Asia
n Briti
sh - I
ndian
Asian o
r Asia
n Briti
sh - P
akist
ani
Asian o
r Asia
n Briti
sh - B
angla
desh
i
Black o
r Blac
k Briti
sh - B
lack C
aribb
ean
Black o
r Blac
k Briti
sh - B
lack A
frican
Chines
e or O
ther E
thnic
Group -
Chin
ese
LondonEngland
While economic activity is generally higher amongst all of the minority ethnic groups in the 25 to 74 age group, the white Irish population of London fares comparatively poorly. In London, 62.9% of the white Irish population is economically active in comparison with 70.4% of the white British population. Only the Bangladeshi and Pakistani communities have levels of economic activity in this age group lower than that in the white Irish population (43.0% and 55.2% respectively). It is important to remember when looking at economic activity in this age group that 12.5% of the region’s white Irish population is aged between 65 and 74 and are thus likely to be retired and no longer economically active. In comparison, only 7.9% of the white British population as a whole is aged between 65 and 74 (see figure 6). Figure 9. Economic activity and inactivity amongst 16 to 24 year old men
0%
10%
20%
30%
40%
50%
Part-tim
e emplo
yee
Full-tim
e emplo
yee
Self-em
ploye
d
Unemplo
yed
Full-tim
e stud
ent
Retired
Look
ing af
ter ho
me/fam
ily
Perman
ently
sick
/disa
bled
white Irish
white British
42.1% of white Irish 16 to 24 year old men are in full-time employment, in comparison with 47.8% of young white British men. Levels of part-time employment are also lower. 36.4% of the young white Irish men are full-time students along with 34.2% of young white British men.
15

Figure 10. Economic activity and inactivity amongst 16 to 24 year old women
0%
10%
20%
30%
40%
50%
Part-tim
e emplo
yee
Full-tim
e emplo
yee
Self-em
ploye
d
Unemplo
yed
Full-tim
e stud
ent
Retired
Look
ing af
ter ho
me/fam
ily
Perman
ently
sick
/disa
bled
white Irishwhite British
The picture amongst young women is very similar to that in young men. 39.0% of young white Irish women are in full-time education in comparison with 36.2% of young white British women. 41.8% of young white Irish women are in full-time employment in comparison with 43.2% of young white British women. Overall, in the 16 to 25 age bracket, for both men and women, there is the smallest amount of difference between the two ethnic populations in London than in any of the English regions. Figure 11. Economic activity and inactivity amongst 25 to 74 year old men
0%
10%
20%
30%
40%
50%
60%
Part-tim
e emplo
yee
Full-tim
e emplo
yee
Self-em
ploye
d
Unemplo
yed
Full-tim
e stud
ent
Retired
Look
ing af
ter ho
me/fam
ily
Perman
ently
sick
/disa
bled
white Irishwhite British
As suggested by the higher proportion of older people (see figure 6), a relatively high proportion, 14.1%, of London’s white Irish men are retired – in comparison with 11.6% of the white British population. Similarly, levels of full-time employment are 9.6% lower (45.3% of white Irish men are in full-time employment in comparison with 54.9% of white British men). 11.0% of white Irish men are not working because of being permanently sick or disabled in comparison with 5.8% of the white British population in London.
16

Figure 12. Economic activity and inactivity amongst 25 to 74 year old women
0%
5%
10%
15%
20%
25%
30%
35%
40%
Part-tim
e emplo
yee
Full-tim
e emplo
yee
Self-em
ploye
d
Unemplo
yed
Full-tim
e stud
ent
Retired
Look
ing af
ter ho
me/fam
ily
Perman
ently
sick
/disa
bled
white Irishwhite British
In London, 19.5% of white Irish women and 16.1% of white British women are retired. 10.8% of white Irish women are looking after family or home in comparison with 13.3% of white British women. 6.9% of white Irish women are permanently sick or disabled - a proportion 2.1% higher than the proportion of white British women. Figure 13. Proportion of men who are long-term unemployed – including those who have never worked
0%
2%
4%
6%
8%
10%
12%
Never
worked
and l
ong t
erm un
emplo
yed:
total
White -
Briti
sh
White -
Irish
White -
Othe
r Whit
e
Mixed -
Whit
e and
Blac
k Cari
bbea
n
Mixed -
Whit
e and
Blac
k Afric
an
Mixed -
Whit
e and
Asia
n
Asian o
r Asia
n Briti
sh - I
ndian
Asian o
r Asia
n Briti
sh - P
akist
ani
Asian o
r Asia
n Briti
sh - B
angla
desh
i
Black o
r Blac
k Briti
sh - B
lack C
aribb
ean
Black o
r Blac
k Briti
sh - B
lack A
frican
Chines
e or O
ther E
thnic
Group -
Chin
ese
LondonEngland
In the population as a whole, and in ten of the listed minority ethnic populations, the proportion of people who are long-term unemployed (including those who have never worked) is higher in London than in England as a whole. 4.4% of London’s men are long-term unemployed. Amongst the white Irish men, the proportion is 4.3% in comparison with 2.8% of white British men. Apart from white British men, only one other population – Indian men (3.0%) – has a smaller proportion of men who are long-term unemployed.
17

Figure 14. Proportion of women who are long-term unemployed – including those who have never worked
0%
10%
20%
30%
40%
50%
60%
Never
worked
and l
ong t
erm un
emplo
yed:
total
White -
Briti
sh
White -
Irish
White -
Othe
r Whit
e
Mixed -
Whit
e and
Blac
k Cari
bbea
n
Mixed -
Whit
e and
Blac
k Afric
an
Mixed -
Whit
e and
Asia
n
Asian o
r Asia
n Briti
sh - I
ndian
Asian o
r Asia
n Briti
sh - P
akist
ani
Asian o
r Asia
n Briti
sh - B
angla
desh
i
Black o
r Blac
k Briti
sh - B
lack C
aribb
ean
Black o
r Blac
k Briti
sh - B
lack A
frican
Chines
e or O
ther E
thnic
Group -
Chin
ese
LondonEngland
In London, 6.8% of women are long-term unemployed (including those who have never worked). This rises to a significant 41.7% of Pakistani women. White Irish women have the lowest level of long-term unemployment – 4.8%, of all the populations listed. _____________________________________________________________________ In summary This section looked at economic activity and found a relatively low level of economic activity in the white Irish population amongst the largest age group – 25 to 74 year olds. In the same age group, there were relatively high levels of white Irish people who were retired and people who were not working because of permanent sickness or disability. In the 16 to 24 age group, the most notable feature is the relatively high proportion of white Irish people who were in full-time education. In terms of unemployment (including those who have never worked), figures for the white Irish population are higher than those for the white British population.
18

Section 3. Types of work _____________________________________________________________________ Having examined overall levels of economic activity in the previous section, this section concentrates on what the Census reveals about the nature of work undertaken by the population. Do different ethnic minority groups tend to do different types of work? Figure 15. The proportion of men who are managers or senior officials
0%
5%
10%
15%
20%
25%
30%
Manag
ers an
d Sen
ior O
fficial
s: tot
al
White -
British
White -
Irish
White -
Othe
r Whit
e
Mixed -
Whit
e and
Black C
aribb
ean
Mixed -
Whit
e and
Black A
frican
Mixed -
Whit
e and
Asian
Asian o
r Asia
n Briti
sh - I
ndian
Asian o
r Asia
n Briti
sh - P
akist
ani
Asian o
r Asia
n Briti
sh - B
angla
desh
i
Black o
r Blac
k Briti
sh - B
lack C
aribb
ean
Black o
r Blac
k Briti
sh - B
lack A
frican
Chines
e or O
ther E
thnic
Group -
Chin
ese
LondonEngland
In London, 19.9% of white Irish men are managers or senior officials. Only five of the other listed minority ethnic groups have a higher proportion of men in this top level of occupation – ‘other white’ (25.0%), Indian (22.1%), white British (21.6%), white and Asian (20.7%) and Chinese (20.6%). Figure 16. The proportion of women working as managers or senior officials
0%
2%
4%
6%
8%
10%
12%
14%
16%
18%
Manag
ers an
d Sen
ior O
fficial
s: tot
al
White -
British
White -
Irish
White -
Othe
r Whit
e
Mixed -
Whit
e and
Black C
aribb
ean
Mixed -
Whit
e and
Black A
frican
Mixed -
Whit
e and
Asian
Asian o
r Asia
n Briti
sh - I
ndian
Asian o
r Asia
n Briti
sh - P
akist
ani
Asian o
r Asia
n Briti
sh - B
angla
desh
i
Black o
r Blac
k Briti
sh - B
lack C
aribb
ean
Black o
r Blac
k Briti
sh - B
lack A
frican
Chines
e or O
ther E
thnic
Group -
Chin
ese
LondonEngland
In terms of white Irish women, the proportion working as managers and senior officials is 15.3% - only the ‘white other’ category has a higher proportion - at 15.6%. Overall, 20.9% of men were working as managers and senior officials in comparison with 13.8% of women. Taking the white Irish population as a whole, the proportion of men is 19.9% and this falls to 15.3% when looking at women – a smaller (2.5%) gender difference than in the population as a whole.
19

Figure 17. Occupations amongst men aged 16 to 74
0%
5%
10%
15%
20%
25%
Manag
ers an
d sen
ior of
ficial
s
Profes
siona
l occ
upati
ons
Assoc
iate p
rof &
tech
occu
patio
ns
Admin
& secre
tarial
occu
patio
ns
Skilled
trade
s occ
upati
ons
Person
al se
rvice
occu
patio
ns
Sales &
custo
mer se
rvice
occu
patio
ns
Proces
s, pla
nt & m
achin
e ope
rative
s
Elemen
tary o
ccup
ation
s
white Irish
white British
all
In London, the proportion of white Irish men working as managers and senior officials, in professional occupations and in associate professional and technical occupations, is smaller than the proportion of white British men in the same occupations. The difference is largest in the associate professional and technical occupations, which employ 14.0% of white Irish men in comparison with 19.0% of white British men. In contrast, 18.4% of white Irish men are in skilled trades in comparison with 13.6% of white British men. 10.9% of white Irish men are in elementary occupations in comparison with 9.0% of white British men. Figure 18. Occupations amongst women aged 16 to 74
0%
5%
10%
15%
20%
25%
30%
Manag
ers an
d sen
ior of
ficial
s
Profes
siona
l occ
upati
ons
Assoc
iate p
rof & te
ch oc
cupa
tions
Admin
& secre
tarial
occu
patio
ns
Skilled
trade
s occ
upati
ons
Person
al se
rvice
occu
patio
ns
Sales &
custo
mer se
rvice
occu
patio
ns
Proces
s, pla
nt & m
achin
e ope
rative
s
Elemen
tary o
ccup
ation
s
white Irishwhite Britishall
In terms of managers and senior officials and the professional occupations, there is a degree of similarity between the proportions of white Irish women and white British women employed. Other types of occupations are also showing a similar pattern between the two populations. However, differences do exist, most significantly in the associate professional and technical occupations (employing 21.9% of white Irish
20

women and 18.8% of white British women) and in the administrative and secretarial occupations (employing 21.6% and 25.9% respectively). The following figures look at employment in terms of what has become known as NS-SEC. NS-SEC (National Statistics Socio-Economic Classification) is an attempt to look at social classification by occupation but, instead of being solely an examination of jobs, the NS-SEC is constructed using three pieces of information: occupation, employment status and the size of the establishment in which the person works. To this end, the 2001 Census form asked for a significant amount of information about each respondent’s job, place of work, role and level9. The picture created by the following figure will thus differ in some respects from the previous figures, which were looking solely at occupation. Figure 19. Men in London aged between 16 and 74 – by NS-SEC (excluding those who are unemployed or in full-time education)
0%
5%
10%
15%
20%
25%
30%
Highermanagerial
&professionaloccupations
Lowermanagerial
&professionaloccupations
Intermediateoccupations
Smallemployersand ownaccountworkers
Lowersupervisory
andtechnical
occupations
Semi-routineoccupations
Routineoccupations
white Irish
white British
all
In terms of the NS-Sec analysis, the most significant differences between white Irish and white British men are in the higher and lower managerial occupations. 14.0% of white Irish men are in higher managerial and professional occupations in comparison with 17.3% of the white British population. In the lower managerial occupations, the proportions are 19.1% and 24.3% respectively. Additionally, 12.9% of white Irish men are small employers/self-employed in comparison with 10.3% of the white British men.
9 A full description of the NS-SEC definitions is to be found in England: the Irish dimension – an exploration of 2001 Census data.
21

Figure 20. Women in London aged between 16 and 74 – by NS-SEC (excluding those who are unemployed or in full-time education)
0%
2%
4%
6%
8%
10%
12%
14%
16%
Highermanagerial
&professionaloccupations
Lowermanagerial
&professionaloccupations
Intermediateoccupations
Smallemployersand ownaccountworkers
Lowersupervisory
andtechnical
occupations
Semi-routineoccupations
Routineoccupations
white Irishwhite Britishall
20.6% of white Irish women in London are in higher and lower managerial and professional occupations combined. This compares with 17.6% of white British women. 2.1% of white Irish women are small employers or own account workers in comparison with 2.0% of white British women. In all other NS-Sec occupation types, there is a smaller proportion of white Irish women than white British women. The difference is most marked in the intermediate occupations which include 6.7% of white Irish women and 10.4% of white British women. Figure 21. Industry areas of the male working population
0%
5%
10%
15%
20%
25%
30%
35%
Agricu
lture,
mini
ng an
d fish
ing
Manufa
cturin
g (inc
luding
utiliti
es)
Constr
uctio
n
Wholes
ale an
d reta
il trad
e
Hotels
and r
estau
rants
Transp
ort an
d com
munica
tion
Financ
ial an
d prof
essio
nal s
ervice
s
Public
secto
r serv
ices (
includ
ing ed
ucati
on)
Health
and s
ocial
servi
ces
white Irish
white British
The most significant feature of the chart above is the proportion of white Irish men in London working in construction – 22.1% in comparison with 9.9% of white British men. No other ethnic population among those listed in the Census has such a high proportion of men working in construction. The next highest proportion is that amongst white British men.
22

Construction is not, however, the field which employs the biggest proportion of white Irish men – that is financial and professional services, which employ 25.8% of white Irish men and 30.3% of white British men. There are consequences to working in the construction industry, as a Mind report of 200310 has found: “A major disadvantage of a lifetime of work in the construction industry is that many Irish men are in poor physical health and unable to work. They have not paid insurance contributions and end up without pensions in their old age or when ill.” In light of this, it is interesting to return to figure 11 which illustrates that 11.0% of men aged between 25 and 74 are not working because of permanent sickness or disability. This is a high proportion of men, particularly when looked at in comparison with the male white British population in which 5.8% are not working because of permanent sickness or disability. We will return to this topic in Section 8: Health. Figure 22. Industry areas of female working population
0%
5%
10%
15%
20%
25%
30%
Agricu
lture,
mini
ng an
d fish
ing
Manufa
cturin
g (inc
luding
utiliti
es)
Constr
uctio
n
Wholes
ale an
d reta
il trad
e
Hotels
and r
estau
rants
Transp
ort an
d com
munica
tion
Financ
ial an
d prof
essio
nal s
ervice
s
Public
secto
r serv
ices (
includ
ing ed
ucati
on)
Health
and s
ocial
servi
ces
white Irish
white British
Almost a quarter – 24.1% of white Irish women in London work in health and social care in comparison with 14.9% of the white British population. Only the Black Caribbean and Black African populations have a greater proportion of women working in this field – 26.6% and 30.2% respectively. Like men, the field employing the biggest proportion of white Irish women is financial and professional services – 24.8%. It also employs 27.6% of white British women. The field employs 29.5% of London’s men and 26.8% of London’s women – this fact, together with the finding from the Census that in no other English region is the field so significant than in the white Irish population, suggests that this focus on financial and professional services is more to do with London’s economy than it is to do with the white Irish population itself. Health and social work (also referred to as health and social care within the Census outputs) will include medicine, nursing, auxiliary nursing, care work, social work etc. Some of these jobs will be highly qualified and well paid roles such as doctors; others will require no qualifications and may well be low paid.
10 Mind: Mental health of Irish-born people in Britain, 2003.
23

_____________________________________________________________________ In summary This section suggests that there is an Irish population which presents two pictures. The first presents a picture of a population which has a relatively high proportion in managerial positions and professional positions. The second presents a picture of a population in which a very high proportion of men are working in construction and a very high proportion of women are working in health and social care. These types of work can have significant effects on a population’s health, well-being and (current and future) financial well-being.
24

Section 4. Unpaid carers _____________________________________________________________________ Previous sections have examined work as well as retirement and full-time education. However, a significant form of unpaid work has so far been omitted from our discussion – caring for other people. Section 1 outlined the older nature of the white Irish population. Section 8 will look at the relatively high levels of ill health associated with this. This section examines whether these factors impact on the level of unpaid caring carried out by the white Irish population. The Census divides unpaid care into three different levels depending on the hours an individual devotes to it:
a. between 1 and 19 hours a week b. between 20 and 49 hours a week c. 50 or more hours a week
People providing the very highest level of care are unlikely to be able to work at the same time, which impacts on their own life as well as on the lives of their dependents. However, even the lowest level of care-giving may restrict full-time and even part-time employment opportunities. Those providing only a low level of care may not be able to work if they have, in addition, their own children to care for. Employment opportunities may also be reduced if the care has to take place at particular hours of the day. Even care which has to be given at anti-social hours (such as through the night) may impede a carer’s ability to work if they don’t have an opportunity to sleep. The Census form defines care as being ‘any help or support [given] to family members, friends, neighbours or others because of long-term physical or mental ill-health or disability; or problems related to old-age’. To get a greater understanding of levels of unpaid care, it is important to look at different elements of the population – men, women, younger people, people of pensionable age – as each provides a very different picture of care-giving. a. Between 1 and 19 hours a week of unpaid care To weave our way through this complex picture, we will take each level of care in turn, starting with those providing between 1 and 19 hours a week below. Figures 23 and 24 look at the working age carers and Figures 25 and 26 look at pensionable age carers.
25
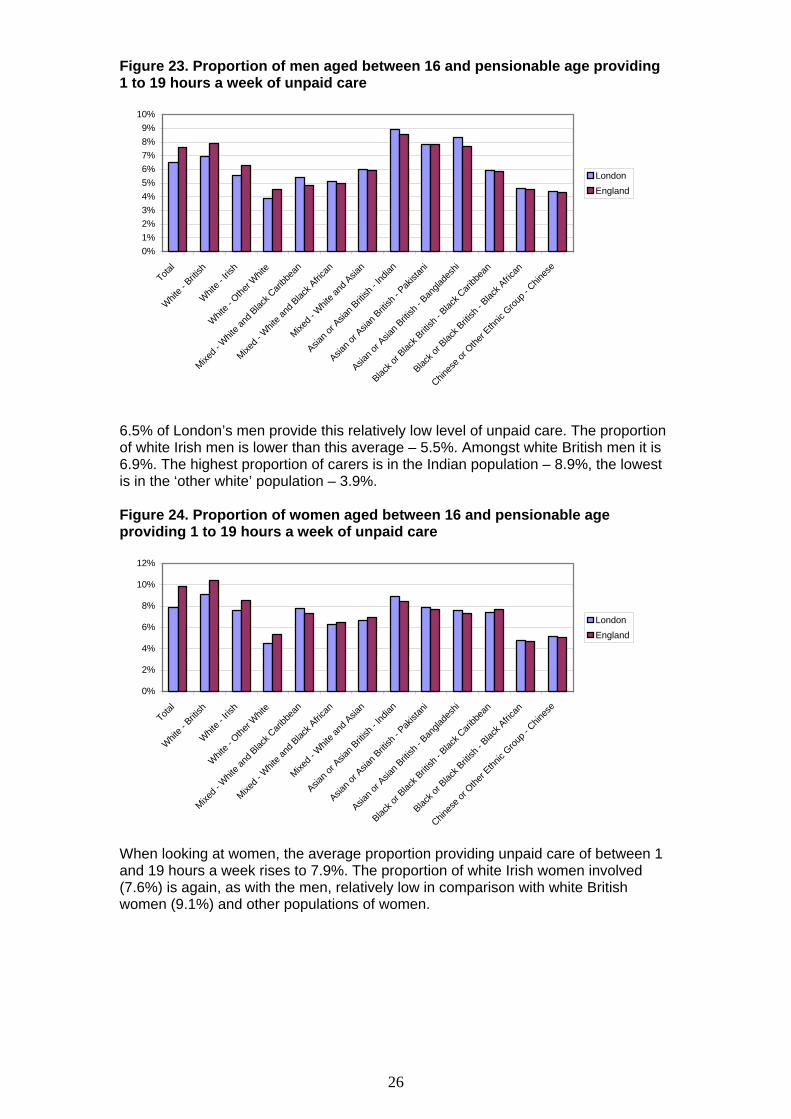
Figure 23. Proportion of men aged between 16 and pensionable age providing 1 to 19 hours a week of unpaid care
0%1%2%3%4%5%6%7%8%9%
10%
Total
White -
British
White -
Irish
White -
Othe
r Whit
e
Mixed -
Whit
e and
Black C
aribb
ean
Mixed -
Whit
e and
Black A
frican
Mixed -
Whit
e and
Asian
Asian o
r Asia
n Briti
sh - I
ndian
Asian o
r Asia
n Briti
sh - P
akist
ani
Asian o
r Asia
n Briti
sh - B
angla
desh
i
Black o
r Blac
k Briti
sh - B
lack C
aribb
ean
Black o
r Blac
k Briti
sh - B
lack A
frican
Chines
e or O
ther E
thnic
Group -
Chin
ese
LondonEngland
6.5% of London’s men provide this relatively low level of unpaid care. The proportion of white Irish men is lower than this average – 5.5%. Amongst white British men it is 6.9%. The highest proportion of carers is in the Indian population – 8.9%, the lowest is in the ‘other white’ population – 3.9%. Figure 24. Proportion of women aged between 16 and pensionable age providing 1 to 19 hours a week of unpaid care
0%
2%
4%
6%
8%
10%
12%
Total
White -
British
White -
Irish
White -
Othe
r Whit
e
Mixed -
Whit
e and
Black C
aribb
ean
Mixed -
Whit
e and
Black A
frican
Mixed -
Whit
e and
Asian
Asian o
r Asia
n Briti
sh - I
ndian
Asian o
r Asia
n Briti
sh - P
akist
ani
Asian o
r Asia
n Briti
sh - B
angla
desh
i
Black o
r Blac
k Briti
sh - B
lack C
aribb
ean
Black o
r Blac
k Briti
sh - B
lack A
frican
Chines
e or O
ther E
thnic
Group -
Chin
ese
LondonEngland
When looking at women, the average proportion providing unpaid care of between 1 and 19 hours a week rises to 7.9%. The proportion of white Irish women involved (7.6%) is again, as with the men, relatively low in comparison with white British women (9.1%) and other populations of women.
26

Figure 25. Proportion of men of pensionable age providing between 1 and 19 hours a week of unpaid care
0%1%2%3%4%5%6%7%8%9%
Total
White -
British
White -
Irish
White -
Othe
r Whit
e
Mixed -
Whit
e and
Black C
aribb
ean
Mixed -
Whit
e and
Black A
frican
Mixed -
Whit
e and
Asian
Asian o
r Asia
n Briti
sh - I
ndian
Asian o
r Asia
n Briti
sh - P
akist
ani
Asian o
r Asia
n Briti
sh - B
angla
desh
i
Black o
r Blac
k Briti
sh - B
lack C
aribb
ean
Black o
r Blac
k Briti
sh - B
lack A
frican
Chines
e or O
ther E
thnic
Group -
Chin
ese
LondonEngland
4.7% of white Irish men of pensionable age are providing this level of care. This compares with 7.0% of white British men. In fact, only three of the ethnic populations listed have a lower proportion of pensionable age men providing this level of care: Black Caribbean men (4.5%), Black African men (4.1%) and Chinese men (3.9%). Figure 26. Proportion of women of pensionable age providing between 1 and 19 hours a week of unpaid care
0%
1%
2%
3%
4%
5%
6%
7%
8%
Total
White -
British
White -
Irish
White -
Othe
r Whit
e
Mixed -
Whit
e and
Black C
aribb
ean
Mixed -
Whit
e and
Black A
frican
Mixed -
Whit
e and
Asian
Asian o
r Asia
n Briti
sh - I
ndian
Asian o
r Asia
n Briti
sh - P
akist
ani
Asian o
r Asia
n Briti
sh - B
angla
desh
i
Black o
r Blac
k Briti
sh - B
lack C
aribb
ean
Black o
r Blac
k Briti
sh - B
lack A
frican
Chines
e or O
ther E
thnic
Group -
Chin
ese
LondonEngland
In terms of pensionable age, white Irish women (6.1%) are providing care at this level – the fifth highest proportion of all the populations listed. The populations with higher proportions are white and Asian (7.4%), white and Black Caribbean (7.0%), white British (7.0%) and other white (6.3%). The following charts look at those people providing between 20 and 49 hours a week of unpaid care. Figures 27 and 28 look at carers aged between 16 and pensionable age and figures 29 and 30 look at carers of pensionable age.
27

b. Between 20 and 49 hours a week of unpaid care Figure 27. Proportion of men aged between 16 and pensionable age providing 20 to 49 hours a week of unpaid care
0.0%
0.5%
1.0%
1.5%
2.0%
2.5%
Total
White -
Briti
sh
White -
Irish
White -
Othe
r Whit
e
Mixed -
Whit
e and
Blac
k Cari
bbea
n
Mixed -
Whit
e and
Blac
k Afric
an
Mixed -
Whit
e and
Asia
n
Asian o
r Asia
n Briti
sh - I
ndian
Asian o
r Asia
n Briti
sh - P
akist
ani
Asian o
r Asia
n Briti
sh - B
angla
desh
i
Black o
r Blac
k Briti
sh - B
lack C
aribb
ean
Black o
r Blac
k Briti
sh - B
lack A
frican
Chines
e or O
ther E
thnic
Group -
Chin
ese
London
England
When looking at the higher level of care - between 20 and 49 hours a week (between 3 and 7 hours a day, every day), the proportion of men involved falls to 1.0% from the 6.5% involved at the 1 to 19 hours a week level. Only in one of the ethnic groups listed is there a level higher than 2% - Bangladeshi men. At less than 0.9%, white Irish men have one of the lowest proportions, although the proportion of white British men is even lower – 0.8%. Figure 28. Proportion of women aged between 16 and pensionable age providing 20 to 49 hours a week of unpaid care
0.0%
0.5%
1.0%
1.5%
2.0%
2.5%
3.0%
3.5%
Total
White -
British
White -
Irish
White -
Othe
r Whit
e
Mixed -
Whit
e and
Black C
aribb
ean
Mixed -
Whit
e and
Black A
frican
Mixed -
Whit
e and
Asian
Asian o
r Asia
n Briti
sh - I
ndian
Asian o
r Asia
n Briti
sh - P
akist
ani
Asian o
r Asia
n Briti
sh - B
angla
desh
i
Black o
r Blac
k Briti
sh - B
lack C
aribb
ean
Black o
r Blac
k Briti
sh - B
lack A
frican
Chines
e or O
ther E
thnic
Group -
Chin
ese
LondonEngland
When looking at women rather than men the proportion of the general population providing this mid-range of care rises by 0.4%. The proportion involved is the same amongst both white British and white Irish women – at 1.3%, but varies much more significantly when looking at other minority ethnic groups – from 0.9% of the Chinese population, for example, to 2.9% of the Bangladeshi population.
28

Figure 29. Proportion of men of pensionable age providing between 20 and 49 hours a week of unpaid care
0.0%
0.5%
1.0%
1.5%
2.0%
2.5%
3.0%
Total
White -
British
White -
Irish
White -
Othe
r Whit
e
Mixed -
Whit
e and
Black C
aribb
ean
Mixed -
Whit
e and
Black A
frican
Mixed -
Whit
e and
Asian
Asian o
r Asia
n Briti
sh - I
ndian
Asian o
r Asia
n Briti
sh - P
akist
ani
Asian o
r Asia
n Briti
sh - B
angla
desh
i
Black o
r Blac
k Briti
sh - B
lack C
aribb
ean
Black o
r Blac
k Briti
sh - B
lack A
frican
Chines
e or O
ther E
thnic
Group -
Chin
ese
LondonEngland
1.4% of the men of this age are providing between 20 and 49 hours a week of unpaid care – 0.1% more than the proportion of white British men involved. The highest level is to be found amongst Indian men (2.8%) and the lowest is to be found amongst the white Irish men (1.1%). Figure 30. Proportion of women of pensionable age providing between 20 and 49 hours a week of unpaid care
0.0%
0.5%
1.0%
1.5%
2.0%
2.5%
3.0%
Total
White -
British
White -
Irish
White -
Othe
r Whit
e
Mixed -
Whit
e and
Black C
aribb
ean
Mixed -
Whit
e and
Black A
frican
Mixed -
Whit
e and
Asian
Asian o
r Asia
n Briti
sh - I
ndian
Asian o
r Asia
n Briti
sh - P
akist
ani
Asian o
r Asia
n Briti
sh - B
angla
desh
i
Black o
r Blac
k Briti
sh - B
lack C
aribb
ean
Black o
r Blac
k Briti
sh - B
lack A
frican
Chines
e or O
ther E
thnic
Group -
Chin
ese
LondonEngland
General levels of care of this level in this age group are similarly low amongst women as they are amongst the men (figure 29). The highest level is to be found amongst white and Black African women (2.6%) and the lowest level is amongst Chinese women (1.1%). Amongst white Irish women the proportion is 1.4% and of white British women, 1.2% are involved. The following charts look at those people providing 50 hours or more of care a week. Figures 31 and 32 look at people aged 16 to pensionable age. Figures 33 and 34 look at people of pensionable age.
29

c. 50 or more hours a week of unpaid care Figure 31. Proportion of men aged between 16 and pensionable age providing more than 50 hours a week of unpaid care
0.0%
0.5%
1.0%
1.5%
2.0%
2.5%
Total
White -
British
White -
Irish
White -
Othe
r Whit
e
Mixed -
Whit
e and
Black C
aribb
ean
Mixed -
Whit
e and
Black A
frican
Mixed -
Whit
e and
Asian
Asian o
r Asia
n Briti
sh - I
ndian
Asian o
r Asia
n Briti
sh - P
akist
ani
Asian o
r Asia
n Briti
sh - B
angla
desh
i
Black o
r Blac
k Briti
sh - B
lack C
aribb
ean
Black o
r Blac
k Briti
sh - B
lack A
frican
Chines
e or O
ther E
thnic
Group -
Chin
ese
LondonEngland
In this highest level of care, 1.2% of men in London are involved, 1.2% of white Irish men and 1.2% of white British men. The highest proportion is to be found amongst Bangladeshi men – 2.2% Figure 32. Proportion of women aged between 16 and pensionable age providing more than 50 hours a week of unpaid care
0%
1%
2%
3%
4%
5%
6%
7%
Total
White -
British
White -
Irish
White -
Othe
r Whit
e
Mixed -
Whit
e and
Black C
aribb
ean
Mixed -
Whit
e and
Black A
frican
Mixed -
Whit
e and
Asian
Asian o
r Asia
n Briti
sh - I
ndian
Asian o
r Asia
n Briti
sh - P
akist
ani
Asian o
r Asia
n Briti
sh - B
angla
desh
i
Black o
r Blac
k Briti
sh - B
lack C
aribb
ean
Black o
r Blac
k Briti
sh - B
lack A
frican
Chines
e or O
ther E
thnic
Group -
Chin
ese
LondonEngland
6.0% of Bangladeshi women in London and 4.7% of Pakistani women are providing more than 50 hours a week of care. In comparison, 2.2% of white Irish women are involved as are 2.1% of white British women.
30

Figure 33. Proportion of men of pensionable age providing 50 hours or more a week of unpaid care
0%
1%
2%
3%
4%
5%
6%
Total
White -
British
White -
Irish
White -
Othe
r Whit
e
Mixed -
Whit
e and
Black C
aribb
ean
Mixed -
Whit
e and
Black A
frican
Mixed -
Whit
e and
Asian
Asian o
r Asia
n Briti
sh - I
ndian
Asian o
r Asia
n Briti
sh - P
akist
ani
Asian o
r Asia
n Briti
sh - B
angla
desh
i
Black o
r Blac
k Briti
sh - B
lack C
aribb
ean
Black o
r Blac
k Briti
sh - B
lack A
frican
Chines
e or O
ther E
thnic
Group -
Chin
ese
LondonEngland
3.4% of white Irish men of pensionable age are providing this high level of care – this compares with 4.4% of white British men. The highest level is to be found in the white and Black African population (4.9% - although this is not mirrored in the England picture) and the lowest level is to be found in the Chinese population (2.3%). Figure 34. Proportion of women of pensionable age providing 50 hours or more a week of unpaid care
0%
1%
2%
3%
4%
5%
6%
Total
White -
Briti
sh
White -
Irish
White -
Othe
r Whit
e
Mixed -
Whit
e and
Black C
aribb
ean
Mixed -
Whit
e and
Black A
frican
Mixed -
Whit
e and
Asian
Asian o
r Asia
n Briti
sh - I
ndian
Asian o
r Asia
n Briti
sh - P
akist
ani
Asian o
r Asia
n Briti
sh - B
angla
desh
i
Black o
r Blac
k Briti
sh - B
lack C
aribb
ean
Black o
r Blac
k Briti
sh - B
lack A
frican
Chines
e or O
ther E
thnic
Group -
Chin
ese
LondonEngland
Interestingly, when looking at the higher levels of care – more than 7 hours a day – the proportion of people of pensionable age providing such care is higher than those providing 20 to 49 hours a week. For women of pensionable age, the population most involved with this highest level of care is the Bangladeshi population (5.7%). Chinese women, as with the men, are
31

the least involved (2.7%). 3.3% of white Irish women are providing this level of care as are 3.6% of white British women. The data from this section indicates that there are relatively high levels of care (although the differences are not significant) in the white Irish population (in comparison with the other populations listed) in the following population groups: - Working age women – 1 to 19 hours a week of care - Pensionable age women – 1 to19 hours a week of care - Working age women – 50+ hours a week of care _____________________________________________________________________ In summary Providing care for a family member or other person can have a significant impact not only on the person caring but also on the dependents of the carer, as the time devoted to caring may mean that taking on employment is not possible. The above analysis demonstrates a complex pattern of care amongst the minority ethnic populations in the different age bands. What is needed is an assessment of the economic and health impacts of care provision as well as the support needs of those who are caring.
32

Section 5. Qualifications _____________________________________________________________________ This section looks at educational achievement as measured by the attainment of qualifications. While there is a whole range of educational attainment, this section examines the topics by two means – the attainment of no qualifications at all, and the attainment of the highest levels of qualifications. Figure 35. Proportion of 16 to 24 year olds with no qualifications
0%
5%
10%
15%
20%
25%
30%
No qua
lifica
tions
: total
White -
British
White -
Irish
White -
Othe
r Whit
e
Mixed -
Whit
e and
Black C
aribb
ean
Mixed -
Whit
e and
Black A
frican
Mixed -
Whit
e and
Asian
Asian o
r Asia
n Briti
sh - I
ndian
Asian o
r Asia
n Briti
sh - P
akist
ani
Asian o
r Asia
n Briti
sh - B
angla
desh
i
Black o
r Blac
k Briti
sh - B
lack C
aribb
ean
Black o
r Blac
k Briti
sh - B
lack A
frican
Chines
e or O
ther E
thnic
Group -
Chin
ese
LondonEngland
13.2% of the population aged between 16 and 24 in London has no qualifications – a smaller proportion than the 15.8% found for England as a whole. The Irish population of this age has 13.0% with no qualifications at all. 0.6% higher, the proportion is 13.6% in the white British population. The population with the highest proportion of 16 to 24 year olds with no qualifications, is the white and Black Caribbean population – 22.9%. Figure 36. Proportion of 16 to 24 years with qualifications at level 4/511
0%
5%
10%
15%
20%
25%
30%
35%
Leve
l 4/5:
total
White -
British
White -
Irish
White -
Othe
r Whit
e
Mixed -
Whit
e and
Black C
aribb
ean
Mixed -
Whit
e and
Black A
frican
Mixed -
Whit
e and
Asian
Asian o
r Asia
n Briti
sh - I
ndian
Asian o
r Asia
n Briti
sh - P
akist
ani
Asian o
r Asia
n Briti
sh - B
angla
desh
i
Black o
r Blac
k Briti
sh - B
lack C
aribb
ean
Black o
r Blac
k Briti
sh - B
lack A
frican
Chines
e or O
ther E
thnic
Group -
Chin
ese
LondonEngland
11 Level 4/5 equates to a first degree, higher degree, NVQ levels 4-5, HNC, HND, qualified teacher status, qualified medical doctor, qualified dentist, qualified nurse, midwife, health visitor or equivalents.
33

20.6% of London’s population of this age has the higher level of qualifications. Amongst the white Irish population, this increases to 26.7%. Only the ‘white other’ group (29.0%) and the Chinese population (28.8%) have higher levels of 16 to 24 years with levels 4 or 5. Figure 37. The proportion of the population with no qualifications
0%
10%
20%
30%
40%
50%
60%
70%
80%
16 - 24 25 - 34 35 -49 50 - 59 60 - 64 65 - 74
white Irish
white British
all
The chart above clearly indicates how the older generations have a larger proportion of people with no qualifications than the younger generations reflecting changes in education. Whereas 8.3% of 25 to 34 year old white Irish people had no qualifications, this rises to 68.1% of those aged between 65 and 74. This development is the same in the white British population and in the population of London as a whole. Interestingly, the proportion of the Irish population of London with no qualifications is lower than the population average up until the 35 to 49 age group. For Irish people older than this, a significantly higher proportion have no qualifications than is found in either the white British population or the population of London as a whole. This is most marked in the 50 to 59 age group in which 48.3% of white Irish people have no qualifications in comparison with 36.6% of white British people. Figure 38. The proportion of the population with qualifications at levels 4 or 5
0%
10%
20%
30%
40%
50%
60%
16 - 24 25 - 34 35 -49 50 - 59 60 - 64 65 - 74
white Irish
white British
all
With the exception of the 16 to 24 age group, many members of which may not have had time to reach higher levels of qualifications thus far, the general trend is downward as the older generations have fewer individuals with higher levels of qualifications. In the lower age groups, more of the white Irish population are achieving these higher levels of qualifications than the rest of the population of London. For example, 49.5% of the white Irish population aged between 25 and 34 have higher levels of qualifications in comparison with 46.1% of the white British population.
34

Hickman and Walter (1997)12 notice the trend for a high proportion of the Irish population to have high level qualifications and term it a ‘brain drain’ – a tendency for some migrants to be highly qualified. They also recognise the tendency for other migrants to be ‘on the other end of the scale’ and have no qualifications at all. They create a picture of two extremes. _____________________________________________________________________ In summary Hickman and Walter (ibid) found a dual picture of Irish people in Britain. A high proportion of Irish people with high level qualifications and a high proportion of people with no qualifications. However, in terms of the younger sections of the white Irish population (those in the age bands below 35 years of age), there is a relatively small proportion of people with no qualifications at all.
12 Hickman MJ and Walter B (1997) Discrimination and the Irish Community in Britain, The Commission for Racial Equality.
35
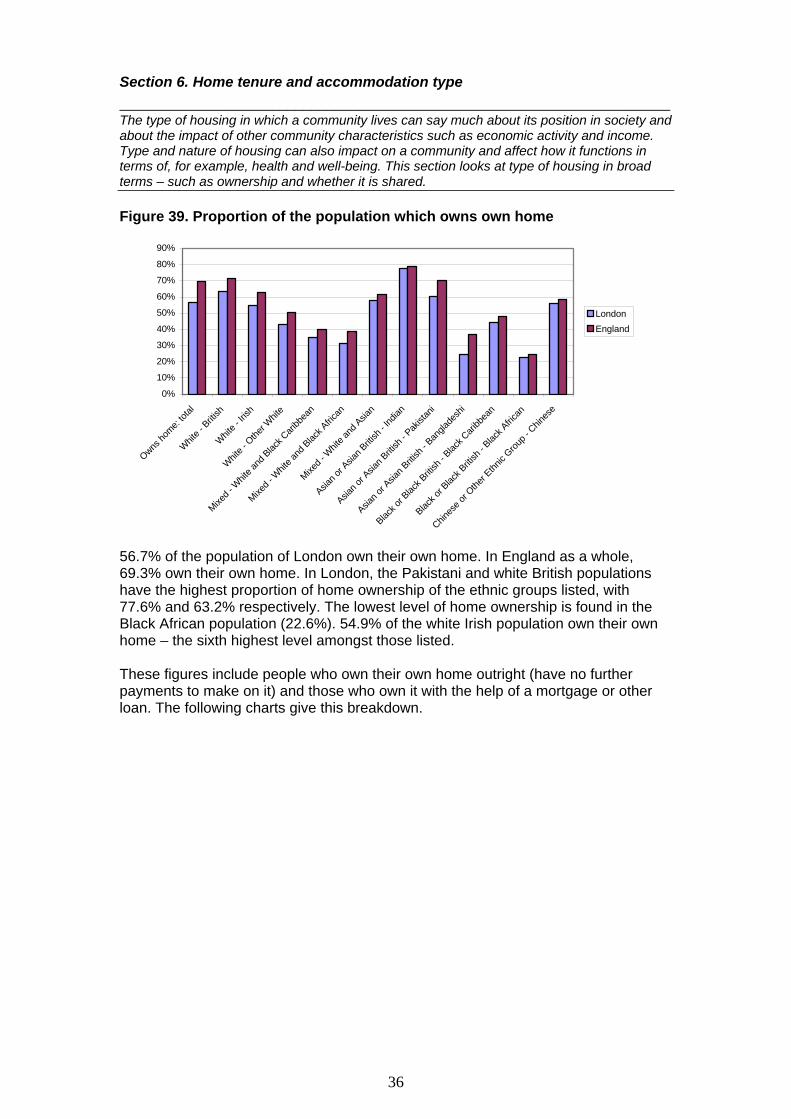
Section 6. Home tenure and accommodation type _____________________________________________________________________ The type of housing in which a community lives can say much about its position in society and about the impact of other community characteristics such as economic activity and income. Type and nature of housing can also impact on a community and affect how it functions in terms of, for example, health and well-being. This section looks at type of housing in broad terms – such as ownership and whether it is shared. Figure 39. Proportion of the population which owns own home
0%
10%
20%
30%
40%
50%
60%
70%
80%
90%
Owns ho
me: tot
al
White -
British
White -
Irish
White -
Othe
r Whit
e
Mixed -
Whit
e and
Black C
aribb
ean
Mixed -
Whit
e and
Black A
frican
Mixed -
Whit
e and
Asian
Asian o
r Asia
n Briti
sh - I
ndian
Asian o
r Asia
n Briti
sh - P
akist
ani
Asian o
r Asia
n Briti
sh - B
angla
desh
i
Black o
r Blac
k Briti
sh - B
lack C
aribb
ean
Black o
r Blac
k Briti
sh - B
lack A
frican
Chines
e or O
ther E
thnic
Group -
Chin
ese
LondonEngland
56.7% of the population of London own their own home. In England as a whole, 69.3% own their own home. In London, the Pakistani and white British populations have the highest proportion of home ownership of the ethnic groups listed, with 77.6% and 63.2% respectively. The lowest level of home ownership is found in the Black African population (22.6%). 54.9% of the white Irish population own their own home – the sixth highest level amongst those listed. These figures include people who own their own home outright (have no further payments to make on it) and those who own it with the help of a mortgage or other loan. The following charts give this breakdown.
36
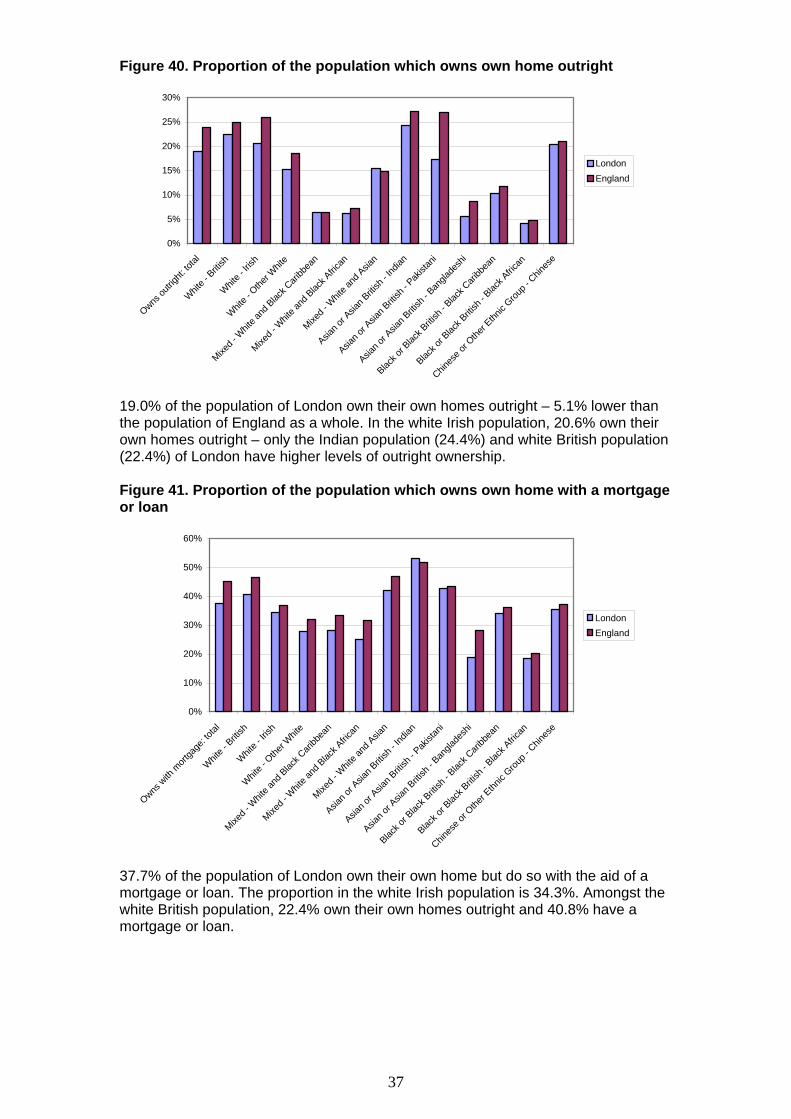
Figure 40. Proportion of the population which owns own home outright
0%
5%
10%
15%
20%
25%
30%
Owns ou
tright:
total
White -
British
White -
Irish
White -
Othe
r Whit
e
Mixed -
Whit
e and
Black C
aribb
ean
Mixed -
Whit
e and
Black A
frican
Mixed -
Whit
e and
Asian
Asian o
r Asia
n Briti
sh - I
ndian
Asian o
r Asia
n Briti
sh - P
akist
ani
Asian o
r Asia
n Briti
sh - B
angla
desh
i
Black o
r Blac
k Briti
sh - B
lack C
aribb
ean
Black o
r Blac
k Briti
sh - B
lack A
frican
Chines
e or O
ther E
thnic
Group -
Chin
ese
LondonEngland
19.0% of the population of London own their own homes outright – 5.1% lower than the population of England as a whole. In the white Irish population, 20.6% own their own homes outright – only the Indian population (24.4%) and white British population (22.4%) of London have higher levels of outright ownership. Figure 41. Proportion of the population which owns own home with a mortgage or loan
0%
10%
20%
30%
40%
50%
60%
Owns w
ith m
ortga
ge: to
tal
Whit
e - B
ritish
Whit
e - Iri
sh
Whit
e - O
ther W
hite
Mixed -
Whit
e and
Blac
k Cari
bbea
n
Mixed -
Whit
e and
Blac
k Afric
an
Mixed -
Whit
e and
Asia
n
Asian o
r Asia
n Briti
sh - I
ndian
Asian o
r Asia
n Briti
sh - P
akist
ani
Asian o
r Asia
n Briti
sh - B
angla
desh
i
Black o
r Blac
k Briti
sh - B
lack C
aribb
ean
Black o
r Blac
k Briti
sh - B
lack A
frican
Chines
e or O
ther E
thnic
Group -
Chin
ese
LondonEngland
37.7% of the population of London own their own home but do so with the aid of a mortgage or loan. The proportion in the white Irish population is 34.3%. Amongst the white British population, 22.4% own their own homes outright and 40.8% have a mortgage or loan.
37

Figure 42. Proportion of the population in social housing
0%
10%
20%
30%
40%
50%
60%
70%
Social
rent:
total
White -
British
White -
Irish
White -
Othe
r Whit
e
Mixed -
Whit
e and
Black C
aribb
ean
Mixed -
Whit
e and
Black A
frican
Mixed -
Whit
e and
Asian
Asian o
r Asia
n Briti
sh - I
ndian
Asian o
r Asia
n Briti
sh - P
akist
ani
Asian o
r Asia
n Briti
sh - B
angla
desh
i
Black o
r Blac
k Briti
sh - B
lack C
aribb
ean
Black o
r Blac
k Briti
sh - B
lack A
frican
Chines
e or O
ther E
thnic
Group -
Chin
ese
London
England
In London, 25.2% of the population is in social housing (including properties rented from the local council). This is a higher proportion than is found in England as a whole – 17.6% - and in all of the English regions. 27.1% of the white Irish population is in social housing. This proportion is higher than that of the white British population (21.4%) but significantly lower than some of the minority ethnic populations such as the Bangladeshi population in which 64.6% are in social housing. Figure 43. Proportion of the population in private rented accommodation
0%
5%
10%
15%
20%
25%
30%
35%
40%
Private
rente
d: tot
al
White -
British
White -
Irish
White -
Othe
r Whit
e
Mixed -
Whit
e and
Black C
aribb
ean
Mixed -
Whit
e and
Black A
frican
Mixed -
Whit
e and
Asian
Asian o
r Asia
n Briti
sh - I
ndian
Asian o
r Asia
n Briti
sh - P
akist
ani
Asian o
r Asia
n Briti
sh - B
angla
desh
i
Black o
r Blac
k Briti
sh - B
lack C
aribb
ean
Black o
r Blac
k Briti
sh - B
lack A
frican
Chines
e or O
ther E
thnic
Group -
Chin
ese
LondonEngland
14.2% of the white Irish population of London is in privately rented accommodation – as with social renting, the London levels of private renting are, in the general population, higher than in England as a whole (9.0%) and higher than in any of the other English regions. 13.7% of the white Irish population are in private rented accommodation which is higher than the proportion of the white British population (12.1%) but significantly lower than that in the other white population (33.8%).
38
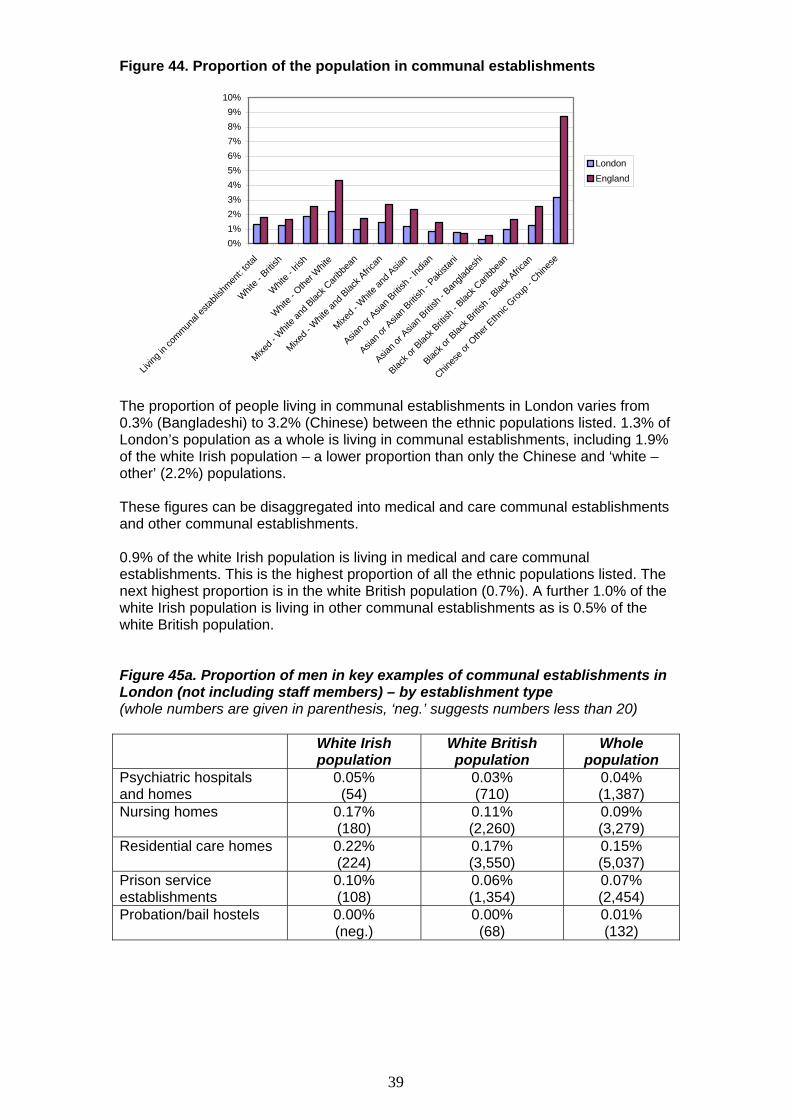
Figure 44. Proportion of the population in communal establishments
0%1%2%3%4%5%6%7%8%9%
10%
Living
in co
mmunal
estab
lishm
ent: t
otal
White -
British
White -
Irish
White -
Othe
r Whit
e
Mixed -
Whit
e and
Black C
aribb
ean
Mixed -
Whit
e and
Black A
frican
Mixed -
Whit
e and
Asian
Asian o
r Asia
n Briti
sh - I
ndian
Asian o
r Asia
n Briti
sh - P
akist
ani
Asian o
r Asia
n Briti
sh - B
angla
desh
i
Black o
r Blac
k Briti
sh - B
lack C
aribb
ean
Black o
r Blac
k Briti
sh - B
lack A
frican
Chines
e or O
ther E
thnic
Group -
Chin
ese
LondonEngland
The proportion of people living in communal establishments in London varies from 0.3% (Bangladeshi) to 3.2% (Chinese) between the ethnic populations listed. 1.3% of London’s population as a whole is living in communal establishments, including 1.9% of the white Irish population – a lower proportion than only the Chinese and ‘white – other’ (2.2%) populations. These figures can be disaggregated into medical and care communal establishments and other communal establishments. 0.9% of the white Irish population is living in medical and care communal establishments. This is the highest proportion of all the ethnic populations listed. The next highest proportion is in the white British population (0.7%). A further 1.0% of the white Irish population is living in other communal establishments as is 0.5% of the white British population. Figure 45a. Proportion of men in key examples of communal establishments in London (not including staff members) – by establishment type (whole numbers are given in parenthesis, ‘neg.’ suggests numbers less than 20) White Irish
population White British population
Whole population
Psychiatric hospitals and homes
0.05% (54)
0.03% (710)
0.04% (1,387)
Nursing homes 0.17% (180)
0.11% (2,260)
0.09% (3,279)
Residential care homes 0.22% (224)
0.17% (3,550)
0.15% (5,037)
Prison service establishments
0.10% (108)
0.06% (1,354)
0.07% (2,454)
Probation/bail hostels 0.00% (neg.)
0.00% (68)
0.01% (132)
39
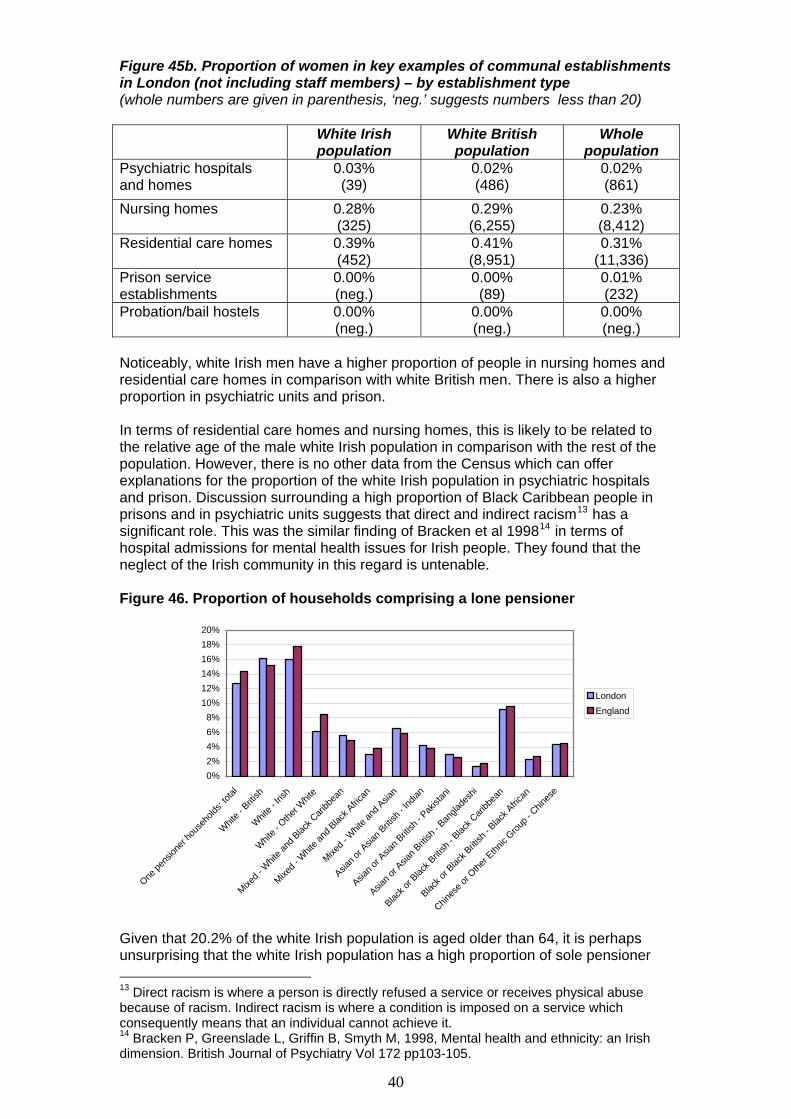
Figure 45b. Proportion of women in key examples of communal establishments in London (not including staff members) – by establishment type (whole numbers are given in parenthesis, ‘neg.’ suggests numbers less than 20) White Irish
population White British population
Whole population
Psychiatric hospitals and homes
0.03% (39)
0.02% (486)
0.02% (861)
Nursing homes 0.28% (325)
0.29% (6,255)
0.23% (8,412)
Residential care homes 0.39% (452)
0.41% (8,951)
0.31% (11,336)
Prison service establishments
0.00% (neg.)
0.00% (89)
0.01% (232)
Probation/bail hostels 0.00% (neg.)
0.00% (neg.)
0.00% (neg.)
Noticeably, white Irish men have a higher proportion of people in nursing homes and residential care homes in comparison with white British men. There is also a higher proportion in psychiatric units and prison. In terms of residential care homes and nursing homes, this is likely to be related to the relative age of the male white Irish population in comparison with the rest of the population. However, there is no other data from the Census which can offer explanations for the proportion of the white Irish population in psychiatric hospitals and prison. Discussion surrounding a high proportion of Black Caribbean people in prisons and in psychiatric units suggests that direct and indirect racism13 has a significant role. This was the similar finding of Bracken et al 199814 in terms of hospital admissions for mental health issues for Irish people. They found that the neglect of the Irish community in this regard is untenable. Figure 46. Proportion of households comprising a lone pensioner
0%2%4%6%8%
10%12%14%16%18%20%
One pe
nsion
er ho
useh
olds:
total
White -
British
White -
Irish
White -
Othe
r Whit
e
Mixed -
Whit
e and
Black C
aribb
ean
Mixed -
Whit
e and
Black A
frican
Mixed -
Whit
e and
Asian
Asian o
r Asia
n Briti
sh - I
ndian
Asian o
r Asia
n Briti
sh - P
akist
ani
Asian o
r Asia
n Briti
sh - B
angla
desh
i
Black o
r Blac
k Briti
sh - B
lack C
aribb
ean
Black o
r Blac
k Briti
sh - B
lack A
frican
Chines
e or O
ther E
thnic
Group -
Chin
ese
LondonEngland
Given that 20.2% of the white Irish population is aged older than 64, it is perhaps unsurprising that the white Irish population has a high proportion of sole pensioner 13 Direct racism is where a person is directly refused a service or receives physical abuse because of racism. Indirect racism is where a condition is imposed on a service which consequently means that an individual cannot achieve it. 14 Bracken P, Greenslade L, Griffin B, Smyth M, 1998, Mental health and ethnicity: an Irish dimension. British Journal of Psychiatry Vol 172 pp103-105.
40

households – 16.0%. However, 16.1% of the comparatively youthful (see figure 6) white British population is also living in sole pensioner households. This is the highest proportion of all the ethnic populations listed. Figure 47. Proportion of households with more than one related pensioner
0%
2%
4%
6%
8%
10%
12%
One fa
mily ho
useh
olds,
all pe
nsion
ers: to
tal
Whit
e - B
ritish
Whit
e - Iri
sh
Whit
e - O
ther W
hite
Mixed -
Whit
e and
Blac
k Cari
bbea
n
Mixed -
Whit
e and
Blac
k Afric
an
Mixed -
Whit
e and
Asia
n
Asian o
r Asia
n Briti
sh - I
ndian
Asian o
r Asia
n Briti
sh - P
akist
ani
Asian o
r Asia
n Briti
sh - B
angla
desh
i
Black o
r Blac
k Briti
sh - B
lack C
aribb
ean
Black o
r Blac
k Briti
sh - B
lack A
frican
Chines
e or O
ther E
thnic
Group -
Chin
ese
LondonEngland
Again, the proportion of households which comprise more than one related pensioner (say, a married couple) is relatively high in the white Irish population – 5.6%. In total, 21.6% of households in the white Irish population comprise solely of pensioners in comparison with 23.1% of the white British population and 18% of the population of London as a whole. This suggests that factors other than the size of the pensionable age population impacts on the proportion of households which are made up of no-one but pensioners. _____________________________________________________________________ In summary Housing can be very important in terms of a person’s health and well-being. The analysis of the relevant data in this section suggests that the white Irish population has a relatively high level of home ownership and, in comparison with the white British populations, a relatively high proportion of Irish people live in medical and care establishments including nursing homes, residential care homes, prison and psychiatric homes. There is a relatively high proportion of lone pensioner households in the white Irish population.
41
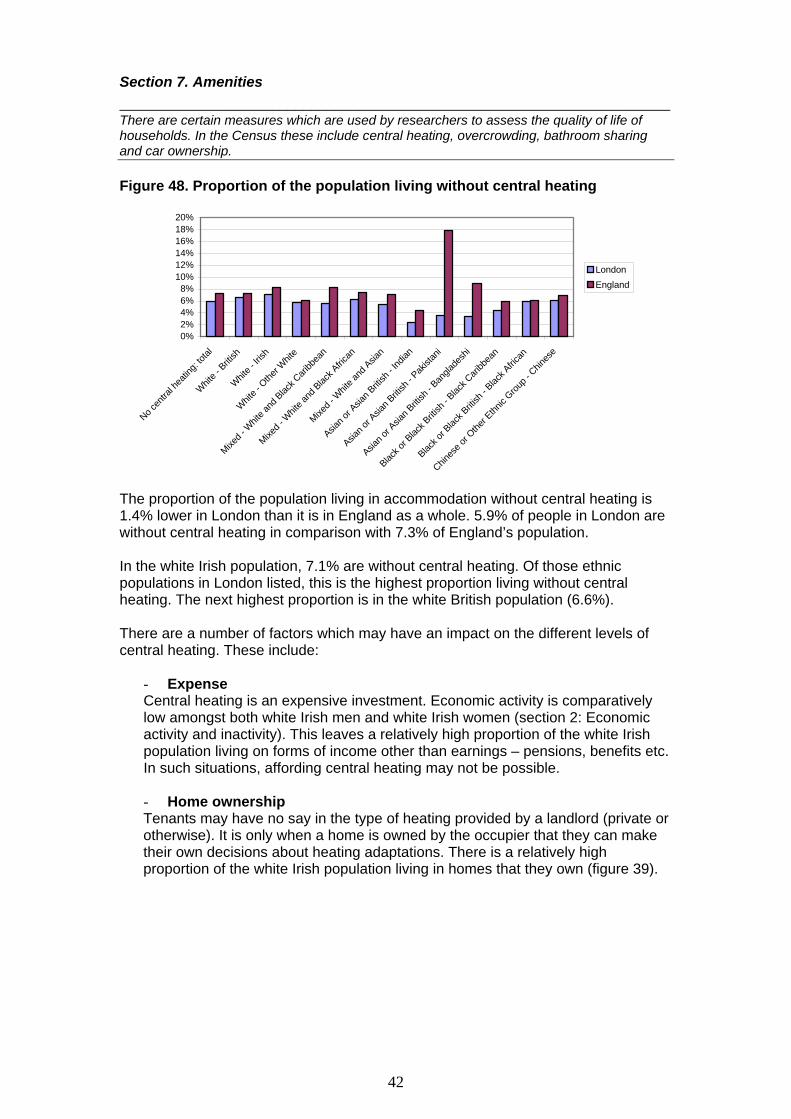
Section 7. Amenities _____________________________________________________________________ There are certain measures which are used by researchers to assess the quality of life of households. In the Census these include central heating, overcrowding, bathroom sharing and car ownership. Figure 48. Proportion of the population living without central heating
0%2%4%6%8%
10%12%14%16%18%20%
No cen
tral h
eatin
g: tot
al
White -
British
White -
Irish
White -
Othe
r Whit
e
Mixed -
Whit
e and
Black C
aribb
ean
Mixed -
Whit
e and
Black A
frican
Mixed -
Whit
e and
Asian
Asian o
r Asia
n Briti
sh - I
ndian
Asian o
r Asia
n Briti
sh - P
akist
ani
Asian o
r Asia
n Briti
sh - B
angla
desh
i
Black o
r Blac
k Briti
sh - B
lack C
aribb
ean
Black o
r Blac
k Briti
sh - B
lack A
frican
Chines
e or O
ther E
thnic
Group -
Chin
ese
LondonEngland
The proportion of the population living in accommodation without central heating is 1.4% lower in London than it is in England as a whole. 5.9% of people in London are without central heating in comparison with 7.3% of England’s population. In the white Irish population, 7.1% are without central heating. Of those ethnic populations in London listed, this is the highest proportion living without central heating. The next highest proportion is in the white British population (6.6%). There are a number of factors which may have an impact on the different levels of central heating. These include:
- Expense Central heating is an expensive investment. Economic activity is comparatively low amongst both white Irish men and white Irish women (section 2: Economic activity and inactivity). This leaves a relatively high proportion of the white Irish population living on forms of income other than earnings – pensions, benefits etc. In such situations, affording central heating may not be possible. - Home ownership Tenants may have no say in the type of heating provided by a landlord (private or otherwise). It is only when a home is owned by the occupier that they can make their own decisions about heating adaptations. There is a relatively high proportion of the white Irish population living in homes that they own (figure 39).
42

Figure 49. Proportion of population with an occupancy rating of –1 or less15
0%
10%
20%
30%
40%
50%
60%
70%
Total
White -
British
White -
Irish
White -
Othe
r Whit
e
Mixed -
Whit
e and
Black C
aribb
ean
Mixed -
Whit
e and
Black A
frican
Mixed -
Whit
e and
Asian
Asian o
r Asia
n Briti
sh - I
ndian
Asian o
r Asia
n Briti
sh - P
akist
ani
Asian o
r Asia
n Briti
sh - B
angla
desh
i
Black o
r Blac
k Briti
sh - B
lack C
aribb
ean
Black o
r Blac
k Briti
sh - B
lack A
frican
Chines
e or O
ther E
thnic
Group -
Chin
ese
LondonEngland
An occupancy rating of –1 or less suggests overcrowding. In London, 21.3% of the population are in accommodation with an occupancy rating of –1 or less, far higher than the proportion found in England as a whole (8.9%) and a higher proportion than is found in any of the English regions. In the white Irish population, 17.2% are living with an occupancy rating of –1 or less, in comparison with 12.4% of the white British population – the smallest proportion of all of the populations listed. Figure 50. Proportion of the population living in households without sole use of shower/bath and toilet
0.0%
0.2%
0.4%
0.6%
0.8%
1.0%
1.2%
1.4%
1.6%
Total
White -
British
White -
Irish
White -
Othe
r Whit
e
Mixed -
Whit
e and
Black C
aribb
ean
Mixed -
Whit
e and
Black A
frican
Mixed -
Whit
e and
Asian
Asian o
r Asia
n Briti
sh - I
ndian
Asian o
r Asia
n Briti
sh - P
akist
ani
Asian o
r Asia
n Briti
sh - B
angla
desh
i
Black o
r Blac
k Briti
sh - B
lack C
aribb
ean
Black o
r Blac
k Briti
sh - B
lack A
frican
Chines
e or O
ther E
thnic
Group -
Chin
ese
LondonEngland
In London, 0.5% of the population are without sole use of bathroom and toilet despite overcrowding. Again, as with overcrowding, this is a far higher proportion than is
15 The occupancy rating in the Census assumes that every household, including one-person households, requires a minimum of two common rooms (excluding bathrooms). An occupancy rating of –1 implies that there is one room too few and that there is thus overcrowding in the household.
43
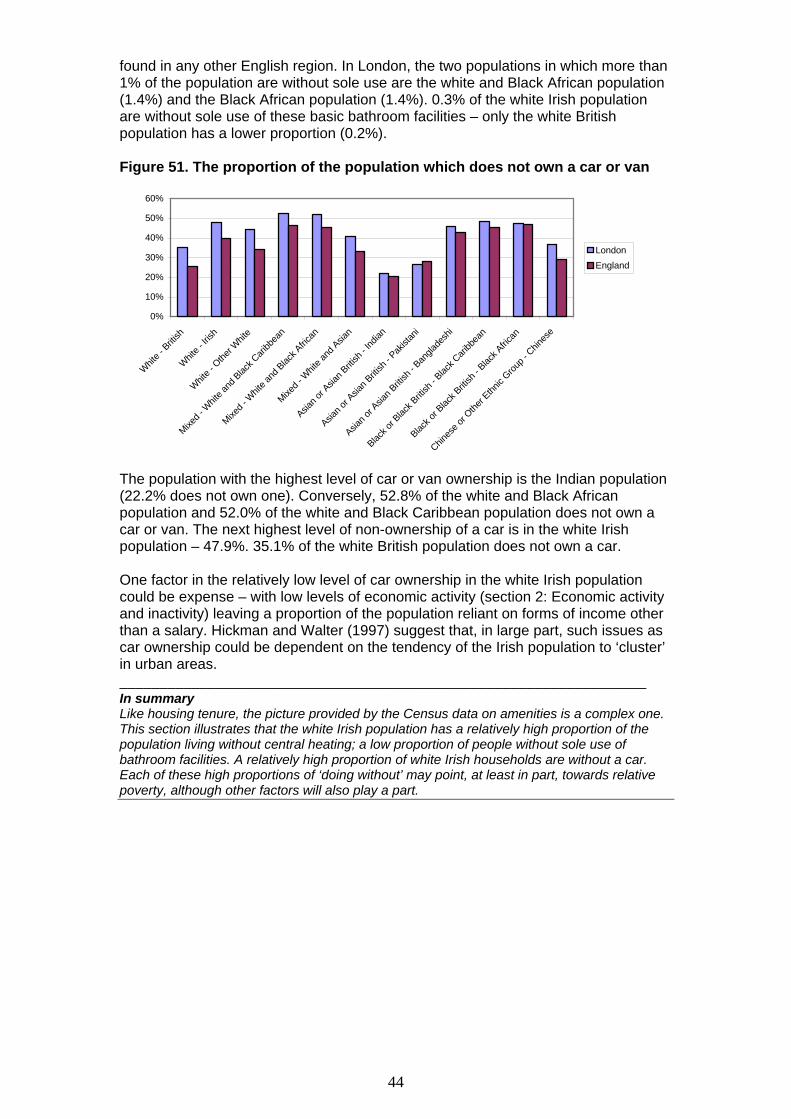
found in any other English region. In London, the two populations in which more than 1% of the population are without sole use are the white and Black African population (1.4%) and the Black African population (1.4%). 0.3% of the white Irish population are without sole use of these basic bathroom facilities – only the white British population has a lower proportion (0.2%). Figure 51. The proportion of the population which does not own a car or van
0%
10%
20%
30%
40%
50%
60%
White -
British
White -
Irish
White -
Othe
r Whit
e
Mixed -
Whit
e and
Black C
aribb
ean
Mixed -
Whit
e and
Black A
frican
Mixed -
Whit
e and
Asian
Asian o
r Asia
n Briti
sh - I
ndian
Asian o
r Asia
n Briti
sh - P
akist
ani
Asian o
r Asia
n Briti
sh - B
angla
desh
i
Black o
r Blac
k Briti
sh - B
lack C
aribb
ean
Black o
r Blac
k Briti
sh - B
lack A
frican
Chines
e or O
ther E
thnic
Group -
Chin
ese
LondonEngland
The population with the highest level of car or van ownership is the Indian population (22.2% does not own one). Conversely, 52.8% of the white and Black African population and 52.0% of the white and Black Caribbean population does not own a car or van. The next highest level of non-ownership of a car is in the white Irish population – 47.9%. 35.1% of the white British population does not own a car. One factor in the relatively low level of car ownership in the white Irish population could be expense – with low levels of economic activity (section 2: Economic activity and inactivity) leaving a proportion of the population reliant on forms of income other than a salary. Hickman and Walter (1997) suggest that, in large part, such issues as car ownership could be dependent on the tendency of the Irish population to ‘cluster’ in urban areas. __________________________________________________________________ In summary Like housing tenure, the picture provided by the Census data on amenities is a complex one. This section illustrates that the white Irish population has a relatively high proportion of the population living without central heating; a low proportion of people without sole use of bathroom facilities. A relatively high proportion of white Irish households are without a car. Each of these high proportions of ‘doing without’ may point, at least in part, towards relative poverty, although other factors will also play a part.
44

Section 8. Health _____________________________________________________________________ This section looks at the health of the population. This is not based on medical records or hospital admissions but on questions in the Census about how people rated their own health. There are two questions – whether people have limiting long-term illness and whether people feel themselves to be in good or poor health. Respondents were asked, in the Census form, whether they had ‘any long-term illness, health problem or disability which limits your daily activities or the work you can do’. The illnesses or disabilities that people were thinking of when answering this question must inevitably cover a very wide range of health issues including both physical and mental complaints. The key issue that the question presents is that of the long-lasting nature of the health issue or disability. The other question relating to people’s own analysis of their health, relates only to the previous twelve months. This is examined in figures 59 and 60 at the end of this section. The following figures look at the proportion of the population that said yes, they did have a limiting long-term illness. Figure 52. Proportion of 0 to 15 year old girls with limiting long-term illness
0%
1%
2%
3%
4%
5%
6%
Limitin
g lon
g-term
illne
ss: to
tal
Whit
e - B
ritish
Whit
e - Iri
sh
Whit
e - O
ther W
hite
Mixed -
Whit
e and
Blac
k Cari
bbea
n
Mixed -
Whit
e and
Blac
k Afric
an
Mixed -
Whit
e and
Asia
n
Asian o
r Asia
n Briti
sh - I
ndian
Asian o
r Asia
n Briti
sh - P
akist
ani
Asian o
r Asia
n Briti
sh - B
angla
desh
i
Black o
r Blac
k Briti
sh - B
lack C
aribb
ean
Black o
r Blac
k Briti
sh - B
lack A
frican
Chines
e or O
ther E
thnic
Group -
Chin
ese
LondonEngland
In the general London population, 3.6% of girls aged less than 16 have a limiting long-term illness or disability. 3.9% of white Irish girls have limiting long-term illness. Four of the populations illustrated in the figure above have higher proportions affected – white and Black Caribbean (5.2%), Black Caribbean (4.7%), Pakistani (4.5%) and Bangladeshi (4.1%).
45

Figure 53. Proportion of 0 to 15 year old boys with limiting long-term illness
0%
1%
2%
3%
4%
5%
6%
7%
Limitin
g lon
g-term
illnes
s: tot
al
White -
British
White -
Irish
White -
Othe
r Whit
e
Mixed -
Whit
e and
Black C
aribb
ean
Mixed -
Whit
e and
Black A
frican
Mixed -
Whit
e and
Asian
Asian o
r Asia
n Briti
sh - I
ndian
Asian o
r Asia
n Briti
sh - P
akist
ani
Asian o
r Asia
n Briti
sh - B
angla
desh
i
Black o
r Blac
k Briti
sh - B
lack C
aribb
ean
Black o
r Blac
k Briti
sh - B
lack A
frican
Chines
e or O
ther E
thnic
Group -
Chin
ese
LondonEngland
Levels of limiting long-term illness are generally higher amongst boys aged 0 to 15 than amongst girls – 4.8% and 3.6% respectively. For London’s white Irish population, the incidence is 5.2% - a similarly high proportion relative to the other ethnic populations, as is found amongst girls of the same age. As with the boys, the highest proportions are found in the white and Black Caribbean and Black Caribbean populations. Figure 54. Proportion of 16 to 49 year old women with limiting long-term illness
0.0%
0.5%
1.0%
1.5%
2.0%
2.5%
Limitin
g lon
g-term
illne
ss: to
tal
Whit
e - B
ritish
Whit
e - Iri
sh
Whit
e - O
ther W
hite
Mixed -
Whit
e and
Blac
k Cari
bbea
n
Mixed -
Whit
e and
Blac
k Afric
an
Mixed -
Whit
e and
Asia
n
Asian o
r Asia
n Briti
sh - I
ndian
Asian o
r Asia
n Briti
sh - P
akist
ani
Asian o
r Asia
n Briti
sh - B
angla
desh
i
Black o
r Blac
k Briti
sh - B
lack C
aribb
ean
Black o
r Blac
k Briti
sh - B
lack A
frican
Chines
e or O
ther E
thnic
Group -
Chin
ese
LondonEngland
1.2% of women in the general population in London aged between 16 and 49 have a limiting long-term illness. In the white Irish population, the proportion is also 1.2% as it is in the white British population. Highest levels of limiting long-term illness are amongst Pakistani women (1.8%). The three populations with lower levels than in the white Irish population are Indian women, Black African women and Chinese women.
46

Figure 55. Proportion of 16 to 49 year old men with limiting long-term illness
0%
2%
4%
6%
8%
10%
12%
14%
Limitin
g lon
g-term
illnes
s: tot
al
White -
British
White -
Irish
White -
Othe
r Whit
e
Mixed -
Whit
e and
Black C
aribb
ean
Mixed -
Whit
e and
Black A
frican
Mixed -
Whit
e and
Asian
Asian o
r Asia
n Briti
sh - I
ndian
Asian o
r Asia
n Briti
sh - P
akist
ani
Asian o
r Asia
n Briti
sh - B
angla
desh
i
Black o
r Blac
k Briti
sh - B
lack C
aribb
ean
Black o
r Blac
k Briti
sh - B
lack A
frican
Chines
e or O
ther E
thnic
Group -
Chin
ese
LondonEngland
Amongst men in this middle age group, limiting long-term illness rises significantly, from 1.2% of London’s female population to 8.7% of London’s male population. Amongst the white Irish population, the percentage rises to 12.0%. The only group with a higher proportion is the white and Black Caribbean men with 12.6%. Figure 56. Proportion of 50 to 64 year old women with limiting long-term illness
0%
10%
20%
30%
40%
50%
60%
Limitin
g lon
g-term
illnes
s: tot
al
White -
British
White -
Irish
White -
Othe
r Whit
e
Mixed -
Whit
e and
Black C
aribb
ean
Mixed -
Whit
e and
Black A
frican
Mixed -
Whit
e and
Asian
Asian o
r Asia
n Briti
sh - I
ndian
Asian o
r Asia
n Briti
sh - P
akist
ani
Asian o
r Asia
n Briti
sh - B
angla
desh
i
Black o
r Blac
k Briti
sh - B
lack C
aribb
ean
Black o
r Blac
k Briti
sh - B
lack A
frican
Chines
e or O
ther E
thnic
Group -
Chin
ese
LondonEngland
27.2% of the female older population of London has a limiting long-term illness – a proportion 1.4% higher than in England as a whole. The white Irish population has a level of 29.7% - on a par with the mixed white and Asian population (30.1%). 24.3% of white British women in this age group have limiting long-term illness.
47
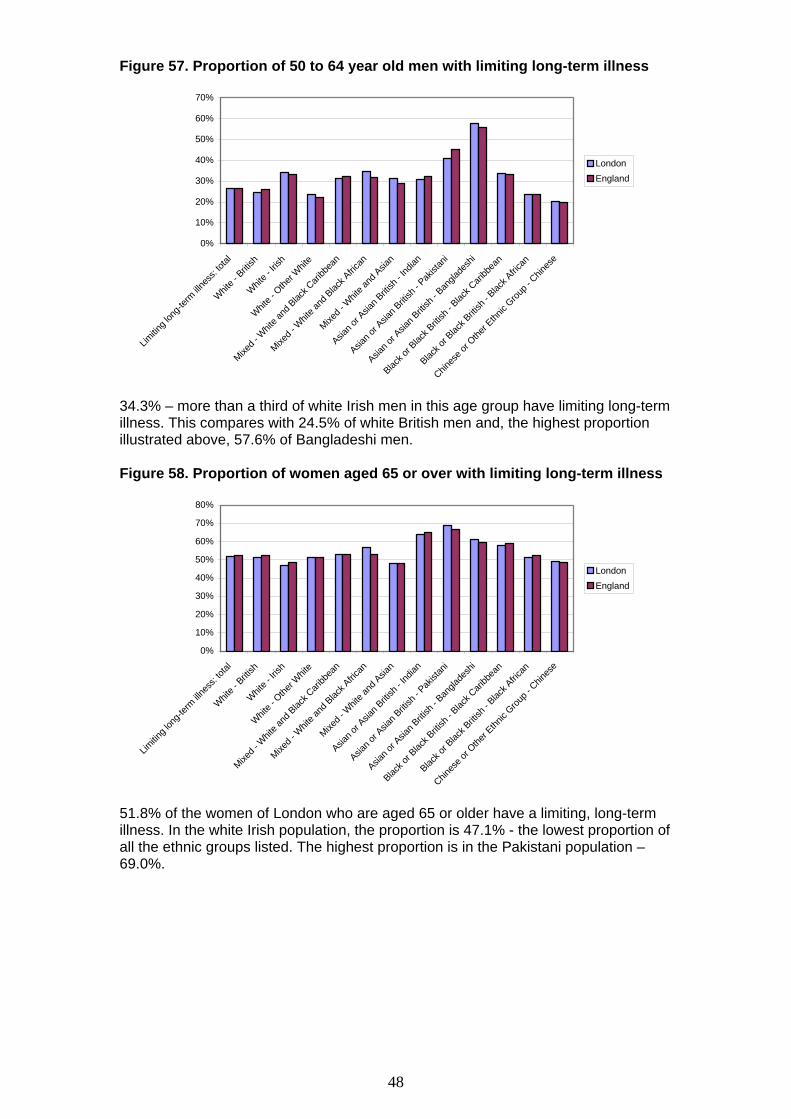
Figure 57. Proportion of 50 to 64 year old men with limiting long-term illness
0%
10%
20%
30%
40%
50%
60%
70%
Limitin
g lon
g-term
illnes
s: tot
al
White -
British
White -
Irish
White -
Othe
r Whit
e
Mixed -
Whit
e and
Black C
aribb
ean
Mixed -
Whit
e and
Black A
frican
Mixed -
Whit
e and
Asian
Asian o
r Asia
n Briti
sh - I
ndian
Asian o
r Asia
n Briti
sh - P
akist
ani
Asian o
r Asia
n Briti
sh - B
angla
desh
i
Black o
r Blac
k Briti
sh - B
lack C
aribb
ean
Black o
r Blac
k Briti
sh - B
lack A
frican
Chines
e or O
ther E
thnic
Group -
Chin
ese
LondonEngland
34.3% – more than a third of white Irish men in this age group have limiting long-term illness. This compares with 24.5% of white British men and, the highest proportion illustrated above, 57.6% of Bangladeshi men. Figure 58. Proportion of women aged 65 or over with limiting long-term illness
0%
10%
20%
30%
40%
50%
60%
70%
80%
Limitin
g lon
g-term
illnes
s: tot
al
White -
British
White -
Irish
White -
Othe
r Whit
e
Mixed -
Whit
e and
Black C
aribb
ean
Mixed -
Whit
e and
Black A
frican
Mixed -
Whit
e and
Asian
Asian o
r Asia
n Briti
sh - I
ndian
Asian o
r Asia
n Briti
sh - P
akist
ani
Asian o
r Asia
n Briti
sh - B
angla
desh
i
Black o
r Blac
k Briti
sh - B
lack C
aribb
ean
Black o
r Blac
k Briti
sh - B
lack A
frican
Chines
e or O
ther E
thnic
Group -
Chin
ese
LondonEngland
51.8% of the women of London who are aged 65 or older have a limiting, long-term illness. In the white Irish population, the proportion is 47.1% - the lowest proportion of all the ethnic groups listed. The highest proportion is in the Pakistani population – 69.0%.
48

Figure 59. Proportion of men aged 65 or over with limiting long-term illness
0%
10%
20%
30%
40%
50%
60%
70%
Limitin
g lon
g-term
illnes
s: tot
al
White -
British
White -
Irish
White -
Othe
r Whit
e
Mixed -
Whit
e and
Black C
aribb
ean
Mixed -
Whit
e and
Black A
frican
Mixed -
Whit
e and
Asian
Asian o
r Asia
n Briti
sh - I
ndian
Asian o
r Asia
n Briti
sh - P
akist
ani
Asian o
r Asia
n Briti
sh - B
angla
desh
i
Black o
r Blac
k Briti
sh - B
lack C
aribb
ean
Black o
r Blac
k Briti
sh - B
lack A
frican
Chines
e or O
ther E
thnic
Group -
Chin
ese
LondonEngland
Amongst men in London aged 65 or more, 47.5% have a limiting long term illness – including 47.8% of the white Irish population and 47% of the white British population. The highest proportion is found, as with the women of the same age, in the Bangladeshi population in which 66.5% have limiting long-term illness. Overall, 15.5% of the population of all ages and both genders in London, has a limiting long-term illness in comparison with 17.9% of the population of England as a whole. The white Irish population is the ethnic group, of those listed, with the highest level – 22.9%. The ethnic group with the next highest level is the white British population (17.1%). The high proportion amongst the white Irish population, when looking at it over all ages and genders, lies largely in the large proportion of the population who are aged 65 and over (20.2%), where limiting long-term illnesses are more common, regardless of ethnic group. On the subject of health, the Census form also asked people if, over the previous 12 months, respondents would say that their health had been good, fairly good or not good. As health can fluctuate in a 12 month period, it is the responsibility of the respondent to find some form of average or overall feeling of health which may, of course, be affected by how the respondent was feeling, health-wise, at the time of completing the Census form. For under 16 year olds, it may be that parents are completing their Census details on their behalf which means that the health rating is likely to be the parent’s assessment rather than the child’s own assessment. The following two figures look at those respondents who rated their health as being not good.
49

Figure 60. Proportion of women in the region who rated their health as being not good
0%
5%
10%
15%
20%
25%
30%
0 - 15 16 - 49 50 - 64 65 +
white Irishwhite BritishAll
It is clear from the data that being in ‘not good health’ increases with age as we would expect. What is interesting is that there is greater experience of being in not good health amongst white Irish women between the ages of 16 and 64 – working age. 25.3% of white Irish women and 19.2% of white British women aged between16 and 64 are not in good health. Figure 61. Proportion of men in the region who rated their health as being not good
0%
5%
10%
15%
20%
25%
30%
0 - 15 16 - 49 50 - 64 65 +
white Irishwhite BritishAll
Amongst the men of London, the disparity between the experience of the white Irish population and that of the white British population is greater. 30.7% of white Irish men aged between 16 and 64 are not in good health. This compares with 19.1% of white British men. Unlike the women, however, significant disparity amongst men continues into the 65 and older age group. 25.1% of white Irish men in this age group rated their health as being not good in comparison with 21.6% of white British men. The health of a population is a complex issue with many inter-linked factors at play. Relatively high rates of long-term illness amongst Irish people are discussed at some length by Hickman and Walter (1997) as well as other commentators. What is clear is that there is no single answer to the matter of why there are relatively high levels of ill-health (and mortality) amongst Irish populations. The following are some of those factors which could be at play:
50

Poverty and housing As established earlier in this report, the white Irish population has a comparatively low level of economic activity (section 2: Economic activity and inactivity) which implies reliance on other forms of income such as pensions and benefits. Likewise a relatively high proportion of the white Irish population is living in social housing (figure 42). Both of these factors may have an impact on the health of individuals. Socio-economic status As well as practical issues related to class, people of lower social classes may also view their own health differently bringing about reporting differences. Changes brought about by the act of migration Living in a rural setting in Ireland and moving to an inner-city area of Birmingham, for example, can represent a significant change in a person’s life which may impact on their health. Negative experiences of host country and racism Many commentators have documented racism and discrimination experienced by Irish people in England both in the past and currently. Lifestyle factors The links between excessive alcohol consumption, smoking and poor diet and poor health are now clearly established and need to be taken into consideration when looking at any population experiencing poor health. Genetics In any discussion of health, genetics may play a factor. Certain illnesses (e.g. cancers) have strong genetic components. In a single community of people this may impact on the incidence of those illnesses. Occupation It has been established that a relatively high proportion of white Irish men work in construction (figure 21) and an even higher proportion of white Irish women work in health and social care (figure 22). While the Census data does not indicate the type of work undertaken in these broad fields, we know that construction includes many roles which are dangerous or cause ill-health and that many roles in health and social care involve long, anti-social hours, lifting and stress. _____________________________________________________________________ In summary The data in this section suggests that health is a particular issue for white Irish people in the region. This relates particularly to white Irish men of working age who are experiencing relatively high levels of limiting long-term illness. It also relates to men and women of working age who rate their own health as being not good.
51
FIS exists to represent and develop our members and our community

This report, one of a suite of twenty four, is an outcome of a research project on the Irish data in the 2001 Census. The data and commentaries in the suite of reports are presented in a comparative context at national, regional and selected local levels, and on the basis of the full sixteen categories from the 2001 Census Ethnic Group Question.
... there are sections of the Irish population who have multiple needs, are marginalised, and have information, support and service needs ... to be addressed.
We have been disappointed by the structuring of much of the analysis of ethnicity data from the 2001 Census published todate, particularly the use of various “combined ethnic group categories” and the failure to disaggregate the White ”combined group” data. Increasingly, micro-decisions about delivery of services take place at a local level. ... Those with local responsibility under the Race Relations Acts for addressing inequalities must have the best possible local data on all significant communities (including minority ethnic communities) at their disposal, and must use it in an inclusive way to inform their policies. Dr Mary Tilki Chair, Federation of Irish Societies
London Office95 White Lion StreetLondon N1 9PFTel 020 7833 1226Fax 020 7833 [email protected]
Birmingham Office: Suite 211, Keys Court82-84 Moseley StreetBirmingham B12 ORTTel 0121 622 4169Fax 0121 622 5613
Manchester Office:EMF House12 Charlotte StreetManchester M1 4FLTel 0161 245 3221Fax 0161 245 3315
Price £5.00