london: digital city on the rise
TRANSCRIPT

XIIXI
X II
I
VI V
IVVIII VII
IIIIX
LONDON: DIGITAL CITY ON THE RISE
DR. MICHAEL MANDELSOUTH MOUNTAIN ECONOMICS
DR. JONATHAN LIEBENAULONDON SCHOOL OF ECONOMICS
JUNE 2014
SOUTH MOUNTAIN ECONOMICSExpertise in emerging occupations and emerging industrieswww.southmountaineconomics.com
Research underwritten BY BLOOMBERG PHILANTHROPIES

1
London has always been one of the leading knowledge cities in the world. Its streets and offi ces are fi lled with skilled and accomplished academics, consultants, lawyers, engineers, editors, designers, marketing and advertising experts, producers, and writers.
But in recent years, something new has been happening in London. As more and more knowledge becomes digital, the city’s deep base of professional expertise has helped fuel a thriving urban tech scene in the East End, Soho, and areas across the city. Increasing numbers of tech start-ups are receiving na-tional and international attention, and tech giants such as Google and Facebook have been bolstering their presence in London.
London’s rise as a major tech hub is an example of the broader global phenomenon of digital cities. While the high technology and programming sector had previously been located in sprawling suburban offi ce parks and corporate campuses, start-ups and estab-lished tech fi rms alike are now being drawn to urban cores. This pattern has been demonstrated strongly in San Francisco and New York—where tech fi rms bene-fi ted from proximity to existing industry clusters, talent streams, and venture capital—and a similar pattern has been unfolding in London.1
Good policy has helped as well: Since taking offi ce in 2008, the local and national governments have used a variety of policy measures to attract existing tech businesses and encourage start-ups, building on Lon-don’s world-class strengths in fi nance, advertising, and media. The latest initiatives aim to expand the existing areas of tech growth eastward and north, based in part on long-term investments in transportation. In March 2014, Mayor Boris Johnson of London outlined a bold vision: to make London the tech capital of the world. For a city founded more than 2000 years ago, that’s a striking goal.2
To reach that goal, London will have to address issues—many of which are found in other digital cities. These include the availability of capital, the sustain-ability of the talent pipeline, the rising cost of real estate, and the presence of affordable, fl exible, and scalable infrastructure needed to support the growth of start-ups. If these challenges are met, London’s
tech sector can become a powerful engine for broader and more robust economic growth in London, the United Kingdom, and the rest of Europe—creating large, multinational tech companies as well as hun-dreds of other enterprises.
In this study, we develop a unique framework to study the impact of London’s tech/information (tech/info) sector on the city’s economy, and to benchmark London’s performance against other global digital cities such as New York and San Francisco. As in previous studies, we use the term “tech/info” rather than simply “tech” to emphasize the changing nature of the tech industry. It used to be that tech, telecom, and content companies were effectively in separate industries. Today, convergence rules, and these indus-tries share a common tech-savvy workforce and often overlapping goals.
London’s tech/info sector is exceedingly diverse, drawing companies and workers from across the globe. The tech/info sector includes tech start-ups such as Swiftkey; WorldRemit, an online money transfer service that recently received $40 million in venture capital funding; and WireWax, a video tagging company which has its headquarters in London and an offi ce in New York City. It includes established tech companies such as Google and Facebook; a large number of computer consultants and app developer fi rms such as Milo and The App Business; and media companies such as Reuters, Economist Group, Pear-son, and News Corporation.
In this study, we also examine a wider set of indus-tries that interact closely with the tech/info sector. This includes the knowledge industries that provide the environment for London’s success as a tech mecca, ranging from consulting to advertising, accounting, and scientifi c research. This is referred to as the “expanded tech/info sector.”
EXECUTIVE SUMMARY

2
Some key fi ndings:
> There are 382,000 workers in London’s tech/info sector—an increase of 11 percent since 2009.
> The growth of London’s tech/info sector from 2009 to 2013 was more than triple the previous four years.
> London’s expanded tech/info sector—including tech, information, professional, and scientifi c industries—has increased by 15 percent since 2009, compared to an increase of only 8 percent for the rest of the London economy.
> Overall, the expanded tech/info sector has ac-counted for 30 percent of total London job gains since 2009.
> Collectively, the tech/info sector in London plus the East and Southeast regions, including Ox-ford and Cambridge, has roughly 744,000 tech/info workers, up by 76,000 since 2009. That’s slightly larger than California’s tech/info sector (692,000). What’s more, the tech/info sector in the combined London-East-Southeast region is growing faster than California, even taking into account the rapid growth of San Francisco.
> London is a major hub for big data. There are an estimated 54,000 big data workers within 25 miles of London, compared to 57,000 for New York City and 98,000 for San Francis-co-Silicon Valley.
> London is the world leader in fi nancial technol-ogy (fi ntech). There are an estimated 44,000 fi ntech workers within 25 miles of London, com-pared to 43,000 for New York and only 11,000 for San Francisco-Silicon Valley.
> London’s share of the combined US-UK tech/info sector has been rising over time, from 5.8 percent in 2000 to 6.8 percent in 2013.
> Taken together, London, New York City, and San Francisco accounted for 41 percent of the job growth in the combined US-UK tech info sector between 2009 and 2013.
3
As one of the great fi nancial centers of the world, London was signifi cantly affected by the fi nancial crisis, with the fi nancial services industry losing 8 percent of its jobs in only 12 months. Three years later, the London labor market has generated an almost 9 percent increase in employment in 2012 and 2013, far outperforming the less than 1 percent gain forecast in 2012 for that period.
Driving this has been London’s rise as a major tech hub, which in turn, is an example of a broader global phenomenon of “digital cities.” While the high technol-ogy and programming sector had previously been lo-cated in sprawling suburban offi ce parks and corporate campuses, start-ups and established tech fi rms alike are now being drawn to urban cores. This pattern has been demonstrated strongly in San Francisco and New York—where tech fi rms benefi ted from proximity to existing industry clusters, talent streams, and venture capital—and a similar pattern has been unfolding in London. Moreover, London has built on its long-time strength as a globally-connected trading city, with a very strong higher-education and creative base.
Good policy has helped as well. While fi nance is still a major economic driver in London, tech is gaining ground. This is in part because of imaginative policies adopted by the national government and the London Mayor’s offi ce, such as the 2010 Tech City initia-tive from Prime Minister David Cameron and Mayor Johnson. Other initiatives include a program to boost computer science teaching in the London schools and support for businesses taking on technology appren-ticeships. A long-term infrastructure investment plan aims to expand the existing areas of tech growth eastward and north, based in part on long-term in-vestments in transportation, including the upgrading of London Overground and CrossRail, in conjunction with an Act of Parliament.
These policies have been remarkably effective in maintaining the spotlight on London tech businesses and bolstering the feeling of excitement, creativity and productivity that characterizes the community. While estimates of the number of foreign tech workers in London are unreliable, the presence of many German, French, Italian and other European technologists and entrepreneurs is evident, drawn by the relative ease of creating and building innovative businesses.
Still, there is a lot more room for London’s tech sec-tor to grow. London has yet to produce a home-grown, multinational tech giant on the scale of Yahoo or Twit-ter. In addition, London still attracts less venture capital than New York or San Francisco, and while ‘Tech City London’ has gotten some attention, London’s tech sec-tor has yet to fully build its global identity and brand.
To help chart its future, it is important to note what has been accomplished, and the London tech sector has become an important part of the regional and national economy. The purpose of this study is to measure London’s tech/info sector and tech workforce in a global context with a specifi c focus on the jobs it creates. First, this study will examine the impact of the tech/info sector on London’s overall job growth. We will show how London is getting a growing share of the tech/info jobs in the combined Anglo-American economy, and compare London’s tech/info sector to that of two U.S digital cities, New York City and San Francisco. We will drill down and analyse two important parts of London’s tech boom: fi ntech and big data. Fi-nally, we will outline and compare the policies that have helped London thrive as a global digital city.
INTRODUCTION

4
UNDERSTANDING LONDON’S TECH/INFO SECTOROver the past 40 years, the way that people defi ne “tech” has repeatedly changed. In the mid-1970s, tech was about manufacturing: the pre-eminent global tech company was IBM, then mainly a computer manufac-turer, and the UK tech sector was primarily comprised of an army of electronics manufacturers employing almost 400,000 workers. With the advent of the per-sonal computer, the defi nition of tech expanded in the 1980s to include software and semiconductors. The pre-eminent global tech companies were Microsoft and Intel, and computer programmers became an essential part of the UK workforce.
In the 1990s and the 2000s, the defi nition of tech broadened again to include Internet companies such as AOL and Yahoo, and later Google. Electronics manufacturing continued to shrink in importance in the UK, while employment in new professions such as web developer and network technician soared.
Finally, in recent years, the defi nition of tech has morphed again to become tech/info.3 Tech companies now focus on content and interconnectivity, which after all are the great strengths of dense and well-connect-ed global cities such as London and New York. In this world, the key to success becomes the combination of tech skills with deep knowledge of complementary sectors in which technology is being used; these areas include: fashion, design, fi nance, advertising, entertain-ment, media, education, and health.
This study’s focus is the “tech/info” sector in order to capture the convergence between tech, content, and interconnectivity. As defi ned in this study, the tech/info sector includes such companies as: software, comput-er programming, app developers, telecom companies, companies providing Internet services, big data com-panies, fi rms that are building technology platforms for fi nancial services, and video and music start-ups.
Specifi cally, the term encompasses companies such as Workshare, a London-headquartered fi rm that will securely store and share corporate documents and as of early June 2014 had job openings for sales, devel-opers, and customer support; Hyperoptic, a company installing fi ber optic networks in the UK; Shazam, which makes an app that identifi es music and TV; Metapack, a company that does “delivery intelligence;” and NewVoiceMedia, which offers cloud contact ser-
vices. The tech/info sector also includes the London offi ces of Skype, Google and Facebook; the head-quarters of BT (British Telecom), a major broadband provider; and the London offi ces of the BBC and the Financial Times, media companies rapidly utilizing new technologies and being disrupted by them.
5
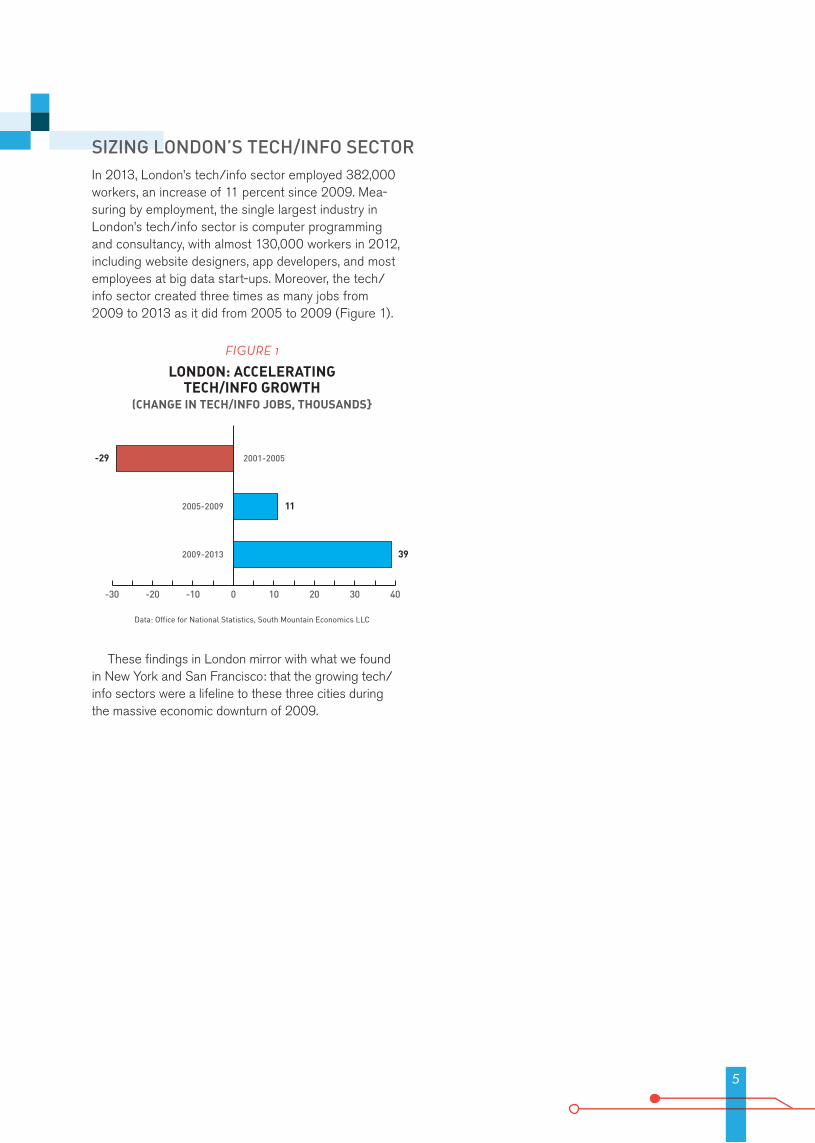
In 2013, London’s tech/info sector employed 382,000 workers, an increase of 11 percent since 2009. Mea-suring by employment, the single largest industry in London’s tech/info sector is computer programming and consultancy, with almost 130,000 workers in 2012, including website designers, app developers, and most employees at big data start-ups. Moreover, the tech/info sector created three times as many jobs from 2009 to 2013 as it did from 2005 to 2009 (Figure 1).
These fi ndings in London mirror with what we found in New York and San Francisco: that the growing tech/info sectors were a lifeline to these three cities during the massive economic downturn of 2009.
SIZING LONDON’S TECH/INFO SECTOR
LONDON: ACCELERATING TECH/INFO GROWTH
(CHANGE IN TECH/INFO JOBS, THOUSANDS}
Data: Offi ce for National Statistics, South Mountain Economics LLC
FIGURE 1
-30 -20 -10 0 10 20 30 40
2001-2005
2005-2009
2009-2013
11
39
-29

6
In a global economy, it’s not suffi cient to measure how a city like London compares with the rest of the United Kingdom. Another good indicator is the strength of London against the combined tech/info sector of the United Kingdom and the acknowledged global leader in tech, the United States. Figure 2 shows that London accounts for a steadily rising share of the combined Anglo-American tech/info employment, going from 5.8 percent in 2000 to 6.8 percent in 2013. In other words, London is performing well on the global stage.
Taken together, London, New York, and San Fran-cisco account for an amazing share of total tech/info growth. From 2009 to 2013, London, New York City, and San Francisco added 89, 000 tech/info jobs, collectively adding up to about 42 percent of tech/info job creation in the U.S. and the U.K.
HOW LONDON COMPARES TO OTHER DIGITAL CITIES
GLOBAL DIGITAL CITY: LONDON GAINS GROUND(LONDON TECH/INFO JOBS AS SHARE OF
COMBINED US-UK TECH/INFO JOBS*)
*Tech/info employment as defi ned in appendix. Includes self-employedData: Offi ce for National Statistics, Bureau of Labor statistics,
South Mountain Economics LLC
FIGURE 2
5%
6%
7%
8%
2002
2004
2000
2006
2008
2010
2012
LONDON
7
The December 2013 Tech City third anniversary report included a wide variety of professional and technical industries in their statistical estimates of the London tech economy, such as architecture, engineering, pub-lic relations, market research, advertising and design fi rms.4 Following their lead, this section examines what we call the “expanded tech/info sector,” which includes the tech/info sector plus the city’s professional, scien-tifi c, and technical industries.
This grouping acknowledges that the boundaries between tech and other knowledge-based indus-tries are increasingly porous. Indeed, London’s tech start-ups draw on a deep pool of local expertise from knowledge-based industries such as consulting, accounting, scientifi c research, and advertising. As knowledge increasingly becomes digital, professionals fi nd themselves spending more and more time online, and their fi rms are increasingly investing in developing tech expertise. For example, the big accounting fi rms in London are always hiring large numbers of tech workers, with fi rms such as Deloitte boasting about their UK strength in data analytics.
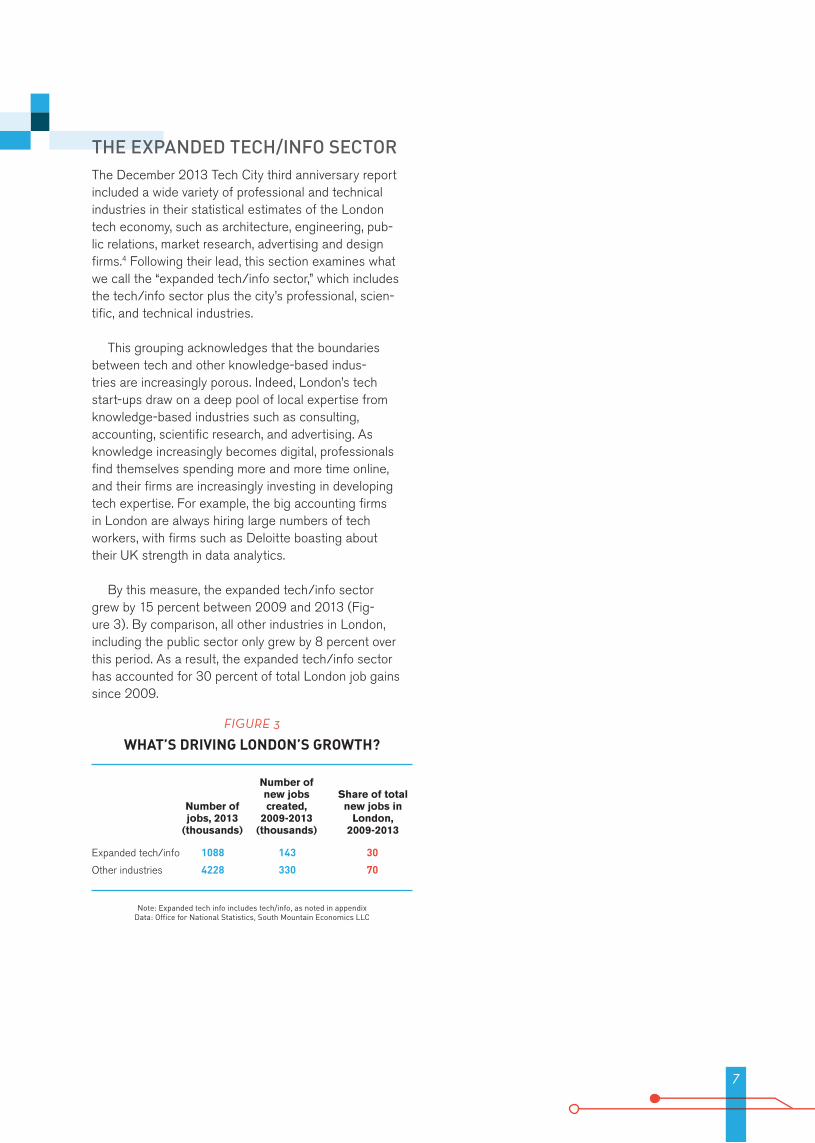
By this measure, the expanded tech/info sector grew by 15 percent between 2009 and 2013 (Fig-ure 3). By comparison, all other industries in London, including the public sector only grew by 8 percent over this period. As a result, the expanded tech/info sector has accounted for 30 percent of total London job gains since 2009.
THE EXPANDED TECH/INFO SECTOR
WHAT’S DRIVING LONDON’S GROWTH?
Note: Expanded tech info includes tech/info, as noted in appendixData: Offi ce for National Statistics, South Mountain Economics LLC
Expanded tech/info 1088 143 30
Other industries 4228 330 70
Number of jobs, 2013
(thousands)
Number of new jobs created,
2009-2013 (thousands)
Share of total new jobs in
London, 2009-2013
FIGURE 3

8
The statistical agencies of the United Kingdom treat London as both a city and a region. In order to com-pare London to the leading tech regions in the US, New York and the San Francisco Bay Area, it is fi rst necessary to make sure that the geographies match up on key criteria. The size of London—32 boroughs and the City of London—makes it more analogous to the 25 counties of the New York City metro area than to the fi ve counties/boroughs of New York City proper. Similarly, London is far larger than the city of San Fran-cisco (population 825,000; one-tenth that of London), so the most instructive comparison is to the combina-tion of the San Francisco and San Jose metro regions, which we will call San Francisco-Silicon Valley.
When compared to these broader regions, London’s tech/info sector rivals in size the tech sector in New York and San Francisco-Silicon Valley. The New York metro area had 411,000 tech/info sector workers in 2013. San Francisco-Silicon Valley has 397,000 tech/info workers, including computer and electronic manufacturing. London’s tech/info employment level of 382,000 clearly places the city within the top echelon of global tech regions today (Figure 4). Moreover, the sector is growing rapidly. Since 2009, London’s tech/info sector has grown by 11.2 percent, compared to 7.7 percent for the New York metro area, and outstripping national percentage increases for Great Britain and the U.S as well. Only the San Francisco-Silicon Valley region has surged ahead at a faster pace.
Collectively the tech/info sector in London plus the East and Southeast regions, including Oxford and Cambridge, has roughly 744,000 tech/info workers, up by 76,000 since 2009. That’s slightly larger than Cal-ifornia’s tech/info sector (692,000). What’s more, the tech/info sector in the combined London-East-South-east region is growing faster than California, even with the rapid growth of San Francisco.
DIGITAL REGIONS
GLOBAL DIGITAL REGIONS: WHERE LONDON STANDS
TECH/INFO SECTOR JOBS, 2013* (THOUSANDS)
*Tech/info employment as defi ned in the appendix. Includes self–employed.San Francisco-Silicon Valley includes computer and electronics manufacturing
Data: Offi ce for National Statistics, Bureau of Labor Statistics, South Mountain Economics LLC
FIGURE 4
0 100 200 300 400 500
LONDON
NEW YORK CITYMETRO AREA
SAN FRANCISCO-SILICON VALLEY
METRO AREAS397
411
382

9
Fintech and big data fi rms are essential parts of Lon-don’s tech ecosystem. In this section, we estimate the size of these key sectors using the “want-ad” method-ology described in the Appendix.
Fintech start-ups run the gamut from fi nancial planning platforms to risk analysis to new ways of providing employee payments. Much like the role that biotech start-ups serve for the pharmaceutical industry, fi ntech start-ups are creating and nurturing fi nancial innovations that may eventually fi nd their way into mainstream fi nancial fi rms. There are also numerous fi ntech fi rms that have been spun off from mainstream fi rms, either as part of a nurturing strate-gy or in response to the perceived moribund character of incumbents. Indeed, an accelerator for fi ntech start-ups, Level 39, was set up in Canada Square at Canary Wharf.
Because fi nancial services is such an integrated industry, fi ntech start-ups need to be close to the existing fi nancial fi rms who may be competitors, sup-pliers, customers, or sources of talent. Additionally, as regulatory scrutiny increases, fi ntech start-ups benefi t from being able to integrate culturally and geographi-cally with the mainline fi nancial sector.
Based on our methodology, we determined London has an estimated 44,000 IT workers involved in fi ntech as of May 2014 (Figure 5). That number is roughly comparable to the 43,000 fi ntech workers in New York, and far ahead of the 11,000 in San Francisco-Silicon Valley. It’s important to note that because of data limita-tions, the results are based on distance from the urban center, rather than being arranged by historic political boundaries.
One of the most rapidly expanding sub-fi elds within tech/info today is “big data” or data analytics.5 London is a hub for big data start-ups serving a range of key London industries. Businesses in advertising, fashion, entertainment, and media need to learn how to extract valuable conclusions from the overwhelming stream of data generated by business transactions. In addition, the UK central government is both a big producer of data and a big user of data analytics.
As with other analyses, London again performs strongly when compared to other cities. At the top of the list is San Francisco-Silicon Valley, home of Google, Facebook, and other big data pioneers. London ranks next on the list, followed by New York and Washington, DC, with the latter refl ecting once again the infl uence of the U.S. federal government. Both Cambridge and Oxford are comparatively weak in big data jobs, which could lend support to the premise that data analytics is heavily dependent upon proximity to commercial or government customers.
FINTECH AND BIG DATA JOBS IN LONDON
RANKING LONDON: FINTECH AND BIG DATA WORKERS
ESTIMATED JOBS, THOUSANDS, MAY 2014
Note: All jobs within 25-mile radius except as shown. San Francisco-Silicon Valley is centered at San Mateo, CA
Estimates are based on the want-ad methodology described in appendix, Big data estimates are benchmarked to U.S. big data estimate from Mandel (2014),
adjusted to account for computer and information systems managersData: Offi ce for National Statistics, Bureau of Labor Statistics, Indeed.com,
South Mountain Economics LLC
London (50 miles) 51 68
London (25 miles) 44 54
New York City (50 miles) 48 66
New York City (25 miles) 43 57
San Francisco-Silicon Valley (50 miles) 13 118
San Francisco-Silicon Valley (25 miles) 11 98
Cambridge 1 7
Edinburgh 3 2
Manchester 3 3
Oxford 2 4
Boston 10 38
Seattle 3 29
Washington DC 7 53
United Kingdom total 82 102
United States total 200 588
Fintech occupations
Big data occupations
FIGURE 5
10
This study of the London tech/info economy follows previous South Mountain Economics studies on the tech/info economies in New York and San Francisco. In all three cities, the tech/info economy grew much more than had been expected by earlier economic projec-tions and, as a result, it helped drive economic growth in the middle of the greatest global economic crisis in generations.
As with San Francisco and New York, London’s tech/info boom came about for several reasons. Part of it was organic—driven by the presence of educated workers (many coming from the major universities clustered there), talented programmers and designers (media and large, older tech companies), customers (media, arts, advertising, public sector), and com-plementary industries (fi nance, media, fashion) with which tech companies could share talent, ideas, and products. The tech boom was also partly facilitated by infrastructure: the East End and the area that eventu-ally became named Silicon Roundabout had available, affordable offi ce space that was close to transit and appealing to tech workers.
It is also important to note the parallels between local government policy in London and New York, and to a lesser extent San Francisco. In London, like New York, the local government undertook a series of low-cost policy catalysts to encourage the growth of the tech/information sector. These include the conscious effort to create a tech community in the city, including the formation of such organizations as Tech City UK along with related promotional and educational ac-tivities. These efforts helped created a virtuous circle in which policy helped create a clear guidepost for attracting start-ups to the city, which in turn generated even more excitement, energy, and economic growth.
These factors underlying the London tech/info boom complement each other, and in some sense can-not be separated out. But without support from the lo-cal government, we might be looking at a story of a city with some good tech companies and some interesting start-ups—the London of 10 years ago—rather than studying it alongside San Francisco and New York as a leading digital city.
In sum, all these cities have challenges to continued growth and job creation in the tech sector. However, looking to the future, the London tech sector is poised to become a major driver of economic growth for the city and for the UK generally.
LESSONS FROM LONDON AND OTHER GLOBAL DIGITAL CITIES

11
This study is the third in a series on global digital cit-ies. The September 2013 report on the New York City economy developed a new defi nition of the “tech/ information” sector refl ecting the realities of the con-vergence between technology and content. The April 2014 report on San Francisco extended and refi ned that defi nition in order to get a better understanding of how global digital cities grow.
The main purposes of this study are to measure the size and growth of the London tech/info econo-my, and understand how it compares to the New York area and the San Francisco-Silicon Valley cluster. Two different approaches are used. The fi rst approach is industry-based, using offi cial government industry data from the Offi ce for National Statistics to identify tech/info jobs.
Additional perspective is provided by analyzing counts of online want ads or advertisements for jobs. This “want-ad” approach allows us to track the prev-alence of fi ntech and big data occupations. More-over, it allows us to estimate employment in narrower categories, such as big data occupations and fi ntech occupations. This approach builds on a methodology developed by South Mountain Economics over the past several years.
Both the industry-based approach and the want-ad approach are used to make international comparisons of London with New York and the San Francisco-Sil-icon Valley region. The methodology for making such comparisons are discussed below.
INDUSTRY-BASED APPROACHFor this study, the data for the industry-based ap-proach comes from the Offi ce for National Statis-tics. There are two important questions. First, which London industries belong in what this study calls the tech/info sector? Second, how can the London tech/info sector be defi ned in a way that best aligns with international comparability?
To answer these questions, consider that in the age of convergence, many traditional media companies have extensive online operations, and many Internet com-panies are extensive producers of content. Moreover,
it’s clear that publishing and media companies are part of the same ecosystem as smaller digital media, social networking, and e-commerce start-ups.
In particular, virtually all of the major London news, publishing, and media organizations — such as the BBC and the Financial Times — are pouring major resourc-es into their online and mobile operations. Moreover, Internet- and mobile-savvy workers move back and forth between the large companies and small start-ups. That’s the mark of a well-functioning ecosystem. In-deed, the large publishing and media companies serve much the same anchor function in London as the large tech companies do in Silicon Valley.
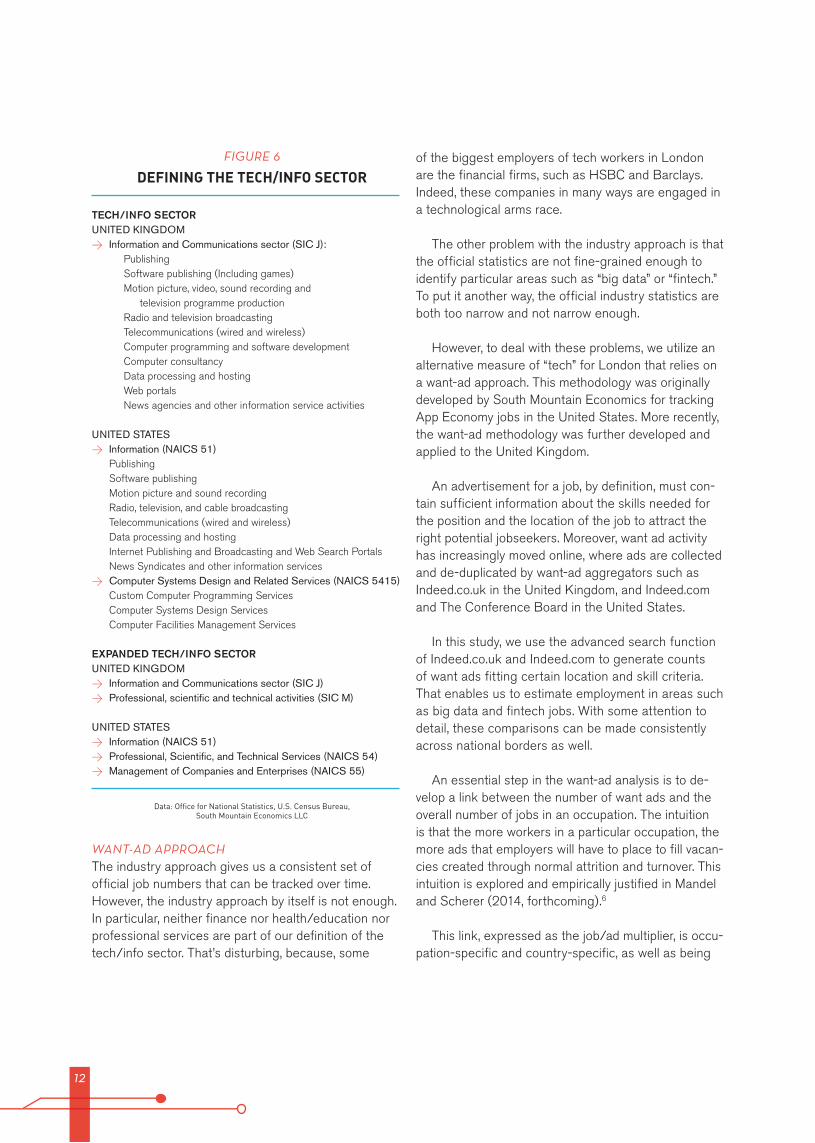
At a minimum, the tech/info sector in London should include all of the Information and Communica-tions broad industry group, as defi ned by government statistical agencies (Figure 6). This group (SIC codes 58 through 63) includes everything from web portals to wireless telecom to traditional newspaper and broad-cast companies to computer programming, and com-puter consultancies. That means large companies such as Google and Facebook, and small start-ups such as CityMapper, maker of a transport app, should, all fall into this broad category.
The next decision is whether to include other indus-tries in the defi nition of the tech/info sector as well. The New York and San Francisco studies do include several other industries, such as “scientifi c research and development services.” The Tech City study of London makes the case for broadening the defi nition of the tech/media/digital sector to include industries such as “public relations and communications,” “architectural activities,” and “advertising agencies.”
In this study, we present results for both the tech/info sector and the expanded tech/info sector, which includes professional, scientifi c, and technical indus-tries. Figure 6 shows the industry categories for the U.K. and for the comparable sectors in the U.S.
APPENDIX: METHODOLOGY
12
WANT-AD APPROACHThe industry approach gives us a consistent set of offi cial job numbers that can be tracked over time. However, the industry approach by itself is not enough. In particular, neither fi nance nor health/education nor professional services are part of our defi nition of the tech/info sector. That’s disturbing, because, some
of the biggest employers of tech workers in London are the fi nancial fi rms, such as HSBC and Barclays. Indeed, these companies in many ways are engaged in a technological arms race.
The other problem with the industry approach is that the offi cial statistics are not fi ne-grained enough to identify particular areas such as “big data” or “fi ntech.” To put it another way, the offi cial industry statistics are both too narrow and not narrow enough.
However, to deal with these problems, we utilize an alternative measure of “tech” for London that relies on a want-ad approach. This methodology was originally developed by South Mountain Economics for tracking App Economy jobs in the United States. More recently, the want-ad methodology was further developed and applied to the United Kingdom.
An advertisement for a job, by defi nition, must con-tain suffi cient information about the skills needed for the position and the location of the job to attract the right potential jobseekers. Moreover, want ad activity has increasingly moved online, where ads are collected and de-duplicated by want-ad aggregators such as Indeed.co.uk in the United Kingdom, and Indeed.com and The Conference Board in the United States.
In this study, we use the advanced search function of Indeed.co.uk and Indeed.com to generate counts of want ads fi tting certain location and skill criteria. That enables us to estimate employment in areas such as big data and fi ntech jobs. With some attention to detail, these comparisons can be made consistently across national borders as well.
An essential step in the want-ad analysis is to de-velop a link between the number of want ads and the overall number of jobs in an occupation. The intuition is that the more workers in a particular occupation, the more ads that employers will have to place to fi ll vacan-cies created through normal attrition and turnover. This intuition is explored and empirically justifi ed in Mandel and Scherer (2014, forthcoming).6
This link, expressed as the job/ad multiplier, is occu-pation-specifi c and country-specifi c, as well as being
DEFINING THE TECH/INFO SECTOR
Data: Offi ce for National Statistics, U.S. Census Bureau, South Mountain Economics LLC
TECH/INFO SECTOR UNITED KINGDOM
> Information and Communications sector (SIC J): Publishing Software publishing (Including games)
Motion picture, video, sound recording and television programme production
Radio and television broadcasting Telecommunications (wired and wireless) Computer programming and software development Computer consultancy Data processing and hosting Web portals News agencies and other information service activities
UNITED STATES > Information (NAICS 51)
Publishing Software publishing Motion picture and sound recording Radio, television, and cable broadcasting Telecommunications (wired and wireless) Data processing and hosting Internet Publishing and Broadcasting and Web Search Portals News Syndicates and other information services
> Computer Systems Design and Related Services (NAICS 5415) Custom Computer Programming Services Computer Systems Design Services Computer Facilities Management Services
EXPANDED TECH/INFO SECTORUNITED KINGDOM
> Information and Communications sector (SIC J) > Professional, scientifi c and technical activities (SIC M)
UNITED STATES > Information (NAICS 51) > Professional, Scientifi c, and Technical Services (NAICS 54) > Management of Companies and Enterprises (NAICS 55)
FIGURE 6

13
dependent on the particular want-ad aggregator being used. Our analysis shows that using Indeed.com as the want-ad aggregator gives us a job/ad multiplier of 9.0 for the UK IT occupations, and 12.6 for US IT occupa-tions Note that the multiplier is lower for the UK than the US, implying that UK employers are generating more ads per job on average.
Keyword lists were generated for big data jobs and fi ntech jobs. These keyword lists were used to gener-ate Figure 5 in the study. The job/ad multipliers were used to directly generate the estimates for fi ntech jobs. In the case of the big data jobs, the U.S. aggregate number was benchmarked to another recent study of U.S. big data jobs adjusted to account for computer and information systems managers.7 Then the want ad data was used to generate the estimates of big data jobs for London and other cities.
For the larger tech hubs of London, New York, and San Francisco-Silicon Valley, the fi gures show employment within both 25- and 50-mile radius. The 25-mile radius for London reaches substantially beyond the city’s political borders, while the 50-mile radius gets out to Cambridge, Oxford, and Reading. The 25-mile radius around New York City include the whole city and parts of Long Island, New Jersey, and Westchester, while the 50-mile radius reaches out to the headquarters of IBM and GE, and Bell Labo-ratories in New Jersey. The study uses San Mateo (California) as the center of the Bay Area, so a 25-mile radius includes San Francisco and Berkeley to the north and San Jose to the south, while a 50-mile radius includes most of the broader Bay Area. For the smaller hubs such as Oxford (UK) and Seattle (US), the tables report employment with a 25-mile radius.

14
Dr. Michael Mandel is president and founder of South Mountain Economics LLC (SME), which pro-vides global expertise on emerging occupations and emerging industries. SME is widely cited for its September 2013 report “Building A Digital City: The Growth And Impact of New York City’s Tech/info Sector,” and for its April 2104 report, “San Francisco and the Tech/Info Boom: Making the Transition to a Balanced and Growing Economy.”
SME recently completed a project tracking innova-tive job creation in the United Kingdom. SME studies on the App Economy were quoted in publications such as the Financial Times, the New York Times, Bloomberg, the Atlantic, Time, and Forbes.
Mandel is also chief economic strategist at the Pro-gressive Policy Institute in Washington (DC), where he supervises PPI’s research and policy work across such topics as the data-driven economy, the impact of regu-lation on innovation, and policies to improve production, investment and job growth. Mandel argues that inno-vation can be a force for creating jobs and opportunity for the broad population. Recent studies include “Can the Internet of Everything Bring Back the High-Growth Economy?” and “Where are the Big Data Jobs?”.
Mandel, who received a PhD in economics from Harvard University, is senior fellow at Wharton’s Mack Institute for Innovation Management at the Univer-sity of Pennsylvania. He is the author of four books including Rational Exuberance: Silencing the Enemies of Growth and Why the Future Is Better Than You Think.
Dr. Jonathan Liebenau is an Associate Professor (Reader) in Technology Management in the Depart-ment of Management at the London School of Eco-nomics. Liebenau leads LSE Tech, a research group at LSE’s Department of Management active in the area of Internet and Communications Economics, Policy and Strategy. He specialises in two areas: fundamental concepts of information, and the problems and pros-pects of information and communication technology in economic development. He has previously worked in academic administration, technology policy, and the economic history of science-based industry. He is the author or editor of several books and over 70 other major publications and has provided consultancy services to leading companies and strategic govern-ment agencies, including: Dell, BT, IBM, Microsoft, Tata Consultancy Services, Nortel, EDS, Lloyd Thompson; and in the UK Government, the Offi ce of Science and Innovation, the Department of Trade and Industry and the Home Offi ce. He also has worked with the Royal Society for the Arts and DigitalEurope, and is on the advisory boards of Istanbul Bilgi University and Ameri-can University in Cairo, School of Business.
AUTHORS

15
ENDNOTES1 Michael Mandel. “Building a Digital City: The Growth And Impact of New York City’sTech/information Sector,”
South Mountain Economics, September 2013. Michael Mandel, “San Francisco and the Tech/Info Boom,” South Mountain Economics, April 2014.
2 “Mayor outlines vision to make London the tech capital of the world,” press release, London & Partners, March 2014.
3 The tech/info sector was originally named in our 2013 report on New York City. (Michael Mandel. “Building a Digital City: The Growth And Impact of New York City’s Tech/information Sector,” South Mountain Economics, September 2013.)
4 “Tech Powers the London Economy: The Tech City 3rd Anniversary Report,” Tech City, December 2013
5 For big data job in the U.S., see Michael Mandel, “Where Are the Big Data Jobs?” Progressive Policy Institute, May 2014
6 Michael Mandel and Scherer, Judith. “Using Want-Ad Data for Mapping of Jobs and Economic Activity Related to Innovative Technologies,” NESTA working paper, 2014, forthcoming. See also: Michael Mandel and Scherer, Judith. “The Geography of the App Economy,” South Mountain Economics, October 2012
7 Michael Mandel, “Where Are the Big Data Jobs?” Progressive Policy Institute, May 2014