lokesh final for spiral
TRANSCRIPT

8/8/2019 Lokesh Final for Spiral
http://slidepdf.com/reader/full/lokesh-final-for-spiral 1/112
A REPORT ON
SUMMER INTERNSHIP/ PROJECT WORK
For
__________ (J.M.Financial) __________
Submitted to
INDUKAKA IPCOWALA INSTITUTE OF MANAGEMENT(I2IM)
CHAROTAR UNIVERSITY OF SCIENCE AND TECHNOLOGY (CHARUSAT)
CHANGA
Prepared by
Lokesh Bhatiya
ID No.:09 mba 02
M.B.A. First Year
Under the Guidance of
Vaishali Shah
Jignesh Mochi
INDUKAKA IPCOWALA INSTITUTE OF MANAGEMENT(I2IM)
CHAROTAR UNIVERSITY OF SCIENCE AND TECHNOLOGY (CHARUSAT)
AT. & PO. CHANGA – 388 421 TA: PETLAD DIST. ANAND, GUJARAT
JULY 2010
DECLARATION
1

8/8/2019 Lokesh Final for Spiral
http://slidepdf.com/reader/full/lokesh-final-for-spiral 2/112
I, Lokesh Bhatiya, student of the two-year MBA programme at
Indukaka Ipcowala Institute of Management (I2IM) hereby declare
that the report on summer training and project work entitled “Risk
and Investment Behaviour of Investor ” is the result of my own work. I also
acknowledge the other works / publications cited in the report.
Place: Changa
Date: 31.07.2008
( )
(Lokesh Bhatiya)
2

8/8/2019 Lokesh Final for Spiral
http://slidepdf.com/reader/full/lokesh-final-for-spiral 3/112
Acknowledgement
As it is quite evident that any person before entering in the real world of
business he/she has to undergo training programme. Training holds very important
position in the overall position of education because one can feel the real place of the
real world of business through training.
I am thankful to Mr. Ghanshyam Vyas (Branch head JM Financial Pvt. Ltd.,
Baroda) for allowing us to undergo training.
I am also very thankful to Mr. Jignesh Mochi, Mr. Mulik for their guidance &
support during the summer training & summer project.
I also express my thanks to all the employees of the company for sharing their
valuable time to me from their tight schedule to give me valuable information.
I am very grateful to the G. Krishnamurthi (Principal) for allowing us to take
my training from such a reputed organisation. I am thankful to Mrs. Vaishali Shah for
helping me in every related aspect of training & project. I am very thankful to Mr.
Govind Dave for providing their valuable reference in arranging the summer training
in such a reputed organization.
SANNI M. PATEL
3

8/8/2019 Lokesh Final for Spiral
http://slidepdf.com/reader/full/lokesh-final-for-spiral 4/112
TABLE OF CONTENTS
4
Sr.No. Particular Page Number
PART 1 –ORGANISATIONAL PROFILE
1 Introduction 7
2 The company 9
a. • History 9
b. • Mission & Vision 12
c. •
Management structure14
d. • Products 18
3 Functional area 19
a. • Market & Marketing 19
b. • Production/Operation 22
c. • Human Resourses 24
4 Decision making 27
a. • Strategic decision area &Decision making process
27
b. • Tactical and Operationaldecision area & Decision making
process
28
c. • Formal & Informal power relations
29
5 Financial Analysis 30
a. • Profitability of the firm of last4 years
30
b. • Asset built up in the last 4years
33
c. • Key financial ratio &interpretation
36
d. • Financial health & future of the organization
37
6. My learning from the study of organization 38

8/8/2019 Lokesh Final for Spiral
http://slidepdf.com/reader/full/lokesh-final-for-spiral 5/112
5
PART 2-Project Study
7. Overview of the Project 75
8. Research Methodology 77
9. Data analysis, Finding & Interpretation 94
10 References
11. Appendices
8/8/2019 Lokesh Final for Spiral
http://slidepdf.com/reader/full/lokesh-final-for-spiral 6/112
EXECUTIVE SUMMARY OF ORGANIZATION PROFILE
The report contains the information about J.M. Financial and the core areas as
well as the services that it provides. It provides information about
Individual’s financial advisors
Equity brokerage group
Fixed deposits
It also contains different functional areas such as
Marketing management
Financial management
Human resources management
The report contain various tactical decisions, strategic, operational financials analysis
6

8/8/2019 Lokesh Final for Spiral
http://slidepdf.com/reader/full/lokesh-final-for-spiral 7/112
INTRODUTION
JM Financial group
JM Financial is an integrated financial services group offering wide range of
capital market service to its corporate and individual clients. The Group has business
interest in investment banking, institutional equity sale & broking, private &
corporate wealth management, research, equity broking, portfolio management, asset
management, commodity broking etc.
JM Financial service private limited
JM Financial service private limited is a private sector organization. TheRegister & Corporate office of this organization is in Mumbai and the branch office of
JM Financial is in 22 cities in India.JM Financial private limited (JM Financial
Services) is a full service wealth management and equity broking firm with a focus on
capital markets.
JM Financial services offers research-based instrument advisory and equity
trading services to high net worth individuals and corporate investors across wide
range of financial product.
Their domestic research capabilities, capital market expertise and an exclusive
level of personal attention enable them to design and execute customized investment
strategies for their clients.
• Private Wealth Group advising high net worth individuals
• Corporate wealth Group advising top approximately 500 Corporate
Treasuries
• Secondary Broking- Equity and derivatives
• Depository services
• Portfolio Management Service
• Distribution of
Mutual Funds – deft and equity
Equity IPO’s
Fixed income product
7

8/8/2019 Lokesh Final for Spiral
http://slidepdf.com/reader/full/lokesh-final-for-spiral 8/112
Real estate funds
Private equity
THE COMPANY
Evolution & History
JM Financial Limited was started in 1986 by JM Financial & Investment
Consultancy Services Private Limited (JM FICS) to engage in the business of stock
broking and securities.
JM Financial & JM FICS sponsored one of India’s first private sector mutualfund viz. JM mutual funds, JM financial mutual fund made a simultaneous launch of
three open ended funds in December, 1994. The trustee of this fund is JM Financial
Asset Management Pvt. Ltd.
JM Financial Group subsequently entered into in equity partnership with
Morgan Stanley in 1999. Morgan Staley is one of the world’s leading financial service
firms with approximately 45,000 employees in 390 offices across 23 countries
worldwide. Morgan Stanley has a presence is almost every financial market.
The partnership led to setting up of two joint venture companies, JM Morgan
Stanley Private Limited, with interest in the area of investment banking, retail
distribution, private wealth management and fixed income securities and JM Morgan
Stanley Securities Private Limited with operations in institutional equity sales and
trading. While JM Financial holds 51% of JM Morgan Stanley private limited with
49% being held by Morgan Stanley.
JM Morgan Stanley private limited operates in the area of retail distribution
and fixed income sales & trading through two wholly owned subsidiaries viz., JM
8

8/8/2019 Lokesh Final for Spiral
http://slidepdf.com/reader/full/lokesh-final-for-spiral 9/112
Morgan Stanley Financial Service Private Limited and JM Morgan Stanley Fixed
Income Securities Private Limited.
JM Financial Limited has approved the merger of JM Securities Private
Limited, a JM Financial group of company itself. This merger is subject to
satisfactory receipts of all statutory, regulatory, corporate and other approvals as may
be required, including but not limited to, approval of relevant high citst, Reserve Bank
of India, Stock Exchange, Securities Exchange Board of India, and share holders.
After the proposed merger JM Financial had expend its interest in equity
broking, investment banking, retail & fixed income broking, asset management,
commodities broking and equity financing business.
9

8/8/2019 Lokesh Final for Spiral
http://slidepdf.com/reader/full/lokesh-final-for-spiral 10/112
Awards
Year Name of Award Details
2009Finance Asia Country Awards for
AchievementBest Equity House, India
2009 Best Workplaces in India 2009Ranked among top 50 companies by Great
Places to Work Institute
2008 Best Workplaces in India 2008Ranked among top 50 companies by Great
Places to Work Institute
2008Outlook Money NDTV Profit
AwardsBest Merchant Banker - Runners Up
2007 Finance Asia Achievement Awards Best India Deal – for Vodafone’s $12 billion
acquisition of HTIL
2007 Finance Asia Achievement Awards Best Secondary Offering – for ICICI’s $4.6
billion simultaneous follow-on of ADRs and
domestic shares
2007 The Asset Triple A Regional Award Best Follow-on Offering - for ICICI’s $4.6
billion simultaneous follow-on of ADRs and
domestic shares
2007 ICRA Mutual Funds Awards Open Ended Sectoral–Healthcare-1 year
performance (till 31.12. 2006), Gold - JM
Healthcare Sector Fund
10

8/8/2019 Lokesh Final for Spiral
http://slidepdf.com/reader/full/lokesh-final-for-spiral 11/112
2006 CNBC TV18 – CRISIL Mutual Fund
Awards
EuroMoney Awards of Excellence
Floating Rate Plan - JM Floater Short Term
Plan
Best M&A House, India
2005 Finance Asia
Finance Asia
Best Follow-on Offering - ICICI Bank
USD1.75 billion concurrent ADR and
domestic share sale
Best India Deal - Reliance Industries USD4.8 billion restructuring
2004 Finance Asia
Asset Asian Awards
Asia Money
Asia Money
Asia Money
Best India Deal - USD 1.2 billion Tata
Consultancy Services IPO
Best Privatization - USD 2.4 billion ONGC
follow-on offering
Best Deal in India - OIL & Natural Gas
Corporation
Best Overall Strategy – Brokers
Best Overall Macroeconomics – Brokers
2002 CIRISL Best Fund Awards Best Performing Open-end Debt Scheme -JM Income Fund
2001 CIRISL Best Fund Awards Best Performing Open-end Debt Scheme -
JM Income Fund
Vision Statement
11

8/8/2019 Lokesh Final for Spiral
http://slidepdf.com/reader/full/lokesh-final-for-spiral 12/112
“To be the most trusted partner for every stakeholder in the financial world.”
Mission Statement
• Earning trust is a process (it can be gained and lost every day!)
• Sharing trust creates great teams
• Being trustworthy is the most efficient way of generating and retaining
long-term business
• Self–trust is the starting point of trusting others
JM believe:
• Earning trust is a process (it can be gained and lost every day!)• Sharing trust creates great teams (whether between employees or between
organisations)• Being trustworthy is the most efficient way of generating and retaining long-
term business• Self–trust is the starting point of trusting others
Believes
JM FINANCIAL have always sought to be a value-driven organization, where
its values direct its growth and success.
Integrity:
Integrity is fundamental to its business. JM FINANCIAL adhere to moral and
ethical principles in everything JM FINANCIAL do as professionals, colleagues and
corporate citizens. Its reputation based on its high standards of integrity is invaluable.
12

8/8/2019 Lokesh Final for Spiral
http://slidepdf.com/reader/full/lokesh-final-for-spiral 13/112
Teamwork:
JM FINANCIAL believe extensive teamwork is what makes it possible for us
to work together towards a common goal. JM FINANCIAL value and respect each
individual's commitment to group effort.
Client Focus:
JM FINANCIAL always put the interest of its clients before its own. JM
FINANCIAL understand its client needs, seek new opportunities for them, addressthem and deliver unique solutions as per their expectations. The success of its clients
is the biggest reward for us.
Innovation:
JM FINANCIAL understand its clients' needs and develop solutions for themost complex or the simplest, the biggest or the smallest financial transactions,
whether for individuals or institutions. Creativity and innovation are key factors to
everything JM FINANCIAL do. JM FINANCIAL encitsage new ideas which help us
address unique opportunities.
Implementation:
Its expertise, experience and its continuous focus on the quality of execution
ensures effective implementation of its strategies.
13

8/8/2019 Lokesh Final for Spiral
http://slidepdf.com/reader/full/lokesh-final-for-spiral 14/112
Performance:
JM FINANCIAL believe in development of its people and continuously hone
its skills, setting higher targets of performance for itsselves. JM FINANCIAL strive to
attract, develop and retain the best talent. JM FINANCIAL recognize and reward
talent based on merit.
Partnership:
Its relationships with all its stakeholders reflect its spirit of partnership.
Clients see us as trusted advisors, shareholders see us as partners and employees see
us as family. JM FINANCIAL respect, trust and support all its stakeholders.
Management Structure of J M Group
JM FINANCIAL is a private company and the offices are spread over thecountry. J M FINANCIAL has many branches in India. Its structure is discussed as
follow with the management hierarchy.
14

8/8/2019 Lokesh Final for Spiral
http://slidepdf.com/reader/full/lokesh-final-for-spiral 15/112
Management Structure of J M Group
15

8/8/2019 Lokesh Final for Spiral
http://slidepdf.com/reader/full/lokesh-final-for-spiral 16/112
Geographical Spread of JM Financial Services Pvt. Ltd.
16

8/8/2019 Lokesh Final for Spiral
http://slidepdf.com/reader/full/lokesh-final-for-spiral 17/112
Products
Primary Market:
IPO Offering - Debt and Equity Mutual Fund - Debt and Equity
Secondary Market:
Equity Advisory and Broking Fixed Income Advisory & Execution Future & Option Advisory & Broking
Buybacks Block Trade
Sales Services
Customized investment advisory and asset allocation of portfolio Portfolio Tracking for Mutual Funds Portfolio Tracking for Secondary Equity
17

8/8/2019 Lokesh Final for Spiral
http://slidepdf.com/reader/full/lokesh-final-for-spiral 18/112
FUNCTIONAL AREAS
Business segment of JM Financial service
Private wealth Group
Private Wealth Group (PWG) is a personalized investment advisory service
for high net worth individual with an investible surplus in excess of USD 1 mn.
(Rs 5 crore) with dedicated wealth managers for managing the client’s wealth.
PWG segment draws upon the full spectrum of firm resources & expertise in
capital markets for generating investment ideas and developing customizedinvestment solution for meeting their client’s financial goal.
Corporate wealth group
Corporate Wealth Group (CWG) at JM Financial provides research-based
investment advisory service to top 500 corporate treasuries for deployment of
surplus funds. A dedicated investment advisor supported by research and product
team is assigned to each corporate client.
Equity Brokerage Group
Equity Brokerage group (EBG) offers trading and research-based equity
advisory services to high net worth individuals, retail clients and corporates.
This group focuses on generating wealth for the client through stoke ideas and
trading strategies based on a combination of fundamental and research analysis.
Equity Brokerage Group distinguishes itself from others by focusing on
providing customized investment solutions and brokerage services to various
client segments.
18

8/8/2019 Lokesh Final for Spiral
http://slidepdf.com/reader/full/lokesh-final-for-spiral 19/112
Independent Financial Advisor Group
JM Financial service has developed one of the largest network of distribution
of financial product to retail investors through Independent Financial Advisors
(IFA).
JM Financial Group’s expertise in capital market and strong investment
banking franchise, helps them in launching public issues of companies with strong
fundamental and creditable promoter background for generating their clients.
Main Services
19

8/8/2019 Lokesh Final for Spiral
http://slidepdf.com/reader/full/lokesh-final-for-spiral 20/112
Target market
Target market of JM Financial is all those who wants to invest either in fixed
deposit or wands to invest in share market. JM financial also help the person who
wants to take expert advice. So the JM financial target market is as follow
• Broker
• Sub-broker
• Local agent
• Individual investor
• Senior citizen
• Conservative investor
• Aggressive investor
Market share of JMFS
Approximately JMFS captures 20% of total market share of overall broking
but the brighter part is that its market share is increasing year by year.
Competitors of JMFS
• Reliance Capital
• Kotak
• Karvy
• Shri Global traders
• Bajaj Holding
• Local broker
• VSE
20

8/8/2019 Lokesh Final for Spiral
http://slidepdf.com/reader/full/lokesh-final-for-spiral 21/112
Distribution channel
JMFS wants to reach deep in the market. It has very good link with sub
broker. So by sub broker chain company try to reach it`s target market.
Promotional measure
Company use all possible source of promotional measure to reach it’s target
market. The promotional measure includes
• Advertisement
• Sale promotion
• Publicity
• Development of franchise
• Development of sub broker
Measure of customer satisfaction taken by the company
• JMFS uses very simple technique to know customer satisfaction. Company
use
Feedback from filling
Direct contact with customer
Provide some addition service
Help in tax panning etc.
Try to advice the customer the satisfy customer financial need
Office timing
Monday to Friday 9.30 AM to 6.30 PM
Saturday 10.30 AM to 2.30
21

8/8/2019 Lokesh Final for Spiral
http://slidepdf.com/reader/full/lokesh-final-for-spiral 22/112
Attendance system
Attendance system in J M financial is very simple. All employees have to sign
in the register when they come & when they go out. In this way they record in time &
out time of any employ.
Critical working hour
Critical working hour in the organization is the trading time in the stock
market i.e. 9:55 AM to 3:30 PM.
Discipline
JM Financial is very particular about in & out time of employees. So all the
employees have to follow strict time schedule of the organization.
Human resource planning
Whenever there is requirement of manpower each & every branch send there
need to Head office. The branch also describes the job where the person is required.
The brief job description is also given by the branch office. Base on the
Requirement of the branch the head office takes the responsibility overall
human resource planning.
The HRP of the JM financial includes number of person require, type of
person required, number of person require in each & every branch, source of
recruitment whether it is eternal or external source & so on.
22

8/8/2019 Lokesh Final for Spiral
http://slidepdf.com/reader/full/lokesh-final-for-spiral 23/112
Process of HRP
Recruitment & Selection
After HRP recruitment and selection process starts. Head office provides
power to the branch head for recruitment & selection at junior level. Branch head
specify the requirement like skill, education, experience etc. After that though
interview recruitment & selection process done.
At senior management level recruitment & selection is Completed through
head office. JM Financial generally use advertisement etc. to generate the
application.After screening the application, some written test & interview is use for
final selection.
23
Each branch send their requirement to Head office
Head office collects the data of requirement of each
branchHead office check whether the person actually required
After that Head office do actual HRP for each branch

8/8/2019 Lokesh Final for Spiral
http://slidepdf.com/reader/full/lokesh-final-for-spiral 24/112
Level Source of recruitment Selection
method
Selection at
Junior management Level Internal source mainly
though reference
Interview Branch level
Senior management Level External source mainly
though advertisement
Interview Head office
level
Training & Development
Whenever a new employ is recruited training is provided to the new employ.
The number of days of training is depends on which types of work the person is going
to do. But it is on an average 15 days to 20 days training is provided to a new employ.
Promotion policy
Promotion is provided on JM Financial strictly on the merit based.
Performance appraisal plays the key role in the promotion. The employ who has
highly rated in his performance appraisal has better chance of getting promotion.
Transfer policy
Organization reserves the transfer whenever need arise. Organization can
transfer any employ at different branch in same city or different city.
24

8/8/2019 Lokesh Final for Spiral
http://slidepdf.com/reader/full/lokesh-final-for-spiral 25/112
Welfare facility of the organization
• Picnic once in a year
• Performance bonus
• Tea 3-4 times in a day
• Competition among employ child & some prize distribution
Budgetary control system
Budgetary system is control head office in Bombay. all the major decision
regarding the budget are taken at H.O , but execution is done at different branches .
Board meeting
The board meeting is held quarterly at head office. they make all the kind of
decisions including the regular work and also the researches they make .
Senior management decision
The senior management makes all the tactical decisions regarding all the
major investment in the different branches.
Operating decision
These decisions are made by the head of the branches the operating decisions
includes all the day to day working decisions
There is nice and smooth coordination among all the layers in the organizationthe work is allocated as per the qualification as well as the specialization.
Distribution Channel
JMFS wants to reach deep in the market. It has very good link with sub
broker. So by sub broker chain company try to reach it`s target market.
25

8/8/2019 Lokesh Final for Spiral
http://slidepdf.com/reader/full/lokesh-final-for-spiral 26/112
DECISION MAKING
Strategic Decision Area at JM Financial
JM Financial use a systematic method to identity strategic decision area. Thestrategic decision area is mainly concern with long term goals and objective of a firm.
External environment is a great impact on organizational strategic decision area.
The main strategic decisions areas in JM Financial are are:
Whether to open new branch or not
Where to open new branch
Where to close down the branch
Policy to deal with competition in long run
Decide the wage & salary structure to retain employ
Recruitment & selection decision
Overall firm plan to survival in the long run
Strategic Decision making process of firm
Key feature strategic decision making in JM Financial
Centralized decision making
Fully control by head office Mumbai
Key role top management
Decision for long run goal of a farm
Process of Strategic Decision making
1. Analysis of internal & external environment
2. Analysis of strength & weakness of firm
3. Find the list of need
4. Provide the priority of need
5. Make the final strategic decision
6. Get approval & implementation
26

8/8/2019 Lokesh Final for Spiral
http://slidepdf.com/reader/full/lokesh-final-for-spiral 27/112
Tactical & operational decisions in JM Financial
The main tactical & operational areas are
Day to day decision of firm
Decision to deal with short term competition
Decision of recruitment & selection at junior level
Key feature of operational decision at JM Financial
Centralized decision
Decision at head office Mumbai
Implemented by the branch head at respective branch
Process of operational & tactical decision
1. Branch head find the requirement of its own branch
2. It send its requirement at head office
3. It also send his idea view etc. what has to done to solve the problem
4. Branch head analysis all the requirement
5. Final decision taken by branch head
6. Implementation is done on respective branches
Formal power relation
JM Financial follow hierarchy for decision making. At branch level power is
in the hand of branch head. He is responsible for at branch activity. All other
employee at branch level has power to do their own work but branch head give final
approval.
27

8/8/2019 Lokesh Final for Spiral
http://slidepdf.com/reader/full/lokesh-final-for-spiral 28/112
But the strategic decision or operational decision all the power goes to top
management. Top management has a power to take long term and short term decision
of a firm. Branch manager has very little power in this regard.
Informal power relation
All though branch head has very little power in decision making but top
management always welcome his suggestion.
At branch level also branch head provide freedom to the employees for givingsuggestion in branch level decision making and suggestion play an important role in
decision making.
28

8/8/2019 Lokesh Final for Spiral
http://slidepdf.com/reader/full/lokesh-final-for-spiral 29/112
FINANCIAL ANALYSIS
JM Financial
Profit & Loss account ------------------- in Rs. Cr. -------------------
Mar '05 Mar '06 Mar '07 Mar '08 Mar '09
12 mths 12 mths 12 mths 12 mths 12 mths
Income
Sales Turnover 13.41 13.40 39.32 33.64 24.46
Excise Duty 0.00 0.00 0.00 0.00 0.00
Net Sales 13.41 13.40 39.32 33.64 24.46
Other Income -3.69 4.22 0.06 1,736.77 -1.74Stock Adjustments 0.00 0.00 0.00 0.00 0.00
Total Income 9.72 17.62 39.38 1,770.41 22.72
Expenditure
Raw Materials 0.00 0.00 0.00 0.00 0.00
Power & Fuel Cost 0.00 0.00 0.00 0.00 0.00
Employee Cost 0.00 0.15 1.29 3.68 4.44
Other Manufacturing
Expenses0.00 0.00 0.00 0.00 0.00
Selling and Admin Expenses 0.16 1.27 1.21 10.94 1.41Miscellaneous Expenses 0.08 0.45 1.13 3.83 3.41
Preoperative Exp Capitalised 0.00 0.00 0.00 0.00 0.00
Total Expenses 0.24 1.87 3.63 18.45 9.26
29

8/8/2019 Lokesh Final for Spiral
http://slidepdf.com/reader/full/lokesh-final-for-spiral 30/112
Mar '05 Mar '06 Mar '07 Mar '08 Mar '09
Particulars 12 mths 12 mths 12 mths 12 mths 12 mths
Operating Profit 13.17 11.53 35.69 15.19 15.20PBDIT 9.48 15.75 35.75 1,751.96 13.46
Interest 0.00 0.00 0.00 0.05 0.04
PBDT 9.48 15.75 35.75 1,751.91 13.42
Depreciation 0.02 0.02 0.03 0.10 0.27
Other Written Off 0.00 0.00 0.00 0.00 0.00
Profit Before Tax 9.46 15.73 35.72 1,751.81 13.15
Extra-ordinary items 0.00 -0.01 0.00 0.01 -0.02
PBT (Post Extra-ord Items) 9.46 15.72 35.72 1,751.82 13.13
Tax -0.01 0.45 0.42 391.63 5.17Reported Net Profit 9.48 15.27 35.31 1,360.16 7.97
Total Value Addition 0.24 1.87 3.62 18.46 9.26
Preference Dividend 0.00 0.00 0.00 0.00 0.00
Equity Dividend 2.83 7.50 15.00 75.00 15.00
Corporate Dividend Tax 0.40 1.05 2.55 12.75 0.05
Per share data (annualised)
Shares in issue (lakhs) 113.25 155.25 300.00 300.00 7,497.83
Earning Per Share (Rs) 8.37 9.83 11.77 453.39 0.11
Equity Dividend (%) 25.00 25.00 50.00 250.00 20.00
Book Value (Rs) 28.34 140.87 127.00 551.15 21.96
30
8/8/2019 Lokesh Final for Spiral
http://slidepdf.com/reader/full/lokesh-final-for-spiral 31/112
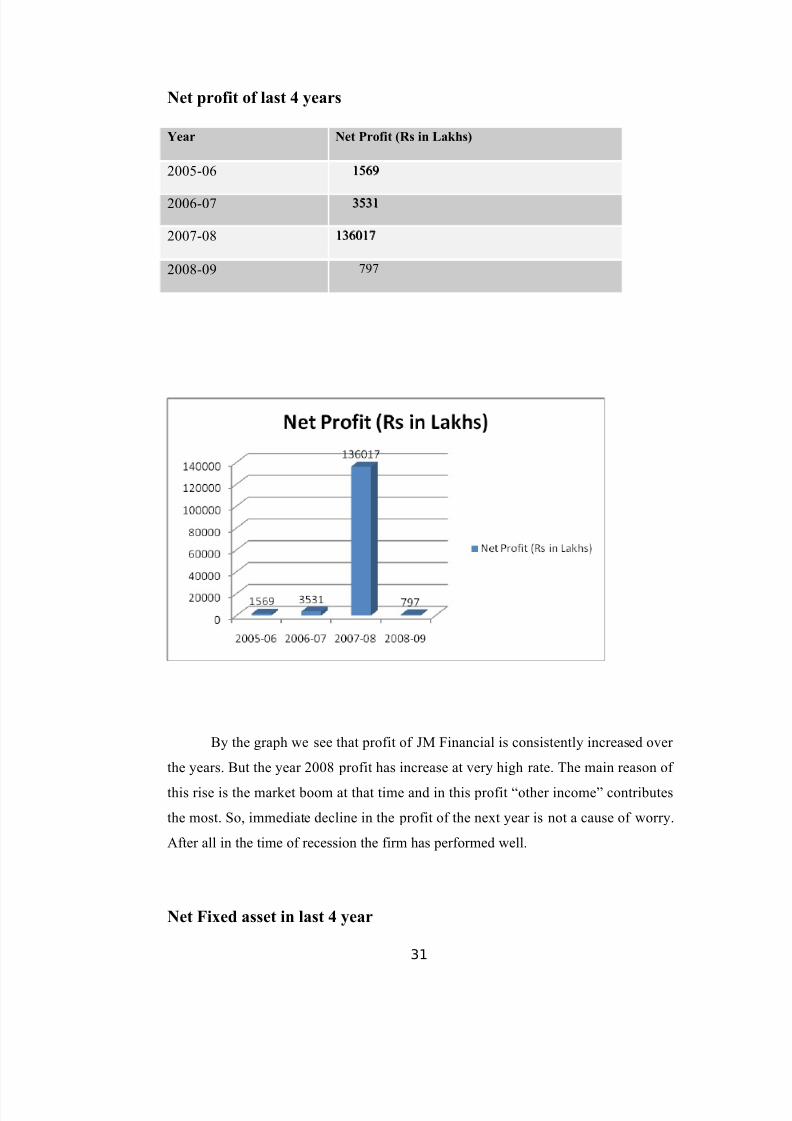
Net profit of last 4 years
Year Net Profit (Rs in Lakhs)
2005-06 15691569
2006-07 35313531
2007-08 136017136017
2008-09 797
By the graph we see that profit of JM Financial is consistently increased over
the years. But the year 2008 profit has increase at very high rate. The main reason of
this rise is the market boom at that time and in this profit “other income” contributes
the most. So, immediate decline in the profit of the next year is not a cause of worry.
After all in the time of recession the firm has performed well.
Net Fixed asset in last 4 year
31

8/8/2019 Lokesh Final for Spiral
http://slidepdf.com/reader/full/lokesh-final-for-spiral 32/112
JM Financial
Balance Sheet ------------------- in Rs. Cr. -------------------
Mar '05 Mar '06 Mar '07 Mar '08 Mar '09
12 mths 12 mths 12 mths 12 mths 12 mths
Sources Of Funds
Total Share Capital 11.29 15.50 29.98 29.98 74.97
Equity Share Capital 11.29 15.50 29.98 29.98 74.97
Share Application Money 0.00 12.37 0.00 0.00 0.00
Preference Share Capital 0.00 0.00 0.00 0.00 0.00
Reserves 20.81 203.19 351.02 1,623.46 1,571.40
Revaluation Reserves 0.00 0.00 0.00 0.00 0.00
Networth 32.10 231.06 381.00 1,653.44 1,646.37Secured Loans 0.00 0.00 0.00 0.00 0.00
Unsecured Loans 0.00 0.00 0.00 0.15 0.28
Total Debt 0.00 0.00 0.00 0.15 0.28
Total Liabilities 32.10 231.06 381.00 1,653.59 1,646.65
Mar '05 Mar '06 Mar '07 Mar '08 Mar '09
12 mths 12 mths 12 mths 12 mths 12 mths
Application Of Funds
Gross Block 1.09 1.09 1.18 1.90 2.34
Less: Accum. Depreciation 0.23 0.24 0.27 0.37 0.62
Net Block 0.86 0.85 0.91 1.53 1.72
Capital Work in Progress 0.00 0.00 0.00 0.04 0.00
Investments 31.13 148.16 350.65 1,521.43 1,524.08
Inventories 0.00 0.00 0.00 0.00 0.00
Sundry Debtors 0.00 0.00 0.00 0.00 0.00
Cash and Bank Balance 0.18 0.67 0.82 0.48 0.85
Total Current Assets 0.18 0.67 0.82 0.48 0.85
Loans and Advances 4.89 92.71 48.81 101.65 103.75
Fixed Deposits 0.00 0.00 0.00 238.65 150.68
Total CA, Loans &
Advances5.07 93.38 49.63 340.78 255.28
Deffered Credit 0.00 0.00 0.00 0.00 0.00
Current Liabilities 1.74 2.77 2.65 122.37 118.96
Provisions 3.23 8.55 17.55 87.81 15.46
Total CL & Provisions 4.97 11.32 20.20 210.18 134.42
32

8/8/2019 Lokesh Final for Spiral
http://slidepdf.com/reader/full/lokesh-final-for-spiral 33/112
Net Current Assets 0.10 82.06 29.43 130.60 120.86
Miscellaneous Expenses 0.00 0.00 0.00 0.00 0.00
Total Assets 32.09 231.07 380.99 1,653.60 1,646.66
Contingent Liabilities 3.59 3.59 3.58 3.80 4.27
Book Value (Rs) 28.34 140.87 127.00 551.15 21.96
Net Fixed asset in last 4 year
Year 2005-
06
2006-
07
2007-
08
2008-
09
Fixed Assets
(Rs in lakhs)
85.99 84.21 90.84 153.17
From the graph we see that JM Financial`s fixed asset has increased over the
years. By the end of 2008-09 the fixed asset of JM financial 172.67 lakhs which is
increased by 105.05% as compare to the year of 2005-06. So it shows that organization
is doing well and organization has enough funds to in invest in fixed assets.
33
8/8/2019 Lokesh Final for Spiral
http://slidepdf.com/reader/full/lokesh-final-for-spiral 34/112
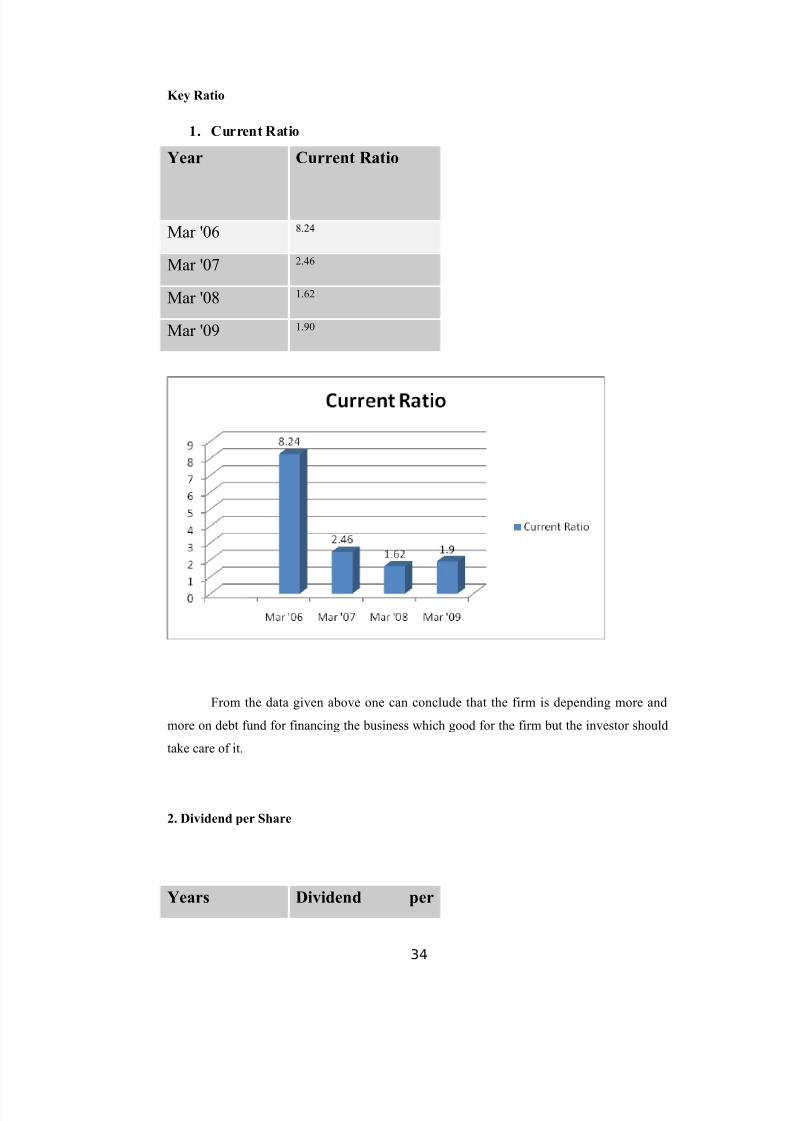
Key Ratio
1. Current Ratio
Year Current Ratio
Mar '06 8.24
Mar '07 2.46
Mar '08 1.62
Mar '09 1.90
From the data given above one can conclude that the firm is depending more and
more on debt fund for financing the business which good for the firm but the investor should
take care of it.
2. Dividend per Share
Years Dividend per
34

8/8/2019 Lokesh Final for Spiral
http://slidepdf.com/reader/full/lokesh-final-for-spiral 35/112
share
Mar '06 02.50
Mar '07 05.00
Mar '08 25.00
Mar '09 00.20
From the above graph we can one can say that dividend per share is increasing. From
the year 2006 to 2008 dividend per share has increased by 900%. But in 2009 it declined. The
reason is “Stock split “. The Share of JM has splited into 10 and now it of Rs.1 F.V. which
was previously of Rs 10 each.
3. Gross Profit Ratio
Year G.P. Ratio (in %)
March 2008 44.82
March 2009 61.04
35

8/8/2019 Lokesh Final for Spiral
http://slidepdf.com/reader/full/lokesh-final-for-spiral 36/112
The profit margin of the firm is considerably increased as compare to past year. The
profit margin has increased even after the year was of recession which is good sign factor.
Financial health of the organization
Financial health of the organization is very good the reasons are
The organization has performed well even in recession period.
The ratio of the organization is also very good
Organization has not any major loan liability it is also a good sign.
Organization EPS is also very good.
Future of the organization
JM Financial is growth oriented organization the future of JM Financial is looking
bright. It happen that JM Financial may not earn super normal profit like 2008 but in the long
run the future of the organization is very good.
36

8/8/2019 Lokesh Final for Spiral
http://slidepdf.com/reader/full/lokesh-final-for-spiral 37/112
MY LEANINGS FROM THE STUDY
The objective of the summer training at the M.B.A level is to develop the idea
about the industrial environment as well as business practices in order to develop the a
practical skills as a supplement to theoretical study of management in general . After
this training I realize how the real world works
Now I am in better position to understand the hierarchy how the different
department are loaded with responsibilities and accountability. How the top
management control the activities and the work of bottom level.
The study of organizational behaviour has help me to realize how an
individual’s behave in work stress what are relationship between the different
employees particularly at the operation level
The analysis and interpretation of cost has made me realize how important the
costing is for any organization weather production or a service particularly at the
J.M.F.S the cost cutting is high due to the recession.
In J.M. Finanacial, marketing is done through their strong contacts with their
clients and sub brokers whenever a new N.F.O or an I.P.O is comes they contact their
customers and inform them. The individual financial advisory groups stay in contacts
with customers and try build new through the existing ones.
Finance is the life blood of any organization here at the J.M.F.S I realize how
finance is related with all the other. The working pattern of J.M.F.S depends heavily
on the performance of the stock market this thing roves from the profit which J.M has
reached, when the stock market was 21000 mark in 2008
37

8/8/2019 Lokesh Final for Spiral
http://slidepdf.com/reader/full/lokesh-final-for-spiral 38/112
I also learned many new things as well from J.M such as how trading is done
how investors react in bull and bear period.I also got the idea about mutual fund &
How it works.
Mutual Fund Operation Flow Chart
Meaning
A Mutual Fund invests the pool of money collected from the investors in a
range of securities comprising equities, debt, money market instruments etc.
The main advantages of the mutual funds are
Capital appreciation
Dividend distribution
Diversified risk
Diversified porthfolio
We came to know various terms like of share market
Stock futures
Stoke option
Difference between share, mutual fund and fixed deposits
38

8/8/2019 Lokesh Final for Spiral
http://slidepdf.com/reader/full/lokesh-final-for-spiral 39/112
(A) MUTUAL FUND
1. INTRODUCTION:
A Mutual Fund is a trust that pools the savings of a number of investors who
share a common financial goal. The money thus collected is invested by the fund
manager in different types of securities depending upon the objective of the scheme.
These could range from shares to debentures to money market instruments. The
income earned through these investments and the capital appreciations realized by the
scheme are shared by its unit holders in proportion to the number of units owned by
them (pro rata). Thus a Mutual Fund is the most suitable investment for the common
man as it offers an opportunity to invest in a diversified, professionally managed
portfolio at a relatively low cost. Anybody with an inventible surplus of as little as a
few thousand rupees can invest in Mutual Funds. Each Mutual Fund scheme has a
defined investment objective and strategy.
A Mutual fund is
the ideal investment vehicle
for today’s complex and
modern financial scenario.
Markets for equity shares,
bonds and other fixed
income instruments, real estate, derivatives and other assets have become mature andinformation driven. Price changes in these assets are driven by global events
occurring in faraway places. A typical individual is unlikely to have the knowledge,
skills, inclination and time to keep track of events, understand their implications and
act speedily. A draft offer document is to be prepared at the time of launching the
fund. Typically, it pre specifies the investment objectives of the fund, the risk
associated, the costs involved in the process and the broad rules for entry into and exit
from the fund and other areas of operation. In India, as in most countries, these
sponsors need approval from a regulator, SEBI (Securities exchange Board of India)
39

8/8/2019 Lokesh Final for Spiral
http://slidepdf.com/reader/full/lokesh-final-for-spiral 40/112
in our case. SEBI looks at track records of the sponsor and its financial strength in
granting approval to the fund for commencing operations.
A sponsor then hires an asset management company to invest the funds
according to the investment objective. It also hires another entity to be the custodian
of the assets of the fund and perhaps a third one to handle registry work for the unit
holders (subscribers) of the fund. In the Indian context, the sponsors promote the
Asset Management Company also, in which it holds a majority stake. In many cases a
sponsor can hold a 100% stake in the Asset Management Company (AMC). E.g. Birla
Global Finance is the sponsor of the Birla Sun Life Asset Management Company
Ltd., which has floated different mutual funds schemes and also acts as an asset
manager for the funds collected under the schemes.
Characteristics:
• A mutual fund actually belongs to the investors who have pooled their funds.
• A mutual fund is managed by investment professionals and other service providers,
who earn a fee for their services, from the fund.
• The pool of funds is invested in a portfolio of marketable investments. The value of
the portfolio is updated every day.
• The investor’s share in the fund is denominated by ‘units’. The value of the units
changes with change in the portfolio’s value, every day. The value of one unit of
investment is called the Net Asset Value or NAV.
40
8/8/2019 Lokesh Final for Spiral
http://slidepdf.com/reader/full/lokesh-final-for-spiral 41/112

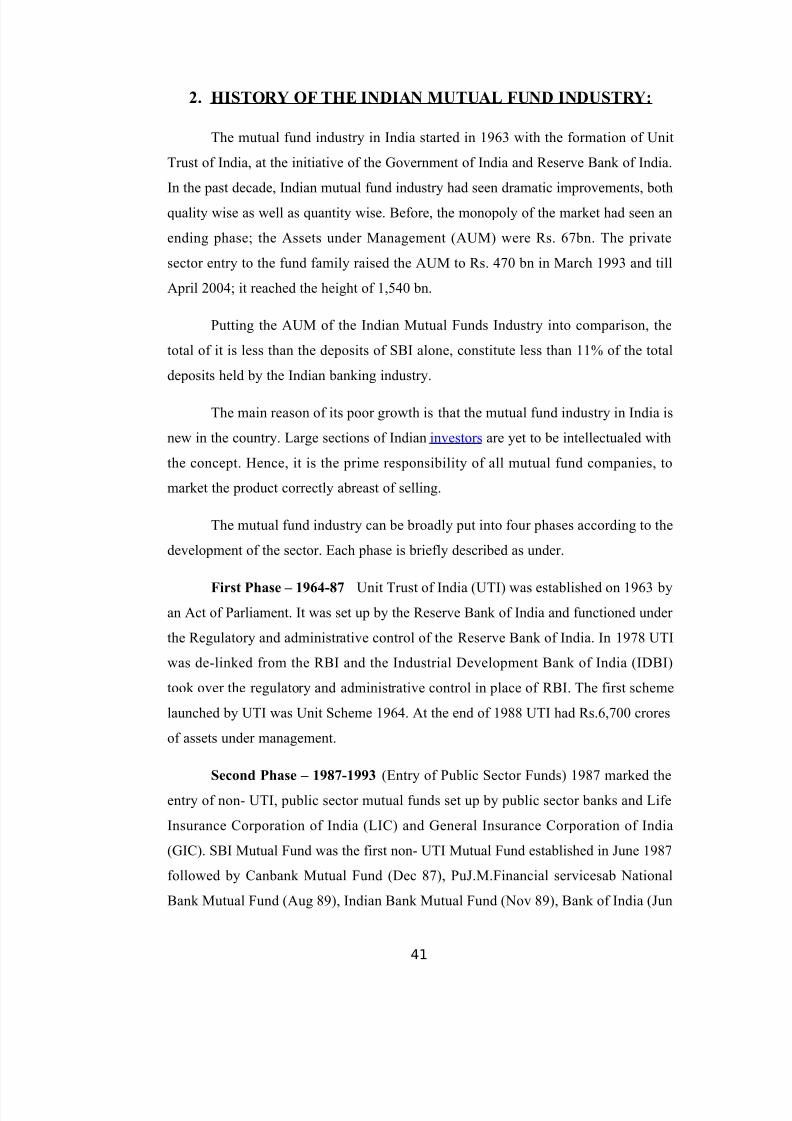
8/8/2019 Lokesh Final for Spiral
http://slidepdf.com/reader/full/lokesh-final-for-spiral 42/112
90), Bank of Baroda Mutual Fund (Oct 92). LIC established its mutual fund in June
1989 while GIC had set up its mutual fund in December 1990. At the end of 1993, the
mutual fund industry had assets under management of Rs.47,004 crores.
Third Phase – 1993-2003 (Entry of Private Sector Funds) With the entry of private
sector funds in 1993, a new era started in the Indian mutual fund industry, giving the
Indian investors a wider choice of fund families. Also, 1993 was the year in which the
first Mutual Fund Regulations came into being, under which all mutual funds, except
UTI were to be registered and governed. The erstwhile Kothari Pioneer (now merged
with Franklin Templeton) was the first private sector mutual fund registered in July
1993. The industry now functions under the SEBI (Mutual Fund) Regulations 1996.
The number of mutual fund houses went on increasing, with many foreign mutual
funds setting up funds in India and also the industry has witnessed several mergers
and acquisitions. As at the end of January 2003, there were 33 mutual funds with total
assets of Rs. 1,21,805 crores. The Unit Trust of India with Rs.44,541 crores of assets
under management was way ahead of other mutual funds.
Fourth Phase – since February 2003 In February 2003, following therepeal of the Unit Trust of India Act 1963 UTI was bifurcated into two separate
entities. One is the Specified Undertaking of the Unit Trust of India with assets under
management of Rs.29,835 crores as at the end of January 2003, representing broadly,
the assets of US 64 scheme, assured return and certain other schemes. It is registered
with SEBI and functions under the Mutual Fund Regulations. With the bifurcation of
the erstwhile UTI which had in March 2000 more than Rs.76,000 crores of assets
under management and with the setting up of a UTI Mutual Fund, conforming to the
SEBI Mutual Fund Regulations, and with recent mergers taking place among different
private sector funds, the mutual fund industry has entered its current phase of
consolidation and growth.
42

8/8/2019 Lokesh Final for Spiral
http://slidepdf.com/reader/full/lokesh-final-for-spiral 43/112
GROWTH IN ASSETS UNDER MANAGEMENT
Note: Erstwhile UTI was bifurcated into UTI Mutual Fund and the Specified
Undertaking of the Unit Trust of India effective from February 2003. The Assets
under management of the Specified Undertaking of the Unit Trust of India has
therefore been excluded from the total assets of the industry as a whole from February
2003 onwards.
43

8/8/2019 Lokesh Final for Spiral
http://slidepdf.com/reader/full/lokesh-final-for-spiral 44/112
3. MUTUAL FUND STRUCTURE:
The Structure Consists
The structure of mutual funds in India is governed by the SEBI Regulations,
1996. These regulations make it mandatory for mutual funds to have a 3-tier structure
of Sponsors-Trustee-AMC (Asset Management Company). The Trustees are
responsible to the investors in the mutual funds, and appoint the AMC for managing
the investment portfolio. The AMC is the business face of the mutual funds, as it
manages all the affairs of mutual funds. The mutual funds and AMC have to be
registered by the SEBI.
Sponsor
Sponsor is the person who acting alone or in combination with another body
corporate establishes a mutual fund. Sponsor must contribute at least 40% of the net
worth of the Investment Managed and meet the eligibility criteria prescribed under the
Securities and Exchange Board of India (Mutual Funds) Regulations, 1996.The
Sponsor is not responsible or liable for any loss or shortfall resulting from the
44

8/8/2019 Lokesh Final for Spiral
http://slidepdf.com/reader/full/lokesh-final-for-spiral 45/112
operation of the Schemes beyond the initial contribution made by it towards setting up
of the Mutual Fund
Trust
The Mutual Fund is constituted as a trust in accordance with the provisions of the
Indian Trusts Act, 1882 by the Sponsor. The trust deed is registered under the Indian
Registration Act, 1908.
Trustee
Trustee is usually a company (corporate body) or a Board of Trustees (body of
individuals). The main responsibility of the Trustee is to safeguard the interest of the
unit holders and inter-alia ensure that the AMC functions in the interest of investors
and in accordance with the Securities and Exchange Board of India (Mutual Funds)
Regulations, 1996, the provisions of the Trust Deed and the Offer Documents of the
respective Schemes. At least 2/3rd directors of the Trustee are independent directors
who are not associated with the Sponsor in any manner.
Asset Management Company (AMC)
The AMC is appointed by the Trustee as the Investment Manager of the
Mutual Fund. The AMC is required to be approved by the Securities and Exchange
Board of India (SEBI) to act as an asset management company of the Mutual Fund. At
least 50% of the directors of the AMC are independent directors who are not
associated with the Sponsor in any manner. The AMC must have a net worth of at
least 10 crores at all times.
Registrar and Transfer Agent
The AMC if so authorized by the Trust Deed appoints the Registrar and
Transfer Agent to the Mutual Fund. The Registrar processes the application form,
redemption requests and dispatches account statements to the unit holders.
Custodian
A custodian handles the investment back office of a mutual fund. Its responsibilities
include receipt and delivery of securities, collection of income, distribution of dividends, and segregation of assets between schemes.
45

8/8/2019 Lokesh Final for Spiral
http://slidepdf.com/reader/full/lokesh-final-for-spiral 46/112
4. MUTUAL FUND OPERATION:
HOW DOES A MUTUAL FUND WORK ?
Mutual Fund Operation Flow Chart
46

8/8/2019 Lokesh Final for Spiral
http://slidepdf.com/reader/full/lokesh-final-for-spiral 47/112
5. TYPES OF MUTUAL FUND:
47

8/8/2019 Lokesh Final for Spiral
http://slidepdf.com/reader/full/lokesh-final-for-spiral 48/112
A Mutual Fund may float several schemes, which may be classified on the
basis of its structure, its investment objectives and other objectives.
Type of Mutual Fund on the bases of constitution:
Open – Ended Schemes
As the name implies the size of the scheme (fund) is open – i.e. not specified
or pre-determined. Entry to the fund is always open, the investor who can subscribe at
anytime. Such fund stands ready to buy or sell its securities at anytime. The key
feature of Open-ended schemes is Liquidity. It implies that the capitalization of the
fund is constantly changing as investors sell or buy their shares. Further, the shares or
units are normally not traded on the stock exchange but are repurchased by the funds
at announced rates. Open-ended schemes have comparatively better liquidity despite
the fact that these are not listed. The reason is that investors can any time approach
mutual fund for sale of such units. No intermediaries are required. Moreover, the
realizable amount is certain since repurchase is at a price based on declared net asset
value (NAV). The portfolio mix of such schemes has to be investments, which are
actively traded in the market. Otherwise it will not be possible to calculate NAV. This
is the reason that generally open-ended schemes are equity based. In Open-ended
schemes, the option of dividend reinvestment is available.
Close-Ended Schemes
A Close – ended schemes have a definite period after which their shares/units
are redeemed. The scheme is open for subscription only during a specified period at
the time of launch of a scheme. Investors can invest in the scheme at the time of the
initial public issue and thereafter they can buy or sell the units of the scheme on the
stock exchanges where the units are listed. In order to provide an exit route to the
investors, some close-ended funds give an option of selling back the units to the
mutual fund through periodic repurchase at NAV related prices. In these types of
schemes, the size of the fund kept to be constant. SEBI regulations stipulate that at
least one of the two exit routes is provided to the investor i.e. either repurchase
facility or through listing on stock exchanges. These mutual funds schemes disclose NAV generally on weekly basis.
48
8/8/2019 Lokesh Final for Spiral
http://slidepdf.com/reader/full/lokesh-final-for-spiral 49/112
Interval schemes
Interval Schemes combine the features of both open-ended and close-ended
schemes. They are open for sale or redemption during pre-determined intervals at
NAV based prices.
Mutual Fund schemes by Investment Objectives:
EQUITY FUNDS
These funds invest a major part of their corpus in equities. The composition of the
fund may vary from scheme to scheme and the fund manager’s outlook on various
scrip’s. The Equity Funds are sub-classified depending upon their investment
objective, as follows:
1. Growth Fund:
Aim to provide capital appreciations over the medium to long term. These
schemes normally invest a majority of their funds in equities and are willing to bear
short term decline in value for possible future appreciation. These schemes are not for
investors seeking regular income or needing their money back in the short-term
2. Diversified Equity Fund:
Diversified equity funds are the most popular among investors. They invest in
many stocks across many sectors, and because they have the freedom to chop and
churn their portfolios as they like, diversified equity funds are a good proxy to the
stock market. If a general exposure to equities is what you want, they are a good
option. They can invest in all listed stocks, and even in unlisted stocks.
3. Equity – Linked Savings Schemes (ELSS):
Equity – linked savings schemes (ELSS) are diversified equity funds that
additionally offer income tax benefits to individuals. ELSS is one of the many section
49

8/8/2019 Lokesh Final for Spiral
http://slidepdf.com/reader/full/lokesh-final-for-spiral 50/112
80c instruments, along with the more popular debt options like the PPF, NSC and
infrastructure bonds. In this Section 80c grouping. ELSS is unique.
4. Index Fund:
An index fund is a diversified equity fund; with a difference- a fund manager has
absolutely no say in stock selection. At all times, the portfolio of an index fund
mirrors an index, both in its choice of stocks and their percentage holding. As of
March 2004, equity index funds tracked either the Sensex or the Nifty. So, an index
fund that mirrors the Sensex will invest only in the 30 Sensex stocks, which too in the
same proportion as their weight age in the index.
5. Sector Fund:
Sector funds invest in stocks from only one sector, or a handful of sectors. The
objective is to capitalize on the story in the sectors, and offer investors a window to
profit from such opportunities. It’s a very narrow focus, because of which sector
funds are considered the riskiest among all equity funds.
6. Mid – Cap Fund:
These are diversified funds that target companies on the fast – growth trajectory.
In the long run, share prices are driven by growth in a company’s turnover and profits.
Market players refer to them as ‘mid-sized companies’ and ‘mid-cap stocks’ with size
in this context being benchmarked to a company’s market value. So, while a typical
large cap stock would have a market capitalization of over Rs 1,000 crores, a mid-cap
stock would have a market value of Rs 250-2,000 crores.
50

8/8/2019 Lokesh Final for Spiral
http://slidepdf.com/reader/full/lokesh-final-for-spiral 51/112
DEBT FUNDS
These Funds invest a major portion of their corpus in debt papers. Government
authorities, private companies, banks and financial institutions are some of the major
issuers of debt papers. By investing in debt instruments, these funds ensure low risk
and provide stable income to the investors.
Debt funds are further classified as:
1. Gilt Funds:
Invest their corpus in securities issued by Government, popularly known as GOI
debt papers. These Funds carry zero Default risk but are associated with Interest Rate
risk. These schemes are safer as they invest in papers backed by Government.
2. Income Funds:
Income funds aim to maximize debt returns for the medium to longer term. Invest
a major portion into various debt instruments such as bonds, corporate debentures and
Government securities.
3. MIPs:
Invests around 80% of their total corpus in debt instruments while the rest of the
portion is invested in equities. It gets benefit of both equity and debt market. These
scheme ranks slightly high on the risk-return matrix when compared with other debt
schemes.
4. Short Term Plans (STPs):
Meant for investors with an investment horizon of 3-6 months. These funds
primarily invest in short term papers like Certificate of Deposits (CDs) and
Commercial Papers (CPs). Some portion of the corpus is also invested in corporate
debentures.
5. Liquid Funds:
Also known as Money Market Schemes, These funds are meant to provide easy
liquidity and preservation of capital. These schemes invest in short-term instruments
51

8/8/2019 Lokesh Final for Spiral
http://slidepdf.com/reader/full/lokesh-final-for-spiral 52/112
like Treasury Bills, inter-bank call money market etc. These funds are meant for
short-term cash management of corporate houses and are meant for an investment
horizon of 1day to 3 months. These schemes rank low on risk-return matrix and are
considered to be the safest amongst all categories of mutual funds.
6. Floating Rate Funds:
These income funds are more insulated from interest rate than their conventional
peers. In other words, interest rate changes, which cause the NAV of a conventional
debt fund to go up or down, have little, or no, impact on NAVs of floating rate funds.
BALANCED FUNDS
These funds, as the name suggests, are a mix of both equity and debt funds.
They invest in both equities and fixed income securities, which are in line with pre-
defined investment objective of the scheme. These schemes aim to provide investors
with the best of both the worlds. Equity part provides growth and the debt part
provides stability in returns.Each category of funds is backed by an investment
philosophy, which is pre-defined in the objectives of the fund. The investor can align
his own investment needs with the funds objective and invest accordingly.
HYBRID FUNDS
Growth and Income Fund:
Strike a balance capital appreciation and income for the investors. In these
funds portfolio is a mix between companies with good dividend paying record and
those with potential capital appreciation. These funds are less risky than growth funds
bit more than income funds.
52

8/8/2019 Lokesh Final for Spiral
http://slidepdf.com/reader/full/lokesh-final-for-spiral 53/112
6. COMPARISON OF MUTUAL FUND:
53
MutualFund
ObjectiveRisk
Investment
Portfolio
Who Should
Invest
Investment
Horizon
Equity
Funds
Long-term CapitalAppreciation
High Risk Stocks & SharesAggressive investors
Long term Inv.
3
years +
Balanced
Funds
Growth & Regular
Income
CapitalMarket Risk
and InterestRisk
Balanced ratio of equityand debt funds to ensure
higher returns at lower risk
Moderate &
Aggressive
2
years +
Index
Funds
To generate returnsthat arecommensurate withreturns of respectiveindices
NAV varieswith index
performance
Portfolio índices likeBSE, NIFTY etc
Aggressive investors.3
years +
Gilt Funds Security & IncomeInterest RateRisk
Government securitiesSalaried &conservative investors
12
months +
Bond
FundsRegular Income
Credit Risk &Interest RateRisk
Debentures,
Govt securities,Corporate Bonds
Salaried &conservative investors
12
months +
Money
Market
Liquidity +Moderate Income +Reservation of Capital
Negligible
Treasury Bills,Certificate of Deposits,Commercial Papers,Call Money
Park funds in currentA/cs or short-termBank Dep.
2 days
- 3 weeks
Short-termFunds
(Floating -
short-term)
Liquidity +Moderate Income
Little InterestRate
Call Money,CommPapers, TreasuryBills, CDs, Short-termGovt. securities.
Those with surplusshort-term funds
3 weeks -3 months

8/8/2019 Lokesh Final for Spiral
http://slidepdf.com/reader/full/lokesh-final-for-spiral 54/112
7. ADVANTAGES OF MUTUAL FUND:
Mutual Funds offer several benefits to an investor that are unmatched by the other
investment options. Last six years have been the most turbulent as well as exiting
ones for the industry. New players have come in, while others have decided to close
shop by either selling off or merging with others. Product innovation is now passé
with the game shifting to performance delivery in fund management as well as
service. Those directly associated with the fund management industry like
distributors, registrars and transfer agents, and even the regulators have become more
mature and responsible.
1. Affordability :
Small investors with low investment fund are unable to invest in high-grade or
blue chip stocks. An investor through Mutual Funds can be benefited from a portfolio
including of high priced stock.
2. Diversification :
Investor’s investment is spread across different securities (stocks, bonds, moneymarket, real estate, fixed deposits etc.) and different sectors (auto, textile, IT etc.).
54

8/8/2019 Lokesh Final for Spiral
http://slidepdf.com/reader/full/lokesh-final-for-spiral 55/112
This kind of a diversification add to the stability of returns, reduces the risk for
example during one period of time equities might underperform but bonds and money
market instruments might do well do well and may protect principal investment as
well as help to meet return objectives.
3. Variety :
Mutual funds offer a tremendous variety of schemes. This variety is beneficial in
two ways: first, it offers different types of schemes to investors
4. Professional Management:
Mutual Funds employ the services of experienced and skilled professionals and
dedicated investment research team. The whole team analyses the performance and
balance sheet of companies and selects them to achieve the objectives of the scheme.
5. Tax Benefits:
Depending on the scheme of mutual funds, tax shelter is also available. As per the
Union Budget-99, income earned through dividends from mutual funds is 100% tax
free. Under ELSS of open-ended equity-oriented funds an exemption is provided up
to Rs. 100,000/- under section 80C.
6. Regulation:
All Mutual Funds are registered with SEBI and they function within the
provisions of strict regulations designed to protect the interests of investors. The
operations of Mutual Funds are regularly monitored by SEBI.
55

8/8/2019 Lokesh Final for Spiral
http://slidepdf.com/reader/full/lokesh-final-for-spiral 56/112
8. DISADVANTAGES OF MUTUAL FUND:
The following are the disadvantages of investing through mutual fund:
• No control over cost:
Since investors do not directly monitor the fund’s operations, they cannot control the
costs effectively. Regulators therefore usually limit the expenses of mutual funds.
• No tailor-made portfolio:
Mutual fund portfolios are created and marketed by AMCs, into which investors
invest. They cannot made tailor made portfolio.
• Managing a portfolio of funds:
As the number of funds increase, in order to tailor a portfolio for himself, an investor
may be holding portfolio funds, with the costs of monitoring them and using hem,
being incurred by him.
• Delay in Redemption:
The redemption of the funds though has liquidity in 24-hours to 3 days takes formalapplication as well as needs time for redemption. This becomes cumbersome for the
investors.
• Non-availability of loans:
Mutual funds are not accepted as security against loan. The investor cannot deposit
the mutual funds against taking any kind of bank loans though they may be his assets.
56

8/8/2019 Lokesh Final for Spiral
http://slidepdf.com/reader/full/lokesh-final-for-spiral 57/112
9. RISK INVOLVED IN MUTUAL FUND:
THE RISK-RETURN TRADE-OFF
The most important relationship to understand is the risk-return trade-off.
Higher the risk greater the returns/loss and lower the risk lesser the returns/loss.
Hence it is up to you, the investor to decide how much risk you are willing to take. Inorder to do this you must first be aware of the different types of risks involved with
your investment decision.
MARKET RISK:
Sometimes prices and yields of all securities rise and fall. Broad outside
influences affecting the market in general lead to this. This is true, may it be big
corporations or smaller mid-sized companies. This is known as Market Risk. A
Systematic Investment Plan (“SIP”) that works on the concept of Rupee Cost
Averaging (“RCA”) might help mitigate this risk.
CREDIT RISK:
The debt servicing ability (may it be interest payments or repayment of
principal) of a company through its cash flows determines the Credit Risk faced by
you. This credit risk is measured by independent rating agencies like CRISIL who rate
companies and their paper
57

8/8/2019 Lokesh Final for Spiral
http://slidepdf.com/reader/full/lokesh-final-for-spiral 58/112
INFLATION RISK:
Things you hear people talk about: “Rs. 100 today is worth more than Rs. 100
tomorrow.” “Remember the time when a bus ride costed 50 paisa?”
“Mehangai Ka Jamana Hai.”
The root cause, Inflation. Inflation is the loss of purchasing power over time.
A lot of times people make conservative investment decisions to protect their capital
but end up with a sum of money that can buy less than what the principal could at the
time of the investment. This happens when inflation grows faster than the return on
your investment. A well-diversified portfolio with some investment in equities might
help mitigate this risk.
INTEREST RATE RISK:
In a free market economy interest rates are difficult if not impossible to
predict. Changes in interest rates affect the prices of bonds as well as equities. If
interest rates raise the prices of bonds fall and vice versa. Equity might be negatively
affected as well in a rising interest rate environment. A well-diversified portfolio
might help mitigate this risk.
POLITICAL/GOVERNMENT POLICY RISK:
Changes in government policy and political decision can change the
investment environment. They can create a favourable environment for investment or
vice versa. LIQUIDITY RISK:
Liquidity risk arises when it becomes difficult to sell the securities that one
has purchased. Liquidity Risk can be partly mitigated by diversification, staggering of
maturities as well as internal risk controls that lean towards purchase of liquid
securities.
58

8/8/2019 Lokesh Final for Spiral
http://slidepdf.com/reader/full/lokesh-final-for-spiral 59/112
10. NET ASSET VALUE:
Net Asset Value (NAV)
The net asset value of the fund is the cumulative market value of the assetsfund net of its liabilities. In other words, if the fund is dissolved or liquidated, by
selling off all the assets in the fund, this is the amount that the shareholders would
collectively own. This gives rise to the concept of net asset value per unit, which is
the value, represented by the ownership of one unit in the fund. It is calculated simply
by dividing the net asset value of the fund by the number of units. However, most
people refer loosely to the NAV per unit as NAV, ignoring the "per unit". We also
abide by the same convention.
Definition of NAV
Net Asset Value, or NAV, is the sum total of the market value of all the shares
held in the portfolio including cash, less the liabilities, divided by the total number of
units outstanding. Thus, NAV of a mutual fund unit is nothing but the 'book value.'
Calculation of NAV
The most important part of the calculation is the valuation of the assets owned
by the fund. Once it is calculated, the NAV is simply the net value of assets divided
by the number of units outstanding. The detailed methodology for the calculation of
the asset value is given below.
Asset value is equal to
Sum of market value of shares/debentures
+ Liquid assets/cash held, if any
+ Dividends/interest accrued Amount due on unpaid assets Expenses accrued but not
paid
59

8/8/2019 Lokesh Final for Spiral
http://slidepdf.com/reader/full/lokesh-final-for-spiral 60/112
NAV per unit = Other liabilities/ No. of units outstanding of the scheme
Details on the above items
For liquid shares/debentures, valuation is done on the basis of the last or closing
market price on the principal exchange where the security is traded.
For illiquid and unlisted and/or thinly traded shares/debentures, the value has to be
estimated. The value of fixed interest bearing securities moves in a direction opposite
to interest rate changes Valuation of debentures and bonds is a big problem since most
of them are unlisted and thinly traded. This gives considerable leeway to the AMCs
on valuation and some of the AMCs are believed to take advantage of this and adopt
flexible valuation policies depending on the situation.
Interest is payable on debentures/bonds on a periodic basis say every 6
months. But, with every passing day, interest is said to be accrued, at the daily interest
rate, which is calculated by dividing the periodic interest payment with the number of
days in each Period. Thus, accrued interest on a particular day is equal to the daily
interest rate multiplied by the number of days since the last interest payment date.
Usually, dividends are proposed at the time of the Annual General meetingand become due on the record date. There is a gap between the dates on which it
becomes due and the actual payment date. In the intermediate period, it is deemed to
be "accrued".
Expenses including management fees, custody charges etc. are calculated on a daily
basis.
NAV and its impact on the returns
We feel that a MF with lower NAV will give better returns. This again is due
to the wrong perception about NAV. An example will make it clear that returns are
independent of the NAV.
Say, you have Rs 10,000 to invest. You have two options, wherein the funds
are same as far as the portfolio is concerned. But say one Fund X has an NAV of Rs
10 and another Fund Y has NAV of Rs 50. You will get 1000 units of Fund X or 200
units of Fund Y.
60

8/8/2019 Lokesh Final for Spiral
http://slidepdf.com/reader/full/lokesh-final-for-spiral 61/112
After one year, both funds would have grown equally as their portfolio is
same, say by 25%. Then NAV after one year would be Rs 12.50 for Fund X and Rs
62.50 for Fund Y. The value of your investment would be 1000*12.50 = Rs 12,500
for Fund X and 200*62.5 = Rs 12,500 for Fund Y. Thus your returns would be same
irrespective of the NAV.
It is quality of fund, which would make a difference to your returns. In fact
for equity shares also broadly this logic would apply.
Misconception about NAV
This situation arises from the perception that a fund at Rs 10 is cheaper than
say Rs 15 or Rs 100. However, this perception is totally wrong and investors would
be much better off once they appreciate this fact.
Two funds with same portfolio are same, no matter what their NAV is. NAV
is immaterial. Why people carry this perception is because they assume that the NAV
of a MF is similar to the market price of an equity share. This, however, is not true.
61

8/8/2019 Lokesh Final for Spiral
http://slidepdf.com/reader/full/lokesh-final-for-spiral 62/112
11 . BASIC CONCEPTS OF LOADS:
1. Entry Load:
The load charged at the time of investment is known as entry load. It’s meant tocover the cost that the AMC spends in the process of acquiring subscriber’s
commission payable to brokers, advertisements, register expenses etc. The load is
recovered by way of charging a sale price higher than the prevailing NAV.
2. Exist Load:
Some AMC do not charge an entry load but they charged an exist load i.e., they
deduct a load before paying out the redemption proceeds. Psychologically, investors
are much more willing to pay exist loads as compared to entry loads.
3. Unit:
Units mean the investment of the unit holders in a scheme. Each unit represents one
undivided share in the assets of a scheme. The value of each unit changes, depending
on the performance of the fund.
62

8/8/2019 Lokesh Final for Spiral
http://slidepdf.com/reader/full/lokesh-final-for-spiral 63/112
12. FACTORS AFFECTING MUTUAL FUND:
1. Governmental Influences
Mutual fund business is a highly regulated business throughout the world as itseeks to ensure that quality and fairly priced schemes are available. Governmental
intervention thus in mutual fund market usually is most needed to ensure that insurers
are reliable. And in the developing countries the additional goal may be promotion of
domestic mutual fund industry and ensuring the national mutual fund industry
contributes to overall economic development. In a non technical sense mutual fund is
purchased in a good faith so the duty of government intervention in mutual fund
industry is to ensure that this principle of mutual fund is never defeated.
The ideology of government plays an important role in mutual fund industry also. For
example in the past during 1991, the P .V Narsimha Rao government strongly
believed in liberalization also liberalized the mutual fund sector which helped to allow
private players in the industry from 1993 and enhancing joint ventures with foreign
companies.
The present government with more focuses on foreign direct investments has declared
to favor the rise FDI in mutual fund to 49% which further enhances competition in the
industry.
2. Taxation Policy
Social equity being one of the motives behind tax collections, government gives
certain exemptions from such levying. One such exemption is deduction incurred by
taxpayers towards investment in mutual fund coverage. Similarly, capital invested in
infrastructure bonds etc is offered with certain concession under tax laws. The central
idea behind such exemptions is that the capitals so allocated by individuals reduce the
ultimate burden on the public infrastructure or helps in creating such infrastructural
facilities.
63

8/8/2019 Lokesh Final for Spiral
http://slidepdf.com/reader/full/lokesh-final-for-spiral 64/112
The income tax rules related to the mutual fund transactions can be classified
under:
A. Exemptions available to companies
• Expenses deductible from commission earned by distributor, banker, national
distributor.
• Tax concessions under risk management practices of an enterprise
• In growth option equity schemes there no long term capital gain by company.
• In dividend option equity schemes there no tax.
• Return received by charitable trust is total exempted from tax.
64

8/8/2019 Lokesh Final for Spiral
http://slidepdf.com/reader/full/lokesh-final-for-spiral 65/112
B. Tax rules governing investment by individuals
Deduction in respect of ELSS schemes (sec 80C): Investment in this fund
would enable you to avail the benefits under clause (xiii) of a section 80C of the
Income Tax Act investment made in the schemes up to 1 lakh by the eligible investor
for deduction under this section of the Act.
Since it will be an income deduction an investment of Rs 1 lakh in this fund
can save off Rs. 33600 from your tax payable liability (assuming you are in the
highest tax bracket).
Investor will receive tax free dividend in above case.
Investor will also receive tax free dividend by investing equity schemes in
dividend option Investors also receive tax free return by investing equity schemes in
growth option for long term capital gain.
Tax planning’s
An individual can think of health ELSS schemes purchase as a tool of tax planning exercise. For example people who are marginally affected by tax liability
can be as well purchase an ELSS fund get benefits of Rs. 33600 from tax. In this way
tax burden is become less by purchasing ELSS fund. Thus tax law offer benefit to
individuals/companies by way of exemptions/deductions of expenditure incurred
towards purchase of mutual fund various schemes coverage from total taxable
income.
3. Foreign Trade Regulations
With the vast potential for mutual fund in India due its large population in the country
many foreign companies are ready to enter into the Indian market. But companies can
be permitted in India through joint ventures with an Indian partner as well as come
separately and the foreign equity shall be restricted to only 25%. Another statement
also tells that Indian subsidiaries of foreign companies shall not be allowed to
participate in banking sector unless they entered in to joint ventures with the Indian
partners.
65
8/8/2019 Lokesh Final for Spiral
http://slidepdf.com/reader/full/lokesh-final-for-spiral 66/112
But at present the mutual fund regulator is in favor of hike in FDI cap from
25% to 49%, and is finalizing a report that will be submitted to the government for a
comprehensive legislation for the industry. The security exchange board of India and
association of mutual fund India have been advocating a hike in FDI limit for mutual
fund companies so that the foreign partners can infuse additional funds in these
companies to sustain their growth.
The government will need to amend the separate mutual fund Act for FDI capital as
well as domestic company as this is the statutory provision unlike sectors like civil
aviation and telecom, which have come through notification.
4. National Income
The relative importance of the mutual fund Market within a country will also
be dependent upon economic development. With greater rates of economic growth,
consumption of investment should increase as a result of increased income, and an
increased stock of assets requiring mutual fund. Furthermore, the development of
mutual fund is likely to facilitate greater economic growth, implying that economic
growth may be endogenous. Consistent with these arguments, studies find that the
level of financial development and economic development are positively related to thelevel of mutual fund across emerging markets.
5. Consumptions and Savings
The gross capital formation of any country is important for indication of its
growth in the future years. It is quite necessary to set up the rate of capital formation
so that a large stock of machines, tools and equipments are accumulated in a country.
Experience of development in other countries suggests that a high rate of capital
formation was achieved to trigger rapid rate of economic growth. With the hike in
foreign capital coming to India the rate of capital formation is becoming boom to
insurers, which has given them opportunities. It is heartening to them to note that
latest savings rate of 28% is highest till now and with the growth rate near to 8% is
bringing a pool of buyer’s purchasing power. This directly influences the demand for
mutual fund products.
6. Employment
66

8/8/2019 Lokesh Final for Spiral
http://slidepdf.com/reader/full/lokesh-final-for-spiral 67/112
The effect of employment on mutual fund industry is as direct as that on
economic development of any country. With the rising levels of employment the
effect on mutual fund industry is positive because employment adds to the insured
properties and assets from every prospective be it due to organized or unorganized.
7. Inflation
The midterm policy review the strong macroeconomic indicators and RBI has
revised its GDP growth estimates to the upper limit of the earlier projection range 8%
inflation (WPI) has been steadily moving up in recent times and RBI has highlighted
that primary articles prices have been one of the key contributors. However one needs
to keep in mind that recent increase in global oil prices.
8. Money supply
The central banks has indicated that credit growth and money supply number
are likely to be above its prosecution for the current fiscal year, the statement “to
consider promptly all possible measures as appropriate to the evolving global and
domestics situation “is indicative of phased increase in FII limits for gilt investment
could help in depending the securities market and is part of the road map towards
fuller convertibility.
9. Interest
Interest is major factor for investment when a person find less return from investment
tool than people move towards the higher returns tool of investment.\
10. Risk factor
All investments in Mutual Fund and securities are subject to market risks and the
NAV of the fund may go up or down depending on the factors and forces affecting the
security market. There can be no assurance that the fund’s objective will be achieved.
Past performance of the sponsors/Mutual fund/schemes/AMC is not necessarily
indicative of the future results. The name of the schemes does not in any manner
indicate their quality, their future prospects or returns.
The specific risk would be credit, market, illiquidity, judgmental error, interest rate,
swaps and forward rates.
67

8/8/2019 Lokesh Final for Spiral
http://slidepdf.com/reader/full/lokesh-final-for-spiral 68/112
11. Demographic environment
The demographic environment significantly affects the demand for the mutual fund
industry. Factors like the average age of the population, levels of education,
household structures income distribution, life style and the extent of industrialization
as well as urbanization terribly influences the demand of mutual fund schemes.
In India the average age of the population is at an increasing trend following the
improved medical technology and better awareness of health care requirements. As a
result, the risk of investment death is decreasing while connectivity is increasing.
Simultaneously the demand for pension funds and income fund is expected to grow.
For example at the time of independence the average age of dying for Indians was 45.
Presently it has increased to 65 following better healthcare, improvements in medical
science and more health consciousness among the common man. By 2010 it is
expected to rise to 75. Hence risk profile is also changing. Earlier people are thinking
about safely but at present people thinking about capital growth.
12. Social Factors
The social environment covers the customs, habits, level of education, tastes andstandard of living of people in the society. Today’s social environment is greatly
influenced to a major extent by the changes in technological aspects. With the rapid
progress in technology and economic liberalization, the physical boundaries are
gradually vanishing. As a result, the social life of the people and their views towards
risk and uncertainty of life and health are gradually changing.
68

8/8/2019 Lokesh Final for Spiral
http://slidepdf.com/reader/full/lokesh-final-for-spiral 69/112
Guidelines of the SEBI for Mutual Fund Companies:
Various investment options in Mutual Funds offer
To cater to different investment needs, Mutual Funds offer various investment
options. Some of the important investment options include:
Growth Option:
Dividend is not paid-out under a Growth Option and the investor realizes only the
capital appreciation on the investment (by an increase in NAV).
Dividend Payout Option:
Dividends are paid-out to investors under the Dividend Payout Option. However, the
NAV of the mutual fund scheme falls to the extent of the dividend payout.
Dividend Re-investment Option:
Here the dividend accrued on mutual funds is automatically re-invested in purchasing
additional units in open-ended funds. In most cases mutual funds offer the investor an
option of collecting dividends or re-investing the same.
Retirement Pension Option:
Some schemes are linked with retirement pension. Individuals participate in these
options for themselves, and corporate participate for their employees.
Insurance Option:
Certain Mutual Funds offer schemes that provide insurance cover to investors as an
added benefit.
Systematic Investment Plan (SIP):
Here the investor is given the option of preparing a pre-determined number of post-
dated cheques in favour of the fund. The investor is allotted units on a predetermined
date specified in the offer document at the applicable NAV.
69

8/8/2019 Lokesh Final for Spiral
http://slidepdf.com/reader/full/lokesh-final-for-spiral 70/112
Systematic Withdrawal Plan (SWP):
As opposed to the Systematic Investment Plan, the Systematic Withdrawal Plan
allows the investor the facility to withdraw a pre-determined amount / units from his
fund at a pre-determined interval. The investor's units will be redeemed at the
applicable NAV as on that day.
13. MUTUAL FUND PLAYERS:
The Indian mutual fund industry is mainly divided into three kinds of categories.
These categories include public sector players, nationalized banks and private sector
and foreign players.
UTI Mutual Fund was one of the leading Mutual Fund companies in India till May
2006 with a corpus of more than Rs.31, 000 Crore and it is the public sector mutual
fund.Bank of Baroda, PuJ.M.Financial servicesab National Bank, Can Bank and SBI
are the major nationalized banks mutual fund.
At present mutual fund industry is mainly dominated by private and foreign sector
players which include major players like Prudential ICICI Mutual Fund, HDFCMutual Fund, Reliance Mutual Fund etc. are private sector mutual funds players while
Franklin Templeton etc. are major foreign mutual fund players. At present there are
more than 33 players operating in Indian. The brief introduction of major players is
given as follows.
ABN AMRO Mutual Fund
ABN AMRO Mutual Fund was setup on April 15, 2004 with ABN AMRO Trustee
(India) Pvt. Ltd. as the Trustee Company. The AMC, ABN AMRO Asset
Management (India) Ltd. was incorporated on November 4, 2003. Deutsche Bank A
G is the custodian of ABN AMRO Mutual Fund.
Birla Sun Life Mutual Fund
70

8/8/2019 Lokesh Final for Spiral
http://slidepdf.com/reader/full/lokesh-final-for-spiral 71/112
Birla Sun Life Mutual Fund is the joint venture of Aditya Birla Group and Sun Life
Financial. Sun Life Financial is a global organization evolved in 1871 and is being
represented in Canada, the US, the Philippines, Japan, Indonesia and Bermuda apart
from India. Birla Sun Life Mutual Fund follows a conservative long-term approach to
investment. Recently it crossed AUM of Rs. 10,000 Crore.
Bank of Baroda Mutual Fund
Bank of Baroda Mutual Fund or BOB Mutual Fund was setup on October 30, 1992
under the sponsorship of Bank of Baroda. BOB Asset Management Company Limited
is the AMC of BOB Mutual Fund and was incorporated on November 5, 1992.
Deutsche Bank AG is the custodian.
HDFC Mutual Fund
HDFC Mutual Fund was setup on June 30, 2000 with two sponsors namely Housing
Development Finance Corporation Limited and Standard Life Investments Limited.
HSBC Mutual Fund
HSBC Mutual Fund was setup on May 27, 2002 with HSBC Securities and Capital
Markets (India) Private Limited as the sponsor. Board of Trustees, HSBC Mutual
Fund acts as the Trustee Company of HSBC Mutual Fund.
ING Vysya Mutual Fund
ING Vysya Mutual Fund was setup on February 11, 1999 with the same named
Trustee Company. It is a joint venture of Vysya and ING. The AMC, ING Investment
Management (India) Pvt. Ltd. was incorporated on April 6, 1998.
Prudential ICICI Mutual Fund
71

8/8/2019 Lokesh Final for Spiral
http://slidepdf.com/reader/full/lokesh-final-for-spiral 72/112
The mutual fund of ICICI is a joint venture with Prudential PLC of America; one of
the largest life insurance companies in the US of A. Prudential ICICI Mutual Fund
was setup on 13th of October 1993 with two sponsors, Prudential PLC. and ICICI
Ltd. The Trustee Company formed is Prudential ICICI Trust Ltd. and the AMC is
Prudential ICICI Asset Management Company Limited incorporated on 22 nd of June
1993.
Sahara Mutual Fund
Sahara Mutual Fund was set up on July 18, 1996 with Sahara India Financial
Corporation Ltd. as the sponsor. Sahara Asset Management Company Private Limited
incorporated on August 31, 1995 works as the AMC of Sahara Mutual Fund. The
paid-up capital of the AMC stands at Rs 25.8 crore.
State Bank of India Mutual Fund
State Bank of India Mutual Fund is the first Bank sponsored Mutual Fund to launch
offshore fund, the India Magnum Fund with a corpus of Rs. 225 cr. approximately.
Today it is the largest Bank sponsored Mutual Fund in India. They have already
launched 35 Schemes out of which 15 have already yielded handsome returns to
investors. State Bank of India Mutual Fund has more than Rs. 5,500 Crore as AUM.
Now it has an investor base of over 8 Lakhs spread over 18 schemes.
Tata Mutual Fund
Tata Mutual Fund (TMF) is a Trust under the Indian Trust Act, 1882. The sponsor for
Tata Mutual Fund is Tata Sons Ltd., and Tata Investment Corporation Ltd. The
investment manager is Tata Asset Management Limited and its Tata Trustee
Company Pvt. Limited. Tata Asset Management Limited's is one of the fastest in the
country with more than Rs. 7,703 Crore (as on April 30, 2005) of AUM.
Kotak Mahindra Mutual Fund
72

8/8/2019 Lokesh Final for Spiral
http://slidepdf.com/reader/full/lokesh-final-for-spiral 73/112
Kotak Mahindra Asset Management Company (KMAMC) is a subsidiary of KMBL.
It is presently having more than 1,99,818 investors in its various schemes. KMAMC
started its operations in December 1998. Kotak Mahindra Mutual Fund offers
schemes catering to investors with varying risk - return profiles. It was the first
company to launch dedicated gilt scheme investing only in government securities.
Reliance Mutual Fund
Reliance Mutual Fund (RMF) was established as trust under Indian Trusts Act, 1882.
The sponsor of RMF is Reliance Capital Limited and Reliance Capital Trustee Co.
Limited is the Trustee. It was registered on June 30, 1995 as Reliance Capital Mutual
Fund, which was changed on March 11, 2004. Reliance Mutual Fund was formed for
launching of various schemes under which units are issued to the Public with a view
to contribute to the capital market and to provide investors the opportunities to make
investments in diversified securities.
Standard Chartered Mutual Fund
Standard Chartered Mutual Fund was set up on March 13, 2000 sponsored by
Standard Chartered Bank. The Trustee is Standard Chartered Trustee Company Pvt.
Ltd. Standard Chartered Asset Management Company Pvt. Ltd. is the AMC which
was incorporated with SEBI on December 20,1999.
Franklin Templeton India Mutual Fund
The group, Franklin Templeton Investments is a California (USA) based company
with a global AUM of US$ 409.2 bn. (as of April 30, 2005). It is one of the largest
financial services groups in the world. Investors can buy or sell the Mutual Fund
through their financial advisor or through mail or through their website. They have
Open end Diversified Equity schemes, Open end Sector Equity schemes, Open end
Hybrid schemes, Open end Tax Saving schemes, Open end Income and Liquid
schemes, Closed end Income schemes and Open end Fund of Funds schemes to offer.
73

8/8/2019 Lokesh Final for Spiral
http://slidepdf.com/reader/full/lokesh-final-for-spiral 74/112
Morgan Stanley Mutual Fund India
Morgan Stanley is a worldwide financial services company and it’s leading in the
market in securities, investment management and credit services. Morgan Stanley
Investment Management (MISM) was established in the year 1975. It provides
customized asset management services and products to governments, corporations,
pension funds and non-profit organizations. Its services are also extended to high net
worth individuals and retail investors. This is the first close end diversified equity
scheme serving the needs of Indian retail investors focusing on a long-term capital
appreciation.
Escorts Mutual Fund
Escorts Mutual Fund was setup on April 15, 1996 with Escorts Finance Limited as its
sponsor. The Trustee Company is Escorts Investment Trust Limited. Its AMC was
incorporated on December 1, 1995 with the name Escorts Asset Management
Limited.
Benchmark Mutual Fund
Benchmark Mutual Fund was setup on June 12, 2001 with Niche Financial Services
Pvt. Ltd. as the sponsor and Benchmark Trustee Company Pvt. Ltd. as the Trustee
Company. Incorporated on October 16, 2000 and headquartered in Mumbai,
Benchmark Asset Management Company Pvt. Ltd. is the AMC.
Chola Mutual Fund
Chola Mutual Fund under the sponsorship of Cholamandalam Investment & Finance
Company Ltd. was setup on January 3, 1997. Cholamandalam Trustee Co. Ltd. is the
Trustee Company and AMC is Cholamandalam AMC Limited.
74

8/8/2019 Lokesh Final for Spiral
http://slidepdf.com/reader/full/lokesh-final-for-spiral 75/112
LIC Mutual Fund
Life Insurance Corporation of India set up LIC Mutual Fund on 19th June 1989. It
contributed Rs. 2 Crore towards the corpus of the Fund. LIC Mutual Fund was
constituted as a Trust in accordance with the provisions of the Indian Trust Act, 1882.
. The Company started its business on 29th April 1994. The Trustees of LIC Mutual
Fund have appointed Jeevan Bima Sahayog Asset Management Company Ltd as the
Investment Managers for LIC Mutual Fund.
GIC Mutual Fund
GIC Mutual Fund, sponsored by General Insurance Corporation of India (GIC), a
Government of India undertaking and the four Public Sector General Insurance
Companies, viz. National Insurance Co. Ltd (NIC), The New India Assurance Co.
Ltd. (NIA), The Oriental Insurance Co. Ltd (OIC) and United India
75
8/8/2019 Lokesh Final for Spiral
http://slidepdf.com/reader/full/lokesh-final-for-spiral 76/112
PART – II – PROJECT STUDY
Research Methodology:
Research Problem
To know the investment behavior of different investors in Baroda city.
Research Objective
The main objective of the project is to study the risk taking ability and investment
pattern of the investor.
Subsidiary Objective
1. To know in which proportion does investors invest in different financial
instruments.
2. To know the priority level between different factors related to investment like
safety, return and risk.
3. To study growth of different financial instruments.
4. To know the main parameters to measure risk and return, so we may raise best
performing portfolio.
5. Investors’ reason for investment.
Research Design
• In the context of this project report, I have utilized descriptive research design.
• Survey method will be also used for the research. Survey should be conducted
by questionnaire method.
76

8/8/2019 Lokesh Final for Spiral
http://slidepdf.com/reader/full/lokesh-final-for-spiral 77/112
Sampling Plan
Q.1 what is the target population?
- All the financial investors, resident in Baroda city.
Q.2 what are the parameters of interest?
- The risk taking ability and investment pattern of the investors.
Q.3 what is the sampling frame?
- Customers of J.M.FINANCIAL SERVICES and professional investors at
V.S.C.
Q.4 what is the appropriate sampling method?
- In the context of this project which is based on survey, the best method would
be “non probability convenience sampling method”, mainly because investors
could not be interviewed as per our requirements, but according to their
availability and accessibility to meet them.
Q.5 what is the sample size?
- The sample size is of 100 samples, because of limitation of time and resources
and comfort ability of analysis.
Data collection plan
Primary data: - primary data will been collected through questioner for
this research project.
Secondary data:-
• Return and past performance are collected from internet and
database of J.M.FINANCIAL SERVICES I.
• Factsheets of J.M.FINANCIAL SERVICES publication was
referred to gather some data.
77

8/8/2019 Lokesh Final for Spiral
http://slidepdf.com/reader/full/lokesh-final-for-spiral 78/112
Benefits of the Study
Study is helpful to J.M.FINANCIAL SERVICES to know the investor’s
pattern for the investment.
Study is helpful to J.M.FINANCIAL SERVICES to know the expectation
of investors.
Study may even help AMC to offer better mutual fund schemes.
Study is helpful to me to get exposure regarding mutual fund industries.
Limitation of the study:
Every research has its own limitation and present research work is no exception to this
general rule the inherent limitation of the study are as under:
Questionnaire method can be used only when respondents are literate and co-
operative.
Sample size was 100 that are not enough to study the awareness of
Independent individuals.
As sampling techniques is convenient sampling so it may result in personal
bias. Even respondent give bias answers. Time is main constraint of the
research as we have been given project as well as study simultaneously.
This report is limited to research area in Baroda city’s financial investors only.
Time is main constraint of the research as the training period of 8 weeks is
short for such studies.
78

8/8/2019 Lokesh Final for Spiral
http://slidepdf.com/reader/full/lokesh-final-for-spiral 79/112
Q. what is your age?
20-30 46
30-40 16
40-50 13
50-60 14
Above 60 11
Total 100
From the above table we can say that awareness for investment in youngster
has been increased & that’s why out of 100, 46% are youngster who do investment
and they come in the age group of 20-30, then comes age group of 30-40 from which
16% people do investment and other age group are 40-50 where they do investment of
13%, 14%belongs to age group of 50-60 they do the investment, and 11%belongs to
the age group of 60-above they do their investment. We can say that youngsters are
more careful for their investment.
79

8/8/2019 Lokesh Final for Spiral
http://slidepdf.com/reader/full/lokesh-final-for-spiral 80/112

8/8/2019 Lokesh Final for Spiral
http://slidepdf.com/reader/full/lokesh-final-for-spiral 81/112
Q. what is your profession?
Business
Job In Private Sector
Job In Public Sector
Others
Total
Now 100 people doing investment out of which 45% people are from private
sector, 22% are from public sector, 10% are having their business and 23% are others
which include retired people, housewives and student. Reason for investment by all
81

8/8/2019 Lokesh Final for Spiral
http://slidepdf.com/reader/full/lokesh-final-for-spiral 82/112
people was to secure the future and reason given by people doing the job in private
was their higher salary and unsecured job.
82

8/8/2019 Lokesh Final for Spiral
http://slidepdf.com/reader/full/lokesh-final-for-spiral 83/112
Q. What is your Educational Qualification?
SSC 12
HSC 18
Graduation 37
Post Graduation 24
Professional Degree 9
Here it is clearly visible that Higher educated people are more aware aboutfinancial intruments, whereas less educated people i.e. SSC and HSC containing 30%
are less interested in financial instruments and do not have sufficient knowledge
regarding it.
This shows that Mutual Fund industry should target Graduate and Post Graduate
investors.
Q. What is the annual income of individual household?
83

8/8/2019 Lokesh Final for Spiral
http://slidepdf.com/reader/full/lokesh-final-for-spiral 84/112
Income No.
< 50000 11
50,000 - 1,49,999 57
1,50,000 - 2,99,999 27
3,00,000 - 4,99,999 4
5,00,000 - 9,99,999 1
> 10,00,000 0
The data here reflects that most of the investors belong mainly to the income group
Rs. 50,000-1,49,999 followed by the income group Rs. 1,50,000- 2,99,999.
So from this analysis we can conclude that as the income of individual falls in these
groups the amount of savings will be limited and they employee these savings in
various instruments to have both returns and risk coverage.So Mutual Fund plays a
major role in order to provide them good returns with limited risk and fund.
Q. Do you take Advise?
84

8/8/2019 Lokesh Final for Spiral
http://slidepdf.com/reader/full/lokesh-final-for-spiral 85/112
Yes 89
No 11
People now days are very busy and they do not have time to keep track of
markets and returns of financial avenues. Therefore, 89% of the investors do take
professional advice before taking any investment decision.
This shows the important of financial advisor and scope of it in near future.
85

8/8/2019 Lokesh Final for Spiral
http://slidepdf.com/reader/full/lokesh-final-for-spiral 86/112
Q. From whom you take advice?
Particular
Respondent
s Percentage
Professionals
Advisor 48 54
Relatives 29 33
Friends 12 13
Relatives 29 33
Friends 12 13
We can see that most of the investors prefer to go to professional advisor for
their financial quires. Still roll of relative and advice of friends remains the important
factors by investor point of view.
86

8/8/2019 Lokesh Final for Spiral
http://slidepdf.com/reader/full/lokesh-final-for-spiral 87/112
Q. how would you describe yourself as a risk taker?
Careless 02
Willing To Take Risk for Higher Returns 27
Can Take Calculated Risk 46
Low Risk Taking Capabilities 18
Extremely Averse to Risk 07
Here the interpretation can be made that most of the investors under our
survey are willing to take calculated risk. And it is followed by investors who are
willing to take risk for higher returns. This is a hint that’s shows that Mutual Fund
will gain more importance in near future.
This is an important question for our survey because we will suggest investment
patterns for them based on the risk taking abilities of individual investors. This will
also help them to achieve expected returns based on the amount of risk they take.
Q. Purpose of the execution of financial instruments’ transactions?
87

8/8/2019 Lokesh Final for Spiral
http://slidepdf.com/reader/full/lokesh-final-for-spiral 88/112

8/8/2019 Lokesh Final for Spiral
http://slidepdf.com/reader/full/lokesh-final-for-spiral 89/112
Q. Which factors you consider important while investing?
1 2 3 4 5
Savings 21 29 16 20 14 100
Regular Income 37 21 17 11 14 100
Purely Investment 17 18 25 19 21 100
Risk Coverage 16 21 23 21 19 100
Tax Benefit 9 11 19 29 32 100
100 100 100 100 100 500
Under our survey we noticed that many of the investors gave lot of importance to
Regular Income before investing which is very obvious.
It is interesting to see that Purely Investment is consider more important than
Risk coverage and yet the market share of Insurance is higher than that of Mutual
Fund and this is due to lack of awareness and some misconceptions regarding Mutual
Fund industries.
89

8/8/2019 Lokesh Final for Spiral
http://slidepdf.com/reader/full/lokesh-final-for-spiral 90/112
Q. Rating the financial instrument (1 highest and 4 least preferred)
Instruments 1 2 3 4 Total
Stocks 19 22 34 25 100
Mutual Funds 26 34 21 19 100
Insurance 37 25 21 17 100
Fixed Deposits 18 19 24 39 100
Total 100 100 100 100 400
Under our survey we have noticed that most of the investors preffer insurance as an
important investment opportunity our the other financial instruments as for them risk
coverage as an important factor.
Fixed deposits have lost its importance now a days and it is least preffered by the
investors.
Q. Purpose of Investment (Future Requirement)
90

8/8/2019 Lokesh Final for Spiral
http://slidepdf.com/reader/full/lokesh-final-for-spiral 91/112
Retirement 28
Marriage of Children 17
Education of Children 19
Medical Expenses 33
Others 3
Total 100
The data gives us an indication that individual are very conscious about their future
medical requirements and which by their retirement expenditure. Thus is a clear
indication that they give importance to their personal requirements rather than
institutional requirements.
Due to the inflation and Privatization of medical facilities the expenditure of various
medical requirements has increased which has given rise to its importance.
91

8/8/2019 Lokesh Final for Spiral
http://slidepdf.com/reader/full/lokesh-final-for-spiral 92/112
Q. Amount invested annually in various Instruments
Instruments < 50,000
50,000-
1,00,000
>
1,00,000 Total
Stocks 17 13 3 33
Mutual Funds 33 35 21 89
Insurance 39 41 20 100
Fixed
Deposits 13 11 7 31
The finding here states that most of the investors prefer to invest in Insurance and
Mutual Funds. Stocks being highly volatile very few investors prefer it, and in case of
Fixed Deposits the returns being low and fixed, there are only marginal investors who
prefer this.
The main instruments that they consider important are Insurance and Mutual Funds.
Here in our survey we have also found that all the investors prefer Insurance whereas
Mutual Fund is preferred only by 89% of investors.Whereas the least preferred
instrument is Fixed Deposits and Stocks, in case of FD it is due to low returns and
that over a long period of time.
92

8/8/2019 Lokesh Final for Spiral
http://slidepdf.com/reader/full/lokesh-final-for-spiral 93/112
Q. Experience in financial Instruments
Stocks
Mutual
Fund Insurance
Fixed
Deposit
No Experience 28 12 0 17
Between 1 to 5
years 48 61 72 36
More than 5 years 24 27 28 47
100 100 100 100
Fixed deposit being the safest and the oldest financial instrument most of the investors
have more experience in it. It also shows that investors are more aware about
Insurance and Mutual Fund industry.It also gave me an indication that they do not
have enough experience and fear from the volatility of the Stock market and as a
result of this the demand for Mutual Fund increased and its gaining its importance and
now standing in comparison with Insurance.
FINDINGS
93

8/8/2019 Lokesh Final for Spiral
http://slidepdf.com/reader/full/lokesh-final-for-spiral 94/112
From the above analysis, I found that even though certainly not the best or deepest of
markets in the world, it has ignited the growth rate in mutual fund industry to provide
reasonable options for an ordinary man to invest his savings.
Key Findings: -
Around 50% of the investors invest to maximize their returns and they are
ready to take moderate risk in their investment portfolio.
Most of the investors give importance to the fact that their investment should
grow in value over a period of time.
Risk coverage is the most preferred by the investors.
Knowledge about Mutual Funds and their various schemes is moderate among
investors.
It is necessary to make Mutual Fund more popular in the eyes of investors as
well as distributors and also cater trust which has been lost due to US-64.
89% of samples showed that they take advice from other people before
investing. This data shows that investors don’t have time to keep track of
market and they need professional advice.
Most of the investors give importance to return and risk coverage.
Objectives of the investors are to get something in return from their
investment and at minimum risk they are taking.
Here the objective of the investor between the ages of 20-30 is to earn the
higher return.
While the age group above 30years concentrates on risk coverage and tax
saving and they even take care of the liquidity.
94

8/8/2019 Lokesh Final for Spiral
http://slidepdf.com/reader/full/lokesh-final-for-spiral 95/112
DATA ANALYSIS-II
Pearson Chi-square:
The Pearson Chi-square is the most common test for significance of the relationship between categorical variables. This measure is based on the fact that we can computethe expected frequencies in a two-way table (i.e., frequencies that we would expect if there was no relationship between the variables). For example, suppose we ask 20males and 20 females to choose between two brands of soda pop (brands A and B). If there is no relationship between preference and gender, then we would expect aboutan equal number of choices of brand A and brand B for each sex. The Chi-square test
becomes increasingly significant as the numbers deviate further from this expected pattern; that is, the more this pattern of choices for males and females differs.
The value of the Chi-square and its significance level depends on the overall number
of observations and the number of cells in the table. Consistent with the principlesdiscussed in Elementary Concepts, relatively small deviations of the relativefrequencies across cells from the expected pattern will prove significant if the number of observations is large.
The only assumption underlying the use of the Chi-square (other than randomselection of the sample) is that the expected frequencies are not very small. Thereason for this is that, actually, the Chi-square inherently tests the underlying
probabilities in each cell; and when the expected cell frequencies fall, for example, below 5, those probabilities cannot be estimated with sufficient precision.
The formula for calculating chi-square ( X 2) is:
X 2= ∑ (o-e)2 /e
That is, chi-square is the sum of the squared difference between observed (o) and theexpected (e) data (or the deviation, d ), divided by the expected data in all possiblecategories.
Coefficient of Contingency:
The coefficient of contingency is a Chi-square based measure of the relation between
two categorical variables (proposed by Pearson, the originator of the Chi-square test).Its advantage over the ordinary Chi-square is that it is more easily interpreted, sinceits range is always limited to 0 through 1 (where 0 means complete independence).The disadvantage of this statistic is that its specific upper limit is "limited" by the sizeof the table; C can reach the limit of 1 only if the number of categories is unlimited.
95

8/8/2019 Lokesh Final for Spiral
http://slidepdf.com/reader/full/lokesh-final-for-spiral 96/112
a. AGE AND RISK PROFILE:
Hypothesis:
Null hypothesis: There is no association between investor’s Risk profile and Age of samples.Alternative hypothesis: Association exists between Risk profile and Age of samples.
age * risk profile Cross tabulation
Count
risk profile
TotalCareless
Willing To
Take Risk for
Higher
Returns
Can Take
Calculated
Risk
Low Risk
Taking
Capabilities
Extremely
Averse to
Risk
Age 20-30 1 7 27 9 2 46
30-40 1 2 9 3 1 16
40-50 0 6 4 3 0 13
50-60 0 5 7 1 1 14
50-60 0 2 6 2 1 11
Total 2 22 53 18 5 100
Chi-Square Tests
Value df
Asymp. Sig.
(2-sided)
Pearson Chi-Square 12.508a 16 .708
Likelihood Ratio 12.984 16 .674Linear-by-Linear
Association
.218 1 .640
N of Valid Cases 100
a. 18 cells (72.0%) have expected count less than 5. The
minimum expected count is .22.
96

8/8/2019 Lokesh Final for Spiral
http://slidepdf.com/reader/full/lokesh-final-for-spiral 97/112
Symmetric Measures
Value
Asymp. Std.
Error a Approx. T b Approx. Sig.
Interval by
Interval
Pearson's R -.047 .101 -.466 .643c
Ordinal by
Ordinal
Spearman
Correlation
-.087 .099 -.866 .389c
N of Valid Cases 100
a. Not assuming the null hypothesis.
b. Using the asymptotic standard error assuming the null hypothesis.
c. Based on normal approximation.
Interpretation:-
Here the Pearson Chi-Square value at 12 degree of freedom is 12.508a and its
significance value is 0. 708 which is more than 0.05, hence we fail to reject null
hypothesis.
So we conclude that there is no association between risk profile and age.
The contingency coefficient shows there is 87% relationship present between the
variables.
97

8/8/2019 Lokesh Final for Spiral
http://slidepdf.com/reader/full/lokesh-final-for-spiral 98/112
b. GENDER AND RISK PROFILE:
Hypothesis:
Null hypothesis: There is no association between investor’s Risk profile and Gender of samples.Alternative hypothesis: Association exists between Risk profile and Gender of samples.
Cross tabulation
Count
risk profile * gender Cross tabulation
Count
gender
TotalMale Female
risk profile Careless 2 0 2
Willing To Take Risk
for Higher Returns
22 0 22
Can Take Calculated
Risk
47 6 53
Low Risk Taking
Capabilities
15 3 18
Extremely Averse to
Risk
5 0 5
Total 91 9 100
Chi-Square Tests
98

8/8/2019 Lokesh Final for Spiral
http://slidepdf.com/reader/full/lokesh-final-for-spiral 99/112
Value df
Asymp. Sig. (2-
sided)
Pearson Chi-Square 12.508a
16 .708
Likelihood Ratio 12.984 16 .674
Linear-by-Linear Association .218 1 .640
N of Valid Cases 100
Symmetric Measures
ValueAsymp. Std.
Error a Approx. T b Approx. Sig.
Interval by
Interval
Pearson's R .120 .066 1.192 .236c
Ordinal by
Ordinal
Spearman
Correlation
.147 .071 1.472 .144c
N of Valid Cases 100
a. Not assuming the null hypothesis.
b. Using the asymptotic standard error assuming the null hypothesis.c. Based on normal approximation.
Interpretation:-
Here the Pearson Chi-Square value at 4 degree of freedom is 4.586 and its
significance value is 0.342 which is more than 0.05, hence we fail to reject null
hypothesis.
So we conclude that there is no association between risk profile and Gender.
The contingency coefficient shows there is 14.7% relationship present between the
variables.
99

8/8/2019 Lokesh Final for Spiral
http://slidepdf.com/reader/full/lokesh-final-for-spiral 100/112
OCCUPATION AND RISK PROFILE:
.Hypothesis:
Null hypothesis: There is no association between investor’s Risk profile andOccupation of samples.Alternative hypothesis: Association exists between Risk profile and Occupation of samples.
Cross tabulation
risk profile * occupation Cross tabulation
Count
occupation
TotalBusiness
Job In Private
Sector
Job In Public
Sector Others
risk profile Careless 0 0 1 1 2
Willing To Take Risk
for Higher Returns
6 5 4 7 22
Can Take Calculated
Risk
3 30 8 12 53
Low Risk Taking
Capabilities
1 7 8 2 18
Extremely Averse to
Risk
0 3 1 1 5
Total 10 45 22 23 100
Chi-Square Tests
Value df
Asymp. Sig. (2-
sided)
Pearson Chi-Square 22.572a 12 .032
Likelihood Ratio 21.746 12 .040
Linear-by-Linear Association .075 1 .784
N of Valid Cases 100
a. 13 cells (65.0%) have expected count less than 5. The minimum
expected count is .20.
100

8/8/2019 Lokesh Final for Spiral
http://slidepdf.com/reader/full/lokesh-final-for-spiral 101/112

8/8/2019 Lokesh Final for Spiral
http://slidepdf.com/reader/full/lokesh-final-for-spiral 102/112
1.1. INCOME AND RISK PROFILE:
Hypothesis: Null hypothesis: There is no association between investor’s Risk profile and Income
of samples.Alternative hypothesis: Association exists between Risk profile and Income of samples.
Cross tabulation
Crosstab
Count
income
< 5000050,000 -1,49,999
1,50,000 -2,99,999
3,00,000 -4,99,999
3,00,000 -4,99,999
risk_profile Careless 1 0 0 1 0
Willing To Take Risk
for Higher Returns
2 8 9 2 1
Can Take Calculated
Risk
6 37 10 0 0
Low Risk Taking
Capabilities
2 10 5 1 0
Extremely Averse to
Risk
0 2 3 0 0
Total 11 57 27 4 1
Chi-Square Tests
Value df
Asymp. Sig.
(2-sided)
Pearson Chi-Square 31.378a 16 .012
Likelihood Ratio 25.940 16 .055
Linear-by-Linear
Association
.803 1 .370
N of Valid Cases 100
102

8/8/2019 Lokesh Final for Spiral
http://slidepdf.com/reader/full/lokesh-final-for-spiral 103/112
Symmetric Measures
Value
Asymp. Std.
Error
a
Approx. T
b
Approx. Sig.Interval by
Interval
Pearson's R -.090 .121 -.895 .373c
Ordinal by
Ordinal
Spearman
Correlation
-.086 .118 -.853 .396c
N of Valid Cases 100
a. Not assuming the null hypothesis.
b. Using the asymptotic standard error assuming the null hypothesis.
c. Based on normal approximation.
Interpretation:-
Here the Pearson Chi-Square value at 6 degree of freedom is 16 and its significance
value is 0.012 which is less than 0.05, hence we reject null hypothesis.
So we accept alternative hypothesis that is association exists between risk profile and
Income.
The contingency coefficient shows there is 86% relationship present between thevariables
103

8/8/2019 Lokesh Final for Spiral
http://slidepdf.com/reader/full/lokesh-final-for-spiral 104/112
1.1. EDUCATION AND RISK PROFILE:
Hypothesis:
Null hypothesis: There is no association between investor’s Risk profile and
Education of samples.Alternative hypothesis: Association exists between Risk profile and Education of samples.
Cross tabulation
Crosstab
Count
education
TotalSSC HSC
Graduati
on
Post
Graduatio
n
Profession
al Degree
risk profile Careless 0 0 1 1 0 2
Willing To Take
Risk for Higher
Returns
2 5 9 4 2 22
Can Take
Calculated Risk
8 10 21 10 4 53
Low Risk Taking
Capabilities
2 3 4 7 2 18
Extremely Averse
to Risk
0 0 2 2 1 5
Total 12 18 37 24 9 100
104

8/8/2019 Lokesh Final for Spiral
http://slidepdf.com/reader/full/lokesh-final-for-spiral 105/112
Chi-Square Tests
Value df
A symp. Sig.
(2-sided)
Pearson Chi-Square 9.075a
16 .910
Likelihood Ratio 10.891 16 .816
Linear-by-Linear
Association
1.399 1 .237
N of Valid Cases 100
Symmetric Measures
Value
Asymp. Std.
Error a Approx. T b Approx. Sig.
Interval by
Interval
Pearson's R .119 .093 1.185 .239c
Ordinal by
Ordinal
Spearman
Correlation
.121 .099 1.205 .231c
N of Valid Cases 100
a. Not assuming the null hypothesis.
b. Using the asymptotic standard error assuming the null hypothesis.
c. Based on normal approximation.
Interpretation:-
Here the Pearson Chi-Square value at16 degree of freedom is 9.075 and its
significance value is 0.910 which is more than 0.05, hence we reject null hypothesis.
So we reject alternative hypothesis that is no association exists between risk profile
and education.
The contingency coefficient shows there is 11.9% relationship present between the
variables.
.
105

8/8/2019 Lokesh Final for Spiral
http://slidepdf.com/reader/full/lokesh-final-for-spiral 106/112
106

8/8/2019 Lokesh Final for Spiral
http://slidepdf.com/reader/full/lokesh-final-for-spiral 107/112
FINDINGS:
Risk profile decresses with the increase in age. So age and risk profile has the
negative correlation.
There is no significant association between gender and risk profile. Although
almost 91% of respondents were male.
There is strong association between risk profile and investment decisions.
Samples with high risk profile have mostly prefered equity as first priority of
investment and samples with low risk profile have prefered debt and bond.
The employee of private sector has high risk profile while self employed has
major samples of medium profile and employes of public sector has low risk
profile. The respondent of Surat City was business oriented and there was verysmall class of public sector employees and professionals.
Income of respondents and there risk profile have positive relationship i.e.
with the increase in income there risk taking ability increases.
Most of the respondent were highly educated and there was significant
association between education level of respondent and there risk profile.
107
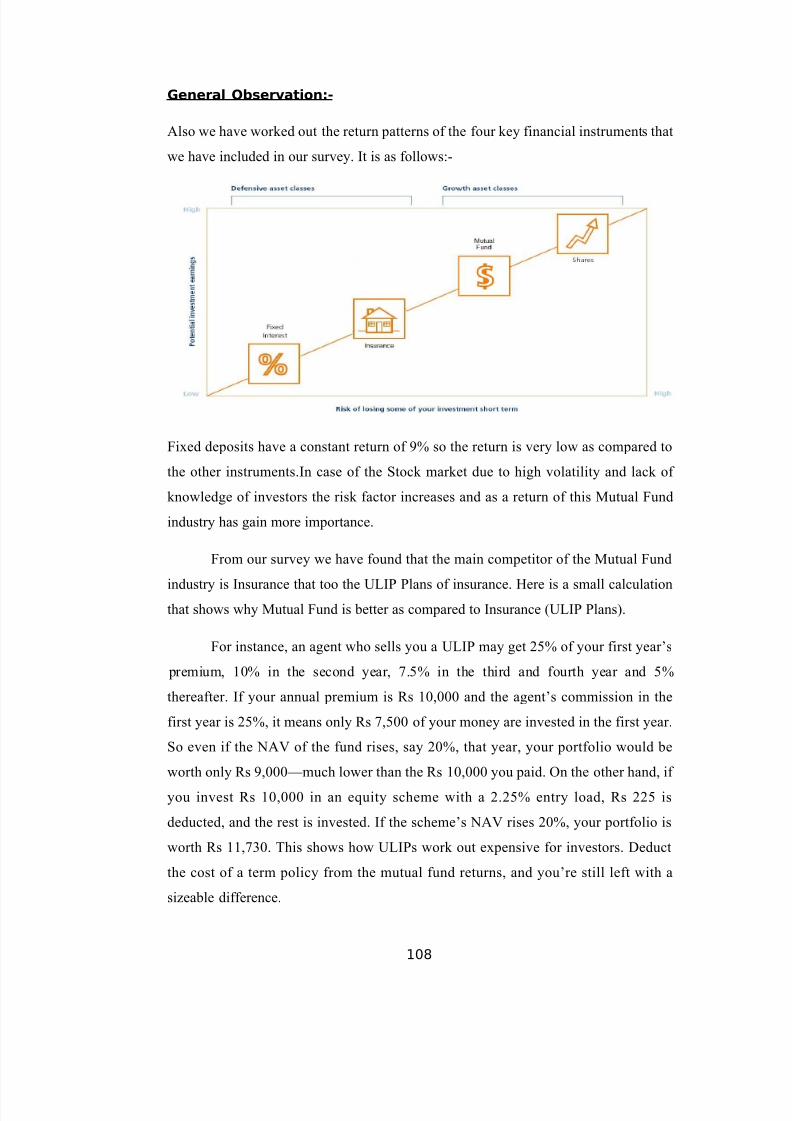
8/8/2019 Lokesh Final for Spiral
http://slidepdf.com/reader/full/lokesh-final-for-spiral 108/112
General Observation:-
Also we have worked out the return patterns of the four key financial instruments that
we have included in our survey. It is as follows:-
Fixed deposits have a constant return of 9% so the return is very low as compared to
the other instruments.In case of the Stock market due to high volatility and lack of
knowledge of investors the risk factor increases and as a return of this Mutual Fund
industry has gain more importance.
From our survey we have found that the main competitor of the Mutual Fund
industry is Insurance that too the ULIP Plans of insurance. Here is a small calculation
that shows why Mutual Fund is better as compared to Insurance (ULIP Plans).
For instance, an agent who sells you a ULIP may get 25% of your first year’s
premium, 10% in the second year, 7.5% in the third and fourth year and 5%
thereafter. If your annual premium is Rs 10,000 and the agent’s commission in the
first year is 25%, it means only Rs 7,500 of your money are invested in the first year.
So even if the NAV of the fund rises, say 20%, that year, your portfolio would be
worth only Rs 9,000—much lower than the Rs 10,000 you paid. On the other hand, if
you invest Rs 10,000 in an equity scheme with a 2.25% entry load, Rs 225 is
deducted, and the rest is invested. If the scheme’s NAV rises 20%, your portfolio is
worth Rs 11,730. This shows how ULIPs work out expensive for investors. Deduct
the cost of a term policy from the mutual fund returns, and you’re still left with a
sizeable difference.
108

8/8/2019 Lokesh Final for Spiral
http://slidepdf.com/reader/full/lokesh-final-for-spiral 109/112
And now even the entry load has been removed by SEBI (Securities Exchange
Board of India) and so this gives the investors more amount of returns as compared to
Insurance (ULIP Plans).Now if an individual wants both risk cover and higher returns
than he may invest his amount in both say Rs. 5000 as premium of insurance and Rs.
5000 in Mutual fund. Here if the fund rises by 20% that year, your portfolio for
insurance will be Rs. 4500 and that of Mutual Fund will be Rs. 5865. This will sum
up to a total of Rs. 10365.
109

8/8/2019 Lokesh Final for Spiral
http://slidepdf.com/reader/full/lokesh-final-for-spiral 110/112
CONCLUSION
Mutual Fund is a good concept of investment, which collects the savings and
invests in different sector and different market in such a way that the
investment gets highest return. This return will be paid back to Unit holders.
AMC’s and J.M.FINANCIAL SERVICES should give more stress on risk
coverage and safety attributes because investors more concerned about safety
of their investments and of taking more benefit of the investments.
J.M.FINANCIAL SERVICE should launch its brand awareness campaign to
be successful in Mutual Fund industry.
The perception of investors is that insurance is the best investment option
among the four investment products. And stock and FD are least preferred.
Since last 5 years Mutual Fund industry has been gaining importance and as a
result of this investors are beginning to gain awareness about the industry.
Most of the investors are with the misconception that Mutual Fund involves
high risk and unasserted returns.
Regular income is at the peak of all the attributes.
There is very less awareness among the investors about AMC’s
The most vital problem spotted is of ignorance. Investors should be
made aware of the benefits. Nobody will invest until and unless he is fully
convinced. Investors should be made to realize that ignorance is no longer bliss
and what they are losing by not investing.
Mutual funds offer a lot of benefit which no other single option could
offer. But most of the people are not even aware of what actually a mutual fund
is? They only see it as just another investment option. So the advisors should try
to change their mindsets. The advisors should target for more and more young
investors. Young investors as well as persons at the height of their career would
like to go for advisors due to lack of expertise and time
110

8/8/2019 Lokesh Final for Spiral
http://slidepdf.com/reader/full/lokesh-final-for-spiral 111/112
Mutual Fund Company needs to give the training of the Individual
Financial Advisors about the Fund/Scheme and its objective, because they are
the main source to influence the investors.
Before making any investment Financial Advisors should first enquire
about the risk tolerance of the investors/customers, their need and time (how
long they want to invest). By considering these three things they can take the
customers into consideration.
Younger people aged fewer than 35 will be a key new customer group
into the future, so making greater efforts with younger customers who show
some interest in investing should pay off.
Customers with graduate level education are easier to sell to and there is
a large untapped market there. To succeed however, advisors must provide
sound advice and high quality.
Systematic Investment Plan (SIP) is one the innovative products
launched by Assets Management companies very recently in the industry. SIP is
easy for monthly salaried person as it provides the facility of do the investment
in EMI. Though most of the prospects and potential investors are not aware
about the SIP. There is a large scope for the companies to tap the salaried
persons.
111

8/8/2019 Lokesh Final for Spiral
http://slidepdf.com/reader/full/lokesh-final-for-spiral 112/112
Bibliography
• www.moneycontrol.com
•
www.nseindia.com• www.bseindia.com
• http://www.statsoft.com/textbook/basic-statistics/