logros 2013 inglés
DESCRIPTION
Logros 2013 inglesTRANSCRIPT


The big jump from one primary-extractive society to a knowledge-based society is only possible if we act in different areas, but mainly in the generation and transfer of knowledge, and the training of people and institutions of excellence. In this context we are creating the ideal environment to increase a systemic productivity of the country and develop new research areas such as: Bio-Science, Information and Communication Technologies, Nano-Science, Alternative Energy, among others. One of the milestones is the profound and irreversible change in the higher education system in the country, where merit and quality is currently the standard that conducts the country’s universities and we will never surrender. We share with you the progress and challenges in the way to achieving this dream: Ecuador, Country of Knowledge.
Augusto X. Espinosa A.Coordinating Minister,Coordinating Ministry of Knowledge and Human Talent
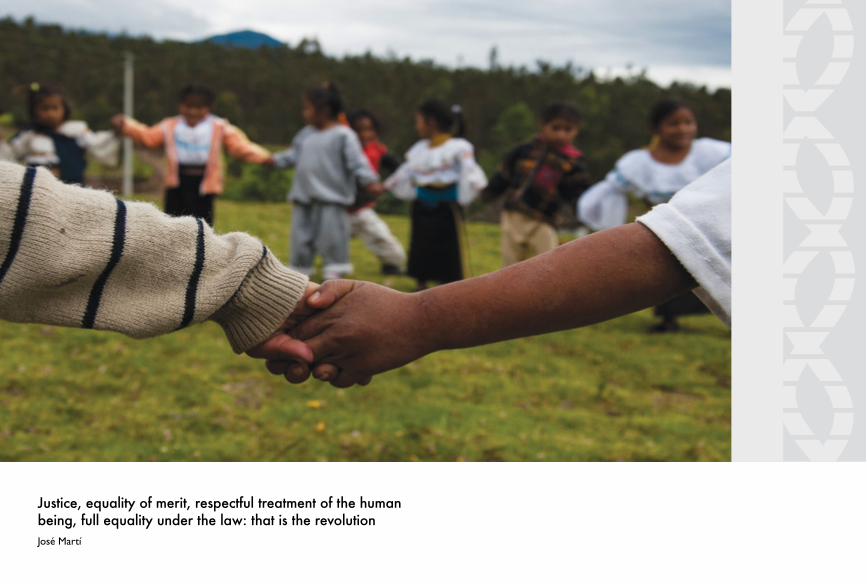
José Martí
Justice, equality of merit, respectful treatment of the humanbeing, full equality under the law: that is the revolution
Elaboration: MCCTH6 7
Fair a
nd
sup
po
rtive co
un
try
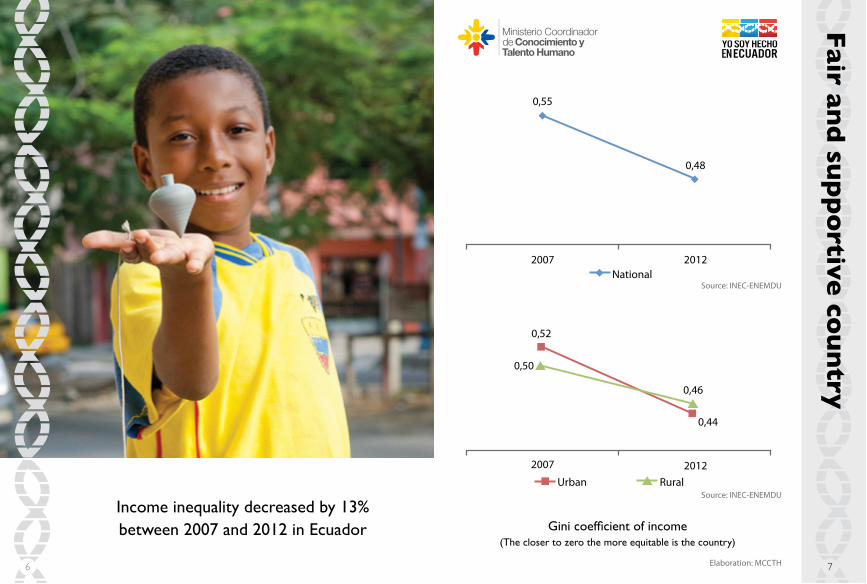
+MRM�GSIJ½GMIRX�SJ�MRGSQI(The closer to zero the more equitable is the country)
2007
2007
0,55
0,48
0,52
0,50
0,46
0,44
2012
Urban Rural2012
National
Income inequality decreased by 13%between 2007 and 2012 in Ecuador
Source: INEC-ENEMDU
Source: INEC-ENEMDU

Elaboration: MCCTH
Co
mm
itted
to th
e n
ee
dy
98
2007
National
16,5%
11,2%
2012
Urban Rural
7,0%5,0%
33,3%
23,3%
2007 2012
Indigenous Afro-Ecuadorian
39,3% 37,5%
22,3%15,7%
2007 2012
Percentage of people living in extremepoverty based on income
Over 600 thousand people have come outof extreme poverty between 2007 and 2012
Source: INEC-ENEMDU
Source: INEC-ENEMDU
Source: INEC-ENEMDU

Elaboration: MCCTH 11
Qu
ality p
ub
lic serv
ice
10
2008
5,0%
5,4%
2012
2008
25,0%
21,0%
2012
Perception of public services quality. Average rating (out of 10)
Percentage of people who mention that poorly prepared TYFPMG�SJ½GMEPW�MW�SRI�SJ�XLI�QEMR�TVSFPIQW�EX�XLI
moment of processing any formalitiesIncreasingly, citizens perceive
a quality public service
Source: SENPLADES
Source: SENPLADES

The purpose of education in virtue is the keendesire of becoming a perfect citizenPlatón

Elaboration: MCCTH 15
We
prio
ritize e
du
cation
2008 2009
Ecuador Average Latin America
and the Caribbean
2009
3,2%
5,2%4,8%5,0%
2011
EcuadorAverage South America
GDP ForecastIncludes Argentina, Ecuador, Bolivia, Colombia, Brazil and Peru
2
1
1
2
2008 2009 2009
0,5%
1,7%
1,3%
1,9%
2011
Expenditure on the Education sectoras percentage of the GDP
Public expenditure on higher educationas percetage of the GDPEcuador is one of the countries in Latin America
with a greater investment in education
14
Source: MINEDUC-CEPAL
Source: MF-BCE-UNESCO

Elaboration: MCCTH
We
inve
st in h
ighe
r ed
ucatio
n
2009 2012
611,6
3.069,0
Universities’ cumulative investment (US millions)
17
In the last 4 years, more than 3 billion dollarswere intended for public universities
16
Source: SENESCYT

We
de
mo
cratize H
ighe
r Ed
ucatio
n
ENES 18/02/2012 ENES 24/11/2012
75,0%
90,1%
General leveling Career Leveling Special Leveling for theHigh-Performance Group(GAR - Spanish Acronyms)
11.679
43.179
325
Results of the National Examination of Higher Education- ENES - Spanish acronyms upon summons
(Percentage of approval)
Leveling of high school students(2012)
Elaboration: MCCTH 19
9 out of 10 young people pass the highereducation national examination and
55 thousand high school students takethe general compensatory/leveling course
18
Source: SENESCYT
Source: SENESCYT
Elaboration: MCCTH 21
Gre
ater acce
ss to h
ighe
r ed
ucatio
n
2007
National
2012
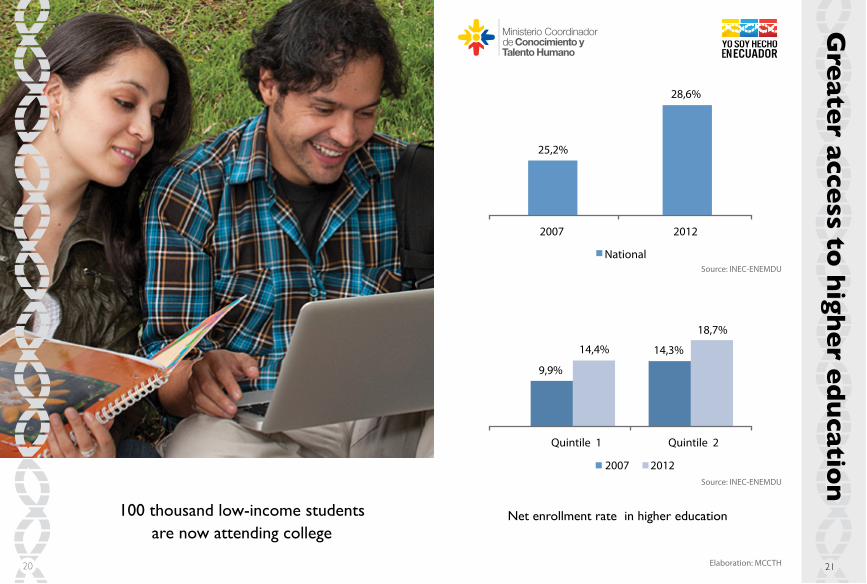
25,2%
28,6%
Quintile 1 Quintile 2
2007 2012
9,9%
14,4% 14,3%
18,7%
Net enrollment rate in higher education100 thousand low-income studentsare now attending college
Source: INEC-ENEMDU
Source: INEC-ENEMDU
20
Elaboration: MCCTH
High
er e
du
cation
for e
very
on
e
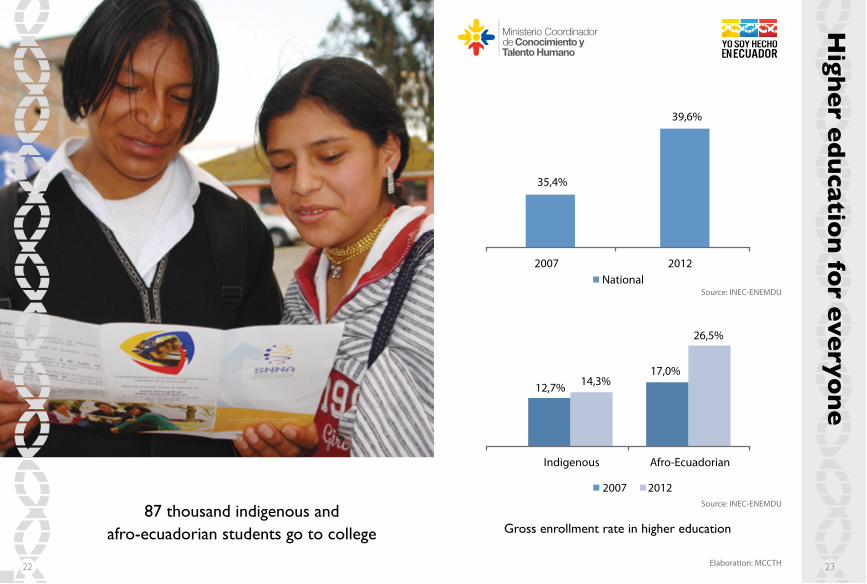
2007National
2012
35,4%
39,6%
Indigenous Afro-Ecuadorian
2007 2012
12,7% 14,3%17,0%
26,5%
Gross enrollment rate in higher education87 thousand indigenous and
afro-ecuadorian students go to college
22 23
Source: INEC-ENEMDU
Source: INEC-ENEMDU

Elaboration: MCCTH
Undergraduate Postgraduate Others1
9.158
2.917
1.447
Includes: Middle school, research and compensatory1
9TSR���]IEVW�MR�SJ½GI��XLMW�KSZIVRQIRX�LEWgranted twice as much educational credit than
it has ever been granted in the last 33 years, thus FIRI½XMRK�QSVI�XLER�����XLSYWERH�]SYRKXIVW
24
Educational credits granted according to the study level(2012)
Educational Credit(US millions)
We
foste
r access to
ed
ucatio
n
1973-2006 2007-2012
273,2
593,5
25
Source: IECE
Source: IECE

Yo
un
g Ecu
ado
rian
s atten
d th
e b
est
scho
ols in
the
wo
rld
Number of scholarship holders per country of destination1
(January - December)
More than 8,500 scholarship holdersare studying in 50 countries
Source: SENESCYTElaboration: MCCTH 27
Canadá63
Estados Unidos842
México114
Perú20
Bolivia1
Chile 186 Argentina
169
Uruguay6
Australia415
China6
Rusia12
Noruega3Finlandia 4
Bélgica 51
Islandia1
Suecia 11
Alemania 88Ucrania 8
Israel 4Emiratos Árabes
Unidos1
Hungría 1Portugal 5
España 1075
Reino Unido 205
Italia 70
Francia 191
Otros238
Países Bajos80
Brasil76
Cuba87 Puerto Rico
2Colombia
39Costa Rica44
ECUADOR4409
Guatemala1
Sudáfrica2
Corea del Sur 1
Hong Kong 1India 1
Tailandia 1
Japón 5
Singapur 1
Nueva Zelanda 5
Venezuela4
1 Includes scholarship holders under study, scholarship holders under compensation,awardees; national and international scholarship programs

Inve
stme
nt in
scho
larsh
ips, in
vestm
en
t in
the
futu
re
2000-2006 2007-2012
156
8.673
2008 2012
2,5
49,3
Number of scholarships granted1
Investment in scholarships (US millions)
Elaboration: MCCTH 29
Between 2007 and 2012 we have granted 56 timesmore scholarships than in the 3 previous
governments altogether28
Source: SENESCYT
Source: SENESCYT
1 Includes scholarship holders under study, scholarship holders under compensation,awardees; national and international scholarship programs

We
imp
rove
pu
blic se
rvice
2008 2009 2010 2011 2012
01.119
2.443
6.241
12.344
Public Servants Public workers
7.452
1.390
Number of trained public servants
Number of trained public servants and workers in 2012
Elaboration: MCCTH 31
We have trained more than 22 thousandpublic servants in 4 years
30
Source: IAEN
Source: SECAP

Science is the soul of the prosperity of nations andthe living source of all progress
Louis Pasteur

We
do
ub
le th
e in
vestm
en
t in scie
nce
an
d te
chn
olo
gy
2008 2012
47,6
103,0
2006 2012
205
737
2008: Accrued, 2012: Accrued + Advance payment 3Public Research InstitutesCorresponds to the cumulative until 2012
Institutos Públicos de Investigación
2
32
1
Executed budget(US millions)!
Number of researchers participating in IPI3
Elaboration: MCCTH 35
We doubled the budget in research, scienceand technology and we have strengthened
the human talent with 737 researchers34
Source: MF-e-SIGEF
Source: SENESCYT
Re
searh
an
d d
eve
lop
me
nt a
ren
ation
al prio
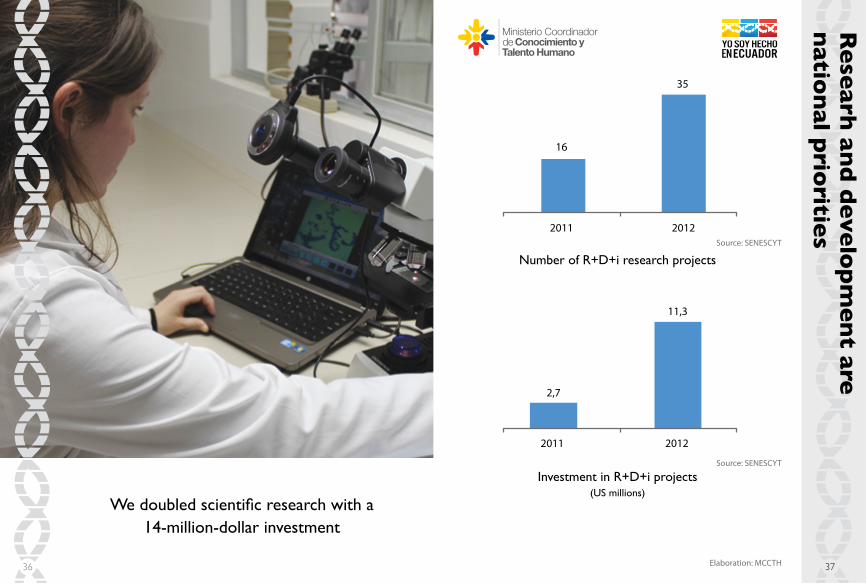
rities2011 2012
16
35
2011 2012
2,7
11,3
Number of R+D+i research projects
Investment in R+D+i projects (US millions)
Elaboration: MCCTH 37
;I�HSYFPIH�WGMIRXM½G�VIWIEVGL�[MXL�E14-million-dollar investment
36
Source: SENESCYT
Source: SENESCYT

We
rep
atriate th
e b
est m
ind
s
1CyT's plans and policies
Information Technology Engineering
Aquatic Ecology
Conservation and Biodiversity
Political Science
Energy
Agricultural Development andSustainable Agriculture
Information and Communication Technologies
Innovation, Technology,Production and Logistics
Environment
Natural Resources
Life Sciences
1
1
1
1
2
4
6
6
12
15
32
2011 2012
11,35
14,64
Number of Prometeos (per line of research)
Cumulative Investment in Prometeo Project(US millions)
Elaboration: MCCTH 39
14.64 million dollars invested to trainyoung researchers in Ecuador
38
Source: SENESCYT
Source: SENESCYT

He
alth re
search
at the
serv
iceo
f the
citizen
s
Vaccinations and Antidotes
1.861.677
Research and diagnostics
932.850
Health Registrations
27.308
Number of Public Health products and services(2012)
Elaboration: MCCTH 41
More than 2.8 million products and servicesdelivered in 2012 thanks to health research
40
Source: INSPI
Source: INSPI

;I�FSSWX�WGMI
RXM½
G�VIWIEVGL
43
We have prioritzed mapping, marine andmining research in the country
We
bu
ild a F
air a
nd
Su
pp
ortive
Kn
ow
led
ge-b
ased
So
ciety
45
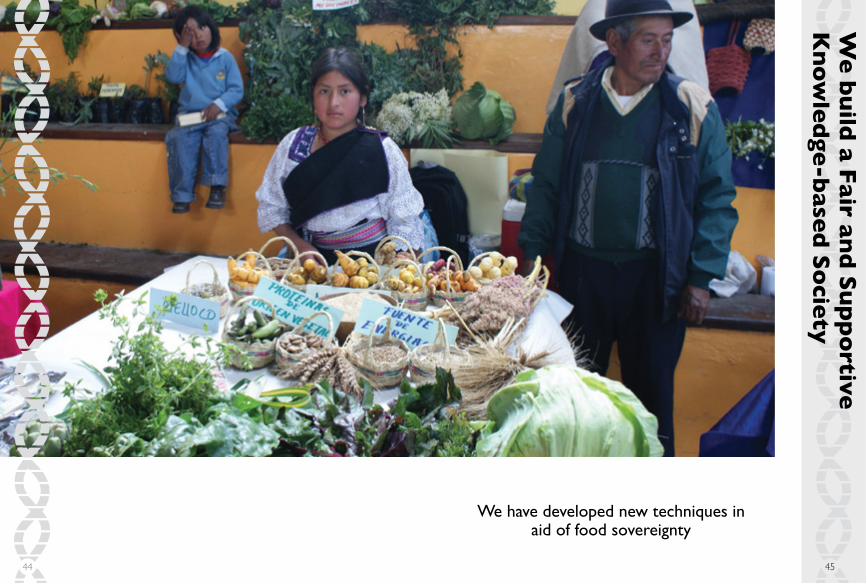
We have developed new techniques inaid of food sovereignty
44

The principle goal of education in the schools should be creating men and women who are capable of doing new things,not simply repeating what other generations have done; men and women who are creative, inventive and discoverers,who can be critical and verify, and not accept, everything they are offeredJean Piaget

Am
azon
Re
gion
al Un
iversity
IKIA
M
IKIAM will be the cornerstone ofbiodiversity research in the country
49

Yach
ay U
nive
rsity
First-ever planned city of the country where the Experimental Technology ResearchUniversity - YACHAY will be located
51

Un
iversity
of A
rts
Universidad de las Artes will train professionals MR�EVXW�[MXL�JYPP�GSQQERH�SJ�XLIMV�½IPH��GVMXMGEP�thinking and a transformative social awareness
towards the Buen Vivir53

Natio
nal U
nive
rsity o
f Ed
ucatio
n U
NA
E
Future teachers will be trained now in aquality-based university that specializesin education and teaching methodology
UNIVERSIDAD NACIONAL
DE EDUCACIÓN55

From the healthy education of the youth, dependsthe happiness of nations
Don Bosco

Be
tter p
rep
are
d te
ache
rs forge
a b
ette
r futu
re
2010
National
2012
12.596
15.252
Female Male
9.999
4.537 5.253
8.059
2010 2012
Number of Teachers with postgraduate degree
Elaboration: MCCTH 59
By 2012, more than 2,500 teachers have apostgraduate degree in the educational
national system 58
Source: MINEDUC-AMIE
Source: MINEDUC-AMIE

High
scho
ol e
du
cation
pla
nts h
op
e in
e
very
corn
er o
f the
cou
ntry
Urban Rural
70,0%
34,2%54,0%
60,9%
2007 2012
51,2%63,9%
2007
National
2012
Net attendance rate in High school
Elaboration: MCCTH 61
From 2007 to 2012, we have increased 57%teenagers from rural areas who attend high school
60
Source: INEC-ENEMDU
Source: INEC-ENEMDU

Mo
re in
clusio
n o
f ou
r yo
un
gsters
in h
igh sch
oo
l
Afro-Ecuadorian Indigenous
53,9%
28,5%
50,8%33,5%
2007 2012
Quintile 1 Quintile 2
53,8%43,5%
60,0%
36,1%
2007 2012
Net attendance rate in High school
Elaboration: MCCTH
Source: INEC-ENEMDU
Source: INEC-ENEMDU
63
Between 2007 and 2012, 61% more afro-ecuadorianyoungsters and 78% more indigenous youngsters
go to high school 62

We
red
uce
child
wo
rk
2011 2012
20.963
102.150
5 - 14 años 15 - 17 años
248.389
73.741
247.477
140.217
2007 2012
Number of children and adolescentsdisengaged from child work
Number of children and adolescents who work (age groups)
Elaboration: MCCTH 65
281 thousand children and adolescents between5 and 17 years of age stopped working
during the period 2007 - 201264
Source: INEC-ENEMDU
Source: MRL

Op
po
rtun
ity, eq
uality
an
d h
op
e
2007 2012
59,1%
35,6%
National
Afro-Ecuadorian Indigenous
61,5%45,1%
60,1%
27,7%
2007 2012
Calculation based on the young people who do not attend school1
Grounds for non-attendance, due to lack of resources,between 5 and 17 years of age!
Elaboration: MCCTH 67
183 thousand less children and adolescentsstate that they do not attend school due
to economic grounds66
Source: INEC-ENEMDU
Source: INEC-ENEMDU
Prim
ary
ed
ucatio
n w
ith e
qu
ity
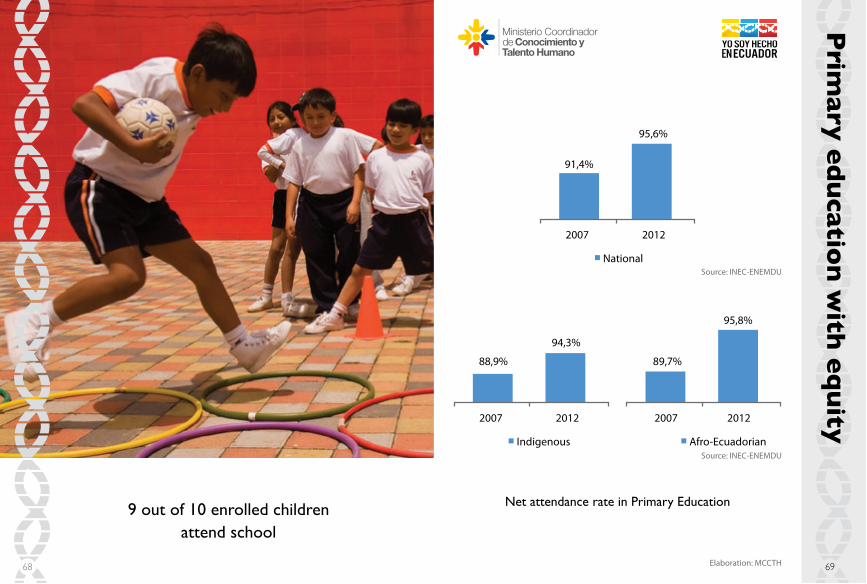
2007 2012
91,4%
95,6%
National
2007 2012
88,9%
94,3%
Indigenous
2007 2012
89,7%
95,8%
Afro-Ecuadorian
Net attendance rate in Primary Education
Elaboration: MCCTH 69
9 out of 10 enrolled childrenattend school
68
Source: INEC-ENEMDU
Source: INEC-ENEMDU

Prim
ary
Ed
ucatio
n fo
r eve
ryo
ne
2007 2012
90,4%
95,8%
Afro-Ecuadorian
2007 2012
89,0%
92,8%
Quintile 1 Quintile 2
2007 2012
89,8%
94,8%
Net enrollement rate in Primary Education
Elaboration: MCCTH 71
9 out of 10 low-income children have accessto primary education. since 2007 more than25 thousand afro-ecuadorian children have
access to school70
Source: INEC-ENEMDU
Source: INEC-ENEMDU

We
ed
ucate
to h
ave a h
om
ela
nd
Universalization of Primary Education
73

Qu
ality p
ub
lic ed
ucatio
n
Under operation
Status of the Educational:
Under executionTo be executed
2007 2008 2009 2010 2011 2012
5,3
19,224,8 26,2
32,8
69,1
Units of the Millenium UEM-Spanish Acronyms
Cumulative investment in Educational Units of the Millenium(US millions)
Elaboration: MCCTH 75
We have invested more than 69 milliondollars in the educational units of the millenium
74
Source: MINEDUC
Source: MINEDUC

We
ed
ucate
with
the
be
st tech
no
logy
20101 2012
5.378
8.848
2009-2010 Commencement1
2009 2012
238
2.012
Educational institutions with access to internet
Educational units with equipment
Elaboration: MCCTH 77
Between 2009 and 2012, 65% more educational institutions have access to internet. we have provided
8 times more to the educational institutions with technological equipment
76
Source: MINEDUC-AMIE
Source: MINTEL

Fre
e acce
ss to te
chn
olo
gy
2011 2012
200
373
2011 12012
27,9
35,5
!Includes: a)Provision of connectivity and equipment for public schools andsocial development agencies nationwide b) Universal Access Program
c) Connectivity provision to social customers by using ADSL technologies
Operational Infocenters
Cumultive investment in Connectivity and Equipment(US millions)Nearly half million ecuadorians have free
access to infocenters (information centers) across the country
Elaboration: MCCTH 7978
2010
Years of creation ofthe Infocenters
20112012 Source: MINTEL
Source: MINTEL
Source: MF-e-SIGEF

We
red
uce
the
digital ga
ps
2007 2011
2,75
3,68
Skills Access
2007
Use
5,956,81
3,314,16
0,601,62
2011
ICTs’ development sub-index
ICTs’ development index TIC
Elaboration: MCCTH 81
From 2007 to 2011, we democratized the use andaccess to infomation and communication technologies
80
Source: UIT
Source: UIT

Mo
re ch
ildre
n h
ave fre
e b
oo
ks
7GLSSP�8I\XW�&IRI½GMEVMIW�
Coverage 2010
Coverage 2012
Elaboration: MCCTH 83
9 out of 10 children receive free schooltexts in primary education
82
Source: MINEDUC-AMIE
Source: MINEDUC-AMIE

Mo
re ch
ildre
n h
ave fre
e u
nifo
rms
Elaboration: MCCTH 85
More than 1 million children receive freeuniforms in the primary education system
84
7GLSSP�9RMJSVQW�&IRI½GMEVMIW
Coverage 2010
Coverage 2012
Source: MINEDUC-AMIE
Source: MINEDUC-AMIE

Mo
re ch
ildre
n h
ave fre
e sch
oo
l b
reak
fast
Elaboration: MCCTH 87
More than 1.6 million children receive freeschool meals during primary education
86
7GLSSP�*IIHMRK�&IRI½GMEVMIW
Coverage 2010
Coverage 2012
Source: MINEDUC-AMIE
Source: MINEDUC-AMIE
Mo
re ch
ildre
n a
re e
nte
ring p
rimary
IHYGEXMS
R�JSV�XL
I�½VWX�XMQ
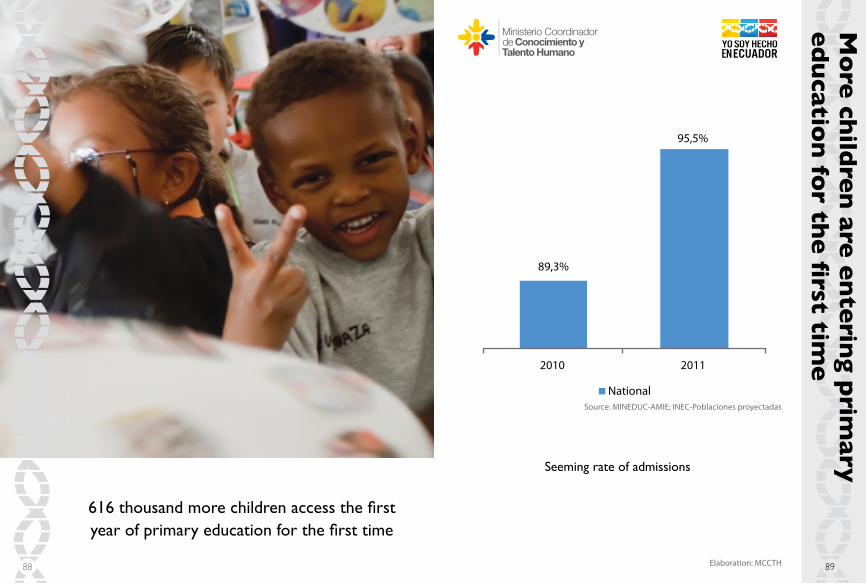
I2010
National
2011
89,3%
95,5%
Seeming rate of admissions
Elaboration: MCCTH
Source: MINEDUC-AMIE; INEC-Poblaciones proyectadas
89
����XLSYWERH�QSVI�GLMPHVIR�EGGIWW�XLI�½VWX]IEV�SJ�TVMQEV]�IHYGEXMSR�JSV�XLI�½VWX�XMQI
88

MCCTHTOWARD THE COUNTRY OF KNOWLEGE, ADVANCES ANDCHALLENGES 2013Information General Coordination, Follow-up and AssessmentMCCTH/1st issue - Quito, 201389 slides
The contents of the document may be quoted and reproducedprovided that they are for commercial purposes and on thecondition of recognizing the corresponding credits by referringthe bibliographic source.
© MCCTH, 2013
This issue by:Coordinating Ministry of Knowledge and Human TalentMCCTHAv. Patria y Av. 10 de AgostoQuito, EcuadorTel: (593) 3946800www.conocimiento.gob.ec
Design, layout and printing: La Guaragua ([email protected])
We thank the Presidence of the Republic and all the publicinstitutions for their cooperation with the photographicmaterial and information for this publication.
