logo tbd - gaudisite.nl · logo tbd gerrit muller ... m eul ngr af derkin deren r eind rs bush oya...
TRANSCRIPT
Module Customer Side
logo TBD
Gerrit MullerUniversity of Southeast Norway-NISE
Hasbergsvei 36 P.O. Box 235, NO-3603 Kongsberg Norway
Abstract
This module addresses The Customer Objectives and Application Views:
DistributionThis article or presentation is written as part of the Gaudí project. The Gaudí project philosophy is to improveby obtaining frequent feedback. Frequent feedback is pursued by an open creation process. This document ispublished as intermediate or nearly mature version to get feedback. Further distribution is allowed as long as thedocument remains complete and unchanged.
All Gaudí documents are available at:http://www.gaudisite.nl/
version: 0 status: draft June 5, 2018

Contents
1 The customer objectives view 11.1 Introduction . . . . . . . . . . . . . . . . . . . . . . . . . . . . . 11.2 Key drivers . . . . . . . . . . . . . . . . . . . . . . . . . . . . . 21.3 Value chain and business models . . . . . . . . . . . . . . . . . . 41.4 Suppliers . . . . . . . . . . . . . . . . . . . . . . . . . . . . . . 5
2 The application view 72.1 Introduction . . . . . . . . . . . . . . . . . . . . . . . . . . . . . 72.2 Customer stakeholders and concerns . . . . . . . . . . . . . . . . 82.3 Context diagram . . . . . . . . . . . . . . . . . . . . . . . . . . . 92.4 Entity relationship model . . . . . . . . . . . . . . . . . . . . . . 102.5 Dynamic models . . . . . . . . . . . . . . . . . . . . . . . . . . 10

Chapter 1
The customer objectives view
Customer
objectives
key drivers
value chain and
business models
supplier map
Safety
Effective
Flow
Smooth
Operation
Reduce Accident rates
Enforce law
Improve Emergency Response
Reduce delay due to accident
Improve average speed
Improve total network throughput
Optimise road surface
Speed up target groups
Anticipate on future traffic condition
Ensure Traceability
Ensure proper alarm handling
Ensure system health and fault indication
Reduce emissions
Key drivers Derived application drivers
Environment
Early hazard detection with
warning and signalling
Maintain safe road condition
Classify and track dangerous
goods vehicles
Detect and warn
non compliant vehicles
Enforce speed compliance
Enforce red light compliance
Enforce weight compliance
televisionset top
boxset top
boxtelevision
televisionset top
box
head end
head end
supplier 1
supplier 2
supplier 3
supplier 4
supplier 5
competitors or
complementors?
ProvidersUPC
Canal+ AOL
AT&TRetailersFry's
Dixon
Consumers Boonstra
PeperKokChirac
Blair
PietersenSmith
Jones
Jansen
Muller
Kleisterlee
Clinton
v.d. Spijker
Meulengraafder Kinderen
Reinders
Bush
Rooyakkers
de Vries
Koch
d'Oliviera
van Oranje
Obbink
v.d. HamerCharite
Cruijf
Neeskensvan Hanegem
Goedkoop
Sharon
El Khatabi
de Gruijter
Heijn
Schijvens
Waterreus
Leonardo
van Bommel
Nistelrooij
Gandhi
Pinochet
Bakker
v.d. Meulen
Hoessein
Schroder
Schweitzer
Peters
Gore
System IntegratorsSony Philips CE-DN
Loewe
NokiaPhilips CE-TV
Philips CE-PCC
Component and
Platform SuppliersPhilips Semiconductors
Philips Components ST
TI
Samsung
MicrosoftIntel
Liberate
Micron
LG
It's
Prodi
Application Functional Conceptual Realisation
1.1 Introduction
The customer objectives view describes the goals of the customer, the what. Thegoal of articulating these objectives is to better understand the needs and thereforeto be able to design a better product.
In searching the objectives some focus on the product is needed, although thearchitect must keep an open mind. The architect must prevent a circular reasoning,starting from the product functionality and, blinded by the product focus, findingonly objectives matching with this same functionality.
Ideally the trade-offs in the customer domain become clear. For instance whatis the trade-off between performance and cost, or size and performance or size andcost. The key driver method articulates the essence of the customer needs in alimited set of drivers.
The customer is often driven by his context. Some of the models and methodsdescribed here address ways to understand the customer context, such as valuechains and business models. Value chains and business models are used to addressthe customer’s customer. The supplier map addresses the supplying side of thecustomer.
Figure 1.1 shows an overview of the methods in the customer objectives view.

Customer
objectives
key drivers
value chain and
business models
supplier map
Safety
Effective
Flow
Smooth
Operation
Reduce Accident rates
Enforce law
Improve Emergency Response
Reduce delay due to accident
Improve average speed
Improve total network throughput
Optimise road surface
Speed up target groups
Anticipate on future traffic condition
Ensure Traceability
Ensure proper alarm handling
Ensure system health and fault indication
Reduce emissions
Key drivers Derived application drivers
Environment
Early hazard detection with
warning and signalling
Maintain safe road condition
Classify and track dangerous
goods vehicles
Detect and warn
non compliant vehicles
Enforce speed compliance
Enforce red light compliance
Enforce weight compliance
televisionset top
boxset top
boxtelevision
televisionset top
box
head end
head end
supplier 1
supplier 2
supplier 3
supplier 4
supplier 5
competitors or
complementors?
ProvidersUPC
Canal+ AOL
AT&TRetailersFry's
Dixon
Consumers Boonstra
PeperKokChirac
Blair
PietersenSmith
Jones
Jansen
Muller
Kleisterlee
Clinton
v.d. Spijker
Meulengraafder Kinderen
Reinders
Bush
Rooyakkers
de Vries
Koch
d'Oliviera
van Oranje
Obbink
v.d. HamerCharite
Cruijf
Neeskensvan Hanegem
Goedkoop
Sharon
El Khatabi
de Gruijter
Heijn
Schijvens
Waterreus
Leonardo
van Bommel
Nistelrooij
Gandhi
Pinochet
Bakker
v.d. Meulen
Hoessein
Schroder
Schweitzer
Peters
Gore
System IntegratorsSony Philips CE-DN
Loewe
NokiaPhilips CE-TV
Philips CE-PCC
Component and
Platform SuppliersPhilips Semiconductors
Philips Components ST
TI
Samsung
MicrosoftIntel
Liberate
Micron
LG
It's
Prodi
Application Functional Conceptual Realisation
Figure 1.1: Overview of Customer Objectives View methods
1.2 Key drivers
The essence of the objectives of the customers can be captured in terms of customerkey drivers. The key drivers provide direction to capture requirements and to focusthe development. The key drivers in the customer objectives view will be linkedwith requirements and design choices in the other views. The key driver submethodgains its value from relating a few sharp articulated key drivers to a much longerlist of requirements. By capturing these relations a much better understanding ofcustomer and product requirements is achieved.
Figure 1.2 shows an example of key drivers for a motorway management system,an analysis performed at Philips Projects in 1999.
Figure 1.3 shows a submethod how to obtain a graph linking key drivers torequirements. The first step is to define the scope of the key driver graph. ForFigure 1.2 the customer is the motorway management operator. The next step is toacquire facts, for example by extracting functionality and performance figures outof the product specification. Analysis of these facts recovers implicit facts. Therequirements of an existing system can be analyzed by repeating why questions.For example: “Why does the system need automatic upstream accident detection?”.The third step is to bring more structure in the facts, by building a graph, which
Gerrit MullerThe customer objectives viewJune 5, 2018 version: 0.3
University of Southeast Norway-NISE
page: 2

Safety
Effective
Flow
Smooth
Operation
Environment
Reduce accident rates
Enforce law
Improve emergency
response
Reduce delay due to accident
Improve average speed
Improve total network throughput
Optimize road surface
Speed up target groups
Anticipate on future traffic condition
Ensure traceability
Ensure proper alarm handling
Ensure system health and fault indication
Reduce emissions
Early hazard detection
with warning and signaling
Maintain safe road
condition
Classify and track dangerous
goods vehicles
Detect and warn
noncompliant vehicles
Enforce speed compliance
Enforce red light compliance
Enforce weight compliance
Key-drivers Derived application drivers Requirements
Automatic upstream
accident detection
Weather condition
dependent control
Deicing
Traffic condition
dependent speed control
Traffic speed and
density measurement
Note: the graph is only partially elaborated
for application drivers and requirements
Cameras
Figure 1.2: Example of the four key drivers in a motorway management system
connects requirements to key drivers. A workshop with brainstorms and discus-sions is an effective way to obtain the graph. The last step is to obtain feedbackfrom customers. The total graph can have many n:m relations, i.e. requirementsthat serve many drivers and drivers that are supported by many requirements. Thegraph is good if the customers are enthusiastic about the key drivers and the derivedapplication drivers. If a lot of explaining is required then the understanding of thecustomer is far from complete. Frequent iterations over these steps improves thequality of the understanding of the customer’s viewpoint. Every iteration causesmoves of elements in the graph in driver or requirement direction and also causesrephrasing of elements in the graph.
Figure 1.4 shows an additional set of recommendations for applying the keydriver submethod. The most important goals of the customer are obtained bylimiting the number of key drivers. In this way the participants in the discussionare forced to make choices. The focus in product innovation is often on differen-tiating features, or unique selling points. As a consequence, the core functionalityfrom the customer’s point of view may get insufficient attention. An example ofthis are cell phones that are overloaded with features, but that have a poor userinterface to make connections. The core functionality must be dominantly presentin the graph. The naming used in the graph must fit in the customer world and beas specific as possible. Very generic names tend to be true, but they do not help toreally understand the customer’s viewpoint. The boundary between the CustomerObjectives view and the Application view is not very sharp. When creating the
Gerrit MullerThe customer objectives viewJune 5, 2018 version: 0.3
University of Southeast Norway-NISE
page: 3

• Build a graph of relations between drivers and requirements
by means of brainstorming and discussions
• Define the scope specific. in terms of stakeholder or market segments
• Acquire and analyze facts extract facts from the product specification
and ask why questions about the specification of existing products.
• Iterate many times increased understanding often triggers the move of issues
from driver to requirement or vice versa and rephrasing
where requirements
may have multiple drivers
• Obtain feedback discuss with customers, observe their reactions
Figure 1.3: Submethod to link key drivers to requirements, existing of the iterationover four steps
• Use short names, recognized by the customer.
• Limit the number of key-drivers minimal 3, maximal 6
for instance the well-known main function of the product• Don’t leave out the obvious key-drivers
for instance replace “ease of use” by
“minimal number of actions for experienced users”,
or “efficiency” by “integral cost per patient”
• Use market-/customer- specific names, no generic names
• Do not worry about the exact boundary between
Customer Objective and Applicationcreate clear goal means relations
Figure 1.4: Recommendations for applying the key driver submethod
graph that relates key drivers to requirements one frequently experiences that a keydriver is phrased in terms of a (partial) solution. If this happens either the key driverhas to be rephrased or the solution should be moved to the requirement (or evenrealization) side of the graph. A repetition of this kind of iterations increases theinsight in the needs of the customer in relation to the characteristics of the product.The why, what and how questions can help to rephrase drivers and requirements.The graph is good if the relations between goals and means are clear for all stake-holders.
1.3 Value chain and business models
The position of the customer in the value chain and the business models deployedby the players in the value chain are important factors in understanding the goalsof this customer.
Figure 1.5 shows an example value chain from the Consumer Electronics Domain.At the start of the chain are the component suppliers, making chips and otherelementary components such as optical drives, displays, et cetera. These compo-
Gerrit MullerThe customer objectives viewJune 5, 2018 version: 0.3
University of Southeast Norway-NISE
page: 4

nents are used by system integrators, building the consumer appliances, such astelevisions, set top boxes and cellphones. Note that this value chain is often longerthan shown here, where components are aggregated in larger components intosubassemblies and finally into systems.
ProvidersUPC
Canal+ AOL
AT&T
RetailersFry's
Dixon
Consumers Boonstra
PeperKok
Chirac
Blair
PietersenSmith
Jones
Jansen
Muller
Kleisterlee
Clinton
v.d. Spijker
Meulengraafder Kinderen
Reinders
Bush
Rooyakkers
de Vries
Koch
d'Oliviera
van Oranje
Obbink
v.d. HamerCharite
Cruijf
Neeskensvan Hanegem
Goedkoop
Sharon
El Khatabi
de Gruijter
Heijn
Schijvens
Waterreus
Leonardo
van Bommel
Nistelrooij
Gandhi
Pinochet
Bakker
v.d. Meulen
Hoessein
Schroder
Schweitzer
Peters
Gore
System IntegratorsSony Philips CE-DN
Loewe
NokiaPhilips CE-TV
Philips CE-PCC
Component and
Platform SuppliersPhilips Semiconductors
Philips Components ST
TI
Samsung
Microsoft
Intel
Liberate
Micron
LG
It's
Prodi
Figure 1.5: Example value chain
The consumer appliances itself are distributed through 2 different channels:the retailers and the service providers. Retailers sell appliances directly to theconsumers, earning their money with this appliance sales and sometimes also withmaintenance contracts for these appliances. Providers sell services (for instancetelecom, internet), where the appliance is the means to access these services. Theproviders earn their money via the recurring revenues of the services.
Retailers and service providers have entirely different business models, whichwill be reflected by differences in the key drivers for both parties.
Reality is even much more complicated. For instance adding the content providersto the value chain adds an additional set of business models, with a lot of conflictinginterests (especially Digital Rights Management, which is of high importance forthe content providers, but is often highly conflicting with (legal) consumer interests).
1.4 Suppliers
The value chain must be described from the point of view of the customer. Thecustomer sees your company as one of the (potential) suppliers. From the customerpoint of view products from many suppliers have to be integrated to create the totalsolution for his needs.
In terms of your own company this means that you have to make a map of
Gerrit MullerThe application viewJune 5, 2018 version: 0.2
University of Southeast Norway-NISE
page: 5

televisionset top
boxset top
boxtelevision
televisioncable set
top box
head end
competitors or complementers?
content
consumer world
consumerSuppliers of appliances, services and
content are colour coded.
The customer does business with
many suppliers, and has to integrate
the products of many suppliers
cable
content
head endcontent
Sony
Disney
Sony Sony
Philips
Philips
Philips
cable provider
UPC
NDS Sagem Loewe
Figure 1.6: Example of simple supplier map for a cable provider
competitors and complementers, which together will supply the solution to thecustomer. Figure 1.6 shows an example of a simple supplier map for a cableprovider. If your company is delivering set top boxes, then some companies can beviewed as competitor and complementer at the same time.
Gerrit MullerThe application viewJune 5, 2018 version: 0.2
University of Southeast Norway-NISE
page: 6

Chapter 2
The application view
URF examination room
changing room
waiting room
patient 1, intestinal investigation
patient 2, simple X-ray
patient 3, intestinal investigation
patient 4, intestinal
investigation
patient 5, intestinal investigation
8:30 9:00 9:30 10:00 10:30
2.1 Introduction
The application view is used to understand how the customer is achieving his objec-tives. The methods and models used in the application view should discuss thecustomer’s world. Figure 2.1 shows an overview of the methods discussed here.
The customer is a gross generalization, which can be made more specific byidentifying the customer stakeholders and their concerns, see section 2.2.
The customer is operating in a wider world, which he only partially controls. Acontext diagram shows the context of the customer, see section 2.3. Note that partof this context may interface actively with the product, while most of this contextsimply exists as neighboring entities. The fact that no interface exists is no reasonnot to take these entities into account, for instance to prevent unwanted duplicationof functionality.
The customer domain can be modelled in static and dynamic models. Entityrelationship models (section 2.4) show a static view on the domain, which can becomplemented by dynamic models (section 2.5).

Customer
objectives ApplicationFunctional Conceptual Realisation
stakeholders and concerns context diagrams
video recorder
TV
tuner
storage
TV
screen
movies
sports
news
soaps
channel transmits
selects
tuner
content
life
canned
age, sex,
violence
attributes
describedby
parents
children
inform
s
entity relationship models
URF examination room
changing room
waiting room
patient 1, intestinal investigation
patient 2, simple X-ray
patient 3, intestinal investigation
patient 4, intestinal
investigation
patient 5, intestinal investigation
8:30 9:00 9:30 10:00 10:30
dynamic models
Figure 2.1: Overview of methods and models that can be used in the applicationview
2.2 Customer stakeholders and concerns
In the daily use of the system many human and organizational entities are involved,all of them with their own interests. Of course many of these stakeholders will alsoappear in the static entity relationship models. However human and organizationsare very complex entities, with psychological, social and cultural characteristics,all of them influencing the way the customer is working. These stakeholders havemultiple concerns, which determine their needs and behavior. Figure 2.2 showsstakeholders and concerns for an MRI scanner.
The IEEE 1471 standard about architectural descriptions uses stakeholders andconcerns as the starting point for an architectural description.
Identification and articulation of the stakeholders and concerns is a first step inunderstanding the application domain. The next step can be to gain insight in theinformal relationships. In many cases the formal relationships, such as organizationcharts and process descriptions are solely used for this view, which is a horriblemistake. Many organizations function thanks to the unwritten information flowsof the social system. Insight in the informal side is required to prevent a solutionwhich does only work in theory.
Gerrit MullerThe application viewJune 5, 2018 version: 0.2
University of Southeast Norway-NISE
page: 8

patient
comfort
health
nurse
patient
ease of work
operator
ease of use
cleaner
accessibility
safety
inspection
quality
maintainer
accessibility
safety
radiologist
diagnosisreimburstment
insurance
cost of care
facility man.
space
service supp.
ref. physician
diagnosis
treatment
financial dir.
cash flow
cost of op.
IT dep.
conformance
security
general
practitioner
patient
administration
patient id
invoice
government
cost of care
administrative
clinical
support
patient
family
support
legend
Figure 2.2: Stakeholders and concerns of an MRI scanner
2.3 Context diagram
The system is operating in the customer domain in the context of the customer. Inthe customer context many systems have some relationship with the system, quiteoften without having a direct interface.
motorway
management
system restaurants
gas stations
bus lanes
lorry lanes
maintenance contractors
taxes
car administration
government
airports
railwaystoll
tunnel
car repair
towing service
fleet management
urban traffic control
advanced vehicle control
environmental monitoring
administrative
competing or cooperating?
specia
l
destin
atio
ns
spec
ializ
ed
segm
ents
needed for
contingencies
“add-ons”
special applicationsother c
oncerns
thir
d p
arty
Figure 2.3: Systems in the context of a motorway management system
Figure 2.3 shows a simple context diagram of a motorway management system.Tunnels and toll stations often have their own local management systems, althoughthey are part of the same motorway. The motorway is connecting destinations, suchas urban areas. Urban areas have many traffic systems, such as traffic management(traffic lights) and parking systems. For every system in the context questions canbe asked, such as:
• is there a need to interface directly (e.g. show parking information to peoplestill on the highway)
• is duplication of functionality required (measuring traffic density and sendingit to a central traffic control center)
Gerrit MullerThe application viewJune 5, 2018 version: 0.2
University of Southeast Norway-NISE
page: 9

2.4 Entity relationship model
The OO (Object Oriented software) world is quite used to entity relationship diagrams.These diagrams model the outside world in such a way that the system can interactwith the outside world. These models belong in the ”CAFCR” thinking in theconceptual view. The entity relationship models advocated here model the customersworld in terms of entities in this world and relations between them. Additionallyalso the activities performed on the entities can be modelled. The main purpose ofthis modelling is to gain insight in how the customer is achieving his objectives.
One of the major problems of understanding the customers world is its infinitesize and complexity. The art of making an useful entity relationship model is tovery carefully select what to include in the model and therefore also what not toinclude. Models in the application view, especially this entity relationship model,are by definition far from complete.
video recorder
TV
tuner
storage
TV
screen
movies
sports
news
soaps
channel transmits
selects
tuner
content
live
canned
age, sex,
violence
attributes
describedby
parents
children
inform
s
Figure 2.4: Diagram with entities and relationship for a simple TV appliance
Figure 2.4 shows an example of an entity relationship model for a simple TV.Part of the model shows the well recognizable flow of video content (the bottompart of the diagram), while the top part shows a few essential facts about thecontents. The layout and semantics of the blocks are not strict, these form-factorsare secondary to expressing the essence of the application.
2.5 Dynamic models
Many models, such as entity relationship models, make the static relationshipsexplicit, but don’t address the dynamics of the system. Many different models canbe used to model the dynamics, or in other words to model the behavior in time.Examples are of dynamic models are shown in figure 2.5
Gerrit MullerThe application viewJune 5, 2018 version: 0.2
University of Southeast Norway-NISE
page: 10

flow modelspeople
goods
information
wait forscreening
wait fordiagnose
problem exam
acute exam
no problem
wait for examstate diagrams
20:00 20:30 21:00 21:30 22:00 22:30
broadcast
phone rings
pause viewingfinish conversation
resume viewing
start
movie
end
movie
view viewtalk
record
play
time line
Figure 2.5: Examples of dynamic models
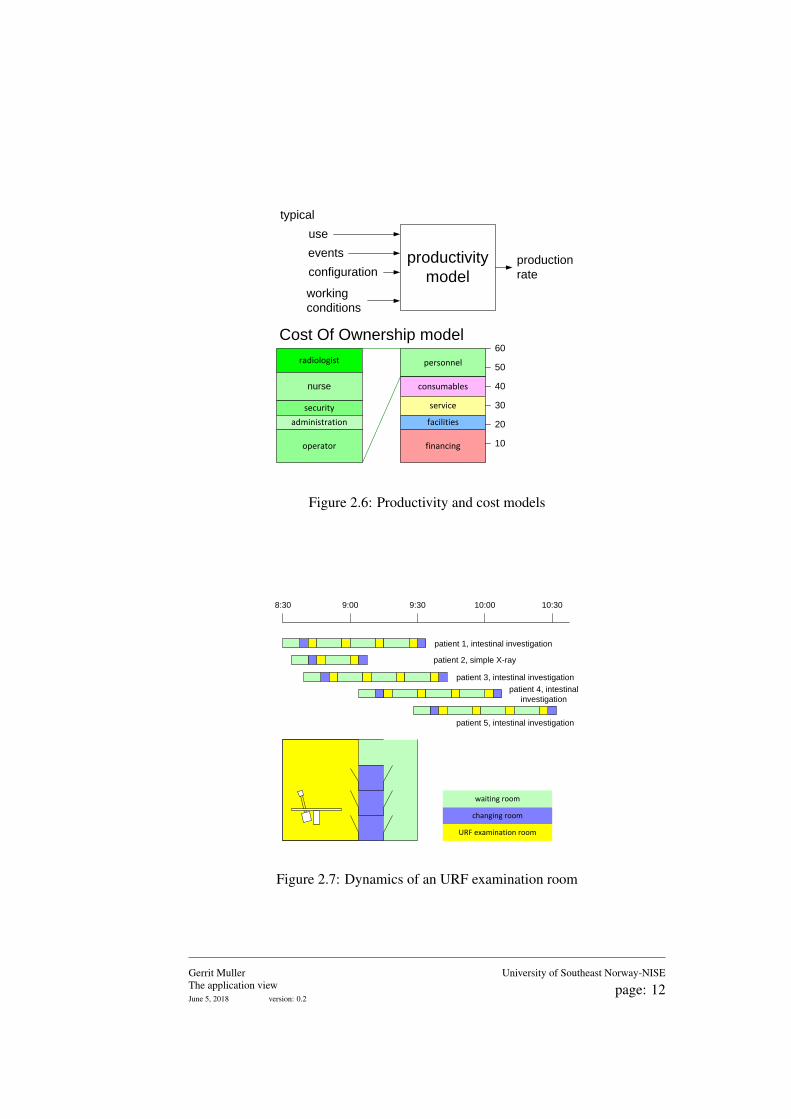
Productivity and Cost of ownership models are internally based on dynamicmodels, although the result is often a more simplified parameterized model, seefigure 2.6.
Figure 2.7 shows an example of a time-line model for an URF examinationroom. The involved rooms play an important role in this model, therefore anexample geographical layout is shown to explain the essence of the time-line model.
The patient must have been fasting for an intestine investigation. In the beginningof the examination the patient gets a barium meal, which slowly moves through theintestines. About every quarter of an hour a few X-ray images-images are made ofthe intestines filled with barium. This type of examination is interleaving multiplepatients to efficiently use the expensive equipment and clinical personnel operatingit.
Gerrit MullerThe application viewJune 5, 2018 version: 0.2
University of Southeast Norway-NISE
page: 11
productivity
model
use
events
configuration
working
conditions
typical
production
rate
personnel
consumables
service
facilities
financing 10
20
30
40
50
60
radiologist
nurse
security
administration
operator
Cost Of Ownership model
Figure 2.6: Productivity and cost models
URF examination room
changing room
waiting room
patient 1, intestinal investigation
patient 2, simple X-ray
patient 3, intestinal investigation
patient 4, intestinal
investigation
patient 5, intestinal investigation
8:30 9:00 9:30 10:00 10:30
Figure 2.7: Dynamics of an URF examination room
Gerrit MullerThe application viewJune 5, 2018 version: 0.2
University of Southeast Norway-NISE
page: 12

Bibliography
[1] Gerrit Muller. The system architecture homepage. http://www.gaudisite.nl/index.html, 1999.
HistoryVersion: 0, date: July 2, 2004 changed by: Gerrit Muller
• created module