logistics orchestration in the ornamental plant supply ... · logistics orchestration in the...
TRANSCRIPT
Page 0/46
Logistics Orchestration in the Ornamental Plant Supply Chain Network:
towards responsive and differentiated demand-driven networks.
Jack G.A.J. van der Vorst
Marco P.J. Duineveld
Frans-Peter Scheer
Joan van den Heuvel
Wageningen University, The Netherlands
Hollandseweg 1, 6706 KN, Wageningen.
Email: [email protected]
Position paper FloriLog-regie WP-II
December 06
Page 1/46
Abstract
At the moment the Dutch ornamental plant sector has a dominant international position fulfilling about
44% of the European market. However, emerging markets are positioned at a great distance requiring
new logistics concepts to operate efficiently and effectively, new marketing channels become apparent
which require increased responsiveness and product diversification, and new competitors like Spain
and Italy are entering the arena. If no action is taken, the Dutch might loose their renowned
international position. What actions should the Dutch ornamental plant sector take; can network
collaboration or logistics orchestration provide the answer? This is the central question in this position
paper as part of the Transforum “FloriLog-regie” project. This paper aims to support the development
of logistics orchestration concepts in the ornamental plant supply chain network by presenting
literature reviews regarding logistics orchestration concepts and network design, and by developing a
typology of orchestration concepts for the ornamental plant supply chain network using case studies
from multiple sectors. The paper is concluded with an overview of recommendations regarding the
design and management of the international supply chain network of the Dutch ornamental plant
sector.
Page 2/46
Contents
Abstract ................................................................................................................................................... 1
1. Introduction .................................................................................................................................... 3
2. Developments in the ornamental plants supply chain network ...................................................... 4
2.1. International position ................................................................................................................... 4
2.2. The structure of the ornamental plants supply chain network ..................................................... 5
2.3. Main developments ...................................................................................................................... 6
3. What is logistics orchestration ? ..................................................................................................... 8
3.1. Types of logistics service providers............................................................................................. 9
3.2. Reasons to outsource logistics activities .................................................................................... 11
3.3. Logistics Network Design.......................................................................................................... 13
4. A framework to typify logistics orchestration concepts ............................................................... 15
4.1. Typology of supply chain strategies .......................................................................................... 15
4.2. A framework to typify logistics orchestration concepts............................................................. 20
5. Case Studies.................................................................................................................................. 24
5.1. The Greenery B.V. ..................................................................................................................... 24
5.2. Zara and Miss Etam ................................................................................................................... 28
5.3. TNT Logistics ............................................................................................................................ 34
5.4. Comparison of the cases in the framework ................................................................................ 35
6. Lessons learned and recommendations to the Dutch ornamental plant sector ............................. 38
7. Conclusion .................................................................................................................................... 41
References ............................................................................................................................................. 43
Page 3/46
1. Introduction
The business in greenhouses is the only Dutch Diamond according to Porter (1998); an internationally
renowned cluster. It is the world of flowers and ornamental plants, vegetables and fruit with
significant global potency. It is organized in value chains and clusters where seed-producers, growers,
traders and transporters are working closely together with most of the time the auctions as market
places in a central position. In terms of Porter the Dutch modern cultivation techniques have allowed
the Dutch Flower Industry to achieve differentiation on freshness, quality and variety. Important
aspects that contributed to this position are according to Porter the following: the existence of highly
specialized research organizations in flower cultivation, packaging and shipping (factor conditions), a
strong home demand (demand conditions), a highly efficient infrastructure in flower handling and air
freight (related and supporting industries), and active domestic rivalry on certain focused places and
specialized home-based suppliers (firm conditions). We may conclude that the Dutch ornamental plant
sector has a leading position in Europe as commercial and logistics service provider (refer Splinter et
al., 2006).
However, in spite of the leading position, there are some developments which can harm this strong
position in the near future. An example is the tendency of scaling up within the sector. Producers and
retailers of ornamental plants are growing very fast the last decade. This means higher volumes and
more direct trade between producers and large retail organizations. Examples are the German
construction centres that accomplish more and more direct trading activities with big Dutch producers,
and IKEA who is setting up its own supply network. Another development is that market shares in the
sales channels are shifting more and more from small florist shops to large construction- and garden
centres and retail outlets. This requires other distribution concepts and relationship building with these
new outlets. A third major development is the shift of production volumes to other countries. The
international positions of Italy and Poland as producing countries are increasing. These countries gain
market share very fast, caused by a wider range of products and low production costs (Splinter et al.,
2006). More competition and new product flows make it more difficult to keep the leading position in
the Netherlands. This could mean that the traditional Dutch flower chain (auctions and wholesalers)
loses control over the market and in the end its renowned international position.
To prevent this from happening and to ensure that a sustainable position is developed in the future, the
project FloriLog-regie was established. FloriLog-regie is a project involving the biggest flower
auctions and trading organizations in The Netherlands (FloraHolland, Bloemenveiling Aalsmeer, VGB
and HBAG). Together with knowledge institutes they have come up with a research project to develop
an international orchestration function in the ornamental plant sector. FloriLog-regie Work Package II
aims at the development of logistics orchestration concepts in the Dutch ornamental plants supply
Page 4/46
chain network, using amongst others simulation modelling in the evaluation process of scenarios. This
position paper aims to support this development by presenting literature reviews regarding logistics
network orchestration concepts and network design, and by developing a typology of orchestration
concepts for the Dutch ornamental plant supply chain network using case studies from multiple
sectors. More in particular, this paper will address the following questions:
• What is logistics orchestration and how can we typify a logistics orchestration concept?
• What can we learn from other sectors regarding this topic?
• What recommendations can we propose regarding the design and management of logistics
orchestration concepts for the Dutch ornamental plant sector?
The next chapter will briefly discuss the structure of the ornamental plants supply chain network and
the main developments its actors are confronted with. Chapter 3 will elaborate on the concept of
logistics orchestration and network design. Chapter 4 presents a framework to typify logistics
orchestration concepts. Chapter 5 discusses case studies from other sectors to get insights in
orchestration concepts applied elsewhere. Chapter 6 will discuss the lessons learned and present the
main recommendations for logistics orchestration in the ornamental plant sector. We will end this
position paper with concluding statements.
2. Developments in the ornamental plants supply chain network
Before we go into the concept of logistics orchestration it is useful to present an overview of the
structure of the ornamental plants supply chain network. Figures regarding the import and export are
presented as well as a generic overview of the supply chain network. Furthermore, an overview is
presented of the main developments in the sector that impact the way business will be done in the
future.
2.1. International position
The Dutch Flower Industry is operating on a global scale with an increasing international turnover; in
2004 they had a market share in the European market of 44% (Splinter et al., 2006). Total export of
ornamental plants in the period 2000-2005 was 1.715 million Euros. For the Dutch the three main
markets are Germany (40% market share), UK (52% market share), and France (33% market share).
The production for this export is not only done in the Netherlands; the import of ornamental plants has
grown fast with 30.4% from 29.9 million Euros in 2002 till 39.0 million in 2004. The main countries
from which goods are imported are Belgium, Germany, Denmark, Spain and Portugal.
Page 5/46
If we zoom in on the different market regions, we signal some differences. In 2005 the total export
volume of ornamental plants to Germany increased by 5%; this growth is mainly caused by the
increasing volume share of supermarkets (28% market share), whereas there is a continuous decrease
in number of small florist shops. In the UK the ornamental plants business increased (4%), mainly via
supermarkets which market share increased with 2% to 30% in 2005. Also in the UK we see the rise of
construction and garden centres, now accounting for 2% of the market. Finally, also the export to
France increased (by 6%). However, although the supermarket wins some market share, the main sales
point remains here the florist shop.
Besides this, the Dutch sector is reasonably concentrated in some regions, has a lot of knowledge,
good production techniques, professional auctions and a good infrastructure. For more information on
facts and figures refer to Splinter et al. (2006).
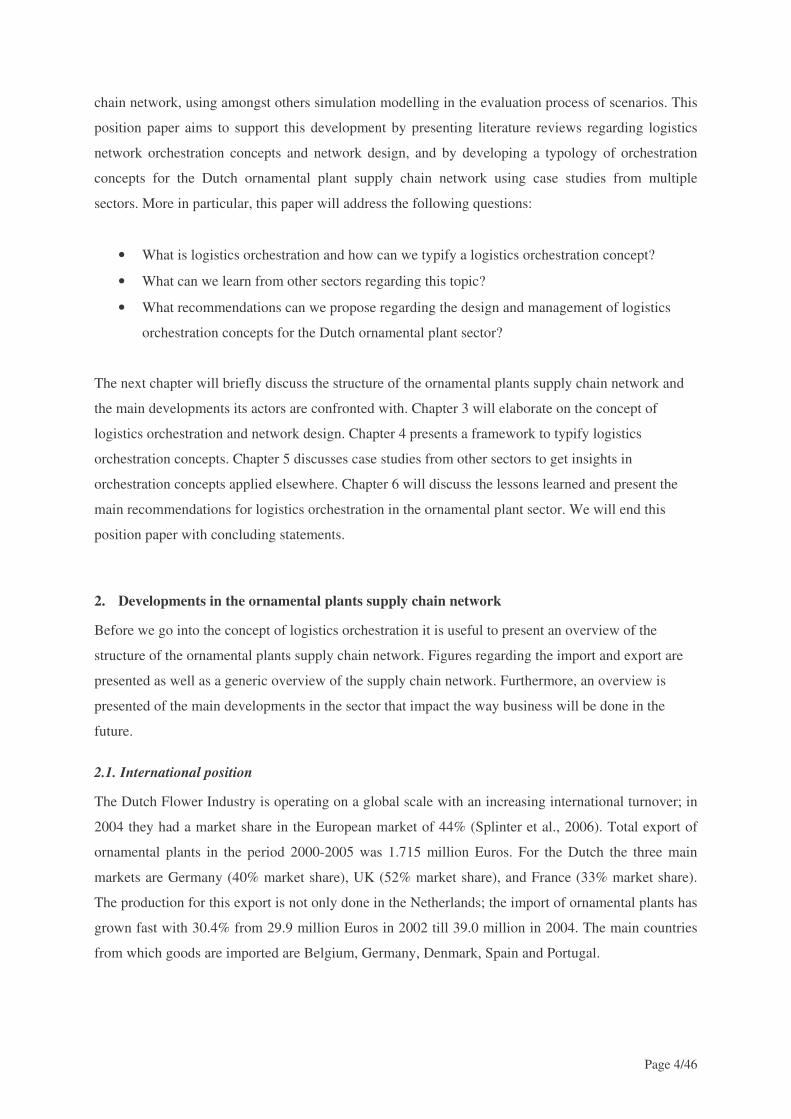
2.2. The structure of the ornamental plants supply chain network
The Dutch ornamental plant sector has a leading position as commercial and logistics service provider.
Figure 1 depicts the network structure of the Dutch ornamental planted sector including the import
flows and foreign market. Each firm is positioned in a network layer and belongs to at least one supply
chain: i.e. it usually has multiple (varying) suppliers and customers at the same time and over time.
Other actors in the network influence the performance of the chain. As Hakansson and Snehota (1995)
state: ‘what happens between two companies does not solely depend on the two parties involved, but
on what is going on in a number of other relationships’. Therefore, the analysis of a supply chain
should preferably take place or be evaluated within the context of the complex network of chains, in
other words a Supply Chain Network (van der Vorst et al., 2005). The (Dutch) ornamental plant supply
chain network consists out of the following links: growers, auctions, traders, logistic service providers
and outlets (see Figure 1). Below we briefly describe the different actors:
• Growers: There are about 1360 Dutch ornamental plant producers which produce about 500
different sorts of plants on a total area of 1930 hectare (Splinter et al., 2006). Most of these
producers are concentrated around the different auctions in the west of The Netherlands.
• Auctions: The two main auctions are Flora Holland and VBA (Veiling Bedrijf Aalsmeer);
who recently announced their full integration. Together they provide facilities at six locations
in the Netherlands for trading in cut flowers (about 70% of turnover) and ornamental plants
(about 30%).
• Traders: The traders can be split up in three groups: wholesalers, exporters and importers.
Sometimes this overlaps, when a Dutch wholesaler also acts as exporter. There are about 1200
Dutch traders, dealing with many (inter)national customers.
Page 6/46
• Logistic service providers: In many cases the transport between two links is outsourced to a
logistic service provider, who takes care of the transport of ornamental plants (mostly by
truck). For example, a large exporter “Lemkes” outsources all its transport to four different
distributors (Van den Heuvel, 2006). In some cases the providers executes extra activities like
quality control, handling and packaging.
• Outlets: Different sales channels can be identified in the national and international market
places, we recognize the following five: florist’s shop, supermarket, discounters, garden- and
construction centre, and market- and street trade.
Figure 1. Supply chain network of the Dutch ornamental plant sector (Van den Heuvel, 2006)
The supply chain network design of ornamental plants and cut flowers is not the same. The most
important difference between both chains is the fact that a flower after being cut looses value of 15% a
day in case not delivered to the customer, whereas an ornamental plant is almost non-perishable (of
course, they do grow). So especially in flower chains speed is essential. A second difference is that
consumers normally buy several cut flowers as a bouquet whereas pot plant are sold piece for piece,
most of the time in a pot. This explains the entrance of IKEA in the ornamental plant business; it
provides them a means to sell more pots. In the world of the ornamental plants the role of the garden
centres and lumber yards is much stronger than in cut flower chains. This leads to direct deals
between retailers and growers with a much higher volume.
2.3. Main developments
Changing consumer requirements, new legal restrictions, foreign competitors that have penetrated the
market with new value propositions, infrastructural problems such as traffic jams, and so on, have
Page 7/46
stimulated actors in Agri-Food Supply Chain Networks to innovate their network structure and
business processes (van der Vorst, 2006). The complexity and dynamism has increased significantly in
the last years and will increase in the years to come, resulting in new actors that enter the playing field,
new ways of managing and coordinating processes, and new technologies to support management
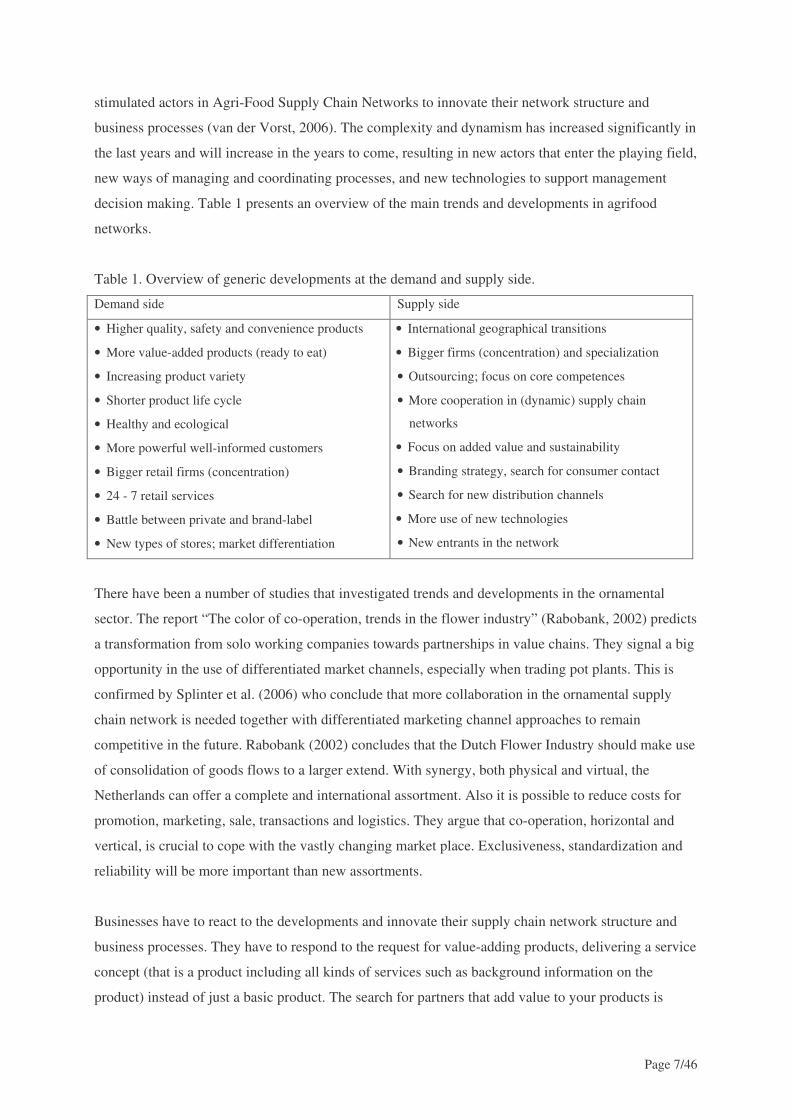
decision making. Table 1 presents an overview of the main trends and developments in agrifood
networks.
Table 1. Overview of generic developments at the demand and supply side.
Demand side Supply side
• Higher quality, safety and convenience products
• More value-added products (ready to eat)
• Increasing product variety
• Shorter product life cycle
• Healthy and ecological
• More powerful well-informed customers
• Bigger retail firms (concentration)
• 24 - 7 retail services
• Battle between private and brand-label
• New types of stores; market differentiation
• International geographical transitions
• Bigger firms (concentration) and specialization
• Outsourcing; focus on core competences
• More cooperation in (dynamic) supply chain
networks
• Focus on added value and sustainability
• Branding strategy, search for consumer contact
• Search for new distribution channels
• More use of new technologies
• New entrants in the network
There have been a number of studies that investigated trends and developments in the ornamental
sector. The report “The color of co-operation, trends in the flower industry” (Rabobank, 2002) predicts
a transformation from solo working companies towards partnerships in value chains. They signal a big
opportunity in the use of differentiated market channels, especially when trading pot plants. This is
confirmed by Splinter et al. (2006) who conclude that more collaboration in the ornamental supply
chain network is needed together with differentiated marketing channel approaches to remain
competitive in the future. Rabobank (2002) concludes that the Dutch Flower Industry should make use
of consolidation of goods flows to a larger extend. With synergy, both physical and virtual, the
Netherlands can offer a complete and international assortment. Also it is possible to reduce costs for
promotion, marketing, sale, transactions and logistics. They argue that co-operation, horizontal and
vertical, is crucial to cope with the vastly changing market place. Exclusiveness, standardization and
reliability will be more important than new assortments.
Businesses have to react to the developments and innovate their supply chain network structure and
business processes. They have to respond to the request for value-adding products, delivering a service
concept (that is a product including all kinds of services such as background information on the
product) instead of just a basic product. The search for partners that add value to your products is

Page 8/46
crucial, which means networks are not per se stable; every network is subject to a degree of dynamism
(De Man, 2005), resulting in partner shifts as new objectives are strived for.
The historical role of the auction as a market place was to guarantee growers a good price and turnover
bringing the products of a large number of growers to a large number of wholesalers. In this sense it
was logical to have these market places organized as cooperatives owned by the growers. Even though
the Dutch market place still has an important role knowing that there are still many specialized
growers and a fewer number of wholesalers, times are changing. The Dutch Market Place is under
pressure; the number of growers is decreasing rapidly and the remaining companies are scaling up.
This means a more business-driven approach by these companies and a growing desire to get a better
position in the external value chains, even to change them. A growing alternative for the trading clock
is the mediation office (also owned by the auctions) where the grower and trader can deal directly (this
is especially the case for ornamental plants). But, more and more retailing companies (supermarkets,
garden centres and shops for building materials) even decide to source their cut flowers and/or
ornamental plants directly from large growers abroad leaving the Dutch Flower Industry with empty
hands. We can conclude that it is time for the Dutch Ornamental sector to act and strengthen its
competitive advantage. Logistics orchestration might be the answer.
3. What is logistics orchestration ?
“Orchestrate”, by Webster dictionary definitions, refers to “the act of arranging or combining so as to
achieve a desired or maximum effect”. Orchestration is a very broad term, difficult to explain and
often associated with power. Engelbart (2003) makes an interesting distinction between three types of
orchestration:
1. Commercial orchestration refers to the deal making and commercial transactions between actors in
the chain. It is about determining the products that are sold (including product design), the service
requirements and the price that is paid.
2. When the commercial deal is made, the goods have to be delivered. That is when logistics
orchestration becomes apparent; it refers to the responsibility of managing and executing logistics
activities in a supply chain network to fulfil customer wishes. Sometimes the commercial
orchestration link possesses the logistic orchestration function as well. It is also possible that a
sub-contractor executes the logistic responsibility on behalf of one or more supply chain actors.
3. Finally, product-passport orchestration refers to the management of quality and other product
characteristics. Food safety and tracking and tracing systems are familiar product-passport
orchestration aspects. It aims at being able to document and trace forward and backward a product
Page 9/46
(batch) and its history through the whole, or part, of a production chain from harvest through
transport, storage, processing, distribution and sales (van der Vorst et al., 2003).
In this paper we explicitly focus on logistics orchestration. To structure this discussion and to define
the term more precise, we will first discuss the development of outsourcing of the logistics function to
so called logistics service providers.
3.1. Types of logistics service providers
Logistics outsourcing means an organization uses a logistics service provider (LSP) to carry out an
activity which is originally performed in-house (Bolumole, 2001). The role of LSPs has changed since
the emergence of the supply chain management (SCM) concept. SCM asserts that organizations along
the supply chain need to reconfigure their operations by internal and external cooperation in order to
accommodate changing customer requirements. To achieve seamless supply chain operations,
organizations are looking for solutions from LSPs.
There are different ways to distinguish LSPs, for example, according to degree of customization
(Delfmann et al. 2002), or by ability of general problem solving and customer adaptation (Hertz and
Afredsson 2003). Based on these researches, we distinguish three main types of LSPs (Hsiao and Van
der Vorst, 2006):
1. Standard LSPs (second party logistics; 2PL): the companies who provide standard and traditional
services, such as transportation and warehouse-based (Long, 2003). The service fulfilled for the
customers are standardized, resulting in highly interchangeable services among this type of LSPs.
These companies are highly specialized in their field and do not take over coordination or
administrative functions for their customers. Standard LSPs plan, implement and control their own
logistics system according to their requirements and considerations.
2. Integrated LSPs (third party logistics; 3PL): these companies provide value-adding services and
also provide at least two standard services without becoming the owner of the goods. In other
words, they combine selected standard services to bundles of logistics services according to their
customers’ wishes. The operational coordination and arrangement of these services bundles are
provided by the LSP, whereas the disposition lies in the responsibility of the buying company
(Delfmann et al., 2002). For example, transportation combined with value-adding activities such
as assembly, re-packing and quality control activities. These bundles are offered undifferentiated
for all potential customers and thus can not be regarded as customized services.
3. Logistics network orchestrator (fourth party logistics; 4PL): The term 4PL was first coined and
registered by Accenture Consulting Company as a trademark in 1996. Accenture defined that “A
4PL provider is a supply chain integrator that assembles and manages the resources, capabilities,
Page 10/46
and technology of its own organization with those of complementary service providers to deliver a
comprehensive supply chain solution.” (Hertz and Afredsson, 2003). A network orchestrator is a
non-asset based service provider, which means that it has no trucks or warehouses of its own, who
outsources logistics activities to standard or integrated LSPs. It is a company who provides supply
chain planning activities and designs logistics services and logistics systems according to the
preferences of their clients. Overall, a network orchestrator takes over coordinative and
administrative responsibility for their customers, and takes over responsibility for the effectiveness
and efficiency of the logistics system of its customer (Delfmann et al., 2002).
Koppius and Van Heck (2005; 274) state that “A network orchestrator has an overview of the
resources and capabilities of the network members on one hand and the demands of the end-customer
on the other hand. The network orchestrator is responsible for configuring the network such that
customers and network member preferences are satisfied.” A network orchestrator assembles and
manages the resources, capabilities, and technology of its own organization, clients, with those of
complementary service providers. Collaborators together carefully plan how capacity should be
created throughout the system, and decide jointly where and in what quantities inventories of various
types should exist (Stadtler and Kilger, 2005). Moreover, they must also decide in advance what
actions will be taken when various unplanned events occur. Thus strategic and tactical plans must be
created collaboratively to achieve the maximum system effectiveness. These plans describe how the
supply chain will respond to variations and uncertainty (Muckstadt et al., 2001). Activities that are
executed by a 4PL are all related to the obtaining of the right information, and translate this into
activities. Examples of activities executed by a 4PL are: market search, logistic network management,
transport sourcing, optimisation, administration, carrier contract negotiation, order handling and
invoice management, production, warehousing and distribution, returns management, and analyzing
and reporting of KPI’s (performance management).
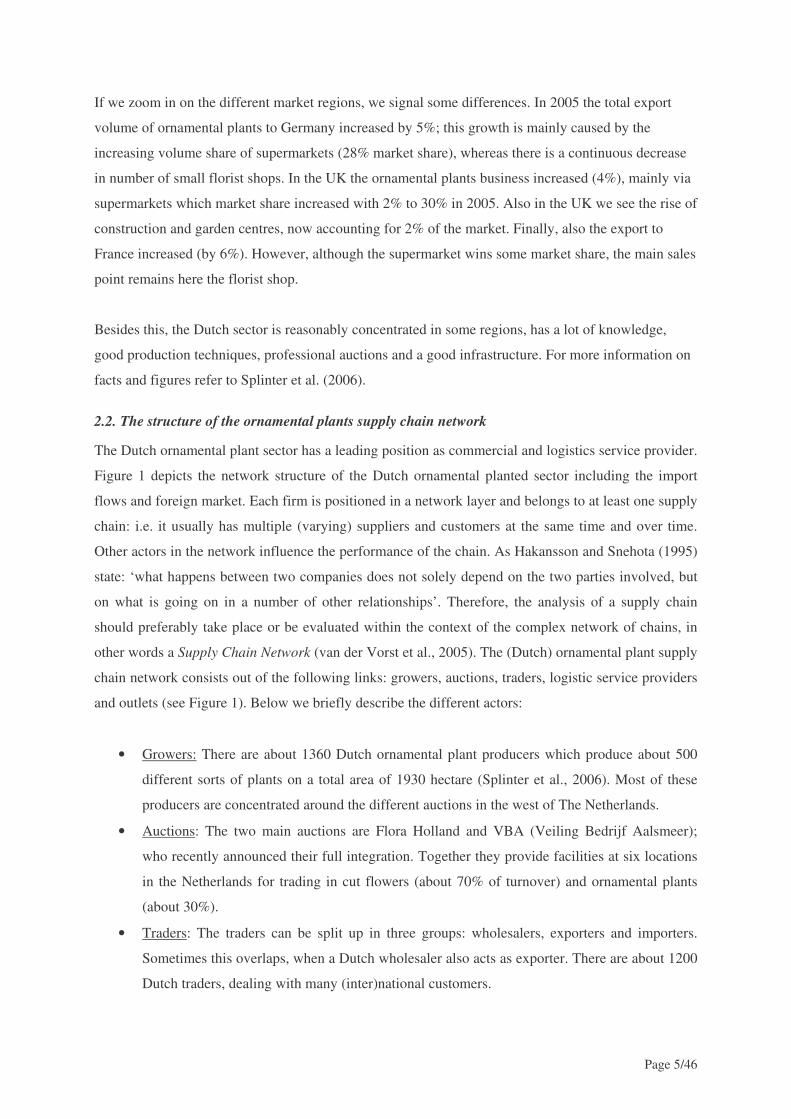
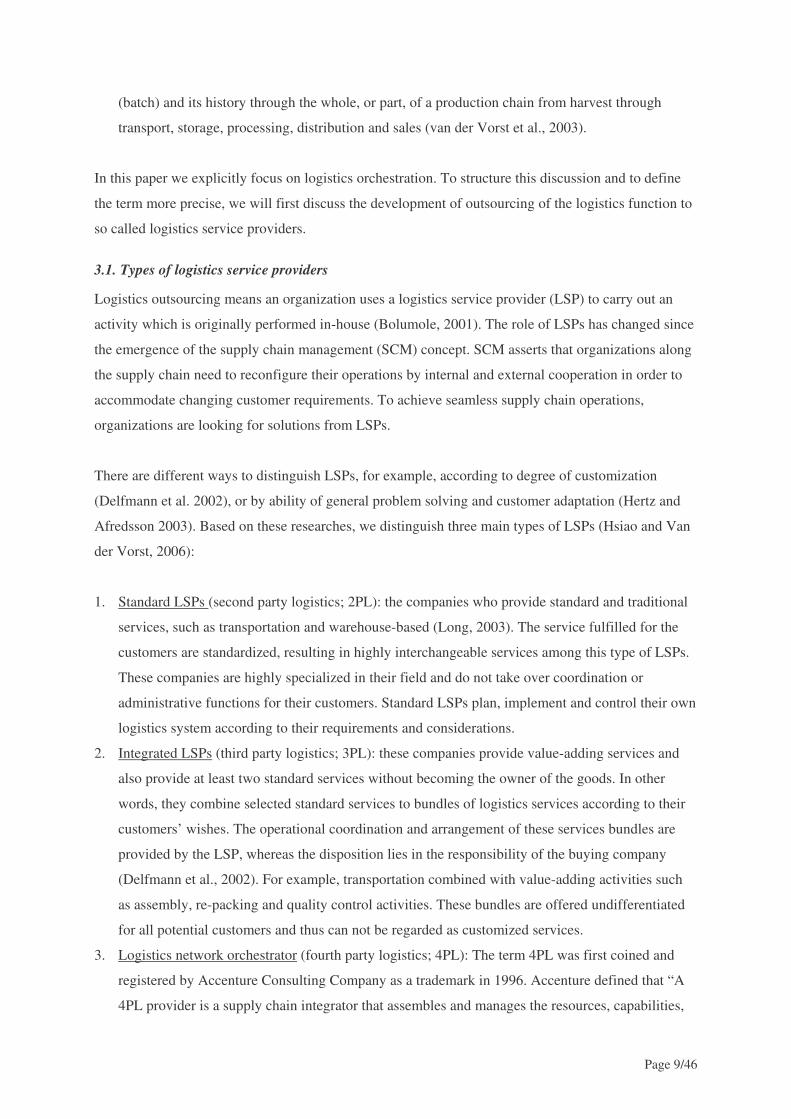
The whole process of the activities of a 4PL and the relation with the other PL’s is illustrated in figure
2. It begins on top with the commercial orchestrator. When a deal is made, a logistic order is send to
the logistic orchestrator. Depending on the type of 4PL, different logistic orchestration activities are
executed by this 4PL; most of the asset-based activities are outsourced to 3PL’s and 2PL’s. Sometimes
a 4PL has its own assets to execute logistic activities, but this is not preferred since one then becomes
a stakeholder. When a 3PL or 2PL is used, a logistic assignment is sent to them. A 3PL again, can use
a 2PL to execute activities on behalf of him.
Page 11/46
Figure 2. The orchestration process of a 4PL (Duineveld, 2006).
3.2. Reasons to outsource logistics activities
Several researches are done about the reasons of the increasing use of 3PL’s in the supply chain.
Shanahan (2004) surveys in his article “3PL roles continue to grow” the growing roll of logistic
providers as integral part in the global supply chain and arguments behind this. Bolumole (2001)
describes the upcoming role of 3PL’s in “The supply chain role of third party logistics”. This article
gives a good impression about the rise of different third party logistic providers in the supply chain.
Wilding (2004) did research about why and what logistic functions should be outsourced. According
to Bolumole and Wilding, the main reasons why organizations decide to make use of 3PL’s are:
• To deal with a more complex supply chain;
• Increasing focus on core business processes;
• Reduction of distribution costs;
• Avoiding extra (inefficient) investments;
• Get access to more centralized distribution systems, what many companies do not have;
• Getting access to wider and existing markets (globalisation);
• Improving service level;
• Assessing present and future market prospects for products and services;
• Keeping up-to-date with technological advancements.
Page 12/46
From the reasons listed service turned out to be more important than cost reduction (Wilding 2004).
Further, Shanahan (2004) noted that 3PL’s start to focus more and more on the quality of their
accounts instead of the quantity. The focus on quality and profitability result in that 3PL’s drop some
unprofitable accounts, renegotiate contracts, and upgrade the quality of service delivered to their
remaining customers to get a stronger relationship.
Logistics orchestrators can surface in different ways. In all cases, very good ICT-possibilities are
required. First of all, a powerful logistic department of a large party in the network can perform the
task of orchestrator (see box 1 for an example). Second, a 3PL can be transformed to a 4PL, who
orchestrates the logistics in the supply chain network as sub-contractor of a commercial orchestrator.
A good example of this category is VOS Logistics Organiser in Nijmegen. This division acts as a non-
asset based service provider within the Vos Logistics group; it develops and offers services with added
value to existing and new customers as well as market segments. It uses an extensive network of
partners and logistic service providers to find optimum transport solutions and network partners.
Finally, entirely new companies can take the orchestration function. Good examples are TNT
Logistics (see section 5) and Schneider Logistics in Venlo. Schneider entered the European market a
number of years ago, but does have major difficulties in setting up business. It turns out that the
American way of doing business differs a lot from the European style (Beulens and Engelbart, 2006).
Box 1. Case example: Nike Inc. (Harps, 2004)
Nike is an example of a company which has possession over the commercial as well as the logistic
orchestration. Nike designs sport accessories for all kind of sport and ships products to 143 global
destinations. Nike's logistics operations are complex, involving three product lines - footwear,
apparel, and equipment - and four regions, managing orders through the company's logistics service
provider network. Setting up the network of providers is a collaborative process between the regions
and Nike's corporate logistics group. Nike works with two global ocean consolidators, five ocean
carriers, four airfreight forwarders, and one courier. The two consolidators (APL Logistics and Maersk
Logistics) are responsible for physically handling the cargo from the factory, receiving the freight,
loading the containers, communicating to destinations in planning shipment deliveries, collecting
documents from the factory and forwarding them to the destination regions. Nike has chosen to
manage its logistics providers in-house rather than outsourcing management to a lead (or fourth-party)
logistics provider. The main reason to do so is the complicated supply chain network process, the in-
house expertise on supply chain management and the need to stay in constant contact with their
customers regarding need dates and freight movement.
Page 13/46
3.3. Logistics Network Design
One of the key aspects in the FloriLog-regie project is the effective and efficient consolidated
distribution of pot plants to the different market segments in order to improve the logistics
performance. A lot of research has been conducted on the design of distribution networks and the
added value of consolidation practices. Key decisions are where to store goods, where to (re)pack
goods and how to transport goods to customers.
Consolidated distribution is required when the volume of the goods to be distributed is smaller than
the transport unit size (combining less than truck loads) or when the total travelling distance can be
reduced by re-combining full truck loads. Consolidation is often needed when for example the
delivery frequency is increased with a resulting decrease in delivery batch size. There are three types
of consolidated transportation (Gianni et al., 2004):
• Temporal consolidation, this means that goods from trucks that have different departing times
are consolidated in other transport units (shifting with schedules in time);
• Facility consolidation, this means that goods which have different destinations are now
transported together in a transport unit for (part of) the route; and
• Product consolidation, this means that goods with different characteristics (e.g. chilled, frozen
or pot plants and vegetables) are transported together in one transport unit.
The result should be a reduced total number of transport unit kilometres (and thus environmental
pollution) by either a reduced transport distance (by optimal route planning) or reduced number of
freights movements (by more full transport unit loads).Consolidated distribution is therefore a specific
network design of sources (departing points), routes and sinks (destinations).
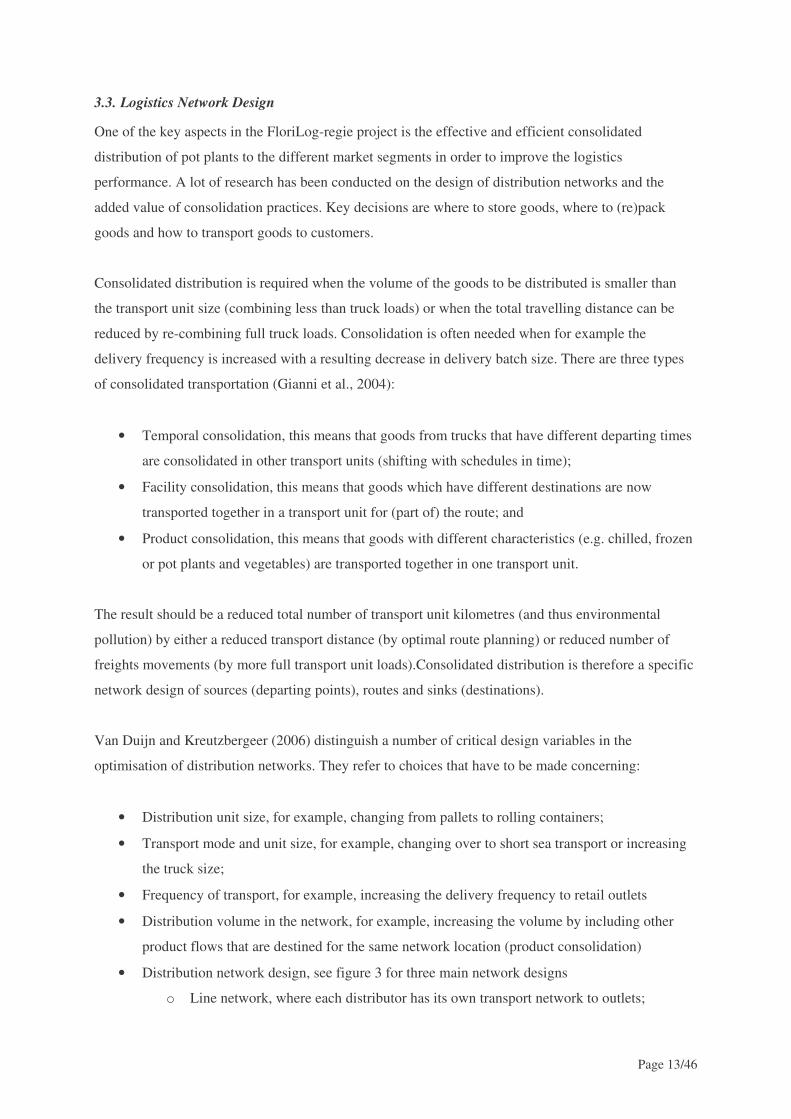
Van Duijn and Kreutzbergeer (2006) distinguish a number of critical design variables in the
optimisation of distribution networks. They refer to choices that have to be made concerning:
• Distribution unit size, for example, changing from pallets to rolling containers;
• Transport mode and unit size, for example, changing over to short sea transport or increasing
the truck size;
• Frequency of transport, for example, increasing the delivery frequency to retail outlets
• Distribution volume in the network, for example, increasing the volume by including other
product flows that are destined for the same network location (product consolidation)
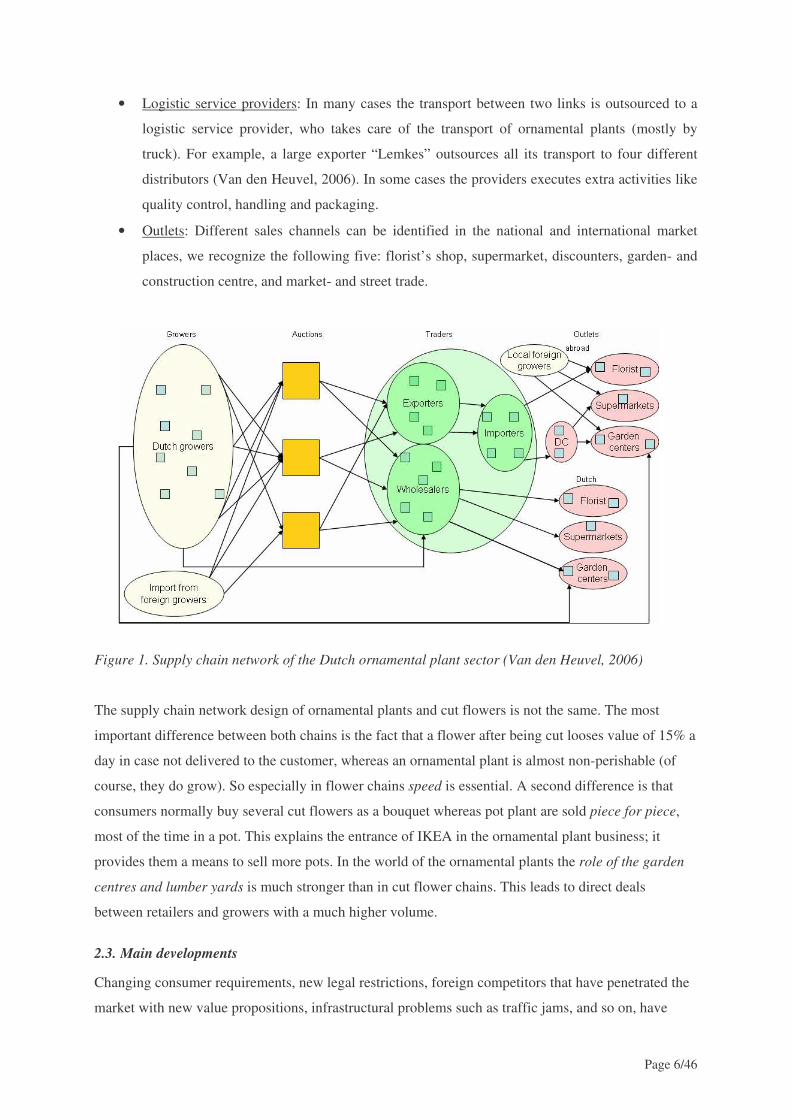
• Distribution network design, see figure 3 for three main network designs
o Line network, where each distributor has its own transport network to outlets;
Page 14/46
o Hub and spoke network , where each distributor delivers the goods to a central hub
where goods are exchanged aiming for specific network destinations;
o Collection and distribution network, especially suited for international networks,
where each distributor delivers the goods to a central collection hub, goods are
consolidated in time, regional destination and product type, and successively
transported to a distribution hub, where goods are resorted (added with products from
other sources) and distributed to specific locations.
One of the design variables in the distribution network is inventory management. In figure 3 a number
of inventory points are presented, however these could just as well be cross-dock facilities where
consolidation activities are performed and no inventory is kept.
Figure 3. Overview of three main network designs (reverse triangle = stock point).
As can be seen in Figure 3 a hub may perform a consolidation or concentration function to combine
many small separate flows into larger flows or split a larger flow into separate smaller flows for
different destinations. Thus, hubs are intermediate points along the paths followed by origin-
destination flows. Groothedde (2005) provides an excellent literature review on hub network design.
It is clear that the network complexity greatly influences the opportunities for improved logistics
network designs and roles of logistics orchestrators. The next section will discuss the ins and outs of
logistics orchestration concepts.
a. Line network
processor
Outlet
Outlet
Outlet
processor
processor
a. Line network
processor
Outlet
Outlet
Outlet
processor
processor
b. Hub and spoke network
processor
processor
processor
Outlet
Outlet
Outlet
processor
processor
processor
Outlet
Outlet
Outlet
c. Collection and distribution network
processor
processor
processor
Outlet
Outlet
Outlet
c. Collection and distribution network
processor
processor
processor
Outlet
Outlet
Outlet
Page 15/46
4. A framework to typify logistics orchestration concepts This section first discusses the theory on supply chain strategies. Section 4.2 presents an overview of
three kinds of orchestration strategies. The last section develops the framework which we will use in
the next section to analyse orchestration concepts in multiple case studies.
4.1. Typology of supply chain strategies
A simple but powerful way to characterize a product when seeking to devise the right supply chain
strategy is the “uncertainty framework.” This framework specifies the two key uncertainties faced by
the product—demand and supply. Fisher introduced the matching of supply chain strategies to the
right level of demand uncertainties of the product. Lee (2002) expanded his framework to include
supply uncertainties.
Marshall Fisher (1997) suggests that the nature of the demand for a product should be carefully
considered before a supply chain strategy is (re)devised. Fisher divides products into two categories:
• primarily functional products satisfying basic needs which have stable, predictable demand and
long life cycles typically with high levels of competition resulting in low profit margins;
• primarily innovative products with higher profit margins, have unpredictable demand and short
life cycles and, usually higher levels of product variety.
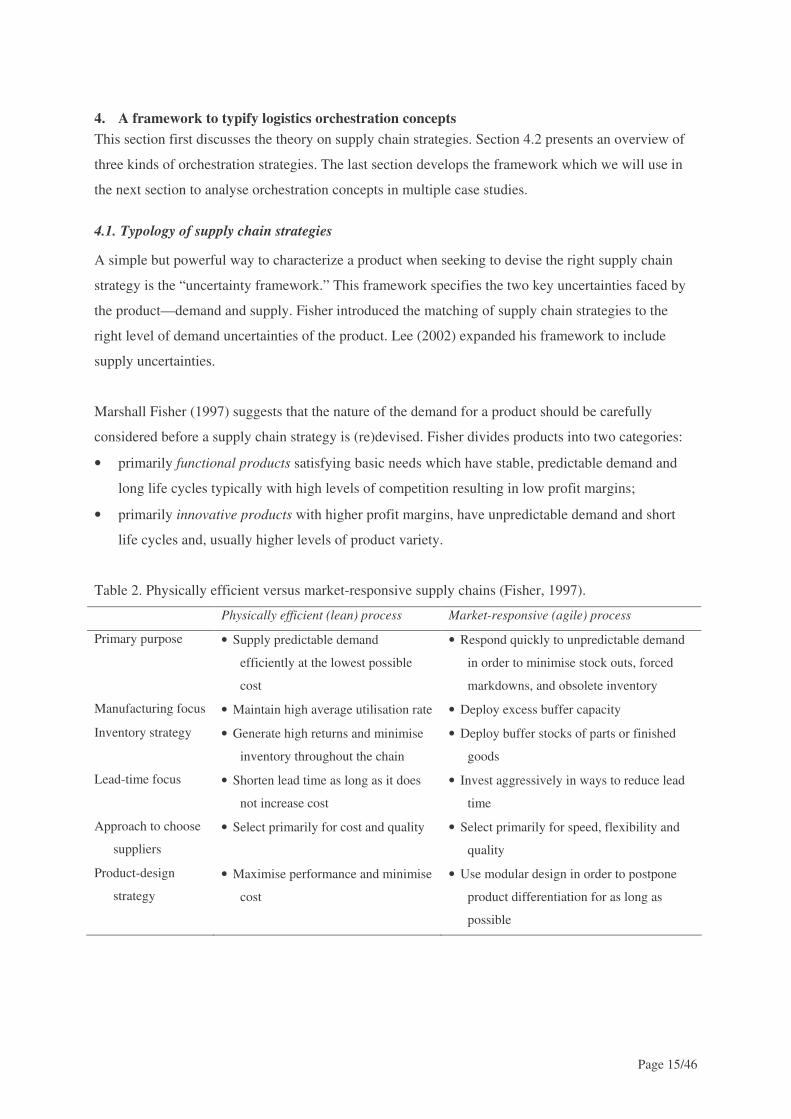
Table 2. Physically efficient versus market-responsive supply chains (Fisher, 1997).
Physically efficient (lean) process Market-responsive (agile) process
Primary purpose • Supply predictable demand
efficiently at the lowest possible
cost
• Respond quickly to unpredictable demand
in order to minimise stock outs, forced
markdowns, and obsolete inventory
Manufacturing focus • Maintain high average utilisation rate • Deploy excess buffer capacity
Inventory strategy • Generate high returns and minimise
inventory throughout the chain
• Deploy buffer stocks of parts or finished
goods
Lead-time focus • Shorten lead time as long as it does
not increase cost
• Invest aggressively in ways to reduce lead
time
Approach to choose
suppliers
• Select primarily for cost and quality • Select primarily for speed, flexibility and
quality
Product-design
strategy
• Maximise performance and minimise
cost
• Use modular design in order to postpone
product differentiation for as long as
possible
Page 16/46
Fisher states that the root cause of the product availability problem in present-day supply chains is a
mismatch between the type of product and the type of supply chain. Supply chains that deal with
functional products should focus on efficiency / leanness to minimise the physical costs related to
production, transportation and inventory storage. On the other hand, supply chains that deal with
innovative products should be designed focussing on responsiveness / agility to minimise market
mediation costs (i.e. the cost that arise when the variety of products reaching the marketplace does not
match what consumers want to buy resulting in lost sales opportunities and dissatisfied customers).
Table 2 compares both types of supply chains.
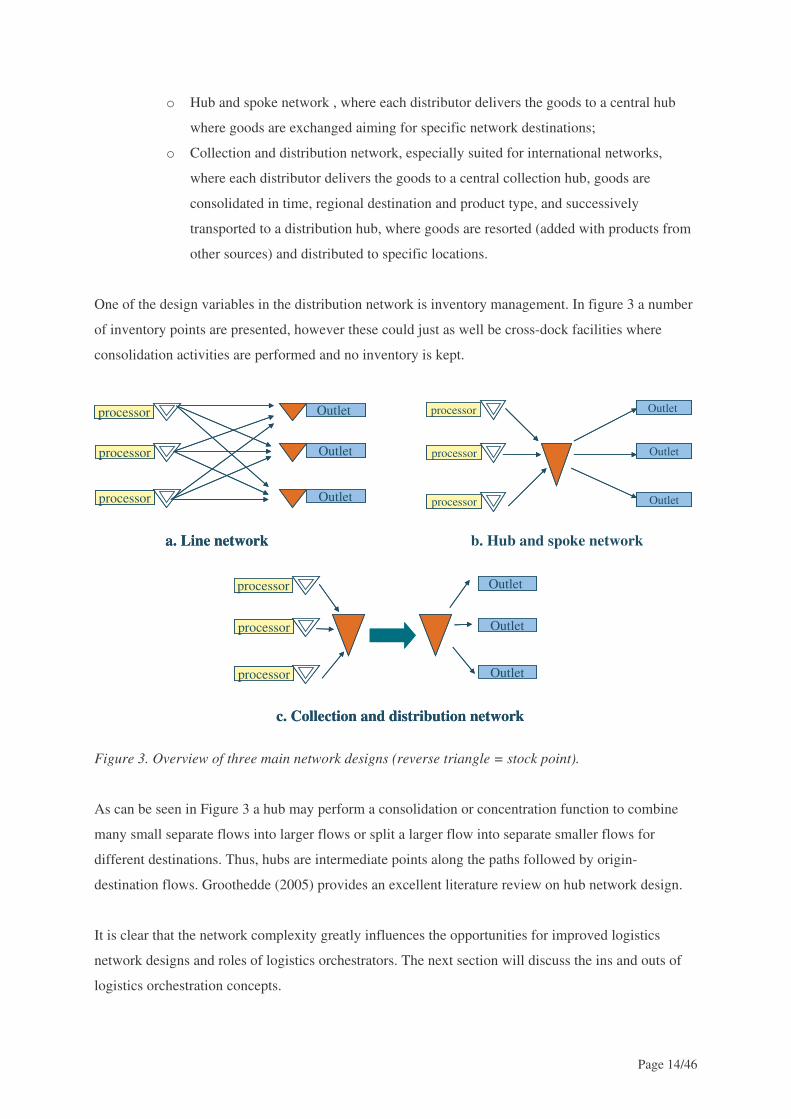
What we have seen in the last 15 years is that consumers and retailers have become much more
demanding and product-life cycles have shortened significantly in all kind of sectors (e.g. computers,
food, automotive). In today’s marketplace the keys to long-term competitive advantage are flexibility
and customer response. This has resulted in functional products becoming more and more innovative
products with high demand uncertainty. The problem is that the supply chains that produce those
innovative products are still mainly focussed on efficiency. According to Fisher they should transform
towards responsive customer-driven supply chains in order to be competitive again; see figure 4.
Figure 4. Supply chain design in relationship with the nature of product demand.
As stated, Lee (2002) extended the thoughts of Fisher by incorporating the aspect of supply
uncertainty. He noticed that it is not always the case that functional products require an efficient
supply chain and innovative products a responsive supply chain. Lee uses a stable (low uncertainty)
and evolving process (high uncertainty) to indicate the level of supply uncertainty. A stable process is
characterized by stable and high yields, more supply sources, reliable sources, less process changes
and easy to change over etc. The evolving process is characterized by variable yields, limited supply
sources, unreliable suppliers, and more and difficult process changeovers, etc. In general information
systems play an important role in the different strategies to exchanging and enabling information to
deal with uncertainty. Lee (2002) describes four strategies (Figure 5):
Match
Mismatch
Mismatch
Match
Efficient (lean) supply chain
Responsive (agile) supply chain
Functional products
Innovative products
Page 17/46
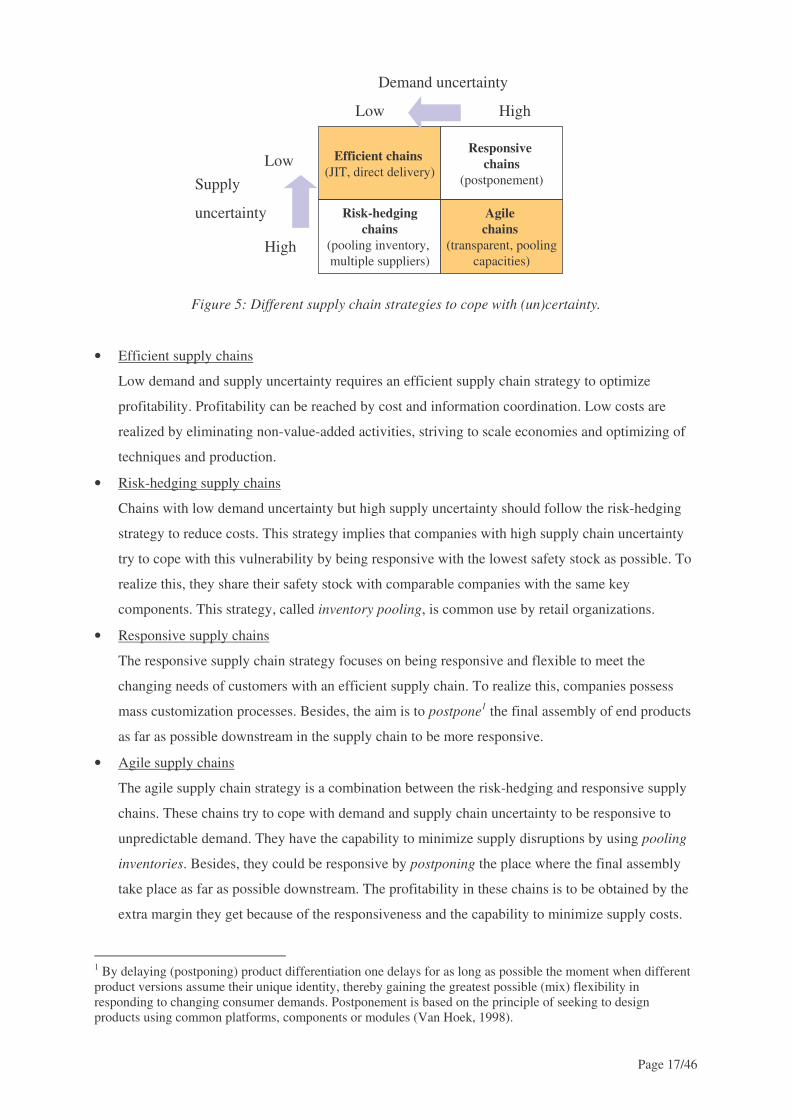
Figure 5: Different supply chain strategies to cope with (un)certainty.
• Efficient supply chains
Low demand and supply uncertainty requires an efficient supply chain strategy to optimize
profitability. Profitability can be reached by cost and information coordination. Low costs are
realized by eliminating non-value-added activities, striving to scale economies and optimizing of
techniques and production.
• Risk-hedging supply chains
Chains with low demand uncertainty but high supply uncertainty should follow the risk-hedging
strategy to reduce costs. This strategy implies that companies with high supply chain uncertainty
try to cope with this vulnerability by being responsive with the lowest safety stock as possible. To
realize this, they share their safety stock with comparable companies with the same key
components. This strategy, called inventory pooling, is common use by retail organizations.
• Responsive supply chains
The responsive supply chain strategy focuses on being responsive and flexible to meet the
changing needs of customers with an efficient supply chain. To realize this, companies possess
mass customization processes. Besides, the aim is to postpone1 the final assembly of end products
as far as possible downstream in the supply chain to be more responsive.
• Agile supply chains
The agile supply chain strategy is a combination between the risk-hedging and responsive supply
chains. These chains try to cope with demand and supply chain uncertainty to be responsive to
unpredictable demand. They have the capability to minimize supply disruptions by using pooling
inventories. Besides, they could be responsive by postponing the place where the final assembly
take place as far as possible downstream. The profitability in these chains is to be obtained by the
extra margin they get because of the responsiveness and the capability to minimize supply costs.
1 By delaying (postponing) product differentiation one delays for as long as possible the moment when different product versions assume their unique identity, thereby gaining the greatest possible (mix) flexibility in responding to changing consumer demands. Postponement is based on the principle of seeking to design products using common platforms, components or modules (Van Hoek, 1998).
Efficient chains(JIT, direct delivery)
Risk-hedgingchains
(pooling inventory, multiple suppliers)
Responsive chains
(postponement)
Agile chains
(transparent, poolingcapacities)
Supply
uncertainty
Low
High
Demand uncertainty
Low High
Page 18/46
It is clear that the easiest supply chain to manage in Figure 5 is the one in the left upper cell. That
means that supply chains which are currently in one of the other cells should try to make the move, as
far as possible, to the left (low demand certainty) and or to above (low supply certainty). We can
conclude that supply chain networks are subject to different levels of uncertainty in time for different
product-market combinations. The major challenge for businesses is to design robust supply chain
networks that can deal with these variations. In this process, one of the deciding factors is the position
of the Customer Order Decoupling Point (CODP).
The Customer Order Decoupling Point (CODP) – also referred to as the Demand Penetration Point
(Christopher, 1998) – separates that part of the organisation whose management decisions are
governed by customer orders (pull process) from the part of the organisation where plans are made
based on forecasted demand of consumer and or forecasted orders from partners downstream in the
chain (push process). Downstream of the CODP (towards the market) the material flow is directly
controlled by customer orders and the focus is on customer responsiveness (lead time and flexibility);
one knows exactly for which customer (marketing channel) the product is intended. Upstream towards
suppliers, the material flow is controlled by forecasting and planning, and the focus is on efficiency
(usually employing large batch sizes); here the product is not assigned to a specific customer but
anonymous. It must be determined where the decoupling point containing, i.e. unassigned inventory of
products, should be for each product-market combination or product group. Therefore a company can
have multiple CODP’s at different locations and even a single product can have more than one, as it
can serve multiple market segments.
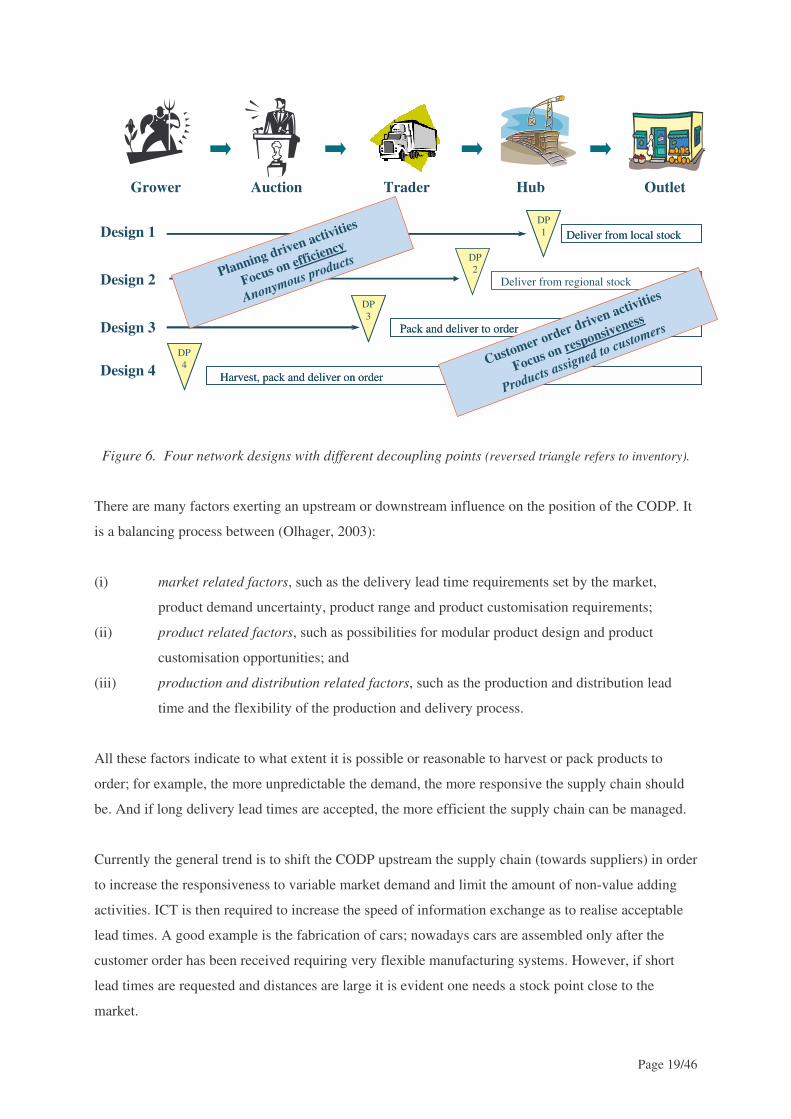
The CODP and postponement concepts result in logistics structures in which a consolidation point is
used to perform product differentiation to customer demands; the supply part towards the
consolidation point is efficiency oriented and the distribution part aims for responsiveness. Hoekstra
and Romme (1992) distinguish five possible positions of a decoupling point (DP). When we link these
positions to the logistics network design typology presented in the previous section and translate it to
the pot plant sector four chain designs come to the front (see Figure 6). In the first two designs all
products are delivered to the customers from local or regional stock – no customisation activities are
performed. In design 3, potted plants are customised (that is value-adding activities to make the plants
customer specific are performed) at the auction, trader or hub and successively delivered to the market
outlets. Finally, in design 4 the grower has a direct relationship with the final customer and harvest,
packs and delivers its products (via traders or transporters) to customer outlets. The auction is
bypassed in this network design.
Page 19/46
Figure 6. Four network designs with different decoupling points (reversed triangle refers to inventory).
There are many factors exerting an upstream or downstream influence on the position of the CODP. It
is a balancing process between (Olhager, 2003):
(i) market related factors, such as the delivery lead time requirements set by the market,
product demand uncertainty, product range and product customisation requirements;
(ii) product related factors, such as possibilities for modular product design and product
customisation opportunities; and
(iii) production and distribution related factors, such as the production and distribution lead
time and the flexibility of the production and delivery process.
All these factors indicate to what extent it is possible or reasonable to harvest or pack products to
order; for example, the more unpredictable the demand, the more responsive the supply chain should
be. And if long delivery lead times are accepted, the more efficient the supply chain can be managed.
Currently the general trend is to shift the CODP upstream the supply chain (towards suppliers) in order
to increase the responsiveness to variable market demand and limit the amount of non-value adding
activities. ICT is then required to increase the speed of information exchange as to realise acceptable
lead times. A good example is the fabrication of cars; nowadays cars are assembled only after the
customer order has been received requiring very flexible manufacturing systems. However, if short
lead times are requested and distances are large it is evident one needs a stock point close to the
market.
Harvest, pack and deliver on order
DP4
Harvest, pack and deliver on order
DP4
Deliver from local stockDP1 Deliver from local stock
DP1
Deliver from regional stock
DP2
Pack and deliver to order
DP3
Pack and deliver to order
DP3
Customer order driven activities
Focus on responsiveness
Products assigned to customers
AuctionGrower Trader Hub Outlet
Planning driven activities
Focus on efficiency
Anonymous productsDesign 2
Design 1
Design 3
Design 4
Page 20/46
4.2. A framework to typify logistics orchestration concepts
When researchers and/or managers discuss the potentials of chain and network development, there is a
need for a ‘language’, a framework, that will allow us to describe supply chains, its participants,
processes, products, resources and management, relationships between these and (types of) attributes
of these in order to allow us to understand each other unambiguously (to a large extent). This section
will present such a useful framework.
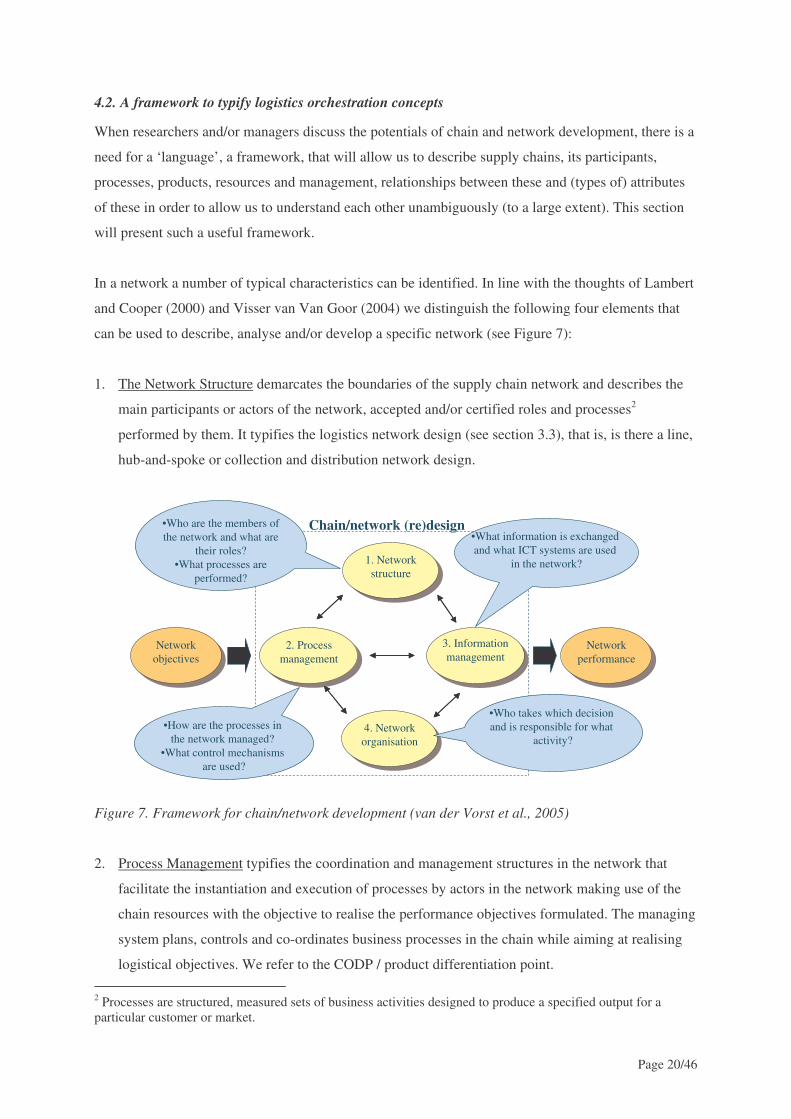
In a network a number of typical characteristics can be identified. In line with the thoughts of Lambert
and Cooper (2000) and Visser van Van Goor (2004) we distinguish the following four elements that
can be used to describe, analyse and/or develop a specific network (see Figure 7):
1. The Network Structure demarcates the boundaries of the supply chain network and describes the
main participants or actors of the network, accepted and/or certified roles and processes2
performed by them. It typifies the logistics network design (see section 3.3), that is, is there a line,
hub-and-spoke or collection and distribution network design.
Figure 7. Framework for chain/network development (van der Vorst et al., 2005)
2. Process Management typifies the coordination and management structures in the network that
facilitate the instantiation and execution of processes by actors in the network making use of the
chain resources with the objective to realise the performance objectives formulated. The managing
system plans, controls and co-ordinates business processes in the chain while aiming at realising
logistical objectives. We refer to the CODP / product differentiation point. 2 Processes are structured, measured sets of business activities designed to produce a specified output for a particular customer or market.
Network objectives
Network objectives
Network performance
Network performance
Chain/network (re)design
1. Networkstructure
1. Networkstructure
•Who are the members of the network and what are
their roles?•What processes are
performed?
3. Information management
3. Information management
•What information is exchanged and what ICT systems are used
in the network?
2. Process management
2. Process management
•How are the processes in the network managed?
•What control mechanisms are used?
4. Networkorganisation
4. Networkorganisation
•Who takes which decision and is responsible for what
activity?
Page 21/46
3. Information management. The managing system takes decisions on the basis of information and
generates control actions. Different logistic control systems require different information systems,
just as different production situations require different control systems. The aspect of transparency
is very important here. So what kind of information can be exchanged and what systems are used?
4. Network Organisation. The organization of logistic network is about who executes what activities,
who takes strategic logistic decisions and who takes the responsibility? It refers to the degree of
logistics orchestration. The key is to sort out which members are critical to the success of the
supply chain – in line with the supply chain objectives.
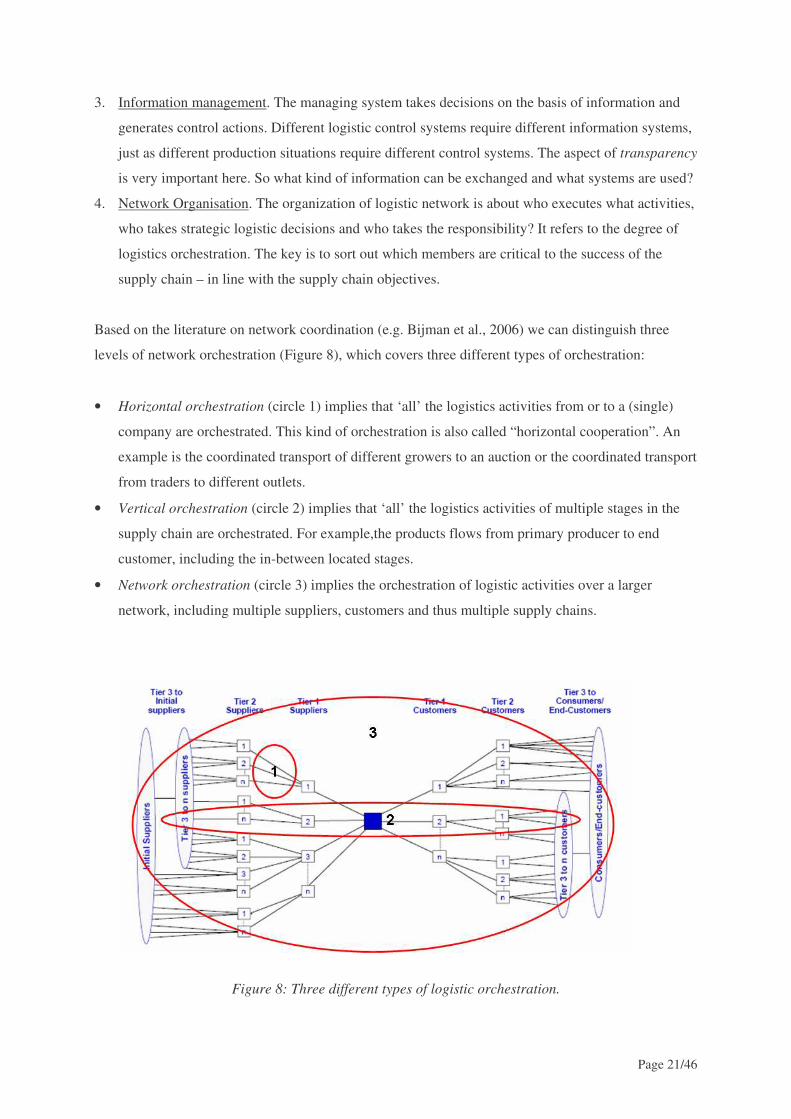
Based on the literature on network coordination (e.g. Bijman et al., 2006) we can distinguish three
levels of network orchestration (Figure 8), which covers three different types of orchestration:
• Horizontal orchestration (circle 1) implies that ‘all’ the logistics activities from or to a (single)
company are orchestrated. This kind of orchestration is also called “horizontal cooperation”. An
example is the coordinated transport of different growers to an auction or the coordinated transport
from traders to different outlets.
• Vertical orchestration (circle 2) implies that ‘all’ the logistics activities of multiple stages in the
supply chain are orchestrated. For example,the products flows from primary producer to end
customer, including the in-between located stages.
• Network orchestration (circle 3) implies the orchestration of logistic activities over a larger
network, including multiple suppliers, customers and thus multiple supply chains.
Figure 8: Three different types of logistic orchestration.
Page 22/46
Each element of the framework is directly related to the objectives of the supply chain network, i.e. the
degree to which the end-user and stakeholder requirements concerning key performance indicators at
any point in time are fulfilled, and at what total cost. Competitive priorities, market winners and
qualifiers (Hill, 1999) are the mostly used terms for priorities that are generic in business strategies.
We distinguish five main competitive priorities (Slack et al., 2006):
• Cost seeks to achieve a lower price than competitors whilst trying to maintain similar value of
product or service to that offered by competitors.
• Lead-time or speed, is the time differences between the time of ordering and the time of receiving
the ordered goods.
• Flexibility. The essential ingredient in each of the dimensions of supply chain flexibility is
reducing the time and effort involved in “setting up” for production and distribution of a different
product or services.
• Reliability. Delivery reliability is the ability to deliver according to a promised schedule. Here the
chain may not have the least costly nor the highest quality product but is able to compete on the
basis of reliability delivering products when promised.
• Product Quality seeks to provide longer shelf-life by avoiding physical damages, spoilages,
temperatures losses etc.
A successful supply chain makes choices of competitive priority across the decision areas that are
consistent with its configuration of competitive strategy. If these objectives are realised in practice can
be measured via the output performance of the supply chain (network) using Key Performance
Indicators (KPIs). These refer to a relatively small number of critical dimensions which contribute
more than proportionally to the success or failure in the marketplace (Christopher, 1998). KPIs
compare the efficiency and effectiveness of a system with the norm or target value. A well-defined set
of supply chain performance indicators will help establish benchmarks and assess changes over time.
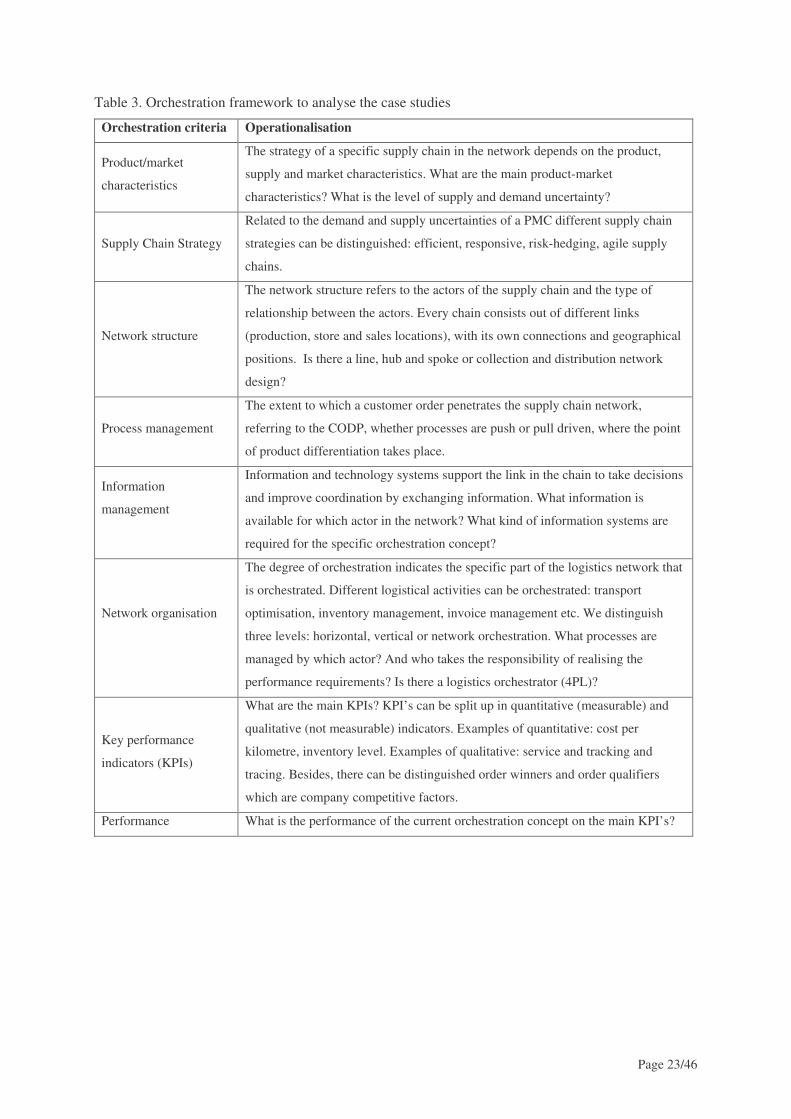
When we combine all elements of logistics orchestration discussed, we come up with a logistic
orchestration framework presented in Table 3. It gives an overview of the relevant aspects of an
orchestration concept. The framework is used in the next section to analyse the orchestration concepts
of different case studies.
Page 23/46
Table 3. Orchestration framework to analyse the case studies
Orchestration criteria Operationalisation
Product/market
characteristics
The strategy of a specific supply chain in the network depends on the product,
supply and market characteristics. What are the main product-market
characteristics? What is the level of supply and demand uncertainty?
Supply Chain Strategy
Related to the demand and supply uncertainties of a PMC different supply chain
strategies can be distinguished: efficient, responsive, risk-hedging, agile supply
chains.
Network structure
The network structure refers to the actors of the supply chain and the type of
relationship between the actors. Every chain consists out of different links
(production, store and sales locations), with its own connections and geographical
positions. Is there a line, hub and spoke or collection and distribution network
design?
Process management
The extent to which a customer order penetrates the supply chain network,
referring to the CODP, whether processes are push or pull driven, where the point
of product differentiation takes place.
Information
management
Information and technology systems support the link in the chain to take decisions
and improve coordination by exchanging information. What information is
available for which actor in the network? What kind of information systems are
required for the specific orchestration concept?
Network organisation
The degree of orchestration indicates the specific part of the logistics network that
is orchestrated. Different logistical activities can be orchestrated: transport
optimisation, inventory management, invoice management etc. We distinguish
three levels: horizontal, vertical or network orchestration. What processes are
managed by which actor? And who takes the responsibility of realising the
performance requirements? Is there a logistics orchestrator (4PL)?
Key performance
indicators (KPIs)
What are the main KPIs? KPI’s can be split up in quantitative (measurable) and
qualitative (not measurable) indicators. Examples of quantitative: cost per
kilometre, inventory level. Examples of qualitative: service and tracking and
tracing. Besides, there can be distinguished order winners and order qualifiers
which are company competitive factors.
Performance What is the performance of the current orchestration concept on the main KPI’s?
Page 24/46
5. Case Studies
What cases do we know of that have implemented some kind of orchestration concept successfully?
And what can we learn from these cases? We have selected three different kinds of supply chain
networks. The first is a case on fruit and vegetables close by, namely the Greenery International. It has
received a lot of media attention since it has recently started to orchestrate its collection logistics of
almost 2000 growers. We have interviewed multiple managers in the Greenery supply chain network
to identify the main lessons learned. The second case deals with the clothing industry, as well the most
successful company from abroad, ZARA, as a local representative from this industry Miss Etam. We
have researched a large amount of literature on the ZARA case and have interviewed managers of
Miss Etam. Finally, we have interviewed a manager and analysed business cases of one of the world
leading Logistic Service Providers, namely TNT logistics. In all cases we will use the framework
presented in section 4 to analyse the cases.
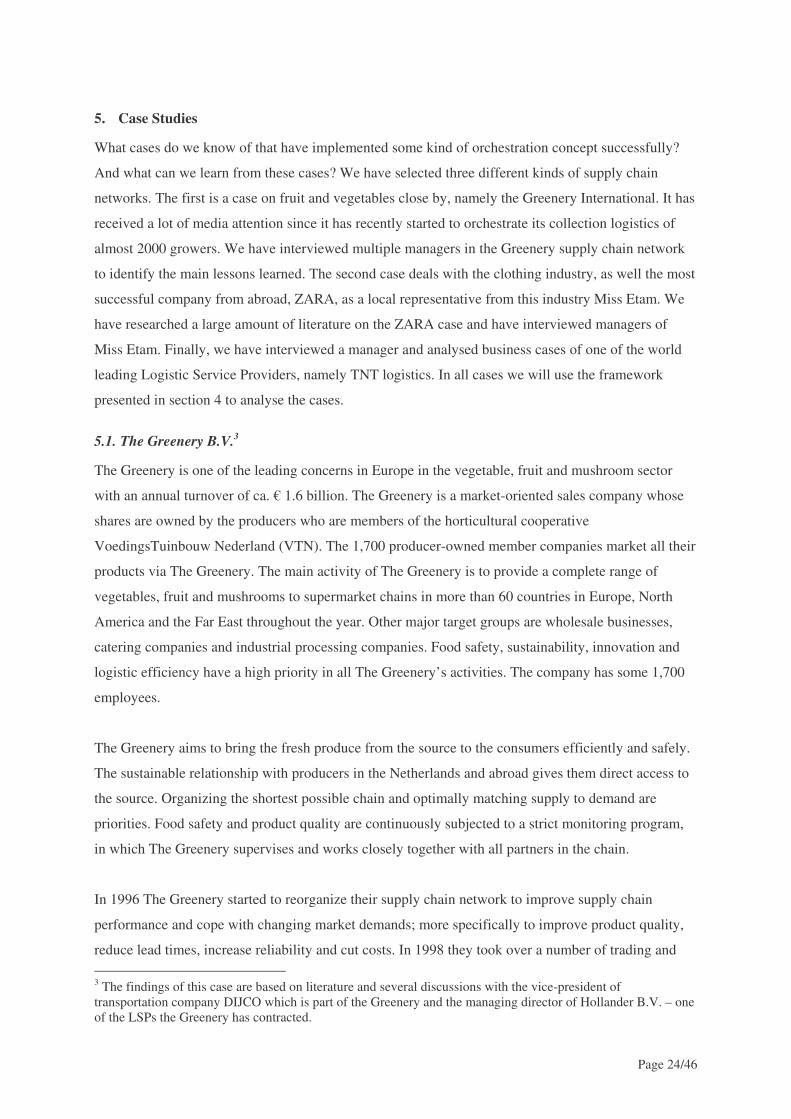
5.1. The Greenery B.V.3
The Greenery is one of the leading concerns in Europe in the vegetable, fruit and mushroom sector
with an annual turnover of ca. € 1.6 billion. The Greenery is a market-oriented sales company whose
shares are owned by the producers who are members of the horticultural cooperative
VoedingsTuinbouw Nederland (VTN). The 1,700 producer-owned member companies market all their
products via The Greenery. The main activity of The Greenery is to provide a complete range of
vegetables, fruit and mushrooms to supermarket chains in more than 60 countries in Europe, North
America and the Far East throughout the year. Other major target groups are wholesale businesses,
catering companies and industrial processing companies. Food safety, sustainability, innovation and
logistic efficiency have a high priority in all The Greenery’s activities. The company has some 1,700
employees.
The Greenery aims to bring the fresh produce from the source to the consumers efficiently and safely.
The sustainable relationship with producers in the Netherlands and abroad gives them direct access to
the source. Organizing the shortest possible chain and optimally matching supply to demand are
priorities. Food safety and product quality are continuously subjected to a strict monitoring program,
in which The Greenery supervises and works closely together with all partners in the chain.
In 1996 The Greenery started to reorganize their supply chain network to improve supply chain
performance and cope with changing market demands; more specifically to improve product quality,
reduce lead times, increase reliability and cut costs. In 1998 they took over a number of trading and 3 The findings of this case are based on literature and several discussions with the vice-president of transportation company DIJCO which is part of the Greenery and the managing director of Hollander B.V. – one of the LSPs the Greenery has contracted.
Page 25/46
transporting companies to establish short links with the main market places. In the beginning of the 21
century The Greenery evaluated their logistics system and concluded that the collection of produce
and the network design could be improved. They started to diminish the number of distribution centres
(formerly more than nine centres) and directed the goods flows to two main hubs, namely Barendrecht
and Bleiswijk. Nowadays, these hubs account for about 70% of the total product flow taking care of
storing, sorting, packaging and labelling, and distribution activities.
Whilst formerly practically all products were marketed using the auction clocks, nowadays the clocks
have almost disappeared. The way to the market is via mediation, in which the Greenery matches
supply and demand, facilitating producers to deliver the products in the right packaging material at the
right time and location. The transport of produce of the 1,700 producers (referring to about 2,000
physical locations) to one of the Greenery distribution centres used to be the responsibility of the
growers. They had to decide for themselves what transport modality, timing and routes were optimal.
As a result all thinkable modalities, times and routes were applied resulting in a huge complexity. This
changed in 2003 when The Greenery took over control of the collection transport.
Collection transport
The current trend is that customers demand shorter lead times, up to four hours. As the vice-president
of transportation company DIJCO (part of the Greenery), said: “It all comes down to lead time. Since
we have daily demand and short delivery lead times it becomes impossible to deliver all customers on
order. We have to ship goods upfront to international customer markets even before we have received
the customer orders. Unfortunately, this requires additional sorting and packaging activities close to
the market.” In order to diminish cost and increase control The Greenery decided to take over the
responsibility of the collection transport. Due to the fact that each individual grower was responsible
for transporting their produce to the distribution centres a lot of inefficiencies in the system became
apparent; a lot of half-truck loads, multiple transporters at the same time in one lane, waiting times at
the warehouse docks, and so on. “We assumed – learning from some small-scaled practices - that
when we would take over control and orchestrate the complete collection transport, performances
would improve drastically”. And so they did starting in 2003.
So how does it work in practice? Growers pass on forecasts to the Greenery via the internet (or a voice
response system) regarding the type and amount of product they expect to supply each coming day. At
the same time customer orders come in from all markets. The most difficult planning process within
the Greenery organization is then to match supply and demand, coming together in the distribution
centres. By using advanced planning software tools, a daily inventory of some products and the
available flexibility in adjusting both supply and demand, the Greenery copes each day with this
challenge. The result of this commercial activity is a large list of products to be collected at many
Page 26/46
locations and to be transported to especially the two large hubs. One of the transporting companies
that were acquired in 1998 was DIJCO who is now in charge of the collection transport. DIJCO
functions as logistics orchestrator as it plans yearly about 450.000 loads; 320.000 of those are
distributed in 75.000 routes with DIJCO trucks, the other 130.000 loads are transported by other
companies based on pallets. They hire trucks each morning from about 30 transporting companies
with in total 250 trucks to collect the goods in the afternoon. There are annual contracts with each
transporting company that includes route prices and/or rates per hour. Each scheduled route accounts
for a certain amount of time. Each contractor obtains a maximum utilization of trucks of about 30%;
the remainder is to be filled with other customers on the market place. “The idea is that this keeps
them alert and independent.” Performance data is collected on a minimum basis (delays), transporters
selection is based on past performance and relationship factors such as flexibility and reliability. What
really matters is volume; “we can do this because we have the volume to divide volumes amongst
multiple parties”. In the future, thinking even more international, adding flowers or potted plants to the
fruits and vegetables assortment (taking care of the differences in optimal environmental conditions)
might be an opportunity to improve performances even more.
So why didn’t the transporting companies that used to collect a large part of the volume before,
organize this system themselves? The vice-president transportation answers; “We first tried to
stimulate them to organize it themselves, but especially due to the dispersion of the sector and the lack
of financial resources they were not able to do so. We were able to organize it via our growers.” For
example, all the financial transactions are done via the Greenery. All growers pay an annual
membership fare; now it includes a fee for all collection costs (about 1% of the grower turnover),
which stimulates the growers to participate.
So the system works fine? Well it does, but there is room for improvement. Especially the information
systems of the Greenery are loosely coupled and not integrated. This prevents an integrated analysis
and decision making concerning the supply, processing and distribution of goods. It would be nice to
have a system that is able to evaluate and compare prices of multiple supply concepts given a specific
customer demand. Furthermore, more advanced barcodes and GPS systems could offer opportunities
to improve the efficiency and speed of processes.
Statement of the transportation manager
“Our core competence is the ability to offer a broad assortment, every day fresh, with quality, with an
acceptable price and with the guarantee that service agreements will be realized“.
Page 27/46
Distribution management
Also in outbound logistics the Greenery takes action. By January 2008 a new dedicated distribution
centre will be in place that is set up together with retailer PLUS Supermarkets and contracted logistics
service provider Hollander BV.
PLUS Supermarkets is a retailer with about 220 franchise retail outlets in the Netherlands. The
supermarket aims at being a highly appreciated fresh produce supplier to consumers. In order to
realize this aim, PLUS aims at orchestrating the fresh produce supply network. First of all, by applying
commercial orchestration; being part of purchasing organization SuperUnie results in increased buying
power and a complete assortment. Second, by facilitating logistics orchestration to decrease logistics
costs and improve logistics excellence.
After a tendering process Hollander – formerly a trading organization with wheels (trucks), nowadays
a LSP - became their logistics service provider for the next 10 years distributing the main fresh
product groups, fruit and vegetables from the Greenery (and other suppliers), and ready-to-eat and
prepared meals. As of 2004 also the distribution of meat products is included in the assortment, and
later this year also dairy products will be included. In total Hollander receives products from 70
suppliers divided over the different product groups. The ordering and delivery unit is a single crate
containing products labelled on product level. Part of the goods (with longer shelf lives; fruit and
vegetables) is kept on stock – the remainder (meat and ready to eat) is distributed using cross docking.
For this cross docking process retail outlets can place replenishment orders (via internet) of all
products each day before 24.00 hrs (no POS-data is received). These orders are collected and send to
the relevant supplier using EDI, who supplies the goods on outlet level at the end of the next day. In
the evening the goods are loaded into the trucks and distributed to the outlets. At opening hours of the
shop the next day the goods are received and put in the shelves, resulting in a total lead time of about
30 hours. For the products on stock the lead time is about 20 hours since replenishment orders are
received until 12.00 hrs and supplied that same night. Due to the close presence of the main fruit and
vegetables supplier The Greenery, high volume flexibility is available for these products.
Each day 46 trucks are leaving the central Hollander distribution centre each to supply on average five
outlets. To distribute the goods Hollander has about 24 trucks in house that are planned to be used
about 14 hours a day. This accounts for about 60% of the total required capacity; the remainder is
hired from about five other transporting companies, making Hollander some kind of 3PL+. Part of the
outsourcing is related to fixed routes. Basis for the planning is the bulk flow – which is fruit and
vegetables delivered by the Greenery. Due to time window regulations PLUS supermarkets can only
be supplied between 7.00 and 13.00 hrs each day. This means that additional transports are required to
fill the schedule; partly by focusing on return goods, partly by collecting goods at suppliers.
Page 28/46
In time Hollander may become a real 4PL without assets, providing goods to even more retail chains
or an even broader product assortment (for example, flowers). According to the general manager,
service levels may be improved by increasing flexibility, less risks and decreased costs. Unique
Selling Point is the knowledge one has on the products that are distributed. Especially for fruit and
vegetables PLUS required a partner that selects the correct products and manages the goods flows. For
the moment, the value adding activities are restricted to sorting, quality control and cross docking.
Packaging and labelling activities are no longer core business and are tasks that can be done much
more efficient by large supplying organizations such as the Greenery (economies of scale is required).
One of the main bottlenecks the company has to deal with is the unreliability of the sales forecast;
especially promotional activities are a problem. Furthermore, dynamic planning of routes and the
implementation of a warehouse management system are wishes for the near future.
Now that the Greenery has organised (part of) the national distribution network, they find it time to
focus on the international network design. In order to come up with an improved network design, they
have initiated a number of studies that should give answers to the future locations and number of hubs
in foreign countries.
5.2. Zara and Miss Etam
When cases in clothing are presented, usually the case of ZARA is discussed. As a result, a lot of
information on Zara can be found in as well scientific as professional articles. We will first briefly
discuss the Zara case and then present a Dutch company that has a comparable way of working in the
Netherlands, the Etam Group.
Amancio Ortega Gaona, the founder of Inditex, thought that consumers would regard clothes as a
perishable commodity just like yoghurt, bread or fish to be consumed quickly, rather than stored in
cupboards, and he has gone about building a retail business that provides “freshly baked clothes”.
React swiftly rather than predict! (D. Dutta, 2003)
Zara 4
Zara is the flagship of the Spanish retail group Inditex SA contributing about 80% of group sales.
Today Zara has nearly 1200 stores worldwide and the firm continues to open about 2 new stores per 4 The information in the Zara case description is based on Dutta, 2003; Fraiman et al., 2002; Ferdows et al., 2003; Ferdows et al., 2004; www.inditex.com. Due to the enormous growth of Zara of the last five years some of the data provided are no longer consistent with today’s reality; however, the general outline of the case is still valid.
Page 29/46
week. There is a clear strategy to make the new stores bigger to allow the firm to showcase its ever-
expanding range of products. Almost 90% of the new stores are being opened outside Spain and
although most continue to be wholly owned by Inditex, one-third of the planned new stores in the Zara
two-year plan will be joint ventures or franchise operations.
Zara’s success is as much the result of its history and location, as its counter-intuitive business
strategy. Zara follows a structure that is more closely controlled than most other retailers, and has the
various business elements in close proximity to each other, around its headquarters in Spain. Most
fashion retailers completely outsource their production to factories around the world, many of them in
low cost Asian countries. Zara’s suppliers, like those for the majority of the other chains, are split into
two groups (Fraiman et al., 2003):
• Volume and long term suppliers (mainly in Asia and Mexico) which offer the benefits of low
prices, but generally produce less "fashionable" products
• Short and medium term suppliers (Europe, North Africa) for the more “fashionable” products.
Zara has a bigger proportion of "medium term" suppliers than its large scale competitors (H&M,
GAP, The Limited), which explains why it is generally regarded as having a more “fashionable”
positioning than its competitors. For the first group, the forecast planning cycle is particularly
important, because the fact of working on long-term cycles means that these suppliers are distanced
from the demand and thus a more significant risk is created with regard to volumes. This explains why
this procurement policy is applied to the more “basic” and therefore less risky products. For the
second group, either the supplier has the capacity to make the products within the specified
time limits, which supposes that it has managed to resolve the issues regarding the availability and
supply of materials from upstream at short notice, or Zara has to produce the raw material on its own
manufacturing sites, thus having the power to control its own scheduling. This explains why Zara has
integrated the “textile” part of the operations into its subsidiary activities, but not the actual making up
(sewing together).
It is estimated that 80% of Zara’s production is carried out in Europe, much of it within a small radius
of its headquarters in Spain. In fact, almost half of its production is in owned or closely-controlled
facilities. While it gives Zara a tremendous amount of flexibility and control, it does have to contend
with higher people cost, averaging 17-20 times the costs in Asia. Counter-intuitively Inditex has also
gone the route of owning capital-intensive manufacturing facilities in Spain. In fact, it is a vertically
integrated group, with up-to-date equipment for fabric dyeing and processing, cutting and garment
finishing. Greige (undyed fabric) is more of a commodity and is sourced from Spain, the Far East,
India and Morocco. By retaining control over the dyeing and processing areas, Inditex has fabric-
processing capacity available “on demand” to provide the correct fabrics for new styles. It also does
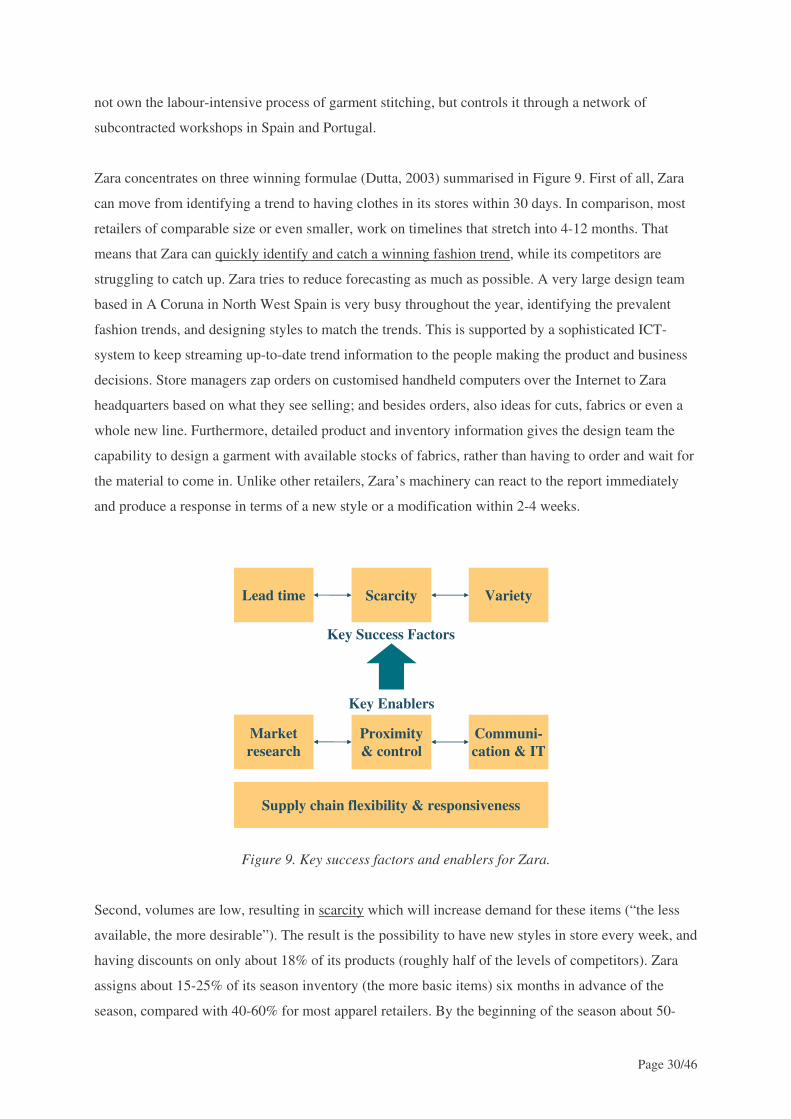
Page 30/46
not own the labour-intensive process of garment stitching, but controls it through a network of
subcontracted workshops in Spain and Portugal.
Zara concentrates on three winning formulae (Dutta, 2003) summarised in Figure 9. First of all, Zara
can move from identifying a trend to having clothes in its stores within 30 days. In comparison, most
retailers of comparable size or even smaller, work on timelines that stretch into 4-12 months. That
means that Zara can quickly identify and catch a winning fashion trend, while its competitors are
struggling to catch up. Zara tries to reduce forecasting as much as possible. A very large design team
based in A Coruna in North West Spain is very busy throughout the year, identifying the prevalent
fashion trends, and designing styles to match the trends. This is supported by a sophisticated ICT-
system to keep streaming up-to-date trend information to the people making the product and business
decisions. Store managers zap orders on customised handheld computers over the Internet to Zara
headquarters based on what they see selling; and besides orders, also ideas for cuts, fabrics or even a
whole new line. Furthermore, detailed product and inventory information gives the design team the
capability to design a garment with available stocks of fabrics, rather than having to order and wait for
the material to come in. Unlike other retailers, Zara’s machinery can react to the report immediately
and produce a response in terms of a new style or a modification within 2-4 weeks.
Figure 9. Key success factors and enablers for Zara.
Second, volumes are low, resulting in scarcity which will increase demand for these items (“the less
available, the more desirable”). The result is the possibility to have new styles in store every week, and
having discounts on only about 18% of its products (roughly half of the levels of competitors). Zara
assigns about 15-25% of its season inventory (the more basic items) six months in advance of the
season, compared with 40-60% for most apparel retailers. By the beginning of the season about 50-
Lead time Scarcity Variety
Marketresearch
Proximity& control
Communi-cation & IT
Key Success Factors
Key Enablers
Supply chain flexibility & responsiveness
Page 31/46
60% of its season inventory has been committed (either already manufactured or subject to firm
commitment with specifications), compared to about 80% for other retailers.
Third, with 200 designers Zara produces roughly 12.000 styles each year. Thus, even if a style sells
out very quickly, there are new styles already waiting to take up the space. Stores are delivered twice a
week, and since re-orders are rare the stores look fresh every 3-4 days.
Zara largely concentrates its forecasting effort on the kind and amount of fabric it will buy. Fabrics are
cheaper than finished goods and the same fabric could be turned into many different garments. For an
extra degree of flexibility, Zara buys semi-processed or uncoloured fabric that it colours up close to
the selling season based on the immediate need. The cutting is done in Zara’s own high-tech
automated cutting facilities (Dutta, 2003). The cut pieces are distributed for assembly (with a set of
easy to follow instructions) to a network of about 400 small independent workshops mostly in Galicia
and in northern Portugal. Most of the informal economy workers at these workshops are mothers,
grandmothers and teenage girls looking to add to their household incomes in the small towns and
villages where they live, allowing low average monthly salaries. Distribution of both outsourced and
in-house manufactured garments is centralised at Zara’s 500,000 square meter distribution centre in La
Coruna (Spain, Portugal, Mexico and Latin America) and another one in Zaragoza (Europe and rest of
the world). The La Coruna distribution centre is centrally located among 14 manufacturing plants.
About 200 kilometres of underground tracks move merchandise from Zara’s manufacturing plants to
the distribution centre covering 400+ chutes that ensure each order reaches its right destination. No
inventory of end products is held centrally, and there is hardly any inventory in the stores besides the
selling floor. Hanging garments are arranged on coded bars that sort automatically by style using
optical reading devices within the distribution centre; every hour about 60,000 items of clothing are
distributed. About 2,5 million garments can move through each distribution centre each week.
Shipments are made out the distribution centre twice a week, by own trucks to Europe and by
airfreight to stores outside Europe. All trucks and connecting airfreights run on established
schedules—like a bus service—to match the retailers’ twice-weekly orders. Shipments reach most
European stores in 24 hours, U.S. stores in 48 hours, and Japanese shops in 72 hours, so store
managers know exactly when the shipments will come in. When the trucks arrive at the stores, the
rapid rhythm continues. Because all the items have already been pre-priced and tagged, and most are
shipped hung up on racks, store managers can put them on display the moment they are delivered,
without having to iron them. The need for control at this stage is minimized because the shipments are
98.9% accurate with less than 0.5% shrinkage. Finally, because regular customers know exactly when
the new deliveries come, they visit the stores more frequently on those days.
Page 32/46
This relentless and transparent rhythm aligns all the players in Zara’s supply chain (Ferdows et al.,
2004). It guides daily decisions by managers, whose job is to ensure that nothing hinders the
responsiveness of the total system. It reinforces the production of garments in small batches, though
larger batches would reduce costs. It validates the company policy of delivering two shipments every
week, though less frequent shipment would reduce distribution costs. It justifies transporting products
by air and truck, though ships and trains would lower transportation fees. And it provides a rationale
for shipping some garments on hangers, though folding them into boxes would reduce the air and
truck freight charges.
According to the founding father of Zara, to be successful, “you need to have five fingers touching the
factory and five touching the customer.” This means control what happens to your product until the
customer buys it. In adhering to this philosophy, Zara has developed a super-responsive supply chain.
Miss Etam
Although we can learn a lot of the Zara case, we have also looked into a comparable fashion retailer
nearby as that allowed personal interviews. It turned out also The Netherlands has a winning case;
Miss Etam, market leader in ladies’ apparel in the Netherlands with a turnover of more than € 250
million, has been in existence for more than 75 years and runs over 125 owned stores all over the
Netherlands with about 1600 employees. Miss Etam is part of the Etam Group BV, which also
includes the Promiss brand and the service company Etam Retail Services. The Etam Group is an
independent company, established in the Netherlands with its headquarters in Zoetermeer and with no
relationship with Etam stores outside the Netherlands; these are part of the French company Etam
Développement.
Comparable to Zara reacting quickly to fashion trends lies at the heart of Miss Etam’s success; every
day the customer can find new arrivals in the collection of ladies’ fashion of about 1200 articles. Items
should be sold within 6 weeks, otherwise they are sold at low prices at one of the 20 outlet stores. This
is facilitated by an innovative goods returns system that enables the company to return unsold goods
from outlets to the distribution centre and redistribute them to other outlets within 2 to 3 days. Miss
Etam focuses her range on the middle segment of the market and is therefore, comparable to Zara,
more concerned with following fashion than setting trends; they select new designs at suppliers and
agree upon small modifications to make their products distinctive. 86% Originates from Dutch small
and medium suppliers giving them very short times-to-market; the remaining comes from Turkey
(5%), Italy (3%), Greece (3%) and Asia (3%). Most suppliers (i.e. those importers that have design
ateliers often in foreign countries) design dedicated clothes. On average each year 10,000 new styles
are marketed, resulting in 12 to 14 million pieces of garment in the stores in the Netherlands.
Page 33/46
Since Miss Etam considers the collection’s ‘freshness and variation’ to be a first priority, the time-to-
market is very short (on average 6-8 weeks from product design to in the store) and practically no
inventory is held. Confirmed orders are therefore placed as near as possible to the time of delivery.
About 20% of all supplied garments are kept on stock at the warehouse, since stores are replenished
with well running garments based on actual sales in the weeks to come. If this stock is also sold out,
new replacements orders can be made; however, then lead times go up to 3 weeks (when fabrics are on
stock) or 6 weeks (if not). The principle is “what is sold today, will be replenished tomorrow.” Miss
Etam tries to establish long term relationships with suppliers. In such a partnership open exchange of
information and flexibility are crucial.
One of the big differences between local Miss Etam and international Zara is that Miss Etam has no
production facilities; it is core process is sales and distribution. Miss Etam even states that this
provides them with additional strategic flexibility, since “shifting to an extra or different type of
supplier is easier than adapting a capital intensive factory with specific capabilities”. Another
difference is the fact that Zara uses a pull process where stores demand specific garments; at Miss
Etam products are pushed (replenished) into the stores based on the last period sales (only the 20% re-
ordering can be typified as pull). Whereas Zara uses a large design team and input from store
managers to identify prevalent fashion trends, Miss Etam puts its efforts in the central analyses of
sales patterns on day-level. This gives them the opportunity to inform suppliers and change colours,
designs, fabrics etc.; to do this - analogous to Zara - a sophisticated ICT-system is the essential
enabler. When we evaluate the performance of Miss Etam, figures turn out even better: low discounts
volumes (12%), only 25% of products are seasonal assigned and stores are delivered 4 times a week
resulting in a very quick response time.
This responsive process is facilitated by Etam Group’s 36,000m2 distribution centre, one of the most
modern in Europe. Every day it handles 100,000 garments (hanging goods) and 20,000 pieces of flat
goods; each day 25 dedicated trucks (outsourced to one transporting company) are transporting
120,000 articles of clothing to the various shops via fixed routes. One of the key success factors is the
integrated hanging system of goods from supply, through the sorting departments of the warehouse,
into the trucks and into the stores, based on single stock-keeping unit. Delivering products shopfloor
ready reduces manual labour and time delays. The Locus warehouse management system enables the
distribution centre to keep continuous track of every individual article. In order to realise Miss Etam’s
principle of ‘today in the distribution centre, tomorrow in the store’ clear arrangements are made with
the suppliers. For example, about which hangers and tags are to be used and about notification and
delivery of goods. The Suppliers’ Manual contains detailed descriptions of these arrangements, and
Miss Etam’s quality requirements are also listed. In addition they are developing a merchandise
planning system which will ensure that today’s sale is replaced in the store tomorrow.
Page 34/46
In future Miss Etam will continue to maintain intensive cooperation with suppliers, for the mutual
benefit of both parties. Flexibility within this relationship is of great importance. As the manager
stated: “It is not the big eating the small … it’s the fast eating the slow”. The just-in-time principle,
which has been Miss Etam’s motto for years and which enables them to react quickly to trends, will
continue to play a big role in the near future.
5.3. TNT Logistics
The third case differs from the first two since we now analyse the activities of a LSP; more in
particular a 4PL as TNT Logistics with no assets (trucks, warehouses). TNT Logistics is a former
division of TNT N.V.,. Since November 2006 TNT Logistics became an independent global company
(the new name of the company will be announced in December 2006). TNT Logistics is the second
largest contract logistics company in the world and the largest independent logistics company (4PL). It
designs, implements and operates complex supply chain solutions (forwarding, warehousing and
transportation management) on a national, regional or global scale for medium to large enterprises.
(www.tntlogistics.com).
In this paper we will zoom in on the Transport Management part of TNT Logistics. TNT Logistics is
one of the world leaders in servicing the logistics needs of for example automotive, healthcare,
FMCG, and high tech electronics industry. TNT experiences an increased need for transport
management due to an increased market demand for visibility and transparency, centralised production
facilities, emerging markets, greater distance between seller and buyer, increased demand uncertainty,
request for speed, efficiency and reliability, rising fuel prices, and so on. Due to these developments
transport accounts for a larger part of supply chain costs. Transport Management of TNT Logistics
designs, controls and executes complex and customised transport solutions as a 4PL. “It refers to the
management, on behalf of the customer, of complex (multi modal) transport supply chain operations,
where both daily and periodical challenges are supported by robust IT-technology and create added
value to the customer’s supply chain on strategic, tactical and operational levels…” as the manager
stated. This statement emphasises the availability of sophisticated IT-technologies as can also be seen
by the large number of activities TNT Logistics provides, examples are:
• At the strategic level: network design, information services, carrier management,
• At the tactical level: planning and forecasting, workflow design, performance reporting,
• At the operational level: order management, shipment planning, execution, event
management, freight bill payment and invoicing.
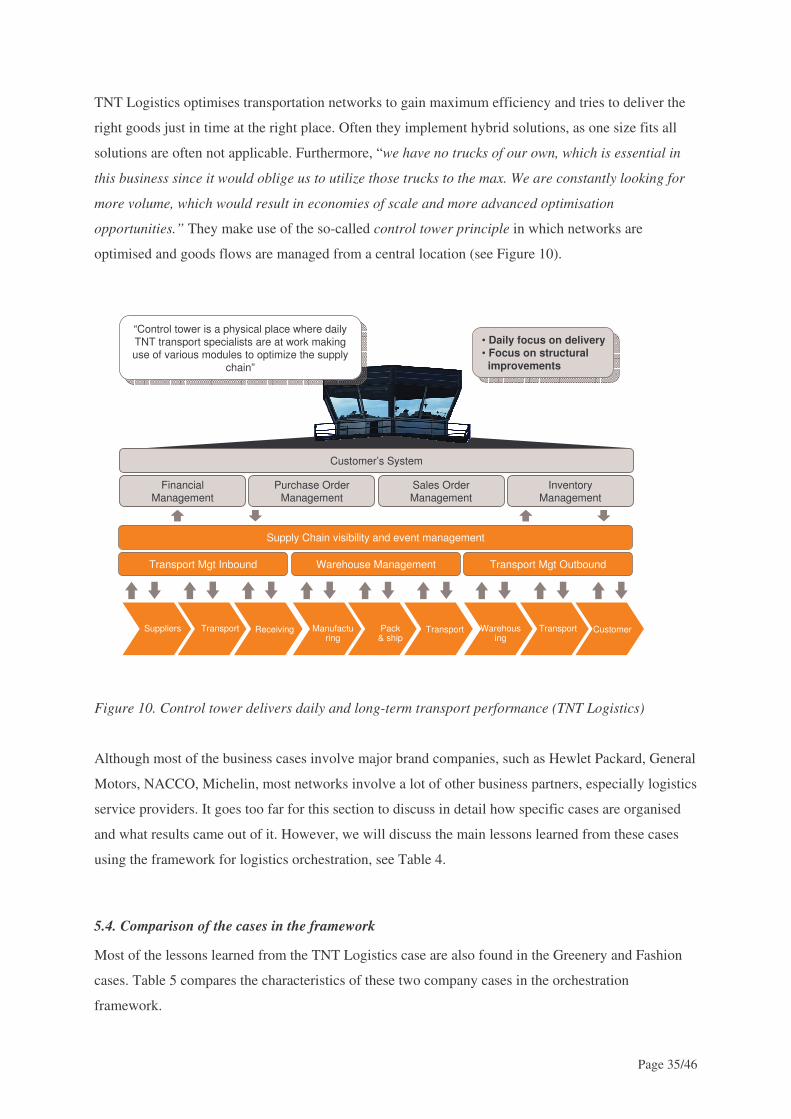
Page 35/46
TNT Logistics optimises transportation networks to gain maximum efficiency and tries to deliver the
right goods just in time at the right place. Often they implement hybrid solutions, as one size fits all
solutions are often not applicable. Furthermore, “we have no trucks of our own, which is essential in
this business since it would oblige us to utilize those trucks to the max. We are constantly looking for
more volume, which would result in economies of scale and more advanced optimisation
opportunities.” They make use of the so-called control tower principle in which networks are
optimised and goods flows are managed from a central location (see Figure 10).
Figure 10. Control tower delivers daily and long-term transport performance (TNT Logistics)
Although most of the business cases involve major brand companies, such as Hewlet Packard, General
Motors, NACCO, Michelin, most networks involve a lot of other business partners, especially logistics
service providers. It goes too far for this section to discuss in detail how specific cases are organised
and what results came out of it. However, we will discuss the main lessons learned from these cases
using the framework for logistics orchestration, see Table 4.
5.4. Comparison of the cases in the framework
Most of the lessons learned from the TNT Logistics case are also found in the Greenery and Fashion
cases. Table 5 compares the characteristics of these two company cases in the orchestration
framework.
Customer’s System
FinancialManagement
Purchase OrderManagement
Sales OrderManagement
InventoryManagement
Supply Chain visibility and event management
Transport Mgt Inbound Warehouse Management Transport Mgt Outbound
Suppliers Transport Receiving Manufacturing
Pack& ship
Transport Warehousing
Transport Customer
• Daily focus on delivery• Focus on structural
improvements
• Daily focus on delivery• Focus on structural
improvements
“Control tower is a physical place where daily TNT transport specialists are at work making use of various modules to optimize the supply
chain”
“Control tower is a physical place where daily TNT transport specialists are at work making use of various modules to optimize the supply
chain”
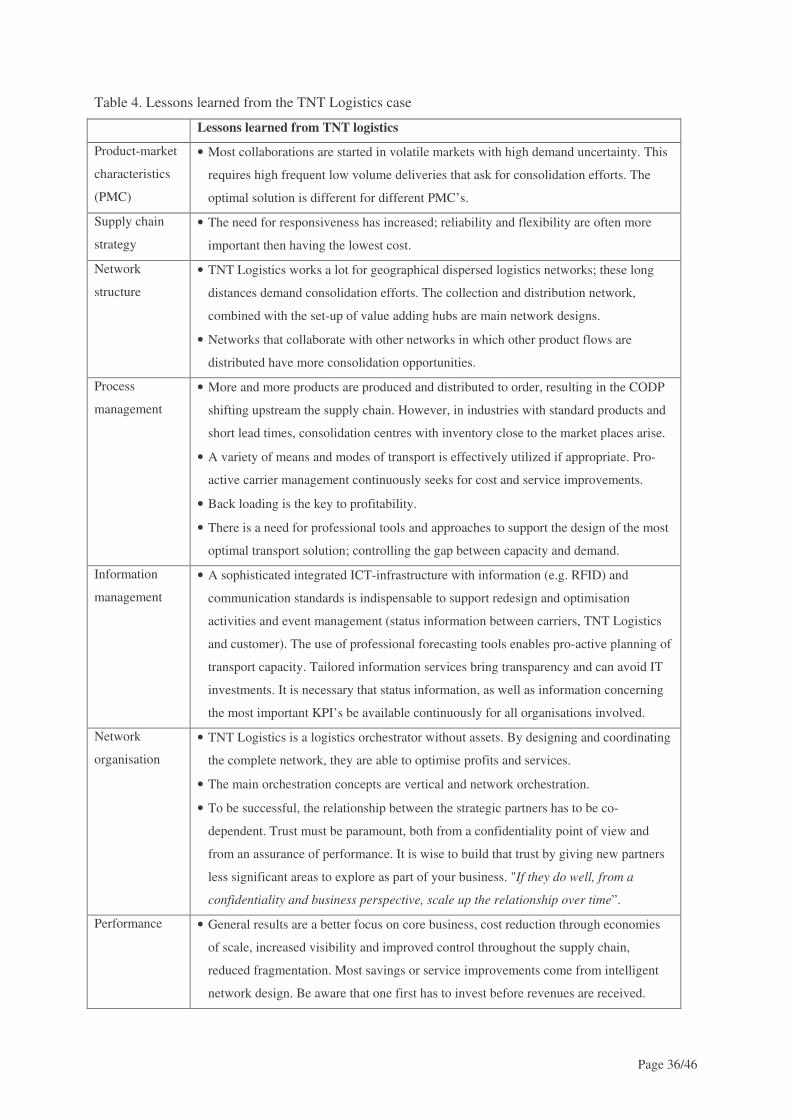
Page 36/46
Table 4. Lessons learned from the TNT Logistics case
Lessons learned from TNT logistics
Product-market
characteristics
(PMC)
• Most collaborations are started in volatile markets with high demand uncertainty. This
requires high frequent low volume deliveries that ask for consolidation efforts. The
optimal solution is different for different PMC’s.
Supply chain
strategy
• The need for responsiveness has increased; reliability and flexibility are often more
important then having the lowest cost.
Network
structure
• TNT Logistics works a lot for geographical dispersed logistics networks; these long
distances demand consolidation efforts. The collection and distribution network,
combined with the set-up of value adding hubs are main network designs.
• Networks that collaborate with other networks in which other product flows are
distributed have more consolidation opportunities.
Process
management
• More and more products are produced and distributed to order, resulting in the CODP
shifting upstream the supply chain. However, in industries with standard products and
short lead times, consolidation centres with inventory close to the market places arise.
• A variety of means and modes of transport is effectively utilized if appropriate. Pro-
active carrier management continuously seeks for cost and service improvements.
• Back loading is the key to profitability.
• There is a need for professional tools and approaches to support the design of the most
optimal transport solution; controlling the gap between capacity and demand.
Information
management
• A sophisticated integrated ICT-infrastructure with information (e.g. RFID) and
communication standards is indispensable to support redesign and optimisation
activities and event management (status information between carriers, TNT Logistics
and customer). The use of professional forecasting tools enables pro-active planning of
transport capacity. Tailored information services bring transparency and can avoid IT
investments. It is necessary that status information, as well as information concerning
the most important KPI’s be available continuously for all organisations involved.
Network
organisation
• TNT Logistics is a logistics orchestrator without assets. By designing and coordinating
the complete network, they are able to optimise profits and services.
• The main orchestration concepts are vertical and network orchestration.
• To be successful, the relationship between the strategic partners has to be co-
dependent. Trust must be paramount, both from a confidentiality point of view and
from an assurance of performance. It is wise to build that trust by giving new partners
less significant areas to explore as part of your business. "If they do well, from a
confidentiality and business perspective, scale up the relationship over time”.
Performance • General results are a better focus on core business, cost reduction through economies
of scale, increased visibility and improved control throughout the supply chain,
reduced fragmentation. Most savings or service improvements come from intelligent
network design. Be aware that one first has to invest before revenues are received.
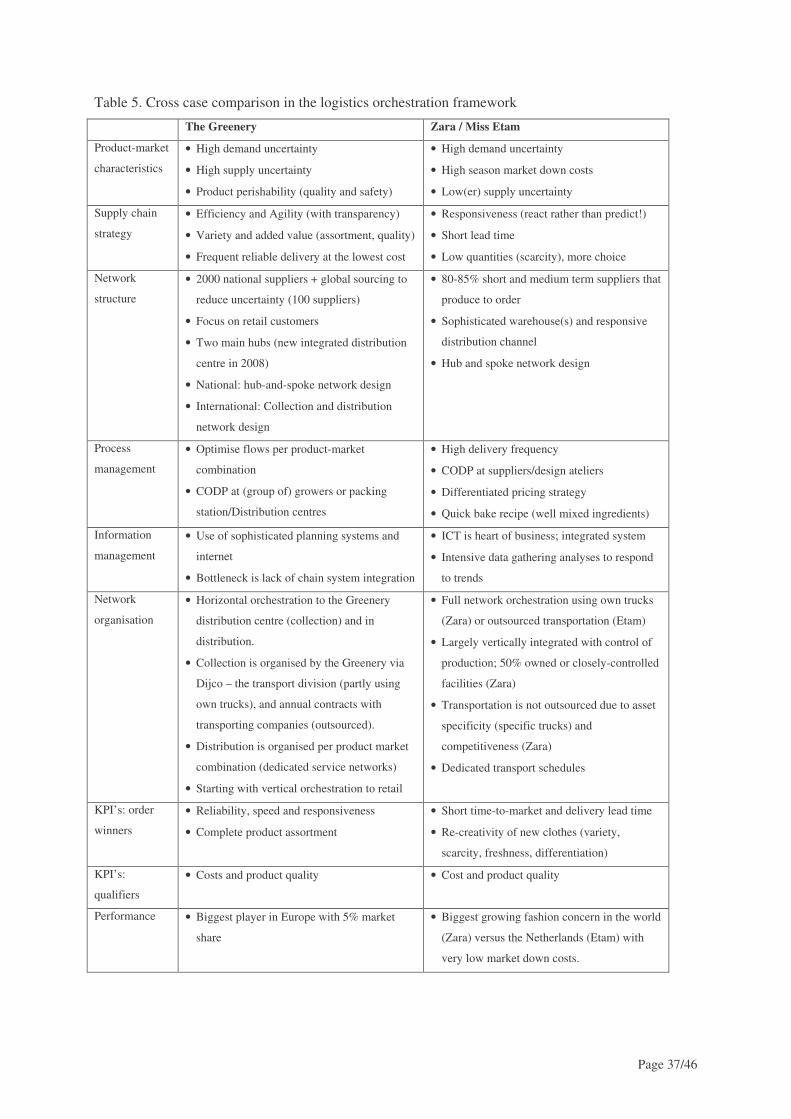
Page 37/46
Table 5. Cross case comparison in the logistics orchestration framework
The Greenery Zara / Miss Etam
Product-market
characteristics
• High demand uncertainty
• High supply uncertainty
• Product perishability (quality and safety)
• High demand uncertainty
• High season market down costs
• Low(er) supply uncertainty
Supply chain
strategy
• Efficiency and Agility (with transparency)
• Variety and added value (assortment, quality)
• Frequent reliable delivery at the lowest cost
• Responsiveness (react rather than predict!)
• Short lead time
• Low quantities (scarcity), more choice
Network
structure
• 2000 national suppliers + global sourcing to
reduce uncertainty (100 suppliers)
• Focus on retail customers
• Two main hubs (new integrated distribution
centre in 2008)
• National: hub-and-spoke network design
• International: Collection and distribution
network design
• 80-85% short and medium term suppliers that
produce to order
• Sophisticated warehouse(s) and responsive
distribution channel
• Hub and spoke network design
Process
management
• Optimise flows per product-market
combination
• CODP at (group of) growers or packing
station/Distribution centres
• High delivery frequency
• CODP at suppliers/design ateliers
• Differentiated pricing strategy
• Quick bake recipe (well mixed ingredients)
Information
management
• Use of sophisticated planning systems and
internet
• Bottleneck is lack of chain system integration
• ICT is heart of business; integrated system
• Intensive data gathering analyses to respond
to trends
Network
organisation
• Horizontal orchestration to the Greenery
distribution centre (collection) and in
distribution.
• Collection is organised by the Greenery via
Dijco – the transport division (partly using
own trucks), and annual contracts with
transporting companies (outsourced).
• Distribution is organised per product market
combination (dedicated service networks)
• Starting with vertical orchestration to retail
• Full network orchestration using own trucks
(Zara) or outsourced transportation (Etam)
• Largely vertically integrated with control of
production; 50% owned or closely-controlled
facilities (Zara)
• Transportation is not outsourced due to asset
specificity (specific trucks) and
competitiveness (Zara)
• Dedicated transport schedules
KPI’s: order
winners
• Reliability, speed and responsiveness
• Complete product assortment
• Short time-to-market and delivery lead time
• Re-creativity of new clothes (variety,
scarcity, freshness, differentiation)
KPI’s:
qualifiers
• Costs and product quality • Cost and product quality
Performance • Biggest player in Europe with 5% market
share
• Biggest growing fashion concern in the world
(Zara) versus the Netherlands (Etam) with
very low market down costs.
Page 38/46
6. Lessons learned and recommendations to the Dutch ornamental plant sector
When we evaluate the findings in the three case studies, we may identify a number of lessons learned
that can be translated into recommendations in general and specific for the potted plants sector.
The case of the Greenery shows that a central coordinated supply chain network reduces collection
costs and improves customer service (partly using own trucks). Their delivery reliability has increased
as well in time as in quantity. Furthermore, growers can focus on their main task that is the growing of
high quality fruits and vegetables. In the distribution network they have partnered with an LSP that
consolidates its flows with other product groups, such as dairy and meat products, facilitating an
efficient and responsive distribution network. Furthermore, they are reorganising the supply chain by
building a new integrated distribution centre. The case study results in the following
recommendations:
1. Make sure you have enough volume to consolidate goods flows. If your own network volume
is too small, try to link up with product groups in other networks – whilst taking care of
differences in optimal environmental conditions.
2. Use consolidation points to perform value adding activities (repacking, labelling, sorting) and
consolidate goods flows. Preferably, design and manage these centres together with other
parties to obtain volume and efficiency. Use the model of the CODP and typology of network
designs to determine where the consolidation points should be located. If delivery lead times
are very short, one has to position them close the (international) market segments.
3. Organise the logistics network in such a way that each actor remains competitive. Do not
make LSPs 100% dependent on your business – keep them alert.
4. Effective orchestration of logistics flows requires sophisticated and integrated ICT systems.
Make sure you have information standards to enable efficient communication platforms.
Although the clothing cases emphasise the fast and flexible design of new clothes, which is impossible
in the ornamental supply chain, a lot can be learned from the logistics point of view; both deal with
perishable products! Especially concerning the design of a responsive supply chain with flexible
distribution centres and channels. We identify the following recommendations:
5. Start your reasoning and network design at the market place. Differentiate to market segments
and product groups. Identify demand and supply characteristics and adopt your logistics
systems to it. Like ZARA have designers who can identify fashion-forward people – the
innovators – and identify what kind of potted plants can be spread to the larger population in
the different market segments. Try to make volume in those markets by focussing on different
market outlets.
Page 39/46
6. Differentiate close to the market. Whereas ZARA and Miss Etam make garments customer
specific close to the selling moment, maybe the ornamental sector can differentiate locally by
altering the packaging material or pots in line with market opportunities. New (joint)
distribution/consolidation centres will have to be established in those locations.
7. The Dutch are famous for their product innovations and logistics - create scarcity by having a
unique and/or large assortment that can not be supplied by competitors.
8. Use dedicated schedules (bus services) to international market segments to improve reliability
and reduce uncertainty. Go for a persistent and transparent rhythm that aligns all the players in
the supply chain network.
9. Invest in the right software, hardware and people. Sophisticated ICT will enable you to gather
market data quickly so you can react to it; furthermore, it will enable you to organise the
collection and distribution of goods through the network more efficient and effective. Think
about the use of RFID-tags and additional information that can be provided regarding the
product history and so on. Update the software, hardware and people (education) frequently.
Also Zara has not built its IT infrastructures in a year or two, they have built it up year after
year, one functional area after another.
Finally, the case of TNT Logistics introduced us into the working methods of a logistics orchestrator.
Next to the overview of their activities, we had in-depth discussions with the manager regarding the
ins en outs of logistics orchestration. We identify the following recommendations:
10. Know your customers, market demand and supply characteristics. Conduct constant market
research and adjust your supply chain network strategy to the requirements.
11. Differentiate your (product and logistics) services to market segments, i.e. set up multiple
supply chains in the total network that can fulfil the different market requirements. For the
potted plant sector we identify florist’s shop, supermarket, discounters, garden- and
construction centre, and market- and street trade (see section 2). Use the uncertainty
framework and evaluate the four supply chain strategies of Lee (2002) for each of these
market segments.
12. Work together with other networks to make volume for consolidation and backhauling
purposes. Backhauling is the key to profitability!
13. Evaluate the opportunities for alternative transport modes to improve the network efficiency.
14. Make use of dedicated partners to organise flexibility in the supply chain network. Trust must
be paramount, both from a confidentiality point of view and from an assurance of
performance. It is wise to use a step by step approach to assure seamless implementation and
to gain trust in the relationship. If one does well, from a confidentiality and business
perspective, scale up the relationship over time.
Page 40/46
Hau Lee, tripe A supply chain (Lee, 2005)
“Evidently, it isn’t by becoming more efficient that the supply chains of Wal-Mart, Dell, and Amazon
have given those companies an edge over their competitors. According to the Hau Lee’s research, top-
performing supply chains possess three very different qualities. First, great supply chains are agile.
They react speedily to sudden changes in demand or supply. Second, they adapt over time as market
structures and strategies evolve. Third, they align the interests of all the firms in the supply network so
that companies optimize the chain’s performance when they maximize their interests. Only supply
chains that are agile, adaptable, and aligned provide companies with sustainable competitive
advantage.”
The cases indicate that vertical cooperation is easier to establish than horizontal cooperation, mainly
due to the fact that there is less rivalry amongst potential partners. However, horizontal cooperation
could bring forth a cooperative spirit among direct competitors (growers, transport companies,
shippers and/or retailers); for example, different producers could plan their logistics flows to result in
just one delivery route to similar or different retail outlets located in the same area. In one way or
another, this has to do with the degree in which logistics is viewed as a competitive means, as well as
the degree in which logistics contributes to possibilities to enable one to stand out and to achieve a
strong market position. In short, logistics cooperation at the horizontal level is usually only possible
when logistics is not considered as a competitive means, but rather as a sort of base or condition for
something else. Of course, this also has to do with the existing financial position of an organisation
and the degree to which cooperation can contribute to improvement of this position. Power too can be
a determining factor. For example, a buyer can exercise pressure on or encourage his suppliers to
cooperate with one another. Think, e.g. of the Greenery, where the supplying growers were actually
commanded not to deliver their products themselves, but to let these be collected by the Greenery. In
this example, the costs of the existing situation were so unduly high (congestion in the docks, traffic
jams, peak hours in the DC, etc.) that a change was unavoidable. This also applies to the principle of
back hauling in which the retail sector commissions products to be collected from the supplying
service companies or producers, so that gaps in its own network can be filled. In fact, vertical power
play has an important role in such situations.
We conclude this section with some generic recommendations:
15. Use the logistics orchestration framework to typify the ornamental supply chain network. It
will clarify the current situation in the network and provide insight in potential orchestration
concepts. Identify and analyse the different product market characteristics, on hand supply
Page 41/46
chain strategies, network structure and network designs, positions of the CODP, state of the
art of ICT-infrastructures, current degrees of orchestration, and most important, current
performances in the different market segments. The last element will guide the development
of new network designs and (vertical, horizontal and network) orchestration concepts.
16. Analyse the roles and functions of each actor in the supply chain network and evaluate the
value that is added by each actor. Do what you can do best!
7. Conclusion From the literature review and case examples we have distilled a perspective for logistics orchestration
concepts in the Dutch ornamental plant supply chain network. From a supply chain network
perspective, a 4PL can function as a chain or network orchestrator when actors (manufacturers,
retailers, farmers etc.) outsource their logistics planning activities to it. In that case the chain
orchestrator could coordinate goods and information flows for the purpose of network effectiveness
and efficiency and service maximization. We have discussed the backgrounds of logistics
orchestration, presented a typology of logistics service providers and have defined a framework to
typify logistics orchestration concepts. By using this framework in the analysis of a number of cases
from different sectors we have come up with a number of recommendations for the Dutch ornamental
plant supply chain network. We hope these recommendations will help to develop responsive and
differentiated demand driven networks in Workpackage II of the FLor-I-Log regie project in order to
improve the competitiveness of Dutch actors and – in the end – retain our renowned international
position as “Dutch Diamond”.
Page 42/46
Acknowledgements
We thank the interviewed managers from the case organisations for providing us with sufficient
information regarding their case description and lessons learned on logistics orchestration.
About the authors
Jack G.A.J. van der Vorst is Full Professor of Logistics and Operations Research at Wageningen
University in the Netherlands. His current research focuses on the development of innovative logistics
concepts in food supply chain networks and the quantitative modelling and evaluation of such
concepts, especially via simulation methodology and applications. His research is published in
international journals, books and at international conferences.
Marco Duineveld is Program Manager Logistics and Supply Chain Management and Frans-Peter
Scheer is Project Manager and Researcher Perishable Logistics at Wageningen UR in the Netherlands.
Their applied research projects focus on supply chain network optimization and innovation employing
an integrative approach of business goals, management and organisation, tracking and tracing,
technologies (RFID, MAP etc) and product knowledge of perishable products. The projects are
executed in close cooperation with all involved agri-food parties like retailers, manufacturers,
auctions, growers, logistic service providers.
Joan van den Heuvel was MSc-student at the Operations Research and Logistics Group at
Wageningen UR and did his thesis work on logistics orchestration in the potted plant sector. Currently
he is general manager at Mestac.
Page 43/46
References
Beulens, A. and F. Engelbart, (2006). NL Regieland: factfinding en analyze. Organisatorisch
innoveren in regie, Uitgave InnovatieNetwerk Groene Ruimte en Agrocluster
Bijman, J., S.W.F. Omta, J.H. Trienekens, J.H.M. Wijnands, E.F.M. Wubben, (2006) International
Agri-Food Chains and Networks: Management and Organization, Wageningen Academic
Publishers
Bolumole, Y. A. (2001) The supply chain role of third-party logistics providers, International Journal
of Logistics Management 12(2): 87-102.
Christopher, M. (1998) Logistics and supply chain management-strategies for reducing cost and
improving service, Londen, Financial Times/Prentice Hall.
Delfmann, W., Albers, S. & Gehring, M. (2002) The impact of electronic commerce on logistics
service providers. International Journal of Physical Distribution & Logistics Management, 32,
203-222.
Duijn, J.H.R. van, E.D. Kreutzberger (2006), Overwegen van nieuwe modellen voor intermodale
transportbundeling, in: F. Witlox, C. Ruijgrock (Eds), VervoersLogistieke Werkdagen 2006,
Nalutilis Academic Books, p. 503-517
Duineveld, M.P.J. (2006) The case of Transnet, a very big South African rail, port and pipeline
company, Wageningen UR
Dutta, D. (2003), Retail @ the speed of fashion, Images
Engelbart, F. (2003). Toekomstbeeld Nederland Regieland in het jaar 20XY, Uitgave
InnovatieNetwerk Groene Ruimte en Agrocluster.
Ferdows, K., M.A. Lewis, J.A.D. Machuca (2003), Zara, Supply Chain Forum, an international
journal, Vol. 4, No. 2, 62-67
Ferdows, K., M.A. Lewis, J.A.D. Machuca (2004), Rapid-Fire Fulfillment, Harvard Business Review,
online version
Fisher, M. L. (1997), What is the right supply chain for your product? Harvard Business Review (75):
105-116.
Fraiman, N., M. Singh, L. Arrington, C. Paris (2002) Zara, Columbia Business School
Ghiani G, Laporte G, Musmanno R. (2004). Introduction to Logistics Systems Planning and Control,
John Wiley & Sons
Groothedde, B. (2005), Collaborative Logistics and Transportation Networks, a Modelling approach
to hub network design, PhD thesis TU Delft
Hakansson, H., Snehota, I. (1995), Developing relationships in Business Networks, London: Routledge
Harps, L. (2004) From Tactical to Strategic: The 3PL Continuum, July, 2004,
www.inboundlogistics.com/articles/features/0704_feature01.shtml
Page 44/46
Hertz, S. & Afredsson, M. (2003) Strategic development of the third party logistics providers.
Industrial marketing management, 32, 139-179.
Heuvel, J. van den (2006), Florilog-regie; development of an international logistics orchestration
position in the potted plant sector, MSc thesis, Wageningen University
Hill, T. (1993). Manufacturing strategy: the strategic management of the manufacturing function,
Basingstoke: MacMillan
Hoek, R.I. van (1998), Reconfiguring the supply chain to implement postponed manufacturing,
International Journal of Logistics Management, 9, 1, 95-110
Hoekstra, S.J., Romme, J.H.J.M. (1992), Integral logistic structures: developing customer oriented
goods flow, London: McGraw Hill
Hsiao, H.I., J.G.A.J. van der Vorst, S.W.F. Omta (2006), Logistics Outsourcing in Food Supply Chain
Networks: Theory and Practices, in: International Agri-Food Chains and Networks:
Management and Organization, (Eds) J. Bijman, S.W.F. Omta, J.H. Trienekens, J.H.M.
Wijnands, E.F.M. Wubben, June 2006, 135-150
Koppius, Otto and Eric van Heck (2005), Supply and Demand Driven Coordination, in: Peter Vervest
et al, Smart Business Networks, Berlin, Springer, p. 273-287.
Lambert, D., Cooper, M. (2000), Issues in Supply Chain Management, Industrial Marketing
Management 29: 65-83.
Lee, H. (2002). "Aligning supply chain strategies with product uncertainties." California Management
Review 44(3).
Long, D. (2003) International logistics: global supply chain management, Dordrecht, Kluwer
Academic Publishers.
Man, de A.P. (2006) Knowledge management in international networks, Transforum position paper.
Muckstadt, J. A., Murray, D. H., Rappold, J. A. & Collins, D. E. (2001) Guidelines for collaborative
supply chain system design and operation. Information Systems Frontiers, 3, 427-453.Olhager
2003
Porter M. (1998), Clusters and the New Economics of Competition, Harvard Business Review,
November 1998
Rabobank (2002), De kleur van samenwerking, trends in the flower industry (In Dutch)
Shanahan, J. (2004), 3PL roles continue to grow, International journal of Logistics Management Feb:
39-42
Slack, N., Chambers, S. & Johnston, R. (2006), Operations Management, Edinburgh, Person
Education Limited.
Splinter G., A. An der Knijff, E. Westerman (2006) Acht uitdagingen voor de Nederlandse
potplantensector, FloriLog-regie: fact-finding en SWOT-analyse, LEI
Stadtler, H. (2005). "Supply chain management and advanced planning - basics, overview and
challenges." European Journal of Operational Research 163(3): 575-588.
Page 45/46
Visser, H.M., Goor, A.R. van (2004), Werken met distributielogistiek, Leiden: Stenfert Kroese (in
Dutch)
Vorst, J.G.A.J. van der (2006), Zicht op Logistiek; Model-Leren van AgriFood Ketennetwerken,
Inaugurele rede Wageningen Universiteit, 6 april 2006
Vorst, van der, J. G. A. J., A. J. M. Beulens and P. v. Beek (2005). Innovations in logistics and ICT in
food supply chain networks. In: Innovation in Agri-Food Systems. W. M. F. Jongen and M. T.
G. Meulenberg. Wageningen, Wageningen Adademic Publishers: 245-292.
Wilding, R. and R. Juriado (2004) Customer perceptions on logistics outsourcing in the European
consumer goods industry, International Journal of Physical Distribution & Logistics
Management 34(8): 628-644.