logger pro 3 quick reference manual
TRANSCRIPT

Quick RefeRence Manual

ii
iii
TaBle Of cOnTenTSThis guide first leads you through the basics of Logger Pro, including software installation procedures. You will
learn how to collect data, manually enter data, and import data from Texas Instruments and Palm handhelds.
From there, you will learn about the more advanced features of Logger Pro.
Getting Started . . . . . . . . . . . . . . . . . . . . . . . . . . . . . . . . . . . . .1
introduction . . . . . . . . . . . . . . . . . . . . . . . . . . . . . . . . . . . . . . . . . .4
Tutorials . . . . . . . . . . . . . . . . . . . . . . . . . . . . . . . . . . . . . . . . . . . . . . . .5
acquiring Data
Collect Data . . . . . . . . . . . . . . . . . . . . . . . . . . . . . . . . . . . . . . . . . . . 5
Manual Data Entry . . . . . . . . . . . . . . . . . . . . . . . . . . . . . . . . . . . . 8
Import Data . . . . . . . . . . . . . . . . . . . . . . . . . . . . . . . . . . . . . . . . . . . . 8
Remote Data . . . . . . . . . . . . . . . . . . . . . . . . . . . . . . . . . . . . . . . . . . 8
Toolbar Guide . . . . . . . . . . . . . . . . . . . . . . . . . . . . . . . . . . . . . . 9
finding Your Way around logger Pro
Logger Pro Toolbar and Pages . . . . . . . . . . . . . . . . . . . . . 10
The Sensors Dialog . . . . . . . . . . . . . . . . . . . . . . . . . . . . . . . . . . 11
Managing Your Page and Data . . . . . . . . . . . . . . . . . . . . .11
Analyze Data . . . . . . . . . . . . . . . . . . . . . . . . . . . . . . . . . . . . . . . . . 13
Printing . . . . . . . . . . . . . . . . . . . . . . . . . . . . . . . . . . . . . . . . . . . . . . . 14
Where to Next? . . . . . . . . . . . . . . . . . . . . . . . . . . . . . . . . . . . . . . 14

iv

1
GeTTinG STaRTeDlogger Pro RequirementsTo use Logger Pro, you will need a Windows or Macintosh computer. See www.vernier.com/lp for detailed system requirements. For data collection you will need a data source such as a LabQuest, LabPro or Go! Link with a Vernier sensor, or a Go! Motion or Go! Temp. Other compatible data sources are listed at www.vernier.com/lp
Note: Logger Pro cannot be used with the ULI or Serial Box interface. Contact us for the availability of earlier versions of Logger Pro for older operating systems or interfaces.
load logger ProWindows Place the Logger Pro CD in the
CD-ROM drive of your computer.
If you have Autorun enabled, the installation will launch automatically; otherwise launch Setup.exe from the CD.
The Logger Pro installer will start, and a series of dialog boxes will step you through the installation of the Logger Pro software. We recommend that you accept the default directory.
Macintosh Place the Logger Pro CD in the CD-ROM drive of
your computer and double-click on the CD icon.
Double-click the “Install Logger Pro” icon and follow the instructions.
Get everything ReadyTo collect data with Logger Pro you will need either a LabPro® or a Go!®Link, with at least one sensor, or one of several dedicated sensors listed below.
a Vernier labQuest interface: The Vernier LabQuest is a color touch-screen data-collection interface. It connects to your computer with its included USB cable.
a Vernier labPro interface: The Vernier LabPro is a multi-channel interface with its power supply and USB or serial cable.
a Go! link interface: Go! Link is a single-channel interface that connects directly to a computer’s USB port.

2
Or, Spectrometer
The Vernier Spectrometer measures intensity and absorbance over many wavelengths simultaneously.
Or, Garmin GPS
Select Garmin GPS units can connect to Logger Pro for live data collection, or the retrieval of stored tracks or waypoints.
Or, Ohaus Balances
Logger Pro allows you to collect mass data from select models of Ohaus balances.
and, at least one sensor:
Sensors are connected to the LabPro or Go! Link. A Stainless Steel Temperature Probe is a good choice for initial testing of Logger Pro. The Voltage Probe included with the LabPro interface can also be used.
Or, Go! Temp
The Vernier Go!Temp is a temperature probe that connects directly to the USB port of your computer. No interface is needed. This sensor comes with the Logger Lite software.
Or, Go! Motion
The Go! Motion is a motion detector that connects directly to a computer’s USB port.
Or, WDSS
The Wireless Dynamics Sensor System collects acceleration, force, and altitude data. It requires a Bluetooth-equipped computer.

3
initial SetupNote: The following setup instructions are for the LabPro interface. They are similar to the LabQuest and Go! Link interface instructions. Choose Logger Pro 3 Help from the Help menu for further details. The LabQuest Quick Start Guide contains information specifi c to LabQuest.
Before launching logger Pro, you should: Power the LabPro using the AC
power supply or AA batteries.
Connect a sensor to LabPro.
Connect the USB or serial cable to LabPro.
Attach the other end of the interface cable to any unused serial port or USB port on your computer.
Start logger ProLocate the Logger Pro icon and double-click on it.
Mac OS X users can fi nd the icon in the Logger Profolder created in Applications during installation.
Note: The fi rst time that you run Logger Pro with your LabPro interface, a message may appear notifying you of an update to the LabPro operating system. Do not interrupt this update.
Logger Pro can collect data from multiple interfaces and devices. If Logger Pro has successfully detected these devices, you will see the device icon (see fi gure below). Also, if an auto-ID sensor is attached, the current sensor reading will appear below the toolbar (as shown in the fi gure). Some devices, such as WDSS, GPS or Ohaus balances, require manual connection in Logger Pro. Choose Connect Interface(device name) from the Experiment menu to connect.
You have now successfully set up your equipment and installed Logger Pro. Keep reading for instructions on the various ways to collect and obtain data. You will also learn how to use Logger Pro’s powerful features, such as data analysis, movies, and customizing your experiments.
In the fi gure above, a Go!Link, Go!Temp, LabPro and Ohaus balance are connected to the computer.

4
inTRODucTiOnLogger Pro is a program that allows you to collect and analyze data from Vernier LabQuest, LabPro, Go! Link, Go!Temp, Go! Motion, Vernier/Ocean Optics Spectrometers, the Vernier WDSS, and Ohaus balances. Among its many features, data may be manually entered from the keyboard, pasted from the clipboard, or retrieved from a file saved on disk. Logger Pro is also a document creator, with the ability to include several pages in one document With Logger Pro you can also:
Perform data analysis, such as statistical analysis, curve fitting, and calculated columns.
Add pictures to lab reports.
Add movies and synchronize movies with data collection.
Import data collected with TI handhelds.
Import data collected with Palm OS® handhelds.
Manually enter data.
Export data to Excel® or other spreadsheets.
Have students draw a prediction on a graph and see how well the experimental data matches it.
Use video analysis to create a graphical representation of the motion you see in a movie.
Use video capture to record video streaming from digital camera or webcam.
The Help guide in the program provides complete details about Logger Pro. Tutorials are also included. Select Open from the File menu to access them.

5
TuTORialSThere are tutorials that cover many Logger Pro features and menus. To access, choose Open from the File menu, then open the Tutorials folder:
All you need to do is open the tutorial fi le you want to try out, and then follow the on-screen instructions in that fi le.
The extensive Help in logger Pro provides detailed instructions for use of the program. The answer you are looking for may be just a mouse click or two away!
Getting Started
Stats, Tangents, Integrals
Events with Entry
Curve Fitting
Motion Measurement
Linearization (Parts 1 and 2)
Manual Data Entry
Video Analysis
acQuiRinG DaTaYou can acquire data in Logger Pro by collecting data from a source, importing from a compatible device, or manually entering data from the keyboard.
collect DataBefore collecting data, perform the Initial Setup steps for your interface. These steps are outlined on page 3 of this guide.
confi gure logger Pro for Your experimentThere are several ways to set up Logger Pro for an experiment. Most are automatic.
Auto-ID Sensors With auto-ID sensors, all you need to do is connect the sensor to one of the LabPro channels and start Logger Pro software. The sensor will be identifi ed, and default data-collection parameters loaded for that sensor. You are ready to click the button and begin data collection!
Probes & sensors experiment fi les If you are using an older Vernier sensor that is not auto-ID, or if you want to use some other specially confi gured fi le, you will need the Probes & Sensors folder. Choose Open from the File menu, and open the Probes & Sensor folder. There you will fi nd a folder

6
for each of the Vernier sensors. Open up a fi le with a name that best fi ts the data collection you want to perform.
Vernier lab book experiment fi les When you choose Open from the File menu, you will see a series of folders with Vernier lab book experiment fi les, such as Biology with Computers, etc. Each of these folders contains 30-40 experiment fi les, each corresponding to an experiment in each of our lab books.
Sensor dialog This dialog, called by clicking the respective button in the toolbar (
This dialog, called by clicking the , for example)
shows your sensor information, the units and current readings. If an auto-ID sensor is connected, Logger Pro will identify the sensors connected. Or, if your sensor is not auto-ID, you can simply drag the sensor to the appropriate channel.
now You are Ready to collect DataClick . Logger Pro will begin plotting data in the graph window. Tip: Normally, the data collection stops at the time indicated on the time axis. You can stop the data collection early by clicking . If you discover you want the data collection to go even longer, you can add additional time by choosing Extend Collection from the Experiment menu.
Now that you have collected data, there are many things you can do with it. Keep reading for descriptions of some of the most commonly-used Logger Pro features.

7
Store DataThe Store Latest Run option in the Experiment menu saves the most recently collected data in memory, allowing you to do another collection without losing the first one.
The run labeled “Latest” always contains the most recently collected data, and is overwritten when you collect more data. When you store the latest run, a new data set named Run 1, Run 2, etc, is created and the values of the latest data set are copied to it. Columns in the latest data set are drawn with thick lines on the graph, while other columns are drawn with thin lines.
Note: Using Store Latest Run does not save data on disk, nor will it preserve your data between sessions or when you turn off your computer. You must select Save As from the File menu to save your session (data and analysis) to disk.
Data collection and ModesYou are not limited to time-based data collection. Choose Data Collection from the Experiment menu to modify data collection parameters for your experiment. See Logger Pro’s Help for information about your choices.
Time Based Set the data collection rate as a function of time.
Events With Entry A data point is recorded whenever the Keep button is clicked. You are then prompted to enter values for a new data column.
Selected Events A data point is recorded whenever the Keep button is clicked.
Digital Events You can set data collection to run continuously (until the Stop button is clicked) or at a certain number of events.

8
Manual Data entryYou can type data directly into the data table from the keyboard. To manually enter data, disconnect all interfaces, and start Logger Pro. Click on a cell and type in a number. You can use the mouse or the Enter/Return key to move and edit within the table. Your values will also be plotted on the graph.
import Data You can import data from a LabQuest. After
collecting data on the LabQuest, connect it to your computer using its included USB cable, and start Logger Pro. Follow the prompts that you see in Logger Pro.
You can import data from Texas Instruments graphing calculators, LabPro, or CBL 2 devices using the TI Connectivity Cable. Do so by choosing Import FromTI Device from the File menu or clicking the button. The dialog box to the right will appear with the available data lists for importing.
Data collected and stored in the LabPro interface using its Quick Setup feature can be imported via the serial or USB cable. Do so by choosing Import FromLabPro from the File menu.
Data collected with a Palm OS handheld running the Vernier Data Pro program can be imported by fi rst starting up Logger Pro, placing the Palm OS handheld into its HotSync® cradle, and pressing the HotSync button. Data are then displayed in the table and graph of Logger Pro, where you can print or do further analysis.
Remote DataLabQuest, LabPro, Go! Motion and WDSS can collect data without a computer attached. You can use Logger Pro to set up the experiment, detach the device, collect data remotely, then reattach the device to the computer to retrieve the data. Select RemoteSetup from the Experiment menu to set up LabQuest, LabPro, Go! Motion or WDSS for remote data collection.
9
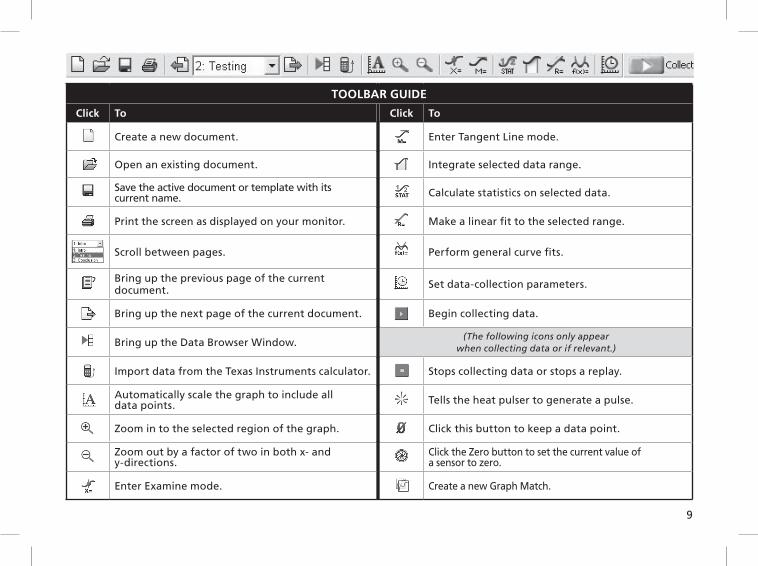
TOOlBaR GuiDe
click To click To
Create a new document. Enter Tangent Line mode.
Open an existing document. Integrate selected data range.
Save the active document or template with its current name. Calculate statistics on selected data.
Print the screen as displayed on your monitor. Make a linear fi t to the selected range.
Scroll between pages. Perform general curve fi ts.
Bring up the previous page of the current document. Set data-collection parameters.
Bring up the next page of the current document. Begin collecting data.
Bring up the Data Browser Window.(The following icons only appear
when collecting data or if relevant.)
Import data from the Texas Instruments calculator. Stops collecting data or stops a replay.
Automatically scale the graph to include all data points. Tells the heat pulser to generate a pulse.
Zoom in to the selected region of the graph. Click this button to keep a data point.
Zoom out by a factor of two in both x- and y-directions.
Click the Zero button to set the current value of a sensor to zero.
Enter Examine mode. Create a new Graph Match.

10
Take a few moments to get familiar with Logger Pro’s layout.
logger Pro Screen and ToolbarToolbar The toolbar contains buttons for the most commonly used features of Logger Pro. All of the features in the toolbar are also available in the menus. As you move the pointer across a button, you are given a short description of each feature. (See the Toolbar Guide on page 9).
Menu bar Logger Pro has a menu bar across the top of the main window. Use the menu bar to access all of the software’s features.
Object You can add new objects using the items in the Insert menu and modify them using the Options menu or by double-clicking on the objects. Some objects are listed here:
Graph Available graphs include Cartesian, Histogram, FFT Graph.
Table Displays data in data sets.
Text A small text editor. Use it to record notes for your fi le.
Text Annotation Allows you to enter and edit notes about the data. Text annotations are part of graphs.
Meter Displays the values of data columns in large digits, as a thermometer, gauge, or animated display.
Movie You can add a movie of an experiment to your page, then synchronize data collection to the movie.
Picture You can add a digital picture object to your page.
navigate Between PagesLogger Pro 3 has “pages.” These pages allow you to have different layouts of data in a single fi le. One page might contain a graph and table with fi ve different data collections. On different pages you might perform comparisons between different collections or just go into each collection in more detail.
Click on the Toolbar to jump to the next page.
Click on the Toolbar to jump to the previous page.
You can also use the drop-down menu from the Toolbar to choose a page directly.
finD YOuR WaY aROunD logger Pro

11
The Sensors Dialog
This dialog, called up by clicking the button for an interface in the toolbar (This dialog, called up by clicking the button for an
, for example) shows your sensor information, the units and current readings. The details of the dialog vary, depending on the use of LabQuest, LabPro, Go!Temp, Go! Link, Go! Motion, WDSS, spectrometers, GPS or Ohaus balances.
Use the scroll bars in the Sensor Catalogs to view all sensors.
By clicking in a Channel box with a displayed sensor, you may be able to:
Calibrate a sensor Perform a new calibration.
Get sensor information Includes collection details and calibration information.
Zero a sensor Sets the current reading of a sensor to zero.
Choose sensor Select another sensor for the channel.
Change the current settings Select the available units or calibration settings
Analog out (CH 4 only) This channel can be used as a function generator.
Remove sensor Clears the channel of the sensor.
Manage Your Page and DataThere are numerous ways that you can customize the presentation of your data.
Manage and adjust ObjectsMove Objects Select the object by clicking on it once. Move the cursor over the edge of the selected object until the cursor turns into a hand, then hold down the mouse button while grabbing and moving the object.
Resize Objects Single-click on an object to select it. When an object is selected, its border becomes visible, along with eight resizing handles.
Clicking and dragging a resize handle will resize the object in the appropriate direction.

12
Graph Axes Customize your graph by changing the columns that are displayed.
1. Position the mouse over the X-axis or Y-axis label and click. A list of available columns will appear.
2. Select the column you want displayed. If you want more than one column displayed, select More and check the boxes next to the desired columns.
Graph Options Double-click on the graph or select Graph Options from the Options menu to call up the Graph Options dialog. This allows you to change the graph object appearance, including point protectors, legend, line style, and other graph features. Click the Axis Options Tab to adjust scaling and select what columns are plotted or add a Y axis to the right-hand side of the graph.
create a columnYou can create a new column that is manually entered or that consists of calculations based on other data in Logger Pro. Create a new column by selecting New Manual Column or New Calculated Column from the Data menu.
Select and edit cells in a Data TableManually-entered data and data collected using the Events with Entry mode can be edited.
To edit a single cell in a table, single-click in the cell.
To select a single cell in a table, click and drag the selection within that cell.
You can select entire columns by clicking on the title of the column.
You can select an entire row of data by clicking on the row numbers.
The Data BrowserThe Data Browser is a container for all data in a Logger Pro file. In contrast, a given Data Table will not necessarily show all data columns.
Data Browser FeaturesDrag and drop from the Data Browser to objects such as tables and graphs. Drag a column to a y- or x-axis to plot it there.
When the Data Browser is selected, edit menu items like Cut, Copy, Paste, etc. will apply to the selected items within the Data Browser.

13
analyze DataThe Analyze menu contains functions for examining and analyzing your data. A few of the most commonly used analysis functions include:
Examine Shows the x- and y-values of the data point closest to the mouse pointer.
Statistics Calculates the minimum, maximum, mean, and standard deviation.
Curve Fit Fits a selected or user-defined function over the data.
Draw Prediction Sketch a prediction on a graph using the mouse.
Several of the analysis features are available from the Toolbar.
additional analysis featuresMovie You can synchronize data collection and a movie of the experiment so that as you Replay the movie, the data are replayed on the graph.
Video Analysis You can create a graphical representation of the motion you see in a movie.
Model Perform a manual curve fit of your data.
Histogram Displays the distribution of values for a data set in bar graph format.
Strip Chart Each new collected data point gets added to the right most edge of the graph.
FFT Gives the amplitudes of the frequency components of a data series, and displays a bar graph showing the amplitudes of the frequencies shown along the x-axis.
Incorporate videos and synchronize them with data you have collected! We have included more than 40 videos, but you can easily use your own.

14
Set PreferencesThe Preferences dialog box contains several options that pertain to the general operation of the software. These preferences will apply every time Logger Pro is launched.
In Windows, choose Preferences from the File menu. In Mac OS X, choose Preferences from the Logger Pro menu.
PrintingPrint Graphs and Data
1. Arrange the objects on the screen as you want them to appear on the paper. If you choose, you can print several graphs and data tables at once.
2. Select Print from the File menu or click on the toolbar.
3. When the printer is ready, click in the Print dialog box.
You can print the graphs and data tables individually by selecting Print Graph or Print Data Table from the File menu.
Where to next?The extensive Help system in Logger Pro provides detailed instructions for these and other features.
Also available are the Logger Pro Tutorials. Choose Open from the File menu to access them. These short tutorials are suitable for reference or for use in your classes. First-time users should work through one introductory tutorial and the advanced tutorials as needed.
If you have questions as you are using our software, call or e-mail us. We will be happy to help!

15
Vernier Software & Technology 13979 SW Millikan Way
Beaverton, OR 97005-2886 toll free 888.837.6437 | fax 503.277.2440
www.vernier.com

16
nOTeS
LabQuest, Logger Pro 3, Go! and Vernier LabPro are registered trademarks of Vernier Software & Technology in the United States of America. Windows and Excel are registered trademarks of Microsoft Corporation. Quicktime and the Quicktime logo
are trademarks or registered trademarks of Apple Computer, Inc., and are used under license therefrom. Macintosh and Mac OS are registered trademarks of Apple Computer, Inc. Palm OS and HotSync are registered Trademarks of Palm, Inc.