lockhart crossing: economically efficient reservoir operations pdf
TRANSCRIPT

1
Lockhart Crossing: Economically Efficient Reservoir Operations
Nik Wood Denbury Resources Inc.
Presented at the 16th Annual CO2 Flooding Conference
December 10, 2010
Midland, Texas

Corporate Information2
About Forward-Looking Statements The data contained in this presentation that are not historical facts are forward- looking statements that involve a number of risks and uncertainties. Such statements may relate to, among other things, capital expenditures, drilling activity, development activities, production efforts and volumes, net asset values, proved reserves, potential reserves and anticipated production growth rates in our CO2 models, 2009 and 2010 production and expenditure estimates, availability and cost of equipment and services, and other enumerated reserve potential. These forward-looking statements are generally accompanied by words such as “estimated”, “projected”, “potential”, “anticipated”, “forecasted” or other words that convey the uncertainty of future events or outcomes. These statements are based on management’s current plans and assumptions and are subject to a number of risks and uncertainties as further outlined in our most recent 10-K and 10-Q. Therefore, the actual results may differ materially from the expectations, estimates or assumptions expressed in or implied by any forward- looking statement made by or on behalf of the Company.
Cautionary Note to U.S. Investors – The United States Securities and Exchange Commission permits oil and gas companies, in their filings with the SEC, to disclose only proved reserves that a company has demonstrated by actual production or conclusive formation tests to be economically and legally producible under existing economic and operating conditions. We use certain terms and make certain disclosures in this presentation, such as potential and probable reserves, that the SEC’s guidelines strictly prohibit us from including in filings with the SEC.
Corporate Headquarters Denbury Resources Inc. 5100 Tennyson Pkwy., Ste. 1200 Plano, Texas 75024 Ph: (972) 673-2000 Fax: (972) 673-2150 Web Site: www.denbury.com
Contact Us Phil Rykhoek Chief Executive Officer (972) 673-2050 [email protected]
Mark Allen Senior VP & CFO (972) 673-2007 [email protected]
Laurie Burkes Investor Relations Manager (972) 673-2166 [email protected]

Economically Efficient Reservoir Operations Agenda
• Lockhart Crossing Introduction and Background
• Asset Development Principles / Business Plan
• Reservoir Surveillance Metric Creation and Comparison
• Economically Efficient Process Evolution– Asset Observations– Optimization Process Design and Management Plan– Implementation– Results
3

Lockhart’s Geographic Location4
Tinsley
Citronelle
Jackson Dome
NEJ
D C
O2
Pipe
line
Free State Pipeline
Sonat MS Pipeline
Martinville
DavisQuitman
Heidelberg
Summerland Soso
Sandersville
Eucutta Yellow CreekCypress Creek
BrookhavenMallalieu
Little Creek
Olive
Smithdale
McComb
Cranfield
Lake St. John
T E X A S
L O U I S I A N A
M I S S I S S I P P I
Oyster Bayou
Fig Ridge
Delta Pipeline
Green Pipeline
Delhi
(1) Proved plus probable tertiary oil reserves as of 12/31/08, including past production, based on a range of recovery factors. Hastings Field was purchased 2/2/09.
Phase 344 MMBbls
Phase 277 MMBbls
Phase 533 MMBbls
Phase 431 MMBbls
Phase 186 MMBbls
Phase 626 MMBbls
Phase 7 Hastings Area
60 - 100 MMBbls (1)
Phase 8 Seabreeze Complex
25 - 35 MMBbls (1)Hastings
Donaldsonville
9 MMBbls
LCKT

Lockhart Crossing 1st Wilcox Structure5
OOIP: 56.1 MMBBLSProduction: 18.2 MMBBLS (32%)
Discovery July 1982 Callon Petroleum3,500 AcresUnitized 1985

1st Wilcox Bar Isopach6
OOIP: 41.8 MMBBLS Phi: 15 - 24%, avg. 20% K: 1 - 100 md, avg. 80 md

1st Wilcox Channel Isopach7
OOIP: 14.3 MMBBLS Phi: 10 - 27%, avg. 21% K: 0.1 – 4,400 md, avg. 500 md

Lockhart 1st Wilcox Review (Pre CO2)8
Lockhart Field Wilcox 1Field Found 1982Initial Operator CallonFormation WilcoxDepth ~10,100'OWC -10,159'DRIVE Solution Gas - Moderate WaterTTL Field Area (acre) 3,500Production HistoryBlack Oil produced (stb) 18,200,000Solution Gas Produced (stb) 17,300,000,000Water Produced (stb) 21,200,000Water Injected (stb) 38,988,000Recovery Primary (stb) 6,808,038Recovery Secondary (stb) 11,391,962Rf Primary 12%Rf Secondary 20%Reservoir DescriptionOriginal Pressure (psi) 4,600Lowest Pressure (psi) 2,500Original Bubble Point (psi) 3,550Porosity 20%Permeability (bar / channel) (md) 80 / 500Sw Original (bar / channel) (%) 43 / 28Avg H Koil (ft) 42Bo Original (rb/stb) 1.53Gravity (API) 42Temp (f) 212OOIP (stb) 56,000,000OGIP (Solution) (scf) 53,000,000,000Solution GOR (scf/stb) 951Well Count during Primary and SecondaryPrimary Total 37Secondary Total 49Secondary Producers 27Secondary Injection 22

DRI Asset Development Philosophies
• Develop assets without utilizing full array of industry tools. This is in efforts to attain relatively higher value through accelerated cash flows that would otherwise be delayed (and slightly more costly)
– Associated with fields that have:• Similar analogue reservoirs in DRI’s asset base• Lower relative reservoir complexity• Smaller size (economies of scale)
• Integrate the full array of industry’s technical tools as resources for optimal field development
– Associated with fields that have:• Generally unique features relative to DRI’s tertiary asset base• Higher relative reservoir complexity• Larger in size (the bigger the difference a X% change in recovery makes)
9

Lockhart’s Business Plan / Development Principles
• Lockhart provides a relatively small tertiary target that requires efficiencies in design, development, and operation to be strong economically
• Utilize known analogues for technical guidance to reduce cost and accelerate timing
• Utilize old wellbores to develop asset at low cost
• Small facilities in design and footprint to minimize CAPEX and LOE– Asset Design Capacities
• 3,500 BOPD
• 11,000 BWPD
• 60 MMSCFPD recycle
• 60 MMSCFPD purchase
10

Lockhart Crossing Field CO2 Flood - Milestones
• Well work commenced in January 2007
• Drilling commenced April 2007
• Denbury commenced construction of CO2 Recycling Facility in May 2007
• After receiving COE permit, pipeline construction commenced September 2007
• Construction of six-mile 8” CO2 supply pipeline completed 3rd quarter 2007
• Injection of CO2 began in December 2007
• First CO2 production occurred in June 2008 – first sales July 2008
• Test Site 1 operational June 2008, Test Site 2 operational January 2009
• Lockhart produced it’s 1,000,000th BBL of CO2 Oil in June 2010!
11

Lockhart Original Pattern Design12

Lockhart Crossing Field Life13
Lockhart Crossing Fluid Rates
-
1,000
2,000
3,000
4,000
5,000
6,000
7,000
8,000
Feb-8
2
Feb-8
6
Feb-9
0
Feb-9
4
Feb-9
8
Feb-0
2
Feb-0
6
Feb-1
0
Date
BPD
-
10,000
20,000
30,000
40,000
50,000
60,000
70,000
MSC
FPD
Oil (bpd) Water (bpd) Water Inject (bpd) CO2 Injection (mscfpd) CO2 Production (mscfpd)

Lockhart 1st Wilcox Review14
Lockhart Crossing Reservoir Surveillance
Life Metrics unitsStart Date 6/1/2008Current date 11/30/2010Life to date 2.50 yearsLife to date 7.1%Expected Life 35 years
Cumulative MetricsCum CO2 injected 51,042,000 MCFCum Recycle 19,928,234 MCFCum Purchase 31,113,766 MCFCum Water 6,540,421 BBLSCum Oil 1,411,753 STB LCU phase 3Current Pattern Total HCPVI 44.00% 42.5%Current Pattern Oil Rec 3.96% 4.3%Oil Rec to HCPVI 0.090 < 0.10Field Total HCPVI 28%Field Oil Rec 2.5%Total HCPVI to Oil Rec 0.09 dmslessGross Utilization 36 mcf/stbNet Utilization 22 mcf/stb
Rate MetricsDaily Oil Rate 2,866 STBPDDaily Purchase 28.3 mmscfpdDaily Recycle 48.1 mmscfpdCurrent Pattern HCPVI/day 0.07%HCPV oil recovered/day 0.008% LCU phase 3
HCPV rec/inj/day 0.12 > 0.086

Dimensionless Top Performer15
Dimensionless Comparison LCU Phase 3 vs. LCKT
0%
2%
4%
6%
8%
10%
12%
14%
16%
18%
20%
0% 50% 100% 150% 200% 250% 300% 350% 400%
CO2 Injected (% of HCPV)
Oil
Reco
very
(%
of HCP
V)
LCU Phase #3 LCKT Field
Dimensionless Comparison LCU Phase 3 vs. LCKT
0%
2%
4%
6%
8%
10%
12%
14%
16%
18%
20%
0% 50% 100% 150% 200% 250% 300% 350% 400%
CO2 Injected (% of HCPV)
Oil
Reco
very
(%
of HCP
V)
LCU Phase #3 LCKT Field

Challenge Comes with Smaller Scale 16

Presentation Preface• The communication objective and technical content of this
presentation are basic reservoir and economic concepts
• Though the concepts demonstrated are elementary these concepts provide a high magnitude of economic impact
• The focus of this presentation is to highlight simple methods of evaluation to ensure maximization of asset value
• Hindsight is 20/20, when looking back operation modifications may seem implicit, but it might not have been so clear during the implementation
17

Reservoir Pressure Surveillance
18
Reservoir
CO2 injection
CO2 RB
Gas RB
Oil RB
Water RB
FluidWithdraw
IWR
•IWR = CO2 (RB) ÷ (Gas (RB) + Oil (RB) + Water (RB))
•IWR (instantaneous) delivers direction your reservoir pressure is going at a given instant.
•IWR (cumulative) delivers the relative reservoir pressure from the point in time the accumulation began.
Net Cum Fluid
•Net Cum Fluid = Cum CO2 RB – Cum (Gas (RB) + Oil (RB) + Water (RB))
•Delivers direction the reservoir pressure is going at a given instant by the slope of the curve.
•Delivers the relative reservoir pressure from the point in time the accumulation began.
•Delivers magnitude of fluid thus the magnitude of relative pressure change based on reservoir size.
To maintain MMP To maintain flowing wells

Fluid to Pattern Allocation• Fluid dynamics within a reservoir are difficult to calculate
• Pattern allocation is a simple method used to account / estimate source of fluid flow– Used for Net Cum Fluid calculation– Serves as guides to remaining saturations within patterns
• There are many methods for allocation
19
1 2
a
b
e
d
c
f
Reservoir Boundary
>Splits Pattern 1 and 2 production of fluid evenly
C allocation to Pattern 1 =
# of wells ÷ # of patterns sharing the well =
1 ÷ 2 =
50%
>splits Pattern 1 and 2 production based on injection rate and magnitude of HCPV
C allocation to pattern 1 =
(HCPV1 * Injection rate1 / (HCPV1 * Injection rate1 + HCPV2 * Injection rate2)) =
10 * 150 / (10*150 + 5*100) =
75%
a
b
e
d
c
f
Reservoir Boundary
150 RB100 RB
150 RB100 RB
10 mm/day
5 mm/day10 mm/day
50%
50%
75%
5 mm/day
25%
1 2
HCPV & I allocation
Geometric allocation
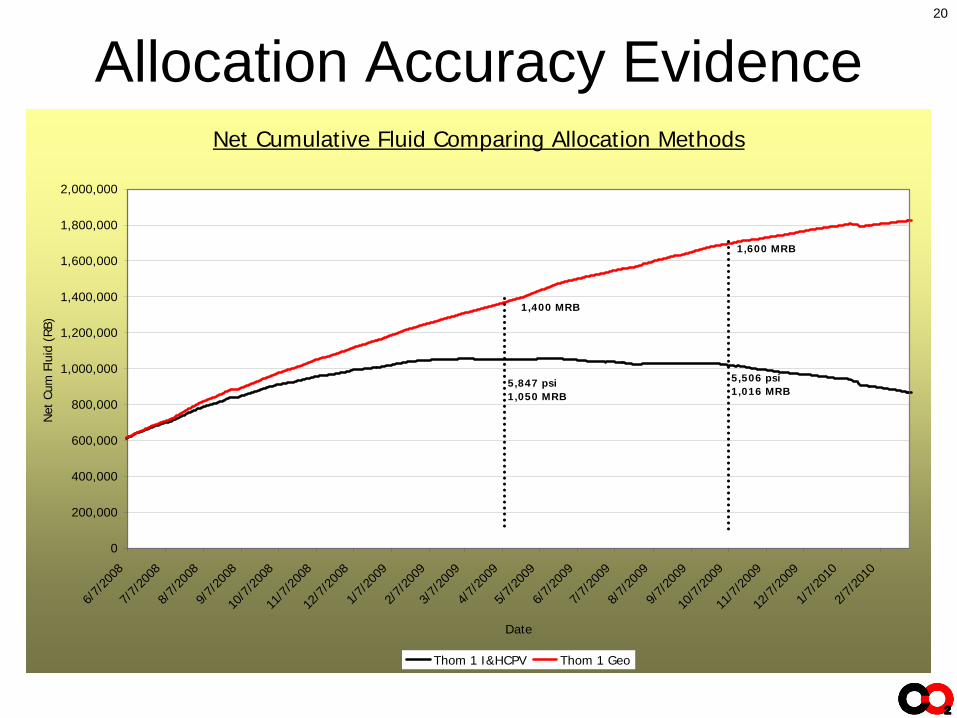
Allocation Accuracy Evidence20
Net Cumulative Fluid Comparing Allocation Methods
0
200,000
400,000
600,000
800,000
1,000,000
1,200,000
1,400,000
1,600,000
1,800,000
2,000,000
6/7/
2008
7/7/
2008
8/7/
2008
9/7/
2008
10/7
/200
811
/7/2
008
12/7
/200
81/
7/20
092/
7/20
093/
7/20
094/
7/20
095/
7/20
096/
7/20
097/
7/20
098/
7/20
099/
7/20
0910
/7/2
009
11/7
/200
912
/7/2
009
1/7/
2010
2/7/
2010
Date
Net
Cum
Flu
id (
RB)
Thom 1 I&HCPV Thom 1 Geo
5,847 psi1,050 MRB
5,506 psi1,016 MRB
1,400 MRB
1,600 MRB

Economically Efficient Asset Development
• Economically Efficient (Theoretical)– No additional output can be obtained without additional input– Production proceeds at the lowest per unit cost– The cost of producing a given output is as low as possible– …
• Economically Efficient (Financial)– Max IRR– Max NPV– Abide within cash flow constraints
• Economically Efficient Ranking of Choice = Max NPV– Maximize
• Revenue• Delay of negative cash flows
– Minimize• Capital• Operating Expense• Delay of positive cash flows• Cost of Capital
21

Maximize Oil Reservoir NPV
• Asset Optimization Problem– Maximize oil recovery magnitude
– Minimize recovery time (acceleration)
– Minimize cost
– Maximize delay in capital outlays
22

Optimize recovery time and cost23
Reservoiri p
Purchase
Recycle
Maximize Pressure Drop and Conductivity
Facility
Bulk lines
Manifold
Source
Compre
ss
Maximize BHIP Minimize BHFP
Minimize cost of attaining pressure drop and conductivity
Maximize Conductivity Maximize Conductivity
Constrained by: coning, MMP, and sand production

Reservoir ManagementNet Cumulative Fluid Thom #1 Pattern
0
200,000
400,000
600,000
800,000
1,000,000
1,200,000
12/7/07
12/21/07
1/4/08
1/18/08
2/1/08
2/15/08
2/29/08
3/14/08
3/28/08
4/11/08
4/25/08
5/9/08
5/23/08
6/6/08
6/20/08
7/4/08
7/18/08
8/1/08
8/15/08
8/29/08
9/12/08
9/26/08
10/10/08
10/24/08
11/7/08
11/21/08
12/5/08
12/19/08
1/2/09
1/16/09
1/30/09
Date
Net Cum Fluid (RB)
1,050 MRB5,847 psi
Open Wells 5,200 psi
Net Cumulative Fluid Thom #1 Pattern
0
200,000
400,000
600,000
800,000
1,000,000
1,200,000
12/7/07
12/21/07
1/4/08
1/18/08
2/1/08
2/15/08
2/29/08
3/14/08
3/28/08
4/11/08
4/25/08
5/9/08
5/23/08
6/6/08
6/20/08
7/4/08
7/18/08
8/1/08
8/15/08
8/29/08
9/12/08
9/26/08
10/10/08
10/24/08
11/7/08
11/21/08
12/5/08
12/19/08
1/2/09
1/16/09
1/30/09
Date
Net Cum Fluid (RB)
1,050 MRB5,847 psi
Open Wells 5,200 psi
24
Fill Up
Optimum Reservoir Management?
MMP

Team Objective Communication 06-09• Objective
1. Maximize injection through utilization of all equipment 2. Accelerate production through accelerated injection3. Optimally produce reservoir
• Solution1. Open Chokes (increasing production rate)2. Reduce IWR <13. Reduce Reservoir Operating Pressure (also helps utilization CO2
expansion)4. Increase injection (given 3,000 psi surface injection pressure)5. Accelerate production through optimal reservoir operating pressure
• Constraints• MMP • Surface operation constraints
• Purchase• Recycle• Water Handling
25

Process Management26
Net Cumulative Fluid Thom #1 Pattern
0
200 ,000
400 ,000
600 ,000
800 ,000
1,000 ,000
1,200 ,000
12/7/07
1/7/08
2/7/08
3/7/08
4/7/08
5/7/08
6/7/08
7/7/08
8/7/08
9/7/08
10/7/08
11/7/08
12/7/08
1/7/09
2/7/09
3/7/09
4/7/09
5/7/09
6/7/09
7/7/09
8/7/09
9/7/09
10/7/09
11/7/09
12/7/09
1/7/10
2/7/10
Date
Net Cum Fluid (RB)
1,050 MRB5,847 psi
Open Wells 5,200 psi
open chokes
Net Cumulative Fluid Thom #1 Pattern
0
200 ,000
400 ,000
600 ,000
800 ,000
1,000 ,000
1,200 ,000
12/7/07
1/7/08
2/7/08
3/7/08
4/7/08
5/7/08
6/7/08
7/7/08
8/7/08
9/7/08
10/7/08
11/7/08
12/7/08
1/7/09
2/7/09
3/7/09
4/7/09
5/7/09
6/7/09
7/7/09
8/7/09
9/7/09
10/7/09
11/7/09
12/7/09
1/7/10
2/7/10
Date
Net Cum Fluid (RB)
1,050 MRB5,847 psi
Open Wells 5,200 psi
open chokesOptimum reservoir Management?
Open chokes
Fill Up

Lockhart Crossing CO2 EOR27
Induced Acceleration

Opening of Chokes28
Felker #1
Thom #1
Net Cum Fluid
Injection Rate

Results of 2009 to 2010 choke changes29
Lockhart Choke Size Increase
0%
20%
40%
60%
80%
100%
120%
140%
160%
180%
Choke Size Oil Rate CO2 Injection
Category
% in
crea
se
2009 2010
310
374
50 m
msc
fpd
65 m
msc
fpd
2284
bop
d
1441
bop
d
Lockhart Choke Size Increase
0%
20%
40%
60%
80%
100%
120%
140%
160%
180%
Choke Size Oil Rate CO2 Injection
Category
% in
crea
se
2009 2010
310
374
50 m
msc
fpd
65 m
msc
fpd
2284
bop
d
1441
bop
d

Optimize recovery time and cost30
Pre ssure Drop a nd T im e Sa v ings
0
10
20
30
40
50
60
70
0 2 4 6 8 10 12 14 16 18 20 22 24 26 28 30
T im e
Cu
m P
rod
uct
ion
dp1 dp2 dp3 dp4
The larger the pressure drop the faster the oil is retrieved.

31
Cost and Acceleration
slow medium fast fastestAcceleration
Co
stOptimize recovery time and cost

NPV and Acceleration
slow medium fast fastestAcceleration
NPV
Optimize recovery time and cost32
The second largest pressure drop provides maximum value

Booster Pump / Asset OptimizationBooster Pump Value
-500
500
1,500
2,500
3,500
4,500
5,500
6,500
0 2 4 6 8 10 12 14
Booster Pump Incremental Injection Rate (mmscfpd)
Boo
ster
NP
V 1
0%
dsc
t (M
$)
Thom #1 Pattern 17-11 2 Bar Injection Wells
Max incremental rate and therefore max value attainable by the Thom #1
Max incremental rate and therefore max value attainable by one 3.5 mm/day injection patternMax incremental
rate and therefore max value attainable by the two 3.5 mm/day
$217M
$2.7MM
$3.4MM
33

Lockhart’s Bar Injection Hurdle
• Bar Injection wells injecting at ~5 mmscfpd
• Channel wells maximum injection rate ~17 mmscfpd down 2-7/8” tubing
• Transitively the bar formation is the bottle neck – (not the 2-7/8” tubing)
• Remaining Lockhart development is in the Bar Formation
• NPV is hindered due to a choke at the formation– Stimulation is not currently an option
34

Horizontal vs. VerticalHorizontal Vertical
Effective Formation Contact
200’ 40’
Injection Rate 5X 1XProduction Rate 5X 1X
Formation Contact 200’
Formation Contact 40’
K*H*dp
u*ln (re/rw)
Lateral Length = 1000’

Horizontal Well / Asset Optimization36
Well Count
Cost FluidRate
Oil RateRate
RevenueAcceleration
Facilities
Cost
NPV
NPV
The Optimal Asset Harmony(where NPV is maximum)

Horizontal Well Asset OptimizationLockhart Future Development Economic Comparison
2 4 6 8 11 13 15 17 19 21
Total Future Horizontal Well Count
PV10
(M
$)
4 5 6 7 8 9 10 11 12 13
Injection rate per horizontal (mmscfpd)
Lockhart Incremental Future Development PV10 with vertical well development

Economically Efficient Reservoir Operations Results38
Incremental Value
Associated with Acceleration
Base Value
Induced Acceleration

Economically Efficient Reservoir Operations39
Includes optimization of all of this map plus more…
•Today’s presentation covered some of the topics in the circled area
•There’s significantly more value to be added to the asset outside (and inside) that circle
•I look forward to watching the DRI team further maximize the value of Lockhart Crossing by accomplishing their goals

Special Recognition40
Management (names left to right)Donnie Dubois - Field, Bob Sutherland - Reservoir, John McDaniel - Land, Joey Smith - Operations, James Fields -
Land, Charlie Gibson - V.P. West, Don Butvin - Facilities, Bob Schellhorn - Geology, Mary Tombs - Production

Special Recognition41
Plano Team (names left to right)Dan Emmer, John McDaniel, James Fields, Sarah Dixon, Nik Wood, Misty Marko, Randy Charles, Randy McKenzie,
Kyla Coker, Nic Bongiovanni, Jim Johnson

Special Recognition42
Field Team (left to right)Jason Shaffer, Todd Bergeron, Jimmy Naquin, Eroll Tisdale, Bobby McDougal, Mike Crawford, Henry Schultz, Chris
Odom, Donnie Dubois, Dustin Swallow, Cecil Rushing, Dale Louviere, John Duplantis

Questions43