locations of art clinics in the united states and puerto ... · locations of art clinics in the...
TRANSCRIPT
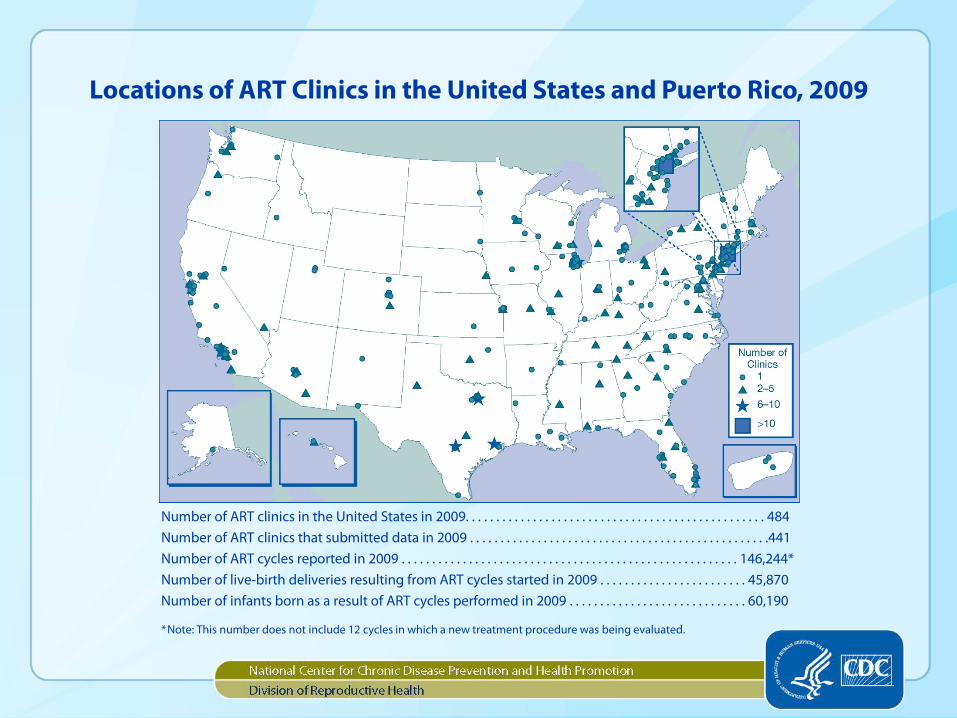
Locations of ART Clinics in the United States and Puerto Rico, 2009
Number of ART clinics in the United States in 2009. . . . . . . . . . . . . . . . . . . . . . . . . . . . . . . . . . . . . . . . . . . . . . . . . 484 Number of ART clinics that submitted data in 2009 . . . . . . . . . . . . . . . . . . . . . . . . . . . . . . . . . . . . . . . . . . . . . . . . .441 Number of ART cycles reported in 2009 . . . . . . . . . . . . . . . . . . . . . . . . . . . . . . . . . . . . . . . . . . . . . . . . . . . . . . . 146,244* Number of live-birth deliveries resulting from ART cycles started in 2009 . . . . . . . . . . . . . . . . . . . . . . . . 45,870 Number of infants born as a result of ART cycles performed in 2009 . . . . . . . . . . . . . . . . . . . . . . . . . . . . . 60,190
* Note: This number does not include 12 cycles in which a new treatment procedure was being evaluated.

Types of ART Cycles—United States,* 2009
Fresh nondonor 70.1%
(102,478 cycles)
Frozen nondonor 17.8%
(26,069 cycles)
Fresh donor 7.5% (11,038 cycles)
Frozen donor 4.6% (6,659 cycles)
New treatment procedures <0.1%
(12 cycles)
* Total does not equal 100% due to rounding.
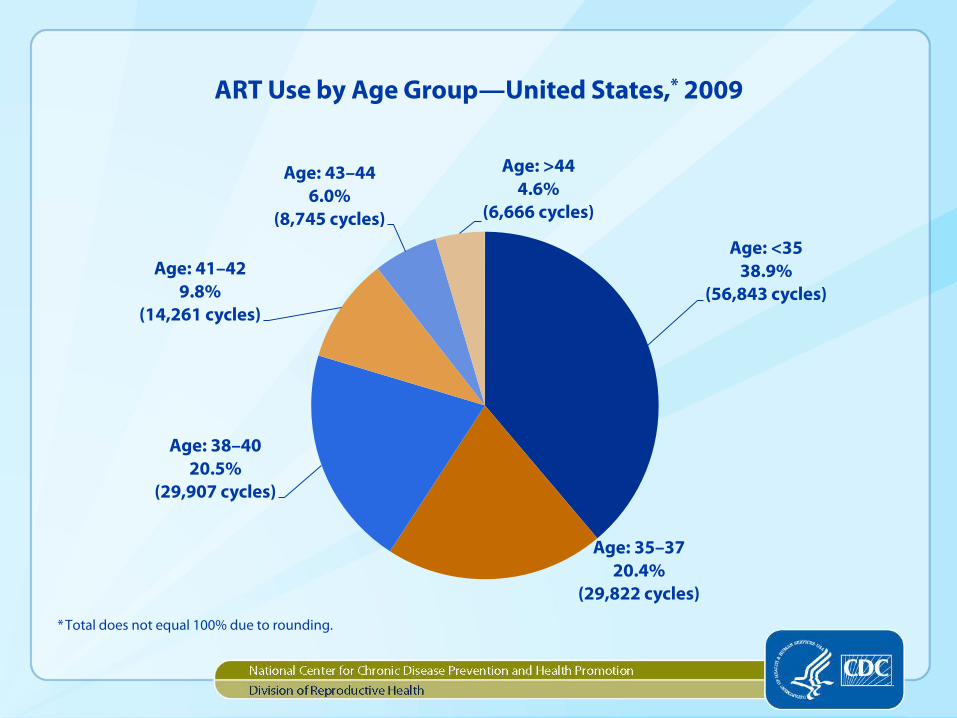
ART Use by Age Group—United States,* 2009
Age: <35 38.9%
(56,843 cycles)
Age: 35–37 20.4%
(29,822 cycles)
Age: 38–40 20.5%
(29,907 cycles)
Age: 41–42 9.8%
(14,261 cycles)
Age: 43–44 6.0%
(8,745 cycles)
Age: >44 4.6%
(6,666 cycles)
* Total does not equal 100% due to rounding.

Types of ART Cycles by Age Group—United States, 2009
75 73 74 69
56
21
7 13
23
41
22 21 16
11
9
6
3 7
13
32
0
20
40
60
80
100
<35 35–37 38–40 41–42 43–44* >44
Perc
ent
Age (years)
Fresh nondonor Fresh donorFrozen nondonor Frozen donor
94 90
80
65
27
97
3 6 10
20
36
73
* Total does not equal 100% due to rounding.

Percentages of ART Cycles That Resulted in Live Births, by Type of ART and Clinic Size—United States, 2009
29.3 30.7 31.5 29.6 25.1 25.0 26.3
29.8
46.6 49.1 49.6 51.5
27.5
34.0 29.5 31.1
0
10
20
30
40
50
60
<90 90–169 170–406 >406
Perc
ent
Clinic Size (number of ART cycles performed in 2009) Fresh nondonor Frozen nondonorFresh donor Frozen donor

Outcomes of ART Cycles Using Fresh Nondonor Eggs or Embryos, by Stage, 2009
102,478 cycles started
91,182 retrievals 84,039
transfers
37,780 pregnancies 30,787
live-birth deliveries
0
20,000
40,000
60,000
80,000
100,000
120,000
Num
ber

Reasons ART Cycles Using Fresh Nondonor Eggs or Embryos Were Discontinued,* 2009
No or inadequate egg production
82.9%
Patient withdrew for other reasons
12.1%
Too-high response to ovarian stimulation
medication 4.2%
Concurrent illness 0.8%
Unknown <0.1%
* Based on 11,296 ART cycles.

Measures of Success for ART Cycles Using Fresh Nondonor Eggs or Embryos, 2009
36.9
30.0 33.8
36.6
23.5 25.5
0
10
20
30
40
50
Cyclesresulting in
pregnancies
Cyclesresulting inlive births
Retrievalsresulting inlive births
Transfersresulting inlive births
Cyclesresulting insingletonlive births
Transfersresulting insingletonlive births
Perc
ent

Results of ART Cycles Using Fresh Nondonor Eggs or Embryos, 2009
No pregnancy 62.5%
Ectopic pregnancy 0.6%
Single-fetus pregnancy
22.8%
Multiple- fetus
pregnancy 11.6%
Not able to determine number
of fetuses 2.5%
Clinical pregnancy 36.9%

Outcomes of Pregnancies Resulting from ART Cycles Using Fresh Nondonor Eggs or Embryos,*† 2009
Singleton birth 56.6% Multiple-infant
birth 24.9%
Stillbirth 0.7%
Miscarriage 16.4%
Induced abortion 0.9%
Unknown 0.4%
Total live births 81.5%
* Maternal deaths prior to birth are not displayed due to small number (n = 7). † Total does not equal 100% due to rounding.

Risks of Having Multiple-Fetus Pregnancies and Multiple-Infant Live Births from ART Cycles Using Fresh Nondonor Eggs or Embryos, 2009
Singletons 69.5%
Twins 28.9%
Triplets or more 1.6%
B. 30,787 Live births
Singletons 61.7%
Twins 28.5%
Triplets or more 3.1%
Not able to determine number of
fetuses 6.7%
A. 37,780 Pregnancies

Percentages of Preterm Births from ART Cycles Using Fresh Nondonor Eggs or Embryos, by Number of Infants Born, 2009
11.6 19.0
60.0
97.5
0
20
40
60
80
100
Singletons fromsingle-fetuspregnancy
Singletons frommultiple-fetus
pregnancy
Twins Tripletsor more
Perc
ent
Number of Infants Born

Percentages of Low-Birth-Weight Infants from ART Cycles Using Fresh Nondonor Eggs or Embryos, by Number of Infants Born, 2009
8.7 16.7
56.1
92.1
0
20
40
60
80
100
Singletons fromsingle-fetuspregnancy
Singletons frommultiple-fetus
pregnancy
Twins Tripletsor more
Perc
ent
Number of Infants Born

Age Distribution of Women Who Had ART Cycles Using Fresh Nondonor Eggs or Embryos, 2009
0
1
2
3
4
5
6
7
8
9
10
24 26 28 30 32 34 36 38 40 42 44 46 48
Perc
ent
Age (years) <24 >48

Percentages of ART Cycles Using Fresh Nondonor Eggs or Embryos That Resulted in Pregnancies, Live Births, and Singleton Live Births,
by Age of Woman,* 2009
0
10
20
30
40
50
60
24 26 28 30 32 34 36 38 40 42 44
Perc
ent
Age (years)
Pregnancy Live birth Singleton live birth
<24 >44
*For consistency, all percentages are based on cycles started.

Percentages of ART Cycles Using Fresh Nondonor Eggs or Embryos That Resulted in Pregnancies, Live Births, and Singleton Live Births
Among Women Aged 40 or Older,* 2009
27.0
22.1
18.1
12.7
6.9
3.7
18.7
14.3
10.0
6.0
2.9 1.5
15.1
11.8
8.6
5.5
2.8 1.2
0
5
10
15
20
25
30
40 41 42 43 44 > 44
Perc
ent
Age (years)
Pregnancy Live birth Singleton live birth
*For consistency, all percentages are based on cycles started.

Percentages of ART Cycles Using Fresh Nondonor Eggs or Embryos That Resulted in Miscarriage, by Age of Woman, 2009
0
10
20
30
40
50
60
24 26 28 30 32 34 36 38 40 42 44
Perc
ent
Age (years) <24 >44

Percentages of Pregnancies That Were Lost Through Week 24 Among ART Cycles Using Fresh Nondonor Eggs or Embryos, by Age of Woman, 2009
0
10
20
30
40
50
60
70
80
90
100
6 8 10 12 14 16 18 20 22 24
Perc
ent
Gestational Weeks
Age (years) <35 35–37 38–40 41–42 43–44 >44

Outcomes of ART Cycles Using Fresh Nondonor Eggs or Embryos, by Stage and Age Group, 2009
93 90 86
83 80
75
87 83
79 74
69
60
47
39
30
20
11 4
41
32
22
12 5
2 0
20
40
60
80
100
<35 35–37 38–40 41–42 43–44 >44
Perc
ent
Age (years)
Retrieval Transfer Pregnancy Live birth

Diagnoses Among Couples Who Had ART Cycles Using Fresh Nondonor Eggs or Embryos, 2009
Tubal factor 7.7%
Ovulatory dysfunction
6.8%
Diminished ovarian reserve 11.5%
Endometriosis 4.2%
Uterine factor 1.4%
Male factor 18.8%
Other causes 7.7%
Unexplained cause 13.5%
Multiple factors, female only
10.6%
Multiple factors, female + male
17.8%

Percentages of ART Cycles Using Fresh Nondonor Eggs or Embryos That Resulted in Live Births, by Diagnosis, 2009
32.2
40.4
14.5
35.3
25.4
37.6
27.7
33.7
23.4 28.6
0
10
20
30
40
50
Perc
ent
Diagnosis

Numbers of Previous Births Among Women Who Had ART Cycles Using Fresh Nondonor Eggs or Embryos, 2009
None 70.6%
One 21.1%
Two 5.0%
Three or more 2.6%
Unknown 0.7%

Percentages of ART Cycles Using Fresh Nondonor Eggs or Embryos That Resulted in Live Births, by Age of Woman and Number of
Previous Live Births, 2009
40.5
30.6
21.1
11.6
4.4 1.5
43.7
33.8
24.4
13.9
5.9
1.5 0
10
20
30
40
50
<35 35–37 38–40 41–42 43–44 >44
Perc
ent
Age (years)
No previous live births 1 or more previous live births
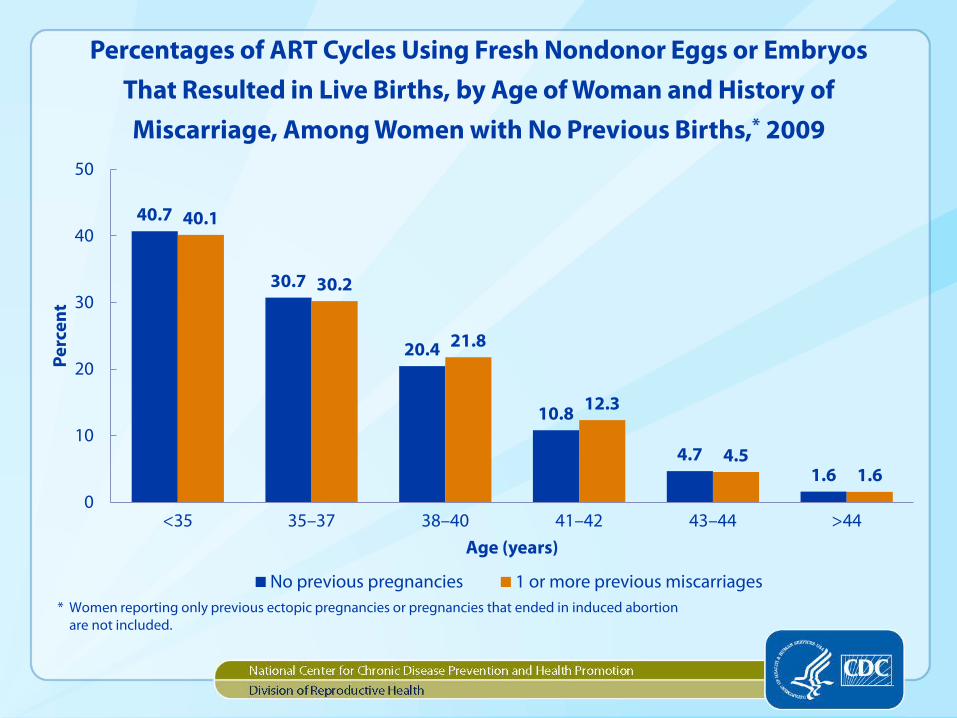
Percentages of ART Cycles Using Fresh Nondonor Eggs or Embryos That Resulted in Live Births, by Age of Woman and History of Miscarriage, Among Women with No Previous Births,* 2009
40.7
30.7
20.4
10.8
4.7 1.6
40.1
30.2
21.8
12.3
4.5 1.6
0
10
20
30
40
50
<35 35–37 38–40 41–42 43–44 >44
Perc
ent
Age (years)
No previous pregnancies 1 or more previous miscarriages* Women reporting only previous ectopic pregnancies or pregnancies that ended in induced abortion
are not included.

Numbers of Previous ART Cycles Among Women Undergoing ART with Fresh Nondonor Eggs or Embryos,* 2009
None 55.1%
One 20.3%
Two 11.3%
Three 6.1%
Four or more 7.2%
Unknown <0.1%
* Total does not equal 100% due to rounding.

Percentages of ART Cycles Using Fresh Nondonor Eggs or Embryos That Resulted in Live Births, by Age of Woman and History of Previous ART Cycles,
Among Women with No Previous Births, 2009
42.9
33.4
22.2
11.1
4.3 1.1
35.4
26.7
19.9
11.9
4.4 1.8
0
10
20
30
40
50
<35 35–37 38–40 41–42 43–44 >44
Perc
ent
Age (years)
No previous ART and no previous births1 or more previous ART cycles and no previous births

Percentages of ART Cycles Using Fresh Nondonor Eggs or Embryos That Resulted in Live Births, by Age of Woman and History of Previous ART Cycles,
Among Women with One or More Previous Births, 2009
43.2
33.9
23.9
12.8
6.2
0.5
44.1
33.8
24.7
14.5
5.8 2.3
0
10
20
30
40
50
<35 35–37 38–40 41–42 43–44 >44
Perc
ent
Age (years)
No previous ART and 1 or more previous births1 or more previous ART cycles and 1 or more previous births

Types of ART Procedures Using Fresh Nondonor Eggs or Embryos,* 2009
IVF without ICSI 27.0%
IVF with ICSI 72.9%
GIFT <0.1%
ZIFT <0.1%
Combination† <0.1%
* Total does not equal 100% due to rounding. † Combination of IVF with or without ICSI and either GIFT or ZIFT.

Percentages of Egg Retrievals That Resulted in Live Births, by Type of ART Procedure, 2009
33.6 33.9
3.6
10.8
17.4
0
10
20
30
40
50
IVF without ICSI IVF with ICSI GIFT ZIFT Combination*
Perc
ent
Types of ART Procedures
* Combination of IVF with or without ICSI and either GIFT or ZIFT.

Use of ICSI* in Fresh Nondonor Cycles Among Couples With and Without Diagnoses of Male Factor Infertility,† 2009
No male factor infertility
53.0%
Male factor infertility
47.0%
* Intracytoplasmic sperm injection. † Based on 66,439 cycles that used IVF with ICSI.

Percentages of Retrievals That Resulted in Live Births Among Couples Diagnosed with
Male Factor Infertility Who Used IVF with ICSI,* Compared with Couples Not Diagnosed
with Male Factor Infertility Who Used IVF Without ICSI, by Age of Woman,† 2009
45.7
37.1
26.7
15.3
6.5 4.9
44.9
37.5
27.2
16.4
4.8 1.1
0
10
20
30
40
50
<35 35–37 38–40 41–42 43–44 >44
Perc
ent
Age (years)
IVF with ICSI among couples with male factor infertilityIVF without ICSI among couples with no male factor infertility
* Intracytoplasmic sperm injection. † Cycles using donor sperm and cycles using GIFT or ZIFT are excluded.

Percentages of Retrievals That Resulted in Live Births Among Couples Not Diagnosed with Male Factor Infertility, by Use of ICSI* and
Age of Woman,† 2009
42.5
33.0
24.5
13.9
6.9
1.6
44.9
37.5
27.2
16.4
4.8 1.1
0
10
20
30
40
50
<35 35–37 38–40 41–42 43–44 >44
Perc
ent
Age (years)
IVF with ICSI among couples with no male factor infertilityIVF without ICSI among couples with no male factor infertility
* Intracytoplasmic sperm injection. † Cycles using donor sperm and cycles using GIFT or ZIFT are excluded.

Numbers of Embryos Transferred During ART Cycles Using Fresh Nondonor Eggs or Embryos,* 2009
One 13.5%
Two 51.5%
Three 23.4%
Four 7.8%
Five 2.5%
Six 0.8%
Seven or more 0.4%
Unknown <0.1%
* Total does not equal 100% due to rounding.

Percentages of Embryos Transferred That Resulted in Implantation Among Women Using Fresh Nondonor Eggs or Embryos, by Age Group, 2009
35.3
25.9
17.2
9.1
4.2 2.0
0
10
20
30
40
<35 35–37 38–40 41–42 43–44 >44
Perc
ent
Age (years)

Percentages of Transfers That Resulted in Live Births and Percentages of Multiple-Infant Live Births for ART Cycles Using Fresh Nondonor Eggs or
Embryos, by Number of Embryos Transferred, 2009
(98.1)* (65.2)*
(68.3)* (73.0)*
(73.2)*
(1.9)*
(33.9)*
(27.7)*
(24.1)* (24.3)*
(0.8)*
(3.9)*
(2.9)*
(2.5)*
0
10
20
30
40
50
1 2† 3† 4 5+
Perc
ent
Number of Embryos Transferred
Singletons Twins Triplets or more
24.5%
44.0%
33.2%
26.1% 23.1%
(1.9)*
(0.8)*
(3.9)*
(2.9)*
(2.5)*
* Percentages of live births that were singletons, twins, and triplets or more are in parentheses. Note: In rare cases a single embryo may divide and thus produce twins. For this reason, a small percentage of twins resulted from a single
embryo transfer, and a small percentage of triplets resulted when two embryos were transferred. † Totals do not equal 100% due to rounding.

Percentages of Transfers That Resulted in Live Births and Percentages of Multiple-Infant Live
Births for ART Cycles Among Women Who Were Younger Than 35, Used Fresh Nondonor Eggs or
Embryos, and Set Aside Extra Embryos for Future Use, by Number of Embryos Transferred, 2009
(98.4)*
(57.7)* (53.7)*
(49.2)* (44.4)*
(1.6)*
(41.3)*
(37.0)*
(41.3)* (55.6)*
(1.0)*
(9.3)*
(9.5)*
0
10
20
30
40
50
60
70
1 2 3 4 5+
Perc
ent
Number of Embryos Transferred
Singletons Twins Triplets or more
50.1%
57.3%
49.8%
41.4% 39.1% (1.6)*
(1.0)*
* Percentages of live births that were singletons, twins, and triplets or more are in parentheses. Note: In rare cases a single embryo may divide and thus produce twins. For this reason, a small percentage of twins resulted from a single
embryo transfer, and a small percentage of triplets resulted when two embryos were transferred.

Day of Embryo Transfer* Among ART Cycles Using Fresh Nondonor Eggs or Embryos,†‡ 2009
Day 1 0.1%
Day 2 4.9%
Day 3 54.6%
Day 4 2.5%
Day 5 35.9%
Day 6 2.1%
* Number of days following egg retrieval. † Cycles using GIFT or ZIFT are excluded. Missing or implausible values for day of embryo transfer (i.e., 0 or >6) are not included. ‡ Total does not equal 100% due to rounding.

Percentages of Day 3 and Day 5 Embryo Transfers Using Fresh Nondonor Eggs or Embryos That Resulted in Live Births, by Age of Woman,* 2009
42.1
34.0
25.4
14.8
6.8 1.8
54.2
46.5
37.7
26.5
11.0 7.4
0
10
20
30
40
50
60
<35 35–37 38–40 41–42 43–44 >45
Perc
ent
Age (years)
Day 3 Day 5* Cycles using GIFT or ZIFT are excluded. This comparison is limited to transfers on day 3 and day 5. Embryo transfers performed on days 1,
2, 4, and 6 are not included because each of these accounted for a small proportion of procedures.

Numbers of Embryos Transferred During ART Cycles Using Fresh Nondonor Eggs or Embryos for Day 3 and Day 5 Embryo Transfers,* 2009
One 11.1%
Two 42.7%
Three 29.5%
Four or more
16.7%
Day 3
One 14.8%
Two 66.8%
Three 14.5%
Four or more 3.9%
Day 5
* Cycles using GIFT or ZIFT are excluded. This comparison is limited to transfers on day 3 and day 5. Embryo transfers performed on days 1, 2, 4, and 6 are not included because each of these accounted for a small proportion of procedures.

Risks of Having Multiple-Infant Live Births for ART Cycles Using Fresh Nondonor Eggs or Embryos for Day 3 and Day 5 Embryo Transfers,* 2009
Singletons 73.4%
Twins 25.1%
Triplets or more
1.5%
Day 3
A. 14,201 Live births
Singletons 64.8%
Twins 33.6%
Triplets or more
1.6%
Day 5
B. 14,396 Live births
* Cycles using GIFT or ZIFT are excluded. This comparison is limited to transfers on day 3 and day 5. Embryo transfers performed on days 1, 2, 4, and 6 are not included because each of these accounted for a small proportion of procedures.

Percentages of Transfers That Resulted in Live Births and Percentages of Multiple-Infant Live
Births for Day 5 Embryo Transfers Among Women Who Were Younger Than 35, Used Fresh
Nondonor Eggs or Embryos, and Set Aside Extra Embryos for Future Use, by Number of
Embryos Transferred, 2009
(98.2)*
(52.3)*
(43.5)*
(1.8)*
(46.5)*
(43.1)*
(1.3)*
(13.4)*
0
10
20
30
40
50
60
70
1 2† 3+
Perc
ent
Number of Embryos Transferred Singletons Twins Triplets or more
52.8% 60.7%
51.8% (1.8)*
(1.3)*
* Percentages of live births that were singletons, twins, and triplets or more are in parentheses. Note: In rare cases a single embryo may divide and thus produce twins. For this reason, a small percentage of twins resulted from a single
embryo transfer, and a small percentage of triplets resulted when two embryos were transferred. † Total does not equal 100% due to rounding.

Comparison of Percentages of Transfers Using Fresh Nondonor Eggs or Embryos That Resulted in Live Births Between ART Cycles That Used
Gestational Carriers and Those That Did Not, by Age of ART Patient,* 2009
49.0
36.0 31.6
18.8
9.1
47.2
38.1
28.2
16.7
7.1 2.6
0
10
20
30
40
50
60
<35 35–37 38–40 41–42 43–44 >44†
Perc
ent
Age (years)
Used a gestational carrier Did not use a gestational carrier
* Age categories reflect the age of the ART patient, not the age of the gestational carrier. † There were no transfers resulting in live births among ART patients older than 44 who used gestational carriers.

Percentages of Embryos Transferred That Resulted in Implantation Among Women Using Frozen Nondonor Embryos, by Age Group, 2009
25.2
21.4
18.0
14.7
10.9 10.6
0
10
20
30
40
<35 35–37 38–40 41–42 43–44 >44
Perc
ent
Age (years)

Percentages of Transfers That Resulted in Live Births and Singleton Live Births for ART Cycles Using Frozen Nondonor Embryos and ART Cycles
Using Fresh Nondonor Embryos, 2009
30.3 30.8
23.6
36.6
25.5
0
10
20
30
40
50
Thawedembryos
resulting in
Transfersresulting inlive births
Transfersresulting insingleton
Transfersresulting inlive births
Transfersresulting insingleton
Perc
ent
Frozen embryos Fresh embryos
live births live births live births

Risks of Having Multiple-Fetus Pregnancies and Multiple-Infant Live Births from ART Cycles Using Frozen Nondonor Embryos, 2009
Singletons 67.3%
Twins 20.9%
Triplets or more
1.9% Not able to determine number of
fetuses 9.8%
A. 9,487 Pregnancies*
Singletons 76.6%
Twins 22.3%
Triplets or more
1.1%
B. 7,424 Live births
* Total does not equal 100% due to rounding.

Percentages of ART Cycles Using Donor Eggs, by Age of Woman, 2009
0
10
20
30
40
50
60
70
80
90
100
24 26 28 30 32 34 36 38 40 42 44 46 48
Perc
ent
Age (years) <24 >48

Percentages of Transfers That Resulted in Live Births for ART Cycles Using Fresh Embryos from Own Eggs and ART Cycles Using Fresh Embryos from
Donor Eggs, by Age of Woman, 2009
0
10
20
30
40
50
60
70
80
90
100
24 26 28 30 32 34 36 38 40 42 44 46 48
Perc
ent
Age (years)
Donor eggs Own eggs
<24 >48

Percentages of Transfers That Resulted in Live Births and Singleton Live Births for ART Cycles Using Fresh Embryos from Donor Eggs,
by Age of Woman, 2009
0
10
20
30
40
50
60
70
80
90
100
24 26 28 30 32 34 36 38 40 42 44 46 48
Perc
ent
Age (years)
Transfers resulting in live births (donor egg)Transfers resulting in singleton live birth (donor egg)
<24 >48

Risks of Having Multiple-Fetus Pregnancies and Multiple-Infant Live Births from ART Cycles Using Fresh Embryos from Donor Eggs, 2009
Singletons 54.9%
Twins 37.1%
Triplets or more
2.8% Not able to determine number of
fetuses 5.3%
A. 6,553 Pregnancies*
Singletons 61.9%
Twins 37.0%
Triplets or more
1.2%
B. 5,595 Live births*
* Total does not equal 100% due to rounding.

Percentages of Transfers That Resulted in Live Births and Singleton Live Births for ART Cycles Using Frozen Donor Embryos and ART Cycles
Using Fresh Donor Embryos, 2009
34.0
25.7
55.1
34.1
0
10
20
30
40
50
60
70
Transfersresulting inlive births
Transfersresulting insingletonlive births
Transfersresulting inlive births
Transfersresulting insingletonlive births
Perc
ent
Frozen embryos Fresh embryos
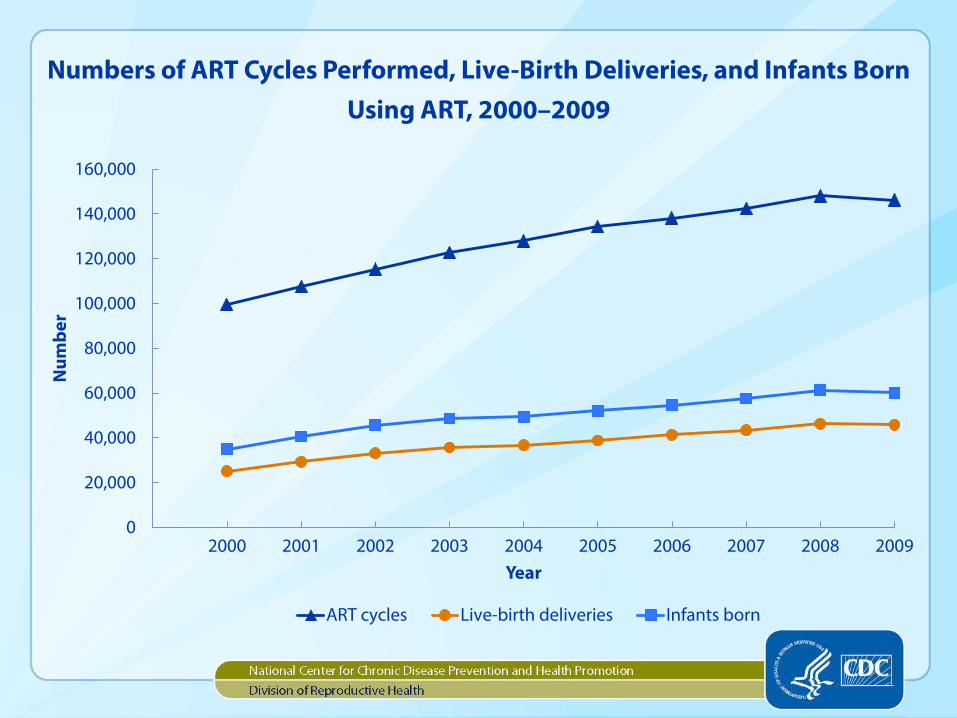
Numbers of ART Cycles Performed, Live-Birth Deliveries, and Infants Born Using ART, 2000–2009
0
20,000
40,000
60,000
80,000
100,000
120,000
140,000
160,000
2000 2001 2002 2003 2004 2005 2006 2007 2008 2009
Num
ber
Year
ART cycles Live-birth deliveries Infants born

Numbers of ICSI* Procedures Performed, by Type of ART Cycle, 2000–2009
0
10,000
20,000
30,000
40,000
50,000
60,000
70,000
2000 2001 2002 2003 2004 2005 2006 2007 2008 2009
Num
ber
Year Fresh nondonor with ICSI Fresh donor with ICSIFrozen nondonor Frozen donor
* Intracytoplasmic sperm injection.

Percentages of Transfers That Resulted in Live Births, by Type of ART Cycle and ICSI,* 2000–2009
10
20
30
40
50
60
2000 2001 2002 2003 2004 2005 2006 2007 2008 2009
Perc
ent
Year
Fresh nondonor without ICSI Fresh donor without ICSIFresh nondonor with ICSI Fresh donor with ICSIFrozen nondonor Frozen donor
* Intracytoplasmic sperm injection.

Percentages of Transfers That Resulted in Singleton Live Births, by Type of ART Cycle and ICSI,* 2000–2009
10
15
20
25
30
35
40
2000 2001 2002 2003 2004 2005 2006 2007 2008 2009
Perc
ent
Year
Fresh nondonor without ICSI Fresh donor without ICSIFresh nondonor with ICSI Fresh donor with ICSIFrozen nondonor Frozen donor
* Intracytoplasmic sperm injection.

Percentages of Transfers That Resulted in Live Births for ART Cycles Using Fresh Nondonor Eggs or Embryos, by Age of Woman, 2000–2009
0
10
20
30
40
50
2000 2001 2002 2003 2004 2005 2006* 2007† 2008 2009
Perc
ent
Year
<35 35–37 38–40 41–42 >42 43–44 >44Age Group:
* 2006 was the last year in which data were reported together for women older than 42. † 2007 was the first year in which data for women older than 42 were subdivided into ages 43–44 and >44.

Percentages of Transfers That Resulted in Singleton Live Births for ART Cycles Using Fresh Nondonor Eggs or Embryos, by Age of Woman, 2000–2009
0
10
20
30
40
2000 2001 2002 2003 2004 2005 2006* 2007† 2008 2009
Perc
ent
Year
<35 35–37 38–40 41–42 >42 43–44 >44Age Group:
* 2006 was the last year in which data were reported together for women older than 42. † 2007 was the first year in which data for women older than 42 were subdivided into ages 43–44 and >44.

Percentages of Fresh Nondonor Cycles That Involved the Transfer of One, Two, Three, or Four or More Embryos, 2000–2009
6 6 7 7 8 9 11 12 12 14
26 27 32
36 39
43 46 48 50 52 35 35
34 33 32 29 28 26 25 23
34 32 28 24 21 18 16 14 14 12
2000* 2001 2002* 2003 2004 2005* 2006* 2007 2008* 2009*
Perc
ent
Year
One Two Three Four or moreNumber of Embryos Transferred
* Totals do not equal 100% due to rounding.

Percentages of Fresh Nondonor Cycles That Involved the Transfer of One, Two, Three, or Four or More Embryos Among Women Who Were
Younger Than 35 and Set Aside Extra Embryos for Future Use, 2000–2009
1 2 3 4 7 9 10 14
45 48 55
62 68
72 75
76 77 77
40 39 35 29 25 20 16 13 11 8 15 12 9 7 5 4 3 2 2 1
2000* 2001*† 2002 2003 2004† 2005 2006† 2007 2008 2009
Perc
ent
Year
One Two Three Four or moreNumber of Embryos Transferred
1 2 3 4
* Cycles involving the transfer of one embryo are not included because of the small number of cycles where one embryo was transferred and extra embryos were set aside for future use.
† Totals do not equal 100% due to rounding.

Percentages of Transfers That Resulted in Live Births Using Fresh Nondonor Eggs or Embryos, by Number of Embryos Transferred, 2000–2009
0
10
20
30
40
50
2000 2001 2002 2003 2004 2005 2006 2007 2008 2009
Perc
ent
Year
One Two Three Four or moreNumber of Embryos Transferred

Percentages of Transfers That Resulted in Live Births Among Women Who Were Younger Than 35 and Set Aside Extra Embryos for Future Use,
by Number of Embryos Transferred, 2000–2009
0
10
20
30
40
50
60
2000* 2001 2002 2003 2004 2005 2006 2007 2008 2009
Perc
ent
Year
One Two Three Four or moreNumber of Embryos Transferred
* Cycles involving the transfer of one embryo are not included because of the small number of cycles where one embryo was transferred and extra embryos were set aside for future use.

Percentages of ART Cycles That Resulted in Multiple-Infant Live Births, by Type of ART Cycle, 2000–2009
0
10
20
30
40
50
2000 2001 2002 2003 2004 2005 2006 2007 2008 2009
Perc
ent
Year Fresh nondonors Fresh donorsFrozen nondonors Frozen donors

Percentages of Multiple-Infant Live Births for ART Cycles Using Fresh Nondonor Eggs or Embryos, by Age of Woman, 2000–2009
0
10
20
30
40
50
2000 2001 2002 2003 2004 2005 2006* 2007† 2008 2009
Perc
ent
Year
<35 35–37 38–40 41–42 >42 43–44 >44Age Group:
* 2006 was the last year in which data were reported together for women older than 42. † 2007 was the first year in which data for women older than 42 were subdivided into ages 43–44 and >44.

Percentages of Transfers That Resulted in Live Births and Percentages of Multiple-Infant Live Births for ART Cycles Using
Fresh Nondonor Eggs or Embryos, 2000–2009
(65)* (64)* (65)* (66)* (67)* (68)* (69)* (69)* (68)* (69)*
(31)* (32)* (32)* (31)* (30)* (30)* (29)* (29)* (30)* (29)* (4)* (4)* (4)* (3)* (3)* (2)* (2)* (2)* (2)* (2)*
0
10
20
30
40
2000 2001 2002† 2003 2004 2005 2006 2007 2008 2009
Perc
ent
Year
Singletons Twins Triplets or more
31.6% 33.4%
34.8% 34.7% 34.1% 34.3% 35.4% 35.9% 36.7% 36.6%
(4)* (4)* (4)* (3)* (3)* (2)* (2)* (2)* (2)* (2)*
* Percentages of live births that were singletons, twins, and triplets or more are in parentheses. † Total does not equal 100% due to rounding.