location-responsive design in the mixed-use … · location-responsive design in the mixed-use...
TRANSCRIPT
Location-Responsive Design inthe Mixed-Use High-Rise Typology
Item Type text; Electronic Thesis
Authors Mosey, Grant Norman
Publisher The University of Arizona.
Rights Copyright © is held by the author. Digital access to this materialis made possible by the College of Architecture, Planning,and Landscape Architecture, and the University Libraries,University of Arizona. Further transmission, reproduction orpresentation (such as public display or performance) of protecteditems is prohibited except with permission of the author or thedepartment.
Download date 06/07/2018 02:47:49
Link to Item http://hdl.handle.net/10150/267535
LOCATION-RESPONSIVE DESIGN IN THE MIXED-USE HIGH-RISE TYPOLOGY
By
Grant Norman Mosey
____________________
A Thesis Submitted to the Faculty of the
COLLEGE OF ARCHITECTURE AND LANDSCAPE ARCHITECTURE
In Partial Fulfillment of the Requirements For the Degree of
MASTERS OF SCIENCE
WITH A MAJOR IN ARCHITECTURE
In the Graduate College
THE UNIVERSITY OF ARIZONA

2
ACKNOWLEDGEMENTS
This research would not have been possible without extensive help from its guiding faculty sponsors. Any wisdom or insight contained herein is a reflection on the dedication of Dr. Nader Chalfoun, Chris Trumble, and Colby Moeller. The author is profoundly grateful for their contribution.

3
TABLE OF CONTENTS
LIST OF FIGURES 05 ABSTRACT 06
I. PROBLEM STATEMENT 07 a. Definition of mixed-use high-rise 07 b. Formal analysis of selected buildings 09 c. Findings 10
II. SURVEY OF LOCATION-RESPONSIVE VARIABLES 11 a. Thermal 11
i. Solar orientation ii. Natural ventilation iii. Solar shading iv. Mass and resistance v. Humidity
b. Physical 17 i. Structure
ii. Water iii. Altitude Response iv. Daylighting Strategy
c. Social 21 i. Civic context
ii. Historic context iii. Access/transportation
III. LOCATION-RESPONSIVE RECOMMENDATIONS FOR CHICAGO AND TUCSON 24 a. Thermal 24
i. Solar orientation ii. Natural ventilation iii. Solar shading iv. Mass and resistance v. Humidity
b. Physical 32 i. Structure
ii. Water iii. Altitude Response iv. Daylighting Strategy
c. Social 36 i. Civic context
ii. Historic context

4
iii. Access/transportation IV. APPLICATION OF DESIGN STRATEGY 40
a. Base Design 40 i. Site selection
ii. Program iii. Massing iv. Building schedules
b. Design Testing 46 i. Energy use intensity
ii. Energy strategies iii. Energy cost analysis
c. Refined Design 50 i. Plans
ii. Sections iii. Exterior Renderings iv. Interior Renderings
V. CONCLUSION 58 WORKS CITED 59

5
LIST OF FIGURES
FIGURE 1: Diagram illustrating height relative to context and height relative to width 07
FIGURE 2: Diagram illustrating mixed-use and single-function high-rises. 08
FIGURE 3: Photographs of six selected towers. 09 FIGURE 4: Photographs of Trump Tower and the Burj Khalifa 10 FIGURE 5: Global solar radiation by façade in Dubai, Shanghai,
and Chicago. 12 FIGURE 6: Wind patterns in Dubai juxtaposed against images of
the Burj Khalifa and The Index 13 FIGURE 7: Façades of The Index and Trump Tower. 14 FIGURE 8: High-mass construction in the six sample towers 15 FIGURE 9: Water features at the Burj Khalifa and The Index 16 FIGURE 10: Construction photos of six towers showing structural
systems 17 FIGURE 11: Average monthly precipitation in Dubai, Shanghai, and
Chicago 18 FIGURE 12: Tops of each of six selected buildings 19 FIGURE 13: Façade details of six selected buildings 20 FIGURE 14: Aerial photographs showing the immediate surroundings
of six selected buildings 21 FIGURE 15: Heavy, load bearing exterior walls of The Index and
pagoda-themed homage of Jin Mao 22 FIGURE 16: Metro maps of relevant sections of Dubai, Shanghai,
and Chicago 23 FIGURE 17: Map of the United States highlighting Chicago and
Tucson. 24 FIGURE 18: 24 Towers of various orientations. 25 FIGURE 19: Chart showing ideal orientation for Chicago and
Tucson 25 FIGURE 20: Hours of comfort provided by natural ventilation and
wind protection of outdoor spaces in Chicago and Tucson. 26
FIGURE 21: Natural ventilation strategies for Chicago and Tucson 27 FIGURE 22: Hourly average dry bulb temperature in Chicago and
Tucson 27 FIGURE 23: Solar shading strategies for Chicago and Tucson 28
6
FIGURE 24: Mass and Resistance Strategies for Chicago and Tucson 30 FIGURE 25: Annual average relative humidity in Chicago and
Tucson 31 FIGURE 26: Humidity strategies in Chicago and Tucson 31 FIGURE 27: Structural strategies for Chicago and Tucson 32 FIGURE 28: Average monthly rainfall in Chicago and Tucson 33 FIGURE 29: Water strategies for Chicago and Tucson 34 FIGURE 30: Altitude response strategies in Chicago and Tucson 35 FIGURE 31: Sky Cover and Direct Normal Illumination in Chicago
and Tucson 35 FIGURE 32: Daylighting strategies in Chicago and Tucson. 36 FIGURE 33: Context integration strategies in Chicago and Tucson 37 FIGURE 34: Historic context in Chicago and Tucson 37 FIGURE 35: Transit access for sites in Chicago and Tucson 38 FIGURE 36: Transportation strategies for Chicago and Tucson 39 FIGURE 37: Aerial photographs of Chicago site 40 FIGURE 38: Aerial photographs of Tucson site 41 FIGURE 39: Simplified building program 42 FIGURE 40: Chicago massing study and single line plan 42 FIGURE 41: Tucson massing study and single line plan 43 FIGURE 42: Chicago tower energy use intensity 46 FIGURE 43: Tucson tower energy use intensity 47 FIGURE 44: Chicago energy cost savings 48 FIGURE 45: Tucson energy cost savings 49 FIGURE 46: Percentage energy cost savings by strategy in Chicago
and Tucson 49 FIGURE 47: Chicago tower typical hotel plan 50 FIGURE 48: Chicago tower typical residential plan 51 FIGURE 49: Tucson tower typical hotel plan 51 FIGURE 50: Tucson tower typical residential plan 52 FIGURE 51: Chicago tower transverse and wall sections 53 FIGURE 52: Tucson tower transverse and wall sections 54 FIGURE 53: Chicago tower exterior renderings 55 FIGURE 54: Tucson tower exterior renderings 55 FIGURE 55: Chicago tower interior renderings 56 FIGURE 56: Chicago tower interior renderings 57

7
ABSTRACT
This paper investigates how mixed-use high-rises respond to their sites, both climatically and otherwise. It seeks to make recommendations to improve the site responsiveness of tall, mixed-use buildings. Finally, it offers a case study by designing two buildings with identical programs for different sites.

8
PROBLEM STATEMENT
While identifying which building may be rightly called the first high-rise may be an exercise fraught with controversy, no one can argue that the building typology is relatively new. While many building types (e.g. dwellings, places of worship, etc.) have been being constructed for millennia, the lineage of the modern high-rise stretches back scarcely more than a century. While this makes the high-rise an exciting and new architectural problem, it also means the exigencies associated with its construction are largely unresolved. Chief among these exigencies is location-responsive design. While other building types have rich histories of vernacular, regional design, the high-rise appears, at first glance, to be notably bereft of regionally developed styles. International Modernism and its derivatives loom large over the typology. By examining the location of tall, mixed-use high rises and their forms, one can draw conclusions about the role that site has played in the design of these buildings to date (if any).
Definition of mixed-use high-rise
Figure 1: Diagram illustrating height relative to context and height relative to width. Diagram by CTBUH.

9
Defining what exactly constitutes a high-rise is a somewhat difficult task. For the sake of this document, we will consider the definitions provided by the Council on Tall Buildings and Urban Habitats (CTBUH). CTBUH doesn’t provide a specific height a building must exceed to be considered a high-rise, but rather recognizes that what constitutes tall depends on context and proportions, as shown in the figure above. A high-rise, then is one that is of substantial height relative to its surroundings and width.
Figure 2: Diagram illustrating mixed-use and single-function high-rises. Diagram by CTBUH. Defining what exactly constitutes mixed-use is no less difficult. Again, CTBUH provides some guidelines, defining a mixed use building as one which has two functions which each occupy at least 15% of the building’s total floor area or total building height (in terms of the number of floors per function)1. For the purpose of this research, both the existing buildings studied and the new buildings proposed meet with the above definitions. All concerned buildings are unquestionably tall and self-evidently mixed-use in nature.
1 “The Skyscraper Page,” Council on Tall Buildings and Urban Habitats, accessed October 10, 2011. <http://www.skyscrapercenter.com>

10
Formal analysis of selected buildings With the above definitions in mind, it is clear that buildings all over the world qualify as mixed-use high-rises. One would expect a diversity of form to follow this diversity of location. After all, it is considered a truism that all great architecture must respond to its site in a meaningful and logical manner. For the purpose of evaluation, consider two buildings from each of the three major cities known for their mixed-use high-rises: from Dubai, the the Index and the Burj Khalifa, from Shanghai, Jin Mao Tower and the Shanghai World Financial Center (SWFC), and from Chicago, the John Hancock Building and Trump International Hotel and Tower (Trump Tower)
Figure 3: Photographs of six selected towers. Photos by Imre Solt (left 2), ART on FILE (center 2), Skidmore, Owings, and Merrill (second from right), and Marshall Gerometta (far right). At first blush, one may notice some location-responsive elements. Jin Mao Tower’s tapering form seems to mimic that of a pagoda. The Index’s broad southern face seems to be an attempt at desert climate response. Yet, one is struck more by the similarities of the buildings than by their differences. All are primarily glass. All have the clean lines and clarity of structure associated with International Modernism.

11
What differences do exist seem arbitrary. For example, the Burj Khalifa in Dubai looks much more like Trump Tower in Chicago than The Index. One would expect if there was an empirical method to making location-responsive mixed-use high-rises, this would not be the case. Indeed, aside from Jin Mao Tower’s nod to the pagoda, the differences in tower form seem to be quite arbitrary, having nothing to do with responding to specific site variables. Findings
Figure 4: Photographs of Trump Tower and the Burj Khalifa. Photos by Marshall Gerometta (left) and Skidmore, Owings, and Merrill (right). From the above analysis, it seems simple to conclude the the location-response in mixed-use high-rise design has been, to date, inadequate. While it is generally accepted that architecture should have an intimate connection to its site, these towers largely exhibit no site specificity. What is located in Shanghai could just as easy be located in Dubai or Chicago. While the two buildings seen in the above figure are located on separated by 7,292 miles of distance, their appearances are extraordinarily similar. Clearly, the tall, clearly trabeated, glass-clad tower has been exported around the world with little attention given to site response.
12
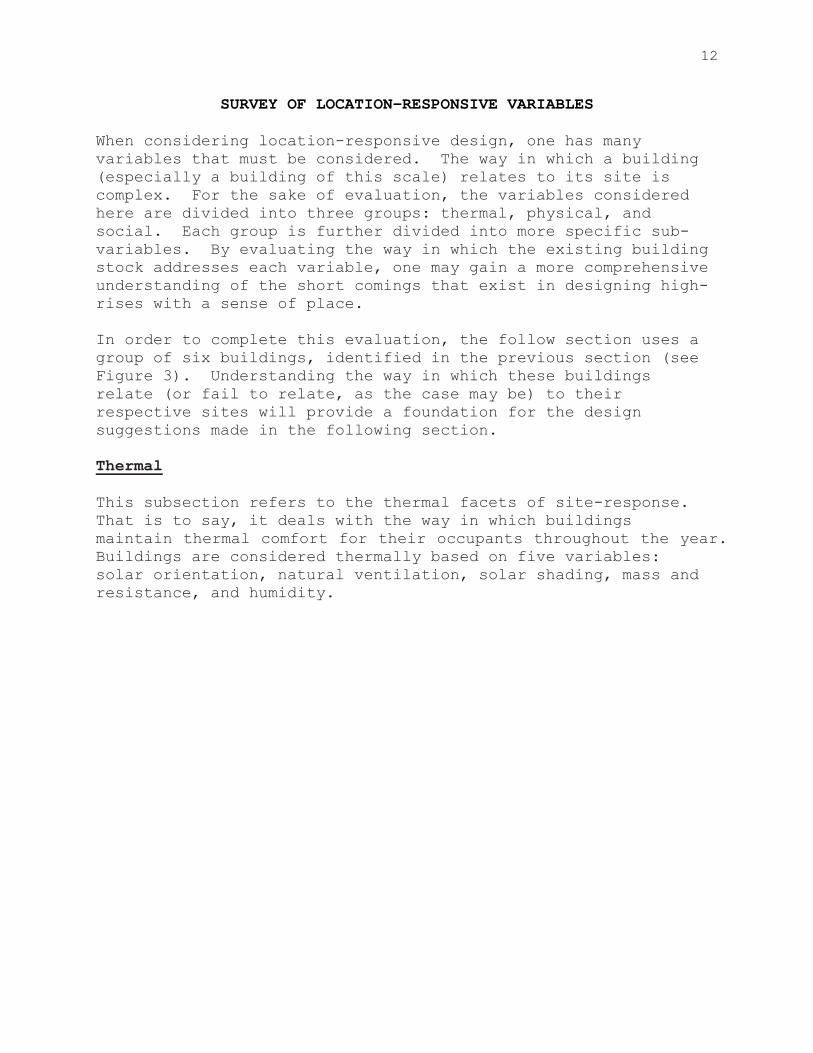
SURVEY OF LOCATION-RESPONSIVE VARIABLES
When considering location-responsive design, one has many variables that must be considered. The way in which a building (especially a building of this scale) relates to its site is complex. For the sake of evaluation, the variables considered here are divided into three groups: thermal, physical, and social. Each group is further divided into more specific sub-variables. By evaluating the way in which the existing building stock addresses each variable, one may gain a more comprehensive understanding of the short comings that exist in designing high-rises with a sense of place. In order to complete this evaluation, the follow section uses a group of six buildings, identified in the previous section (see Figure 3). Understanding the way in which these buildings relate (or fail to relate, as the case may be) to their respective sites will provide a foundation for the design suggestions made in the following section. Thermal This subsection refers to the thermal facets of site-response. That is to say, it deals with the way in which buildings maintain thermal comfort for their occupants throughout the year. Buildings are considered thermally based on five variables: solar orientation, natural ventilation, solar shading, mass and resistance, and humidity.

13
Solar Orientation
Figure 5: Global solar radiation by façade in Dubai, Shanghai, and Chicago. Graphs by author. One of the most important features of any building, tall or otherwise, is appropriate solar orientation. Of course, what constitutes ‘appropriate’ can vary widely by location. Thus, in seeking to create site-responsive architecture, it is worthwhile to understand what orientation offers the ideal thermal benefits. For example, using the above graphs, one can see that in Chicago on the winter solstice (when direct solar gain is desirable due to the low temperatures), the south façade receives the most direct gain. This suggests that a tower in Chicago should have a broad southern façade which will help to reduce heating loads during the coldest part of the year. Yet, neither the John Hancock Center nor the Trump tower exhibit particularly broad southern facades. While both buildings feature a slight east/west orientation, neither appears to be making an effort to harness the sun. Findings are similar in Dubai and Shanghai, where only Dubai’s index appears to exhibit an orientation in line with what is considered thermally optimal.

14
Natural Ventilation
Figure 6: Wind patterns in Dubai juxtaposed against images of the Burj Khalifa and The Index. Graph by author. Photographs by SWA (left) and Foster and Partners (right)
Another important thermal strategy (especially in warmer climates) is optimizing natural ventilation. To optimize ventilation, towers should be broad rectangles (as opposed to squares) in plan, with the short access of the building facing the prevailing summer winds2. Alternatively, due to the height of tall mixed-use buildings, such buildings are in a unique position to harness the stack effect. To do so, a tall building would require some internal vertical shaft through which air
2 Edward Arens, Natural Ventilative Cooling of Buildings (Department of the Navy: Alexandria, VA, 1986), 5.

15
would be drawn by the atmospheric pressure difference at the top and bottom of the tower. The ideal strategy for harnessing the cooling power of the wind will vary by site. To evaluate how tall mixed-use buildings typically address natural ventilation, allow us to consider our two buildings in Dubai, where the oppressive heat makes cooling by natural ventilation a critical part of site response. As seen in Figure 6, the Burj Khalifa seems to make no effort towards orienting itself toward the prevailing winds. Indeed, its stout floor plate with its impenetrable internal core limits opportunities for natural ventilation. The Index performs much more admirably, featuring a narrow floor plate with operable glazing on either side. This allows the wind to pass through the building easily, optimizing natural ventilation potential. Solar Shading
Figure 7: Façades of The Index and Trump Tower. Images by Inhabit (top left), Foster and Partners (top right), Marshall Gerometta (bottom left), and Jess Gibbs (bottom right). In certain warm climates, the most important thermal site response for a building may be how it shades itself from the Sun’s rays. Generally speaking, buildings should seek to harness the heating power of the sun in winter while blocking in
16
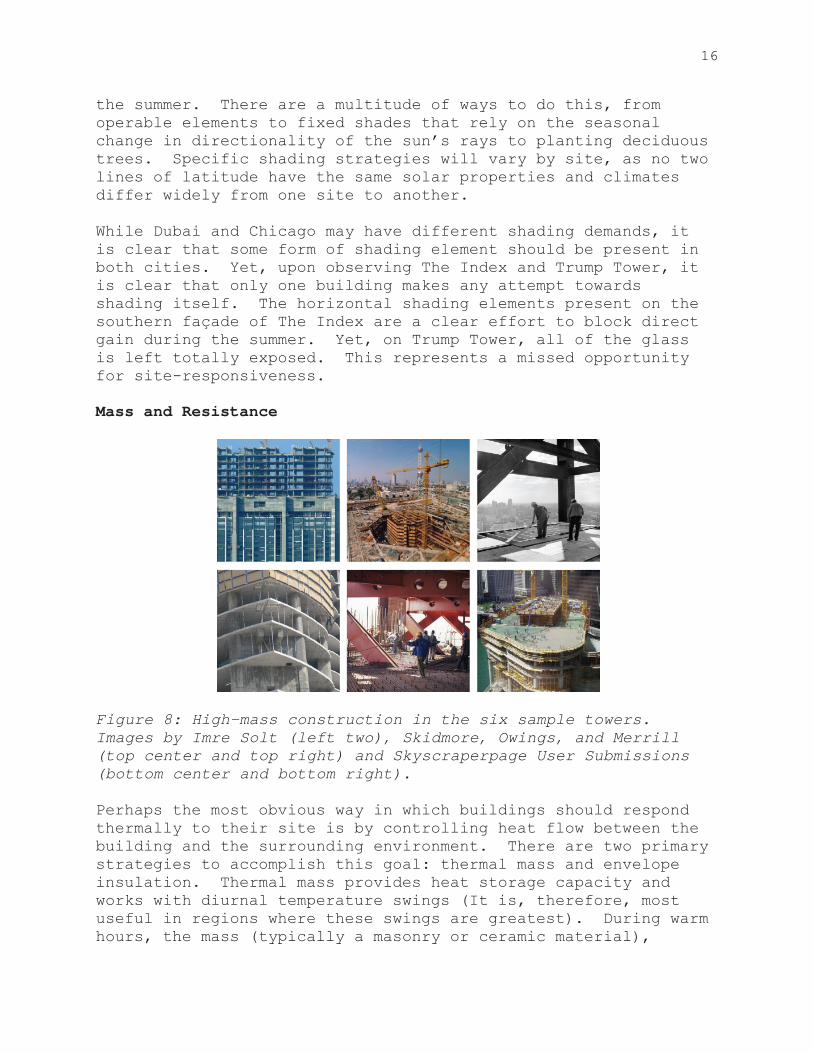
the summer. There are a multitude of ways to do this, from operable elements to fixed shades that rely on the seasonal change in directionality of the sun’s rays to planting deciduous trees. Specific shading strategies will vary by site, as no two lines of latitude have the same solar properties and climates differ widely from one site to another. While Dubai and Chicago may have different shading demands, it is clear that some form of shading element should be present in both cities. Yet, upon observing The Index and Trump Tower, it is clear that only one building makes any attempt towards shading itself. The horizontal shading elements present on the southern façade of The Index are a clear effort to block direct gain during the summer. Yet, on Trump Tower, all of the glass is left totally exposed. This represents a missed opportunity for site-responsiveness. Mass and Resistance
Figure 8: High-mass construction in the six sample towers. Images by Imre Solt (left two), Skidmore, Owings, and Merrill (top center and top right) and Skyscraperpage User Submissions (bottom center and bottom right). Perhaps the most obvious way in which buildings should respond thermally to their site is by controlling heat flow between the building and the surrounding environment. There are two primary strategies to accomplish this goal: thermal mass and envelope insulation. Thermal mass provides heat storage capacity and works with diurnal temperature swings (It is, therefore, most useful in regions where these swings are greatest). During warm hours, the mass (typically a masonry or ceramic material),

17
absorbs heat which is then radiated back to the internal space at cooler hours. This lag effect serves to serves to move the highest heating and cooling loads off periods of peak demand while also minimizing temperature swings within the conditioned space. For best results, thermal mass should be insulated on the exterior. In warm climates, it should be ‘flushed’ with cool natural ventilation at night. The other means of controlling heat flow between conditioned and unconditioned spaces is through the use of envelope insulation. Unlike thermal mass, envelope insulation resists heat flow, preventing heat loss/gain through the envelope via conduction. Envelope insulation may be combined with thermal mass, but should always be installed to the exterior of the mass. All six buildings have facades that are primarily made of glass, a very poor insulator. With the exception of The Index, each building uses a glass curtain wall as its sole façade material. For this reason, all six selected buildings fail at one major area of heat flow control. Yet, all buildings also contain concrete (as a floor material in composite deck or as a primary structural material throughout), an effective thermal mass. While the mass is not particularly well-located or well-ventilated, it doubtless mitigates some of the damage done by the lack of insulation. In the interest of being more site-responsive, it would be prudent if each building had taken the heat flow mitigation requirements of a given site into account, developing a strategy toward the use of thermal mass and envelope insulation to maximize the comfort that can be attained passively. Humidity
Figure 9: Water features at the base of the Burj Khalifa and the Index. Images by Google Maps (left) and Foster and Partners (right).

18
In addition to responding to solar conditions and dry-bulb temperature, buildings, tall or otherwise, must respond to ambient atmospheric humidity conditions. In hot, arid environments, introducing humidity may be desirable to encourage evaporative cooling. In more temperate or moist environments, summer dehumidification will be necessary to ensure human thermal comfort. Of the six reference buildings studied, there appears to be very little response to humidity aside from the inclusion of active mechanical systems. The water features seen above may represent an effort to introduce humidity to outdoor spaces, thereby allowing for evaporative cooling in the hot Dubai summer. Of course, there purpose could also be aesthetic and their impact on the total cooling load of the building is doubtlessly very small. Of the four buildings in more temperate climates, none seems particularly concerned with humidity as a factor in design. Physical This sub-section deals with the physical facets of mixed-use high-rise site response. That is to say, it deals with the way in which the building interacts with its immediate physical environment, including environmental factors aside from thermal concerns. It is subdivided into four parts: structure, water harvesting, altitude response, and daylighting strategy. Structure
Figure 10: Construction photos of six towers showing structural systems. Images by Imre Solt (two left), Skidmore, Owings, and Merrill (top center, top right, bottom right) and Skyscraperpage users (bottom center).

19
Structurally speaking, high-rise buildings can be some of the most difficult to design. While gravity loads increase in a linear matter with height, lateral loads increase exponentially, placing a difficult requirements on the structure of a high-rise.3 Remarkably, with upgrades in building technology, structural elements now typically account for only 2-4% of the floor area of high-rises4, leaving the vast majority of space open for programmatic uses. Specific structural systems will vary by project and, to some extent, by site. Of the six towers studied here, The Index, the Burj Khalifa, and Trump Tower are reinforced concrete projects while Jin Mao, SWFC, and the Hancock are composite buildings (that is, steel buildings with concrete decking and/or a concrete core). Floor systems vary from flat plate concrete (e.g. Trump Tower and Burj Khalifa) to steel beam and composite deck (e.g. Jin Mao, SWFC, and Hancock). Lateral systems are also highly variable, with concrete projects relying on everything from the rigidity of a central core (present to some extent in each tower) to extensive diagonal cross bracing (e.g. Hancock and SWFC). Gravity loads are carried by columns in each project, although the character of these vary between the steel columns of Hancock and the composite supercolumns of Jin Mao. Water Harvesting
Figure 11: Average monthly precipitation in Dubai, Shanghai, and Chicago. Chart by author.
3 Bungale S. Taranath, Reinforced Concrete Design of Tall Buildings (Boca Raton: CRC Press, 2010), 695. 4 Ibid., 716.
20
The water harvesting capabilities of high-rise buildings will vary extensively with site. Those buildings which sit on a plaza or in a less dense environment may have more ability to compensate for their relatively small roof area by collecting water on other areas of the site. Alternatively, buildings may try to implement façade collection systems which take advantage of the relatively large façade areas of tall buildings. Of the six buildings studied, none harvested water. In Dubai, this could be because of the relative paucity of rainfall. In Chicago and Shanghai, it may be attributable to the relative availability of water nearby. Alternatively, the absence of harvesting capability could be a result of the relatively small roof area to volume ratio. Altitude Response
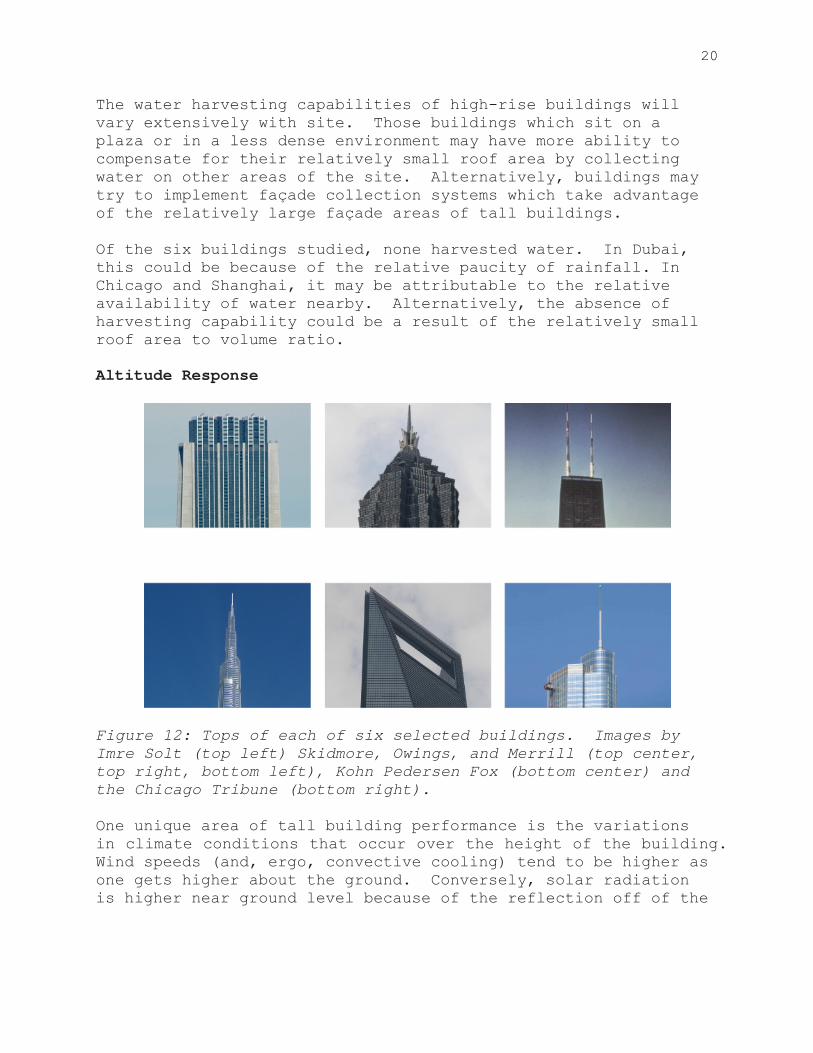
Figure 12: Tops of each of six selected buildings. Images by Imre Solt (top left) Skidmore, Owings, and Merrill (top center, top right, bottom left), Kohn Pedersen Fox (bottom center) and the Chicago Tribune (bottom right). One unique area of tall building performance is the variations in climate conditions that occur over the height of the building. Wind speeds (and, ergo, convective cooling) tend to be higher as one gets higher about the ground. Conversely, solar radiation is higher near ground level because of the reflection off of the
21
ground and surrounding buildings.5 It is, therefore, reasonable to expect buildings to compensate for this change in climate conditions over their vertical length. Of the six buildings studied, none varies its climatic strategy in such a way as to respond to changes in conditions at higher altitudes. With the exception of slight formal changes (i.e. setbacks) to avoid vortex shedding, none of the buildings studied make special arrangements for the variation in climate that occurs with an increase in height. Daylighting Strategy
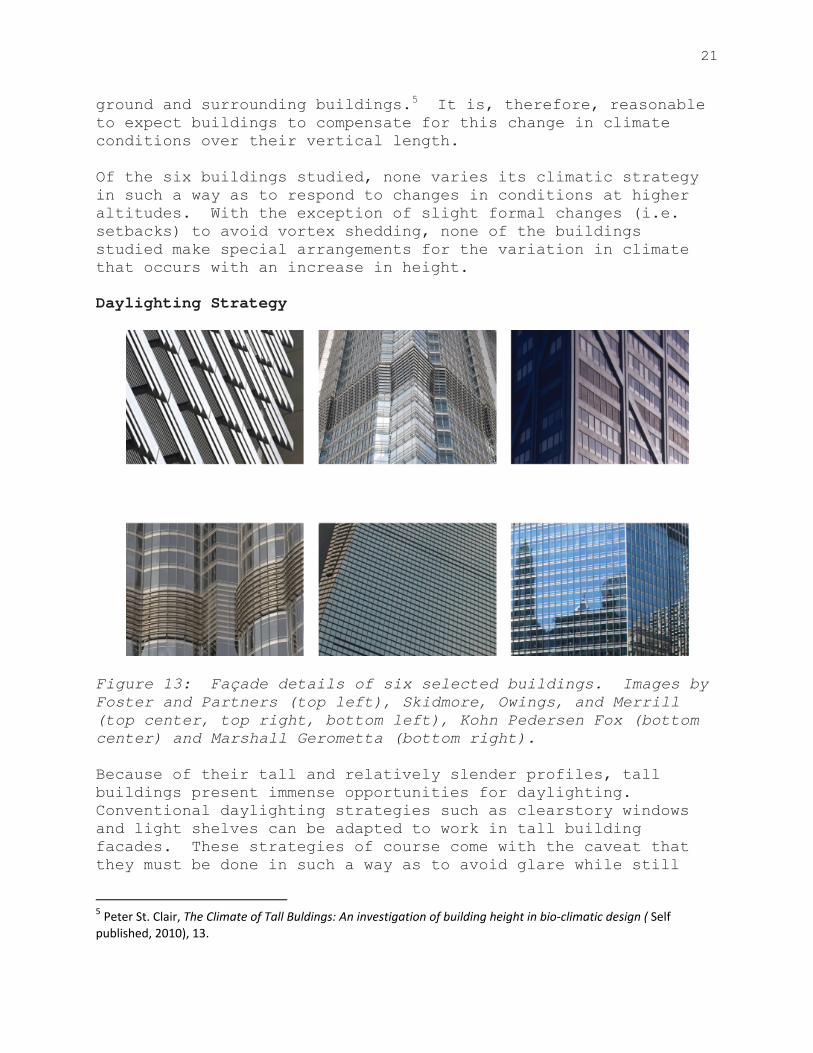
Figure 13: Façade details of six selected buildings. Images by Foster and Partners (top left), Skidmore, Owings, and Merrill (top center, top right, bottom left), Kohn Pedersen Fox (bottom center) and Marshall Gerometta (bottom right). Because of their tall and relatively slender profiles, tall buildings present immense opportunities for daylighting. Conventional daylighting strategies such as clearstory windows and light shelves can be adapted to work in tall building facades. These strategies of course come with the caveat that they must be done in such a way as to avoid glare while still
5 Peter St. Clair, The Climate of Tall Buldings: An investigation of building height in bio‐climatic design ( Self published, 2010), 13.

22
optimizing daylighting. If a side-lit space has too much light on one side with nothing to balance it (a circumstance that may be common in high-rise buildings, as their cores tend to be opaque and their facades tend to be glazing-heavy), glare can result, decreasing the comfort of occupants. Of the six sample buildings, only The Index appears to make an effort toward effective daylighting. With its narrow floor plate with cores at the edges, one would expect a fairly balanced daylighting condition to result. It is worth noting that all towers will admit a great amount of light, as all feature floor-to-ceiling glass. This light, however, may be overwhelming, creating undesirable glare. Social The third and final area of site-responsive variables consists of social variables. These are not concerned with the physics of building performance as much as with its place in the city, history, and society at large. Social variables are divided into three sub-areas: civic context, historic context, and access/transportation. Civic Context
Figure 14: Aerial photographs showing the immediate surroundings of six selected buildings. Images by Google Maps.

23
The manner in which tall buildings relate to their immediate civic context is very complicated. With their vast scale, tall buildings can sometimes get lost at the street level, offering banal facades and/or wind-swept plazas. Successfully integrating with a site involves not only tackling the physical exigencies associated with tall buildings (i.e. access, egress, utilities, parking, etc.), but doing so in a way that approaches the streetscape gracefully and naturally, find its place within the urban context. Unfortunately, few of the six buildings examined here successfully engage with their civic context. Most opt for the somewhat unoriginal strategy of separating themselves from their urban context through the use of a large plaza at ground level. Trump Tower and Hancock are the exceptions to this rule, both finding a home in the city’s grid and successfully introducing retail at their ground level. Historic Context
Figure 15: Heavy, load bearing exterior walls of The Index and pagoda-themed homage of Jin Mao. Photos by Imre Solt (left) and Skidmore, Owings, and Merrill (right). As a relatively new building form, it is common for high-rise buildings to be devoid of a sense of historical context, instead opting for a modern homogenous style which has been exported worldwide. The challenge of the architect is to find harmony between the advantage of indigenous or otherwise historic building forms and new demands of high-rise construction. Often, historic building forms were developed particular historical or

24
environmental site-specificity. By tapping into this site-specificity, an architect can hope to create a tower that helps contribute to its city’s sense of place. Of the six towers studied, only the Index and Jin Mao Tower appear to have any homage to history in their design. In the index, the heavy, load-bearing walls not only act as shear walls/cores, but also evoke the heavy, earthen, high-mass construction indigenous to the region. Jin Mao’s approach is less subtle, somewhat literally mimicking the form of a pagoda. Ultimately, an approach this literal can come off as a bit heavy-handed. Access/Transportation
Figure 16: Metro maps of relevant sections of Dubai, Shanghai, and Chicago. Images by respective transit agencies. Due to the size and intensity of use associated with the mixed-use high rise, the architect of such a building must be acutely aware of the means of the occupants to get to and from the buildings. Typically, this means investigating how the building is approached by private vehicles, pedestrians, and public transportation. Towers should be able to seamlessly integrate into the traffic patterns of their city, offering little or no disruption of existing transportation infrastructure. These buildings should be sited such that they can be accessed by a wide range of modes of transportation, allowing occupants to make intelligent choices about which mode of transportation to use. Pedestrian and public transportation access should be

25
given special attention, as these means of transportation have a lower carbon impact than private vehicles. The six buildings investigated here are each within easy walking distance of a rail stop. This adjacency provides the building’s end users with a clean and reliable way of accessing the building without relying on carbon-intensive forms of transportation.

26
LOCATION-RESPONSIVE RECOMMENDATIONS FOR CHICAGO AND TUCSON
The following section identifies how the principles evaluated in the previous section may be applied to the design of new construction mixed-use high-rises. It will focus on two cities, Chicago, IL and Tucson, AZ, offering strategies to meet each of the aforementioned criteria in each city. The purposes of this exercise are two-fold. First, it seeks to test the strategies previously outlined for two real-world cases. Second, it will serve to establish guidelines which will then be used in the design of a theoretical mixed-use high-rise for each city in the following section. Thermal
Figure 17: Map of the United States highlighting Chicago and Tucson. One may struggle to find two cities with as different of climates as Chicago and Tucson. While separated by fewer than 2,000 miles geographically, these two cities are oceans apart when it comes to thermal principles for design. Chicago has 6,336 heating degree days and 2,941 cooling degree days while Tucson has only 1,678 heating degree days and 6,921 cooling degree days.6
6 American Society of Heating, Refrigerating and Air‐Conditioning Engineers, ASHRAE Standard 90.1 (Atlanta, Ga: American Society of Heating, Refrigerating, and Air‐Conditioning Engineers, 2010), 154.
27
Solar Orientation
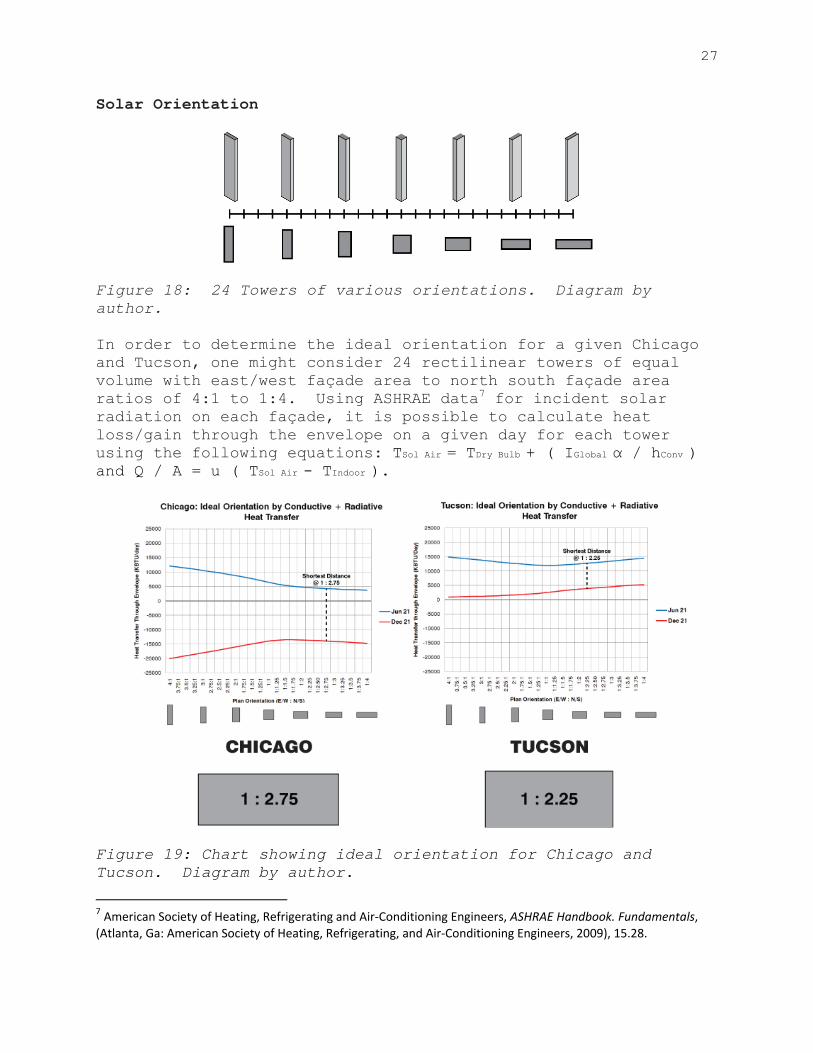
Figure 18: 24 Towers of various orientations. Diagram by author. In order to determine the ideal orientation for a given Chicago and Tucson, one might consider 24 rectilinear towers of equal volume with east/west façade area to north south façade area ratios of 4:1 to 1:4. Using ASHRAE data7 for incident solar radiation on each façade, it is possible to calculate heat loss/gain through the envelope on a given day for each tower using the following equations: TSol Air = TDry Bulb + ( IGlobal α / hConv ) and Q / A = u ( TSol Air - TIndoor ).
Figure 19: Chart showing ideal orientation for Chicago and Tucson. Diagram by author.
7 American Society of Heating, Refrigerating and Air‐Conditioning Engineers, ASHRAE Handbook. Fundamentals, (Atlanta, Ga: American Society of Heating, Refrigerating, and Air‐Conditioning Engineers, 2009), 15.28.
28
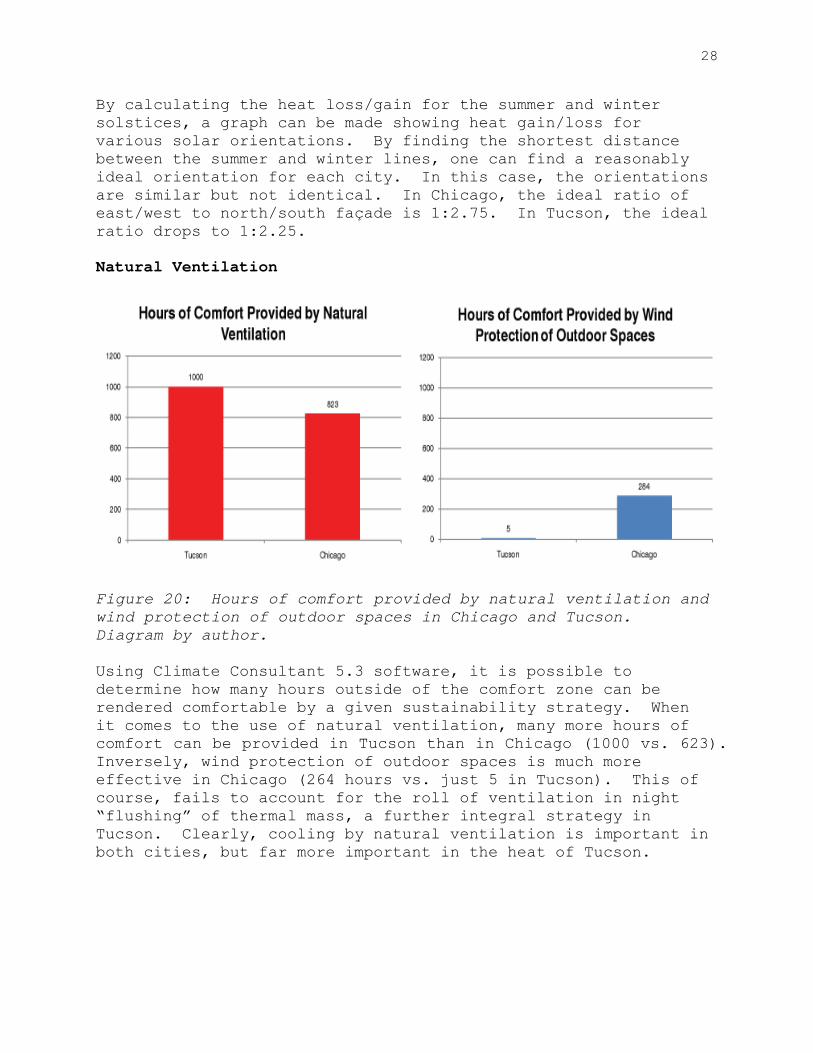
By calculating the heat loss/gain for the summer and winter solstices, a graph can be made showing heat gain/loss for various solar orientations. By finding the shortest distance between the summer and winter lines, one can find a reasonably ideal orientation for each city. In this case, the orientations are similar but not identical. In Chicago, the ideal ratio of east/west to north/south façade is 1:2.75. In Tucson, the ideal ratio drops to 1:2.25. Natural Ventilation
Figure 20: Hours of comfort provided by natural ventilation and wind protection of outdoor spaces in Chicago and Tucson. Diagram by author. Using Climate Consultant 5.3 software, it is possible to determine how many hours outside of the comfort zone can be rendered comfortable by a given sustainability strategy. When it comes to the use of natural ventilation, many more hours of comfort can be provided in Tucson than in Chicago (1000 vs. 623). Inversely, wind protection of outdoor spaces is much more effective in Chicago (264 hours vs. just 5 in Tucson). This of course, fails to account for the roll of ventilation in night “flushing” of thermal mass, a further integral strategy in Tucson. Clearly, cooling by natural ventilation is important in both cities, but far more important in the heat of Tucson.
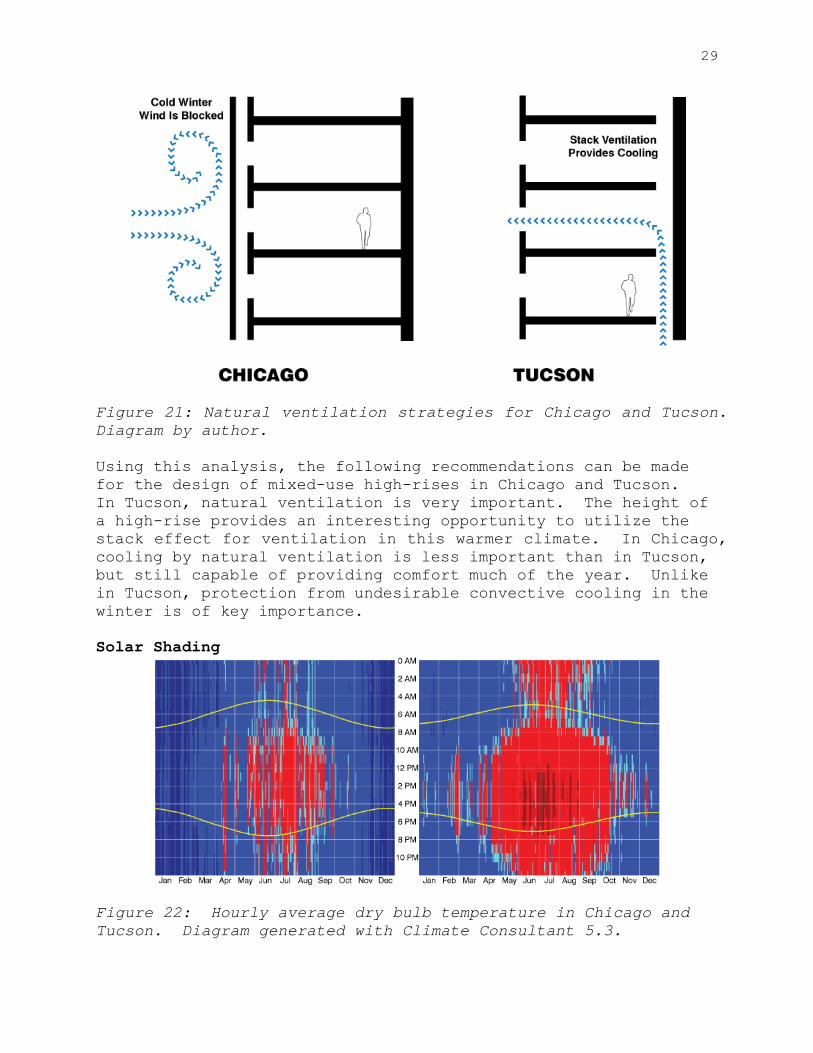
29
Figure 21: Natural ventilation strategies for Chicago and Tucson. Diagram by author. Using this analysis, the following recommendations can be made for the design of mixed-use high-rises in Chicago and Tucson. In Tucson, natural ventilation is very important. The height of a high-rise provides an interesting opportunity to utilize the stack effect for ventilation in this warmer climate. In Chicago, cooling by natural ventilation is less important than in Tucson, but still capable of providing comfort much of the year. Unlike in Tucson, protection from undesirable convective cooling in the winter is of key importance. Solar Shading
Figure 22: Hourly average dry bulb temperature in Chicago and Tucson. Diagram generated with Climate Consultant 5.3.

30
The above illustration indicates in cyan, red, and dark red which hours have a dry bulb temperature greater than 70 degrees in Chicago (left) and Tucson (right). Assuming shade is necessary whenever the dry bulb temperature exceeds 70 degrees (as indicated by the shade line on the psychrometric chart), this information can be used to inform which hours shade is necessary in each city. In Chicago, shade should be provided annually from April 21st to September 21st. In Tucson, the portion of the year requiring shade is much longer, stretching from March 21st to October 21st. By studying solar geometry, it is possible to design fixed shades for openings (and, in the case of Tucson, perhaps even whole buildings) which block direct gain during these portions of the year while allowing it in the winter, when it is desirable.
Figure 23: Solar shading strategies for Chicago and Tucson. Diagram by author. As a response to the climatic differences in Chicago and Tucson, shade should be provided in each city in accordance with the above diagram. In Chicago, fixed horizontal window shades should be provided as shown. In Tucson, a more aggressive shading strategy is necessary. It is recommended that this much warmer climate is addressed with whole building shading.
31
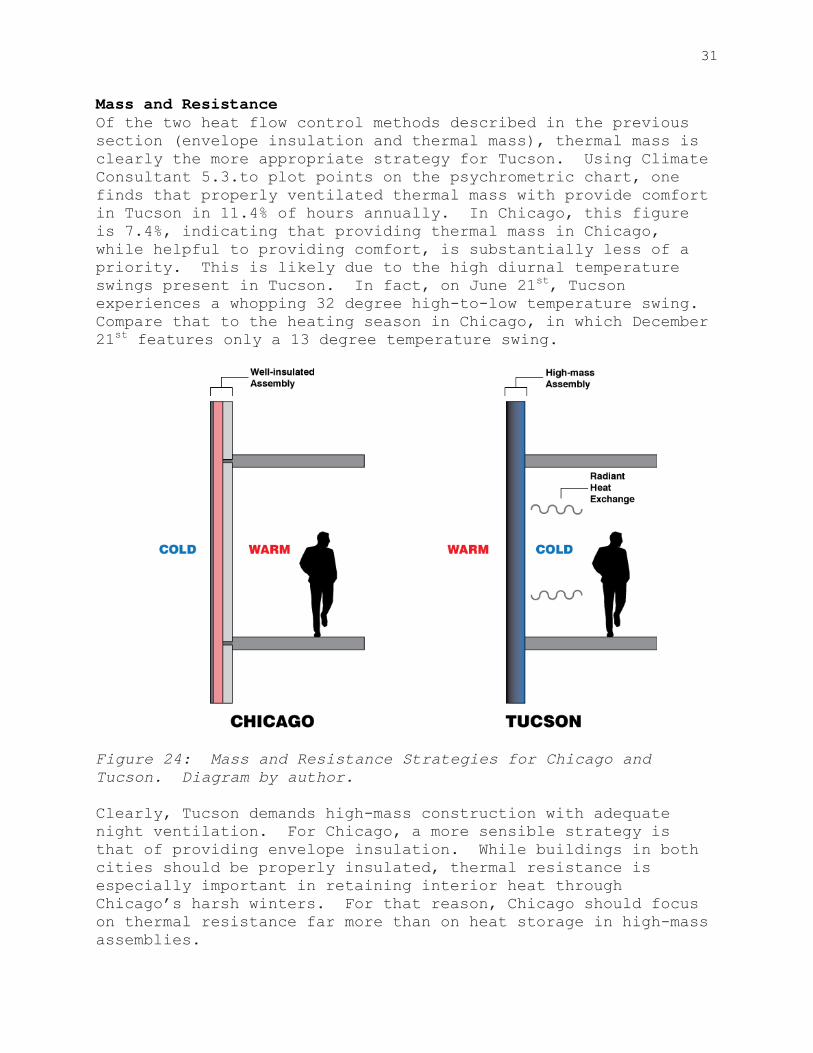
Mass and Resistance Of the two heat flow control methods described in the previous section (envelope insulation and thermal mass), thermal mass is clearly the more appropriate strategy for Tucson. Using Climate Consultant 5.3.to plot points on the psychrometric chart, one finds that properly ventilated thermal mass with provide comfort in Tucson in 11.4% of hours annually. In Chicago, this figure is 7.4%, indicating that providing thermal mass in Chicago, while helpful to providing comfort, is substantially less of a priority. This is likely due to the high diurnal temperature swings present in Tucson. In fact, on June 21st, Tucson experiences a whopping 32 degree high-to-low temperature swing. Compare that to the heating season in Chicago, in which December 21st features only a 13 degree temperature swing.
Figure 24: Mass and Resistance Strategies for Chicago and Tucson. Diagram by author. Clearly, Tucson demands high-mass construction with adequate night ventilation. For Chicago, a more sensible strategy is that of providing envelope insulation. While buildings in both cities should be properly insulated, thermal resistance is especially important in retaining interior heat through Chicago’s harsh winters. For that reason, Chicago should focus on thermal resistance far more than on heat storage in high-mass assemblies.
32
Humidity
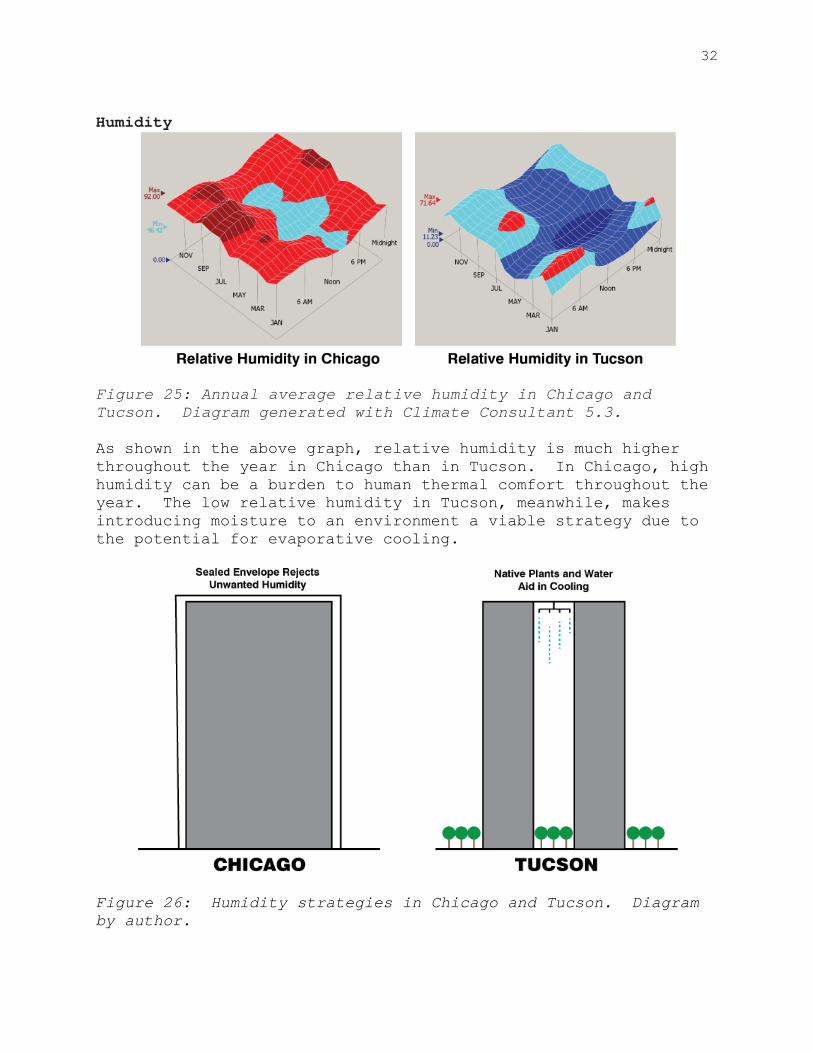
Figure 25: Annual average relative humidity in Chicago and Tucson. Diagram generated with Climate Consultant 5.3. As shown in the above graph, relative humidity is much higher throughout the year in Chicago than in Tucson. In Chicago, high humidity can be a burden to human thermal comfort throughout the year. The low relative humidity in Tucson, meanwhile, makes introducing moisture to an environment a viable strategy due to the potential for evaporative cooling.
Figure 26: Humidity strategies in Chicago and Tucson. Diagram by author.

33
These differences have a multitude of architectural applications as shown above. In Chicago, with active dehumidification necessary for the majority of the year, a sealed envelope that prevents unnecessary infiltration in absolutely crucial. Conversely, the strategy for dealing with humidity in Tucson can be significantly more nuanced. Plants can be used to encourage cooling through evapotranspiration. Similarly, moisture can be introduced (through micro-misters, etc) to encourage evaporative cooling of outdoor and semi-enclosed spaces. Physical As with thermal properties, the physical properties of Chicago and Tucson are quite different. It stands to reason, then, that the response to these physical features should likewise vary. Structure While there may be a number of acceptable structural solutions for towers in both cities, the rise in concrete high-rises suggest that concrete is the most economical solution. For residential and hospitality uses (with relatively short spans), flat plate concrete is an appropriate solution8. Building with concrete also ensures the presence of high-thermal-mass materials. For this reason, it is recommended that the concrete structure remain exposed to the interior spaces. To avoid thermal bridging, it is further recommended that the concrete structure not be exposed to external conditions, residing entirely within the building’s envelope.
Figure 27: Structural strategies for Chicago and Tucson. Diagram by author. 8 Cement and Concrete Association of Australia, Guide to Long Span Concrete Floors (St Leonards, NSW: Cement and Concrete Association of Australia, 2003) ,16.

34
For Chicago, where envelope insulation takes priority of thermal resistance and there is no need for a central atrium, the conventional tube-in-frame model is the most ideal solution. In this system, a central concrete core and a ring of external beams at or near slabs edge provide structural support9. In Tucson, a more complicated system may be necessary for the inclusion of a stack-effect central atrium and high-mass envelope as discussed earlier in this section. Here, dense concrete wants to move away from the core and towards the exterior of the building, making for a denser, wall-like assembly at slabs edge and a more columnar approach around the atrium, as seen above. The ideal configuration will also necessitate the movement of the core from its traditional location at the center of the slab. Water
Figure 28: Average monthly rainfall in Chicago and Tucson. Diagram by author. Chicago, located next to Lake Michigan, has access to one of the planet’s largest fresh water bodies as well as plenty of rainfall. Tucson, conversely, is in an arid region where rainfall is scarce and water conservation is a real priority. For this reason, rainwater harvesting is of a much higher priority in Tucson. In Chicago, where outdated storm sewers abound, holding water stormwater on site is of far greater importance.
9 Mir M. Ali, “Evolution of Concrete Skyscrapers: from Ingalls to Jin mao,” Electronic Journal of Structural Engineering 1 (2001): 6.

35
Figure 29: Water strategies for Chicago and Tucson. Diagram by author. In Chicago, it is recommended that as many horizontal surfaces as possible be vegetated to retain moisture as long as possible. Retention and catch basins can also be used to hold water on site and mitigate flooding concerns. In Tucson, both horizontal and vertical surfaces should be used to harvest scarce rainwater. This water can then be used as is for irrigation or some non-potable plumbing uses, or can be treated to meet portability standards. While buildings in both cities should seek to minimize water use,this is more of a priority in Tucson, where water is exceptionally scarce. Low flow fixtures, indigenous plants, and other practical water saving methods are recommended for both cities, with special attention given to saving water in Tucson. Altitude Response To take advantage of the unique features that occur at heights, buildings in each city should behave in different ways. In Tucson, where we are primarily concerned with cooling, the convective cooling and limited radiation available at higher altitudes are very desirable. In Chicago, where heating is of far greater concern, the reflected radiation and reduced winds available nearer to ground level are far better for a building’s thermal performance.

36
Figure 30: Altitude response strategies in Chicago and Tucson. Diagram by author. For this reason, in Chicago the higher altitudes of a building must be protected from convective cooling while the lower areas are allowed to benefit from the additional warmth. The opposite is true in Tucson, where greater wind velocities at higher altitudes can be used for cooling, and protection is required from the reflected radiation at lesser altitudes. Daylighting Strategy
Figure 31: Sky Cover and Direct Normal Illumination in Chicago and Tucson. Diagram generated with Climate Consultant 5.3.

37
In Chicago, sky cover is much higher than it is in Tucson. Tucson enjoys a myriad of direct sunlight while in Chicago, light is generally more diffuse due to overcast conditions (especially during the winter). In Tucson, the level of direct normal illumination is as high as one would expect from a notoriously bright and sunny desert. In Chicago, the effects of sunlight are more muted.
Figure 32: Daylighting strategies in Chicago and Tucson. Diagram by author. For this reason, lighting design in Tucson needs to focus on generating diffuse bounces for producing useable daylighting. In Chicago, the diffuse condition is often provided by the sky itself. In both cities, daylight sensors should be implemented to dim lights when natural light is adequate (approximately 10 footcandles for general residential10). Likewise, buildings in both cities should consider the use of light shelves and other methods of “throwing” light deeper into a space. Social The site in Chicago, known as Wolf Point, and the site in Tucson, the site of the former Hotel Arizona (explained more thoroughly in the following section), have a multitude of social differences. The response to these social variables should therefore vary greatly by site.
10 Robert T. Packard, ed., Architectural Graphic Standards: Seventh Edition (New York: John Wiley and Sons, 1981), 75.

38
Civic Context
Figure 33: Context integration strategies in Chicago and Tucson. Diagram by author. Chicago’s Wolf point is surrounded by water and high-rise buildings. It is therefore an ideal site for a tall building. A designer need not be afraid of dwarfing ones surroundings or seeming out of context in the neighborhood. Wolf Point has spectacular views down the South Branch and East Branch of the Chicago River. Above the height of the adjacent sun times building, 360 degree panoramaic views exist, with spectacular viewsheds in all directions. The site of the former Hotel Arizona in Tucson is located in the city’s central business district. The character of its neighbors are mixed, with high-rise, mid-rise, and low-rise development all present. Any tower installed on this site should pay special attention to not overwhelm its neighbors in size or in shadow. At any height above grade, 360 degree views of the surrounding mountians provide beautiful vistas to capture. Historic Context
Figure 34: Historic context in Chicago and Tucson. Diagram by author

39
The historic context of the two sites are varied. While both have a long history of occupation by indigenous peoples, recent occupation has been much different. The location of industry and labor struggle, Chicago’s history has something of a gritty, industrial edge. Any high-rise build here should exhibit a respect for the city’s workman-like past. Similarly, any building must pay homage to the skeletal modern towers that compose Chicago’s skyline. The site is also located along the Chicago River, the flow of which was reversed in the 19th century for sanitation reasons. Any structure built on this site will have to acknowledge the river’s role in shaping the city. The Tucson site is currently occupied by a hotel. In more distant history, the downtown area of Tucson has been milestone for intercontinental travelers for centuries. Any iconic structure in Tucson should pay homage to this waypost. Earlier, the city functioned as a Spanish colonial outpost. Certain elements of the adobe style used by Spanish colonists, such as thick, adobe walls, have merit even today. Access/Transportation
Figure 35: Transit access for sites in Chicago and Tucson. Underlay images by Google Maps. Both sites can be accessed by rail with minimal walking. The Chicago site is near the Merchandise Mart stop on the Brown Line as well as the Clark and Lake stop in the Loop. The Tucson site lies just south of the route for the new Tucson Modern Streetcar
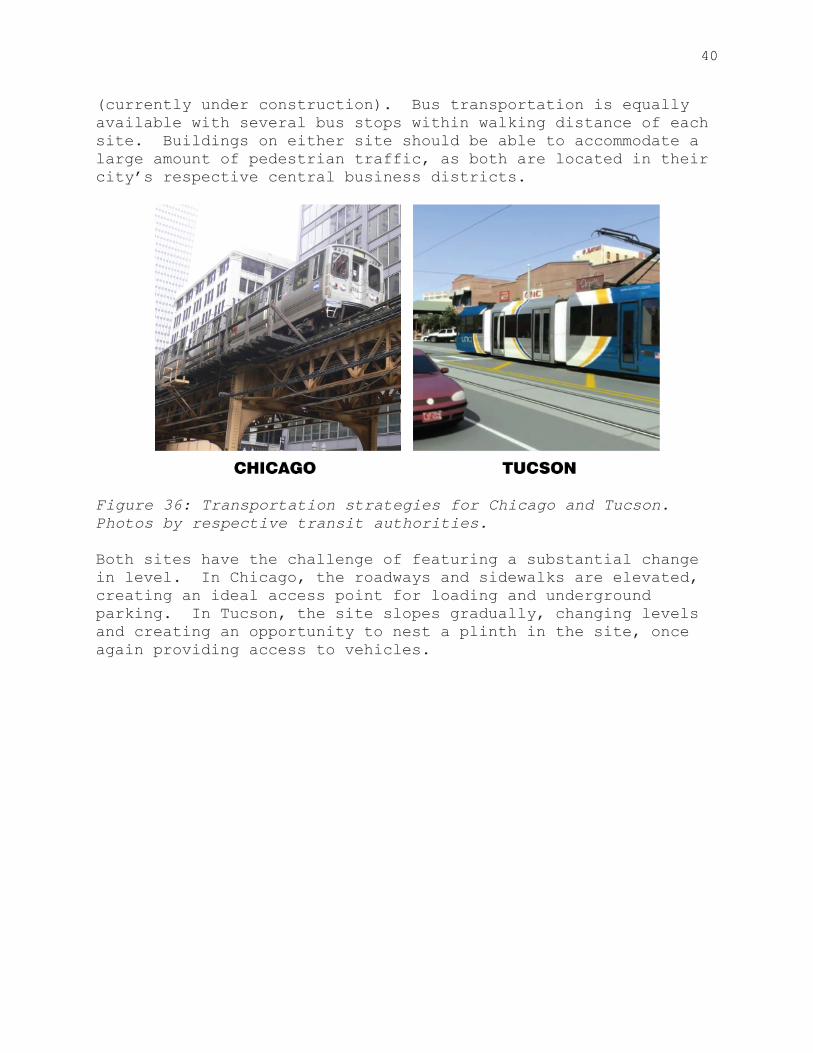
40
(currently under construction). Bus transportation is equally available with several bus stops within walking distance of each site. Buildings on either site should be able to accommodate a large amount of pedestrian traffic, as both are located in their city’s respective central business districts.
Figure 36: Transportation strategies for Chicago and Tucson. Photos by respective transit authorities. Both sites have the challenge of featuring a substantial change in level. In Chicago, the roadways and sidewalks are elevated, creating an ideal access point for loading and underground parking. In Tucson, the site slopes gradually, changing levels and creating an opportunity to nest a plinth in the site, once again providing access to vehicles.

41
APPLICATION OF DESIGN STRATEGY
This section seeks to apply the recommendation of the previous section to the design of two hypothetical mixed-use buildings on the previously investigated sites in Tucson and Chicago. Program is held constant, isolating the role of site in the design of mixed-use high-rises. The buildings are 40% hotel and 60% residential by floor area. The section is divided into three parts. The first is a base design, where a basic tower form is developed for each city. The second is design testing, where this design is tested using energy software. The third and final section is a refined design where the information collected from design testing is used to finalize the design. Base Design The base designs for Chicago and Tucson are based on the orientation recommendations made in the previous section. Other than that, they have few sustainable features. They are modeled as prototypical “glass boxes” in which each façade is 100% glazed (in line with typical construction details). Site Selection
Figure 37: Aerial photographs of Chicago site. Underlay images by Google Maps.

42
The site in Chicago is historic Wolf Point, located in the city’s central business district at the confluence of branches of the Chicago River. The site is extraordinarily high visibility. Almost all the surrounding construction is high rise in nature and the neighborhood is very dense. The orientation of the site is another positive, with the long axis stretching east/west.
Figure 38: Aerial photographs of Tucson site. Underlay images by Google Maps. The site in Tucson is the site of the former Hotel Arizona. Located on Congress Street, the site features prominently in the Downtown Tucson built environment. Surrounding construction varies greatly, with some high-rise buildings and other low and mid-rise buildings. As with the site in Chicago, the long axis of the site stretches east/west.

43
Program
Figure 39: Simplified building program. Table by author. The simplified program shown above represents the planned uses in the base case building. As mentioned, the resulting building is approximately 40% hotel and 60% residential. This program is held constant across both cities to attempt to isolate the effects of site responsiveness on building form. Massing
Figure 40: Chicago massing study and single-line plan. Images by author.
44
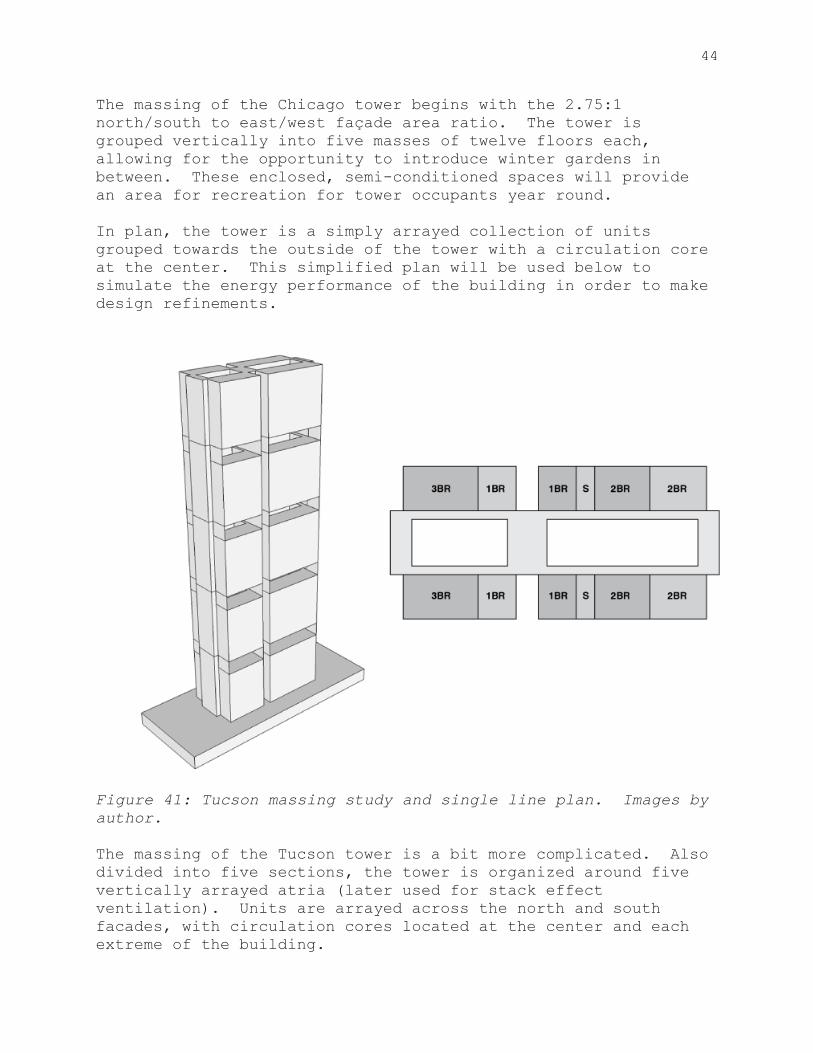
The massing of the Chicago tower begins with the 2.75:1 north/south to east/west façade area ratio. The tower is grouped vertically into five masses of twelve floors each, allowing for the opportunity to introduce winter gardens in between. These enclosed, semi-conditioned spaces will provide an area for recreation for tower occupants year round. In plan, the tower is a simply arrayed collection of units grouped towards the outside of the tower with a circulation core at the center. This simplified plan will be used below to simulate the energy performance of the building in order to make design refinements.
Figure 41: Tucson massing study and single line plan. Images by author. The massing of the Tucson tower is a bit more complicated. Also divided into five sections, the tower is organized around five vertically arrayed atria (later used for stack effect ventilation). Units are arrayed across the north and south facades, with circulation cores located at the center and each extreme of the building.

45
Building Schedules 1 Building: Name: Chicago Mixed-use Tower Address: 4444 E. Broadway Blvd. Tucson, AZ 85711 2 City: Location: Tucson (Lat. 41.85, Long. 87.65, elev. 579)
Degree Days: HDD65=6,336 & CDD50=2,941 (ASHRAE Standard 90.1, 2007 Page 131) Utility Rates: Electric= 0.14 $/KWh – Natural Gas= 0.74 $/Therm (Bureau of Labor Statistics)
3 Climate Zone: “5A” for Cook County (ASHRAE Standard 90.1, 2007 Page 110)
4 Orientation South 5 Volume
Conditioned Space 19,750 ft3/floor (84X48- shell2 (24X12)X20
6 Areas Conditioned Floor Area Walls: (include windows, but no plenums) South West North East Total walls Windows: (area & % of wall) South West North East Total windows Perimeter
19,975 ft² / floor 2,350 ft² 850 ft² 2,350 ft² 850 ft² 6,400 ft² 2,350 ft² 100.00 % of south wall 850 ft² 100.00 % of west wall 2,350 ft² 100.00 % of north wall 850 ft² 100.00 % of east wall 6,400 ft² 100.00 % of Gross (Total must be =<40% of gross wall area including plenums) 640 L.F.
7 Ratios Total Glass to Floor area South Glass to Floor area Area by type to Floor area
32.0 % 11.8 % -Multi-family residential = 79.3% (15,840 ft²) -Corridor & Stairs = 20.7 % (3,910 ft²)
8 Insulation: (ASHRAE Standard 90.1, 2007 Table 5.5-2 for Climate Zone 5(A,B,C))
Walls (Exterior): Floor to ceiling glass throughout entire perimeter Walls (Interior): steel studs, 2”X4”, 16” o.c., gypsum boards, no insulation Floor: 8” reinforced concrete slab, carpeted Doors: (interior): R-0.69 (U-value=1.45) Windows: Double Low-e, Alum. w/ Brk, U-value=0.45 all, S.C.=0.21, VT=0.85, frame width=2”,
SHGC=0.40 (all) 9 Shortwave Reflectance:
Roof: Medium Abs=0.7, Walls: Medium Abs=0.6 [All roof surfaces will be modeled with a reflectivity of 0.3 ((ASHRAE 90.1, 2004 Table G3.1, page 172)
10 Infiltration: Perimeter = 0.06 CFM/ft² (external wall area) & Core=0.001 CFM/ft² (floor area) 11 HVAC Type: Four pipe fan coils with HW heat
HVAC Size:
13 fan coil units, autosized, one for each unit plus one for core Electric Centrifugal Hermetic Chiller (<150 tons) with open cooling tower HW Boiler (300-2,500 kBtu)
Efficiency:
Chiller Efficiency is 2.70 COP Boiler Efficiency is 80%
Fan Schedules: 5 pm to 7 am weekdays, 4 pm to 9 am weekend and holidays, operates 1 hr before and after, Fan Mode = continuous, no Fan Night Cycling Economizer:
Drybulb Temperature, High Limit Shutoff=70°F Thermal Zones: Building is divided into 17 thermal (16 units + 1 core) Thermostat: Occupied: Cool=76°F, Heat=68°F -Unoccupied: Cool= Cool=76°F, Heat=68°F i.e. (no setbacks)
12 Lighting Power Density (LPD):
Building Area Type : for “Multi-family” =0.60 W/ft² (no specific area type) 13 Equipment Load: EQuest Default Residential Load Profiles 14 Domestic Water Heating: Central Hot Water Boiler 15 Building Operation: 4 pm to 7 am weekdays, 24 hours weekend and holidays

46
1 Building: Name: House Energy Doctor Office Building Address: 140 W. Broadway Blvd., Tucson, AZ 85701 2 City: Location: Tucson (Lat. 32.22, Long. 110.92, elev. 2,584)
Degree Days: HDD65=1,678 & CDD50=6,921 (ASHRAE Standard 90.1, 2007 Page 131) Utility Rates: Electric= 0.10 $/KWh – Natural Gas= 1.11 $/Therm
3 Climate Zone: “2B” for Pima County (ASHRAE Standard 90.1, 2007 Page 110) TOTALS 4 Orientation South 5 Volume
Conditioned Space 184,140 ft3/floor (84X48- shell2 (24X12)X20
6 Areas Conditioned Floor Area Walls: (include windows, but no plenums) South West North East Total walls Windows: (area & % of wall) South West North East Total windows Perimeter
30,424 ft² / floor 2,680 ft² 1,960 ft² 2,680 ft² 1,960 ft² 7,700 ft² 2,680 ft² (4X(20X5)) 100.00% of south wall 1,960 ft² (2X(24X5)) 100.00 % of west wall 2,680 ft² (80X5+2X(32X5)) 100.00 % of north wall 1,960 ft² (2X(24X5)) 100.00 % of east wall 7,700 ft² 100.00 % of Gross (Total must be =<40% of gross wall area including plenums) 928 L.F.
7 Ratios Total Glass to Floor area South Glass to Floor area Area by type to Floor area
25.3 % 8.1 % -Multi-family residential = 54.2% (16,488 ft²) -Corridor & Stairs = 45.8 % (13,936 ft²)
8 Insulation: (ASHRAE Standard 90.1, 2007 Table 5.5-2 for Climate Zone 2(A,B))
Walls (Exterior): R Floor to ceiling glass throughout entire perimeter Walls (Interior): steel studs, 2”X4”, 16” o.c., gypsum boards, no insulation Floor: 8” reinforced concrete slab, carpeted Doors: (interior): R-0.69 (U-value=1.45) Windows: Double Low-E, Alum. w/ Brk, U-value=0.7 all, S.C.=0.21, VT=0.85, frame width=2”, SHGC=0.25
(all) 9 Shortwave Reflectance:
Roof: Medium Abs=0.7, Walls: Medium Abs=0.6 [All roof surfaces will be modeled with a reflectivity of 0.3 ((ASHRAE 90.1, 2004 Table G3.1, page 172)
10 Infiltration: Perimeter = 0.06 CFM/ft² (external wall area) & Core=0.001 CFM/ft² (floor area) 11 HVAC Type: Four pipe fan coils with HW heat
HVAC Size:
13 fan coil units, autosized, one for each unit plus one for core Electric Centrifugal Hermetic Chiller (x tons) with open cooling tower HW Boiler (x kBtu)
Efficiency:
Chiller Efficiency is 4.200 COP Boiler Efficiency is 80%
Fan Schedules: 5 pm to 7 am weekdays, 4 pm to 9 am weekend and holidays, operates 1 hr before and after, Fan Mode = continuous, no Fan Night Cycling Economizer:
Drybulb Temperature, High Limit Shutoff=75°F Thermal Zones: Building is divided into thermal zones by unit Thermostat: Occupied: Cool=76°F, Heat=68°F -Unoccupied: Cool= Cool=76°F, Heat=68°F i.e. (no setbacks)
12
Lighting Power Density (LPD):
Building Area Type : for “Multi-family” =0.60 W/ft² (no specific area type) 13 Equipment Load: EQuest Default Residential Load Profiles 14 Domestic Water Heating: Natural Gas, Instantaneous, Efficiency of 0.80 15 Building Operation: 4 pm to 7 am weekdays, 24 hours weekend and holidays

47
Design Testing
The second step of the design process is evaluating the merits of the base design using eQuest energy simulation software. A digital model of one floor of each building can be used to compute the performance of the building as well as to evaluate several key energy saving strategies. These strategies can then be used for the development of a complete, refined design. Energy Use Intensity
Figure 42: Chicago tower energy use intensity. Graph by author. In order to validate our model, we can use the department of energy benchmarks for mid-rise residential buildings11 to confirm that the model is operating close to real-world performance standards. In the case of the Chicago Tower (located in Zone 5A) we see a base EUI of 108.29 KBtu/ft2. This is remarkably close digital model’s measured value of 116.27 KBtu/ft2. By using the energy-saving strategies laid out in the next section, this EUI can be reduced all the way to 74.62 KBtu/ft2.
11 “Building Performance Database,” United States Department of Energy, accessed February 14, 2012, < http://www1.eere.energy.gov/buildings/commercial/bpd.html>
48
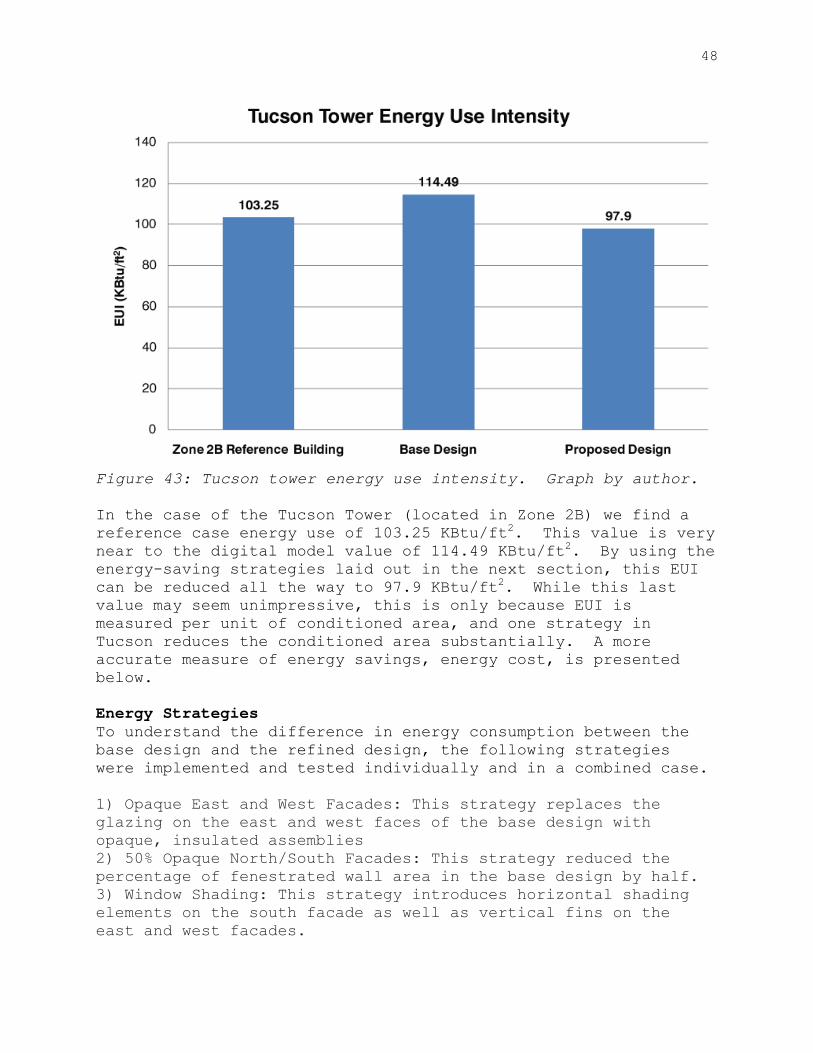
Figure 43: Tucson tower energy use intensity. Graph by author. In the case of the Tucson Tower (located in Zone 2B) we find a reference case energy use of 103.25 KBtu/ft2. This value is very near to the digital model value of 114.49 KBtu/ft2. By using the energy-saving strategies laid out in the next section, this EUI can be reduced all the way to 97.9 KBtu/ft2. While this last value may seem unimpressive, this is only because EUI is measured per unit of conditioned area, and one strategy in Tucson reduces the conditioned area substantially. A more accurate measure of energy savings, energy cost, is presented below. Energy Strategies To understand the difference in energy consumption between the base design and the refined design, the following strategies were implemented and tested individually and in a combined case. 1) Opaque East and West Facades: This strategy replaces the glazing on the east and west faces of the base design with opaque, insulated assemblies 2) 50% Opaque North/South Facades: This strategy reduced the percentage of fenestrated wall area in the base design by half. 3) Window Shading: This strategy introduces horizontal shading elements on the south facade as well as vertical fins on the east and west facades.
49
4) Chiller COP 4.6: This strategy replaces the inefficient chiller in the base building with more efficient model, raising the coefficient of performance from 2.7 to 4.6. 5) Boiler 90% Efficient: This strategy replaces the 80% efficient boiler in the base design with a 90% efficient boiler. 6) Thermostat Setbacks: This strategy increases the temperature to which the building is cooled during unoccupied periods from 74 to 80 degrees. Likewise, it decreases the temperature to which the building is heated during unoccupied periods from 74 to 80 degrees. 7) Daylighting: This strategy introduces daylight sensors at 50% of zone depth, 2.5 feet above floor level operating in an on/off configuration. 8) Unconditioned Atrium (Tucson Tower Only): This strategy replaces the conditioned atria in the base design with an unconditioned, open-air atria. Energy Cost Analysis
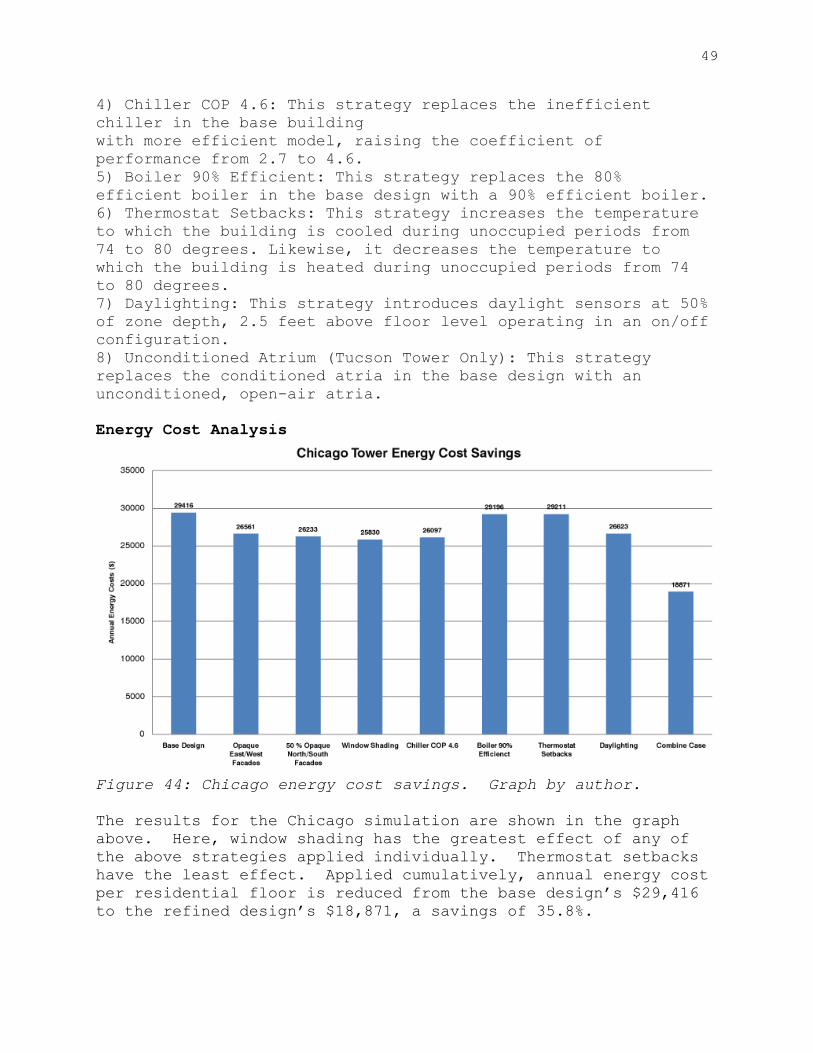
Figure 44: Chicago energy cost savings. Graph by author. The results for the Chicago simulation are shown in the graph above. Here, window shading has the greatest effect of any of the above strategies applied individually. Thermostat setbacks have the least effect. Applied cumulatively, annual energy cost per residential floor is reduced from the base design’s $29,416 to the refined design’s $18,871, a savings of 35.8%.

50
Figure 45: Tucson energy cost savings. Graph by author. The results of the Tucson simulation are shown in the graph above. Here, making the north and south facades 50% opaque has the greatest effect of any strategy. Installing a 90% efficient boiler has the least effect. Applied cumulatively, annual energy cost per residential floor is reduced from the base design’s $34,170 to the refined design’s $15,875, a savings of 53.5%.
Figure 46: Percentage energy cost savings by strategy in Chicago and Tucson. Graph by author.

51
The above graph compares the percentage savings per strategy for each city. It is worth noting that, with the exception of boiler efficiency and thermostat setbacks, all strategies implemented are more effective in Tucson than in Chicago. The thermostat setback and boiler efficiency strategies were not terribly effective in either city. As only Tucson had an atrium, the unconditioned atrium strategy does not apply to Chicago. Refined Design Using the testing done in the previous section, it is possible to make design recommendations for refining the base design to accommodate the necessary energy-saving strategies. The following plans, sections, and renderings document this refined design. Plans
Figure 47: Chicago tower typical hotel plan. Drawing by author. The Chicago hotel plan features 24 rooms aligned along a central, double-loaded corridor. Where internal circulation core render the floor plate more narrow, smaller rooms are introduced to compensate. This gives the plan with an equal number of double-double and king room types.

52
Figure 48: Chicago tower typical residential plan. Drawing by author. The Chicago residential plan is the plan used for energy simulation in the previous section. The plan features two studios, four one-bedrooms, four two-bedrooms, and two three-bedrooms. Wet areas group near the service cores and centrally loaded corridor freeing the exterior of the building to provide views and lighting to the living spaces.
Figure 49: Tucson tower typical hotel plan. Drawing by author.

53
The Tucson hotel plan arranges rooms around a large void, offering each access to the natural-ventilation atrium at plan’s center. There are, as in the Chicago plan, 24 rooms. Here, due to the presence of the atrium, the corridors are single-loaded. There is one service core at the center with the other two pulled to the extremes of the building.
Figure 50: Tucson tower typical residential plans. Drawing by author. The residential plan of the Tucson tower (again, the plan that was used for testing with eQuest), is also arrayed around two central stack-effect atria. The unit numbers are identical to the Chicago plan, but they are arranged quite differently to allow air flow through the central void. As with the hotel, corridors are single-loaded.

54
Sections
Figure 51: Chicago tower transverse and wall sections. Drawings by author. In the above section of the Chicago tower, the previously mentioned winter gardens are clearly visible. Also visible is how the tower sits upon its parking plinth. Note that the vertical structural elements (i.e. the columns and cores) are continuous throughout the length of the tower. In the wall section, hanging insulated panels can be seen, as can the interaction of the façade and structural elements behind.

55
Figure 52: Tucson tower transverse and wall sections. Drawings by author. In the Tucson tower section, the central atrium is clearly evident. The arrow included notes the passage of air, through the cooling foliage of the sky gardens, drawn up by the stack effect, and finally through and out of the occupied units. As with the Chicago tower, vertical structural elements are continuous. In the wall section, the high-mass, load bearing exterior wall assembly can be seen.

56
Exterior Renderings
Figure 53: Chicago tower exterior renderings. Images by author. In the above rendering, the final resolution of the massing model is made clear. The four winter gardens are clearly visible, as is the 50% opaque panelized façade.
Figure 54: Tucson tower exterior renderings. Images by author.

57
The above rendering shows the Tucson tower on its site. Noteworthy in these images are the light color, relatively opaque facades, and high-mass appearance of the envelopes. The sky gardens are also visible. Interior Renderings
Figure 55: Chicago tower interior rendering. Image by author. The above image shows an interior living space in the Chicago tower looking south. Through the glass, the horizontal fixed shading devices are visible. While the façade is 50% opaque, natural light and views are still abundant. The interior concrete is left unfinished to maximize its high-mass properties.

58
Figure 56: Tucson tower interior rendering. Image by author. The above image shows an interior living space in the Tucson tower. As with the Chicago tower, the opacity of the façade does not come at the expense of views or natural light. The exposed concrete is clearly visible, as is the high-mass construction of the envelope.

59
CONCLUSION
In the world of the modern mixed-use high rise, the “glass box” model of design and construction has reigned supreme since the middle of the 20th century. This model has been exported around the world with little regard for site responsiveness, generating a high rise building stock that is sorely lacking a sense of place. Many modern high-rises would be just as at home in Chicago, Shanghai, or Dubai. This shortcoming has also had adverse effects on the environmental performance of tall buildings. By inadequately addressing the thermal issues associated with regional building design, many tall, mixed-use buildings contribute to climate change through a wasteful approach to energy. Through the use of the host of tools explored herein (e.g. social observation, energy simulation), it has been possible to explore some of the facets of design that drive location-responsiveness in architecture. Through study of the existing building stock, it has become possible to make recommendations for how a design would differ in two cities. It is was then a natural progression to test the idea of design within these parameters. In doing so, this document has sought to make an argument for more location-responsive design in the mixed-use high-rise typology. By abandoning the one-size-fits-all approach so common to mixed-use high-rise design, architects can not only make buildings that perform to the specifications of their site, but also create a more relative and meaningful architecture grounded in a sense of place. These high-performance, highly site-responsive buildings will improve the stock of mixed-use high-rises greatly.

60
WORKS CITED
Ali, Mir M. “Evolution of Concrete Skyscrapers: from Ingalls to Jin mao.” Electronic Journal of Structural Engineering 1 (2001): 2-14. American Society of Heating, Refrigerating and Air-Conditioning Engineers. ASHRAE Handbook. Fundamentals. Atlanta, Ga: American Society of Heating, Refrigerating, and Air-Conditioning Engineers, 2009. American Society of Heating, Refrigerating and Air-Conditioning Engineers. ASHRAE Standard 90.1. Atlanta, Ga: American Society of Heating, Refrigerating, and Air-Conditioning Engineers, 2010. Arens, Edward. Natural Ventilative Cooling of Buildings. Department of the Navy: Alexandria, VA, 1986. Cement and Concrete Association of Australia. Guide to Long Span Concrete Floors. St Leonards, NSW: Cement and Concrete Association of Australia, 2003. Council on Tall Buildings and Urban Habitats. “The Skyscraper Center.” Accessed October 10, 2011. < http://skyscrapercenter.com/index.php> Packard, Robert T., ed. Architectural Graphic Standards: Seventh Edition. New York: John Wiley and Sons, 1981. St. Clair, Peter. The Climate of Tall Buldings: An investigation of building height in bio-climatic design. Self published, 2010. < http://www.peterstclair.com/pdf/The-Climate-of-Tall-Buildings-Science-Review_LR.pdf> Taranath, Bungale S. Reinforced Concrete Design of Tall Buildings. Boca Raton: CRC Press, 2010. <http://www.crcnetbase.com/isbn/978-1-4398-0480-3>. United States Department of Energy. “Building Performance Database.” Accessed February 14, 2012. < http://www1.eere.energy.gov/buildings/commercial/bpd.html>