localized foundering of indian lower crust in the india
TRANSCRIPT

Localized foundering of Indian lower crust in theIndia–Tibet collision zoneDanian Shia,1, Simon L. Klempererb,1, Jianyu Shia,c, Zhenhan Wua, and Wenjin Zhaoa
aChinese Academy of Geological Sciences, 100037 Beijing, China; bDepartment of Geophysics, Stanford University, Stanford, CA 94305-2215; and cNationalMarine Environmental Forecasting Center, 100081 Beijing, China
Edited by Barbara A. Romanowicz, University of California, Berkeley, CA, and approved August 27, 2020 (received for review January 1, 2020)
The deep structure of the continental collision between India andAsia and whether India’s lower crust is underplated beneath Tibetor subducted into the mantle remain controversial. It is also un-known whether the active normal faults that facilitate orogen-parallel extension of Tibetan upper crust continue into the lowercrust and upper mantle. Our receiver-function images collectedparallel to the India–Tibet collision zone show the 20-km-thick In-dian lower crust that underplates Tibet at 88.5–92°E beneath theYarlung-Zangbo suture is essentially absent in the vicinity of theCona-Sangri and Pumqu-Xainza grabens, demonstrating a clearlink between upper-crustal and lower-crustal thinning. Satellitegravity data that covary with the thickness of Indian lower crustare consistent with the lower crust being only ∼30% eclogitized sogravitationally stable. Deep earthquakes coincidewithMoho offsetsand with lateral thinning of the Indian lower crust near the bottomof the partially eclogitized Indian lower crust, suggesting the Indianlower crust is locally foundering or stoping into the mantle. Loss ofIndian lower crust by these means implies gravitational instabilitythat can result from localized rapid eclogitization enabled by dehy-dration reactions in weakly hydrous mafic granulites or by volatile-rich asthenospheric upwelling directly beneath the two grabens. Wepropose that two competing processes, plateau formation by under-plating and continental loss by foundering or stoping, are simulta-neously operating beneath the collision zone.
Tibetan plateau | continental collision zone | Indian lithosphere | receiverfunctions | crustal thinning
Knowledge of the structure of the Himalayan collision zone isthe key for understanding all geological processes––geodynamics,
tectonics, magmatism, metallogeny––occurring during continentalcollision. However, the lack of constraints on the geometry andextent of the Indian plate beneath the Tibetan plateau has fueledspeculation whether the Tibetan plateau was built by underthrustingof Indian crust beneath the entire plateau (1), by discrete subductionevents between coherent lithospheric blocks (2), or by homogeneousthickening of the lithosphere of the entire plateau (3) and wide-spread viscous flow in the crust (4). Knowledge of the collision zonehas been improved by seismic studies in the past two decades (5–11),which suggest that Indian lower crust attached to lithospheric mantlehas underplated to ∼31°N (7), that a west–east transition fromunderplating to steep subduction of the Indian plate has occurred inthe central–eastern collision zone (9, 10), and that a large portion ofthe Indian crust has been transferred from the lower plate to theupper plate via crustal-scale duplexing (11). However, the amount ofunderplating (∼400 km from the Main Frontal Thrust to ∼31°N(Fig. 1 and ref. 7) and crustal-scale duplexing accounts for only∼50 ± 17% of the Indian crust underthrust beneath southern Tibetsince onset of the India–Asia collision (12). The fate of the Indiancrust (especially the lower crust) beneath southern Tibet during ∼57My since collision remains largely speculative.
Receiver Function Imaging of the Himalaya–Tibet CollisionZoneSince summer 2011 we have deployed 411 seismic stations insouthern Tibet, equipped with either Guralp 3ESPCD or Guralp
3TD broadband seismometers. Most of them operated for ∼12mo. These stations fill the gaps between the Himalayan-TibetanContinental Lithosphere During Mountain Building (Hi-CLIMB)(7), Himalayan Nepal Tibet Seismic Experiment (6), InternationalDeep Profiling of Tibet and the Himalaya (5), and Namche Barwa(8) passive seismic experiments, and provide much improvedcoverage for the India–Tibet collision zone (Fig. 1).Here we present results from two high-resolution receiver-
function (RF) profiles (Figs. 2 and 3) paralleling the India–Tibetcollision zone, constructed with data we recorded from 2015 to2019 on two densely spaced 800- and 600-km-long linear arrays.These arrays extend east–west from the eastern Himalayan syn-taxis to the Tangra-Yumco graben (TYG) in the central-westernGangdese belt, with Profile B along the Yarlung Zangbo suture(YZS) and Profile A located ∼75 km north (Fig. 1).Previous RF profiles south to north across the collision zone
identified an RF “doublet” interpreted as representing the topand bottom (Moho) of Indian lower crust (5–10, 16), allowing usto tie our observations to the previous interpretations (Fig. 3 andSI Appendix, Fig. S1A). The (Indian) crust–mantle boundary (orMoho), is the deepest prominent positive conversion and is seenalong most of both profiles (“m” in Figs. 2 and 3). The Mohoconverter is at 65–70-km depth at the west end of Profile B(Fig. 3) as previously determined along the Hi-CLIMB profile at∼85°E (7, 17), then deepens dramatically to ∼90 km––the largestdepth in the study region––at 87.5°E. The Moho conversion isabsent immediately west of the Pumqu-Xainza graben (PXG),
Significance
Although plate tectonics explains subduction of oceanic crust,the areally distributed deformation observed in continentalcollision requires more complex explanations of the geometricinteraction of two colliding continents and the mechanics ofplateau formation. Our seismic images reveal variations of theIndia–Tibet collision parallel to the Himalaya. Our observationof localized thinning of Indian lower crust, that is sufficientlyextreme as to require material loss presumably into the un-derlying mantle, is an advance in explaining the apparent lackof mass balance in the India–Asia collision that requires loss ofcontinental material. These zones of lower-crustal thinning andlikely foundering represent slab segmentation (slab tears)that can geometrically accommodate the curvature of theHimalayan arc.
Author contributions: D.S., S.L.K., Z.W., and W.Z. designed research; D.S., S.L.K., and J.S.performed research; D.S. and J.S. contributed new reagents/analytic tools; D.S., S.L.K., andJ.S. analyzed data; and D.S. and S.L.K. wrote the paper.
The authors declare no competing interest.
This article is a PNAS Direct Submission.
Published under the PNAS license.1To whom correspondence may be addressed. Email: [email protected] or [email protected].
This article contains supporting information online at https://www.pnas.org/lookup/suppl/doi:10.1073/pnas.2000015117/-/DCSupplemental.
First published September 21, 2020.
24742–24747 | PNAS | October 6, 2020 | vol. 117 | no. 40 www.pnas.org/cgi/doi/10.1073/pnas.2000015117
Dow
nloa
ded
by g
uest
on
Feb
ruar
y 6,
202
2

whether due to difficulty in imaging a steep structure or due tothe lack of a seismic impedance contrast, and reappears at <65-kmdepth just 30 km further east. From the PXG east to the Cona-Sangri graben (CSG) the Moho on Profile B is subhorizontal at∼75 km depth for ∼280 km between ∼89° and ∼91.5°E. A secondMoho disruption occurs beneath the CSG (see ref. 10), then theMoho shallows gently to only ∼55 km in the vicinity of the easternHimalayan syntaxis at the east end of Profile B. Profile A showsthe same two zones of Moho disruption as Profile B, less clearlybeneath the PXG where data coverage is incomplete, but moreobvious at 91.5–92°E where the Moho conversion is locally absent(see ref. 10), ∼50 km west of the northern mapped extent of theCSG (18). On Profile A the two zones of Moho disruption bounda subhorizontal section of Moho, just as on Profile B, that on A isnarrower (spans only ∼220 km from west to east) and a few ki-lometers deeper (implying ∼5° northward dip).The top of the RF doublet, normally interpreted as the top of
(Indian) lower crust (ILC) (5–10, 16), is the prominent positiveconversion lying above the Moho. It is well-observed along bothof our profiles (marked “d” in Figs. 2 and 3) especially where thedoublet reaches ∼20-km thickness from ∼89–91.5°E in the regionwhere it was first identified (5). Immediately west and east on
Profile B, two depressions in the top-ILC converter are obvious,of up to 5 km west of PXG and of up to 10 km beneath CSG. Inthese regions and at the western and eastern limits of our profilesthe top-ILC converter is arguably too thin to be resolved fromtheMoho as a separate converter, and our data are easily modeledby a single converter (SI Appendix, Fig. S2C). At the largest scalefrom west to east the top ILC appears to mirror the Moho(i.e., deeper [shallower] when the Moho is shallower [deeper]),although locally, where best observed from ∼91.5–89°E, it is clearthat the top and bottom of the doublet both dip north, bothdeepening ∼5 km from beneath Profile B to beneath Profile A.Common conversion-point (CCP) images of the P-RF multi-
ple phases, and of the S-RFs (SI Appendix, Fig. S1 C and D),corroborate our interpretations of the simple P CCP imagesshown in Figs. 2 and 3.
Gravity Characteristics of the Indian Lower Crust in theCollision ZonePrevious work not only identified the doublet layer between “d”and “m,” but also showed that portions of the ILC >300–350 kmnorth of the Main Frontal Thrust (MFT), somewhat north of theYZS, have density and wavespeed characteristic of partially
o84 o86 o88 o90 o92 o94 o96
o26
o28
o30
o32
AAB
B
Qiangtang Terrane
YZS
MFT
BNS
Lhasa Terrane
Naqu
YGG
PXG
TYG JF
Tethyan Himalaya
Kathmandu
CSG
Thimphu
T9
T12
T8
T3T5
S8
T11
T10
oooooo949494949499999994999999999999 oooooooooooooo96969996969696969696999696999999
oooooooooooooo32323233333323232323232332322
Tibet
India
Fig. 1. Topographic map of southern Tibet showing location of seismometers. Yellow-filled diamonds were used to construct RF Profiles A and B in Figs. 2and 3, and blue diamonds mark our Gangdese seismic stations deployed from 2011 to 2019 (9, 10). Black diamonds indicate other seismic stations (5–8, 13).Dotted cyan line: northern limit of underthrust ILC (mantle suture) (7, 8, 10). Cyan rectangles: locations of maximum thinning of ILC on Profile B, and likelycorrelative points on Profile A as interpreted on Fig. 3. Dashed red lines: Yarlung-Zangbo (YZS) and Banggong-Nujiang (BNS) sutures. Solid red lines: MFT,dextral Jiali fault (JF), and normal faults in the Tangra-Yumco (TYG), Pumqu-Xainza (PXG), Yadong-Gulu (YGG), and Cona-Sangri (CSG) grabens (14). Cyanquadrant circles: focal mechanisms of earthquakes with epicentral depths ≥50 km (SI Appendix, Fig. S4) verified by waveform modeling (15). (Inset) Mapshows full extent of the Tibetan plateau.
Shi et al. PNAS | October 6, 2020 | vol. 117 | no. 40 | 24743
EART
H,A
TMOSP
HER
IC,
ANDPL
ANET
ARY
SCIENCE
S
Dow
nloa
ded
by g
uest
on
Feb
ruar
y 6,
202
2

eclogitized mafic crust (7, 16, 17). We next use satellite gravityobservations (SI Appendix, Fig. S3) to test this hypothesis. Inopposition to simple expectations of lower gravity over thickercrust, the relative gravity anomaly reaches +50 mGal (+70 mGalon Profile B) from ∼89–91.5°E where the Moho is significantlydeeper than adjacent areas (Fig. 3, black line; SI Appendix, Fig.S3D). Simple modeling with a range of densities finds acceptablefits if the doublet layer has a density ∼3,000–3,100 kg/m3 (Fig. 3;rms misfit ∼24 mGal, SI Appendix, Table S2), clearly higher thanthe density of granulitic rocks (2,850 kg/m3, rms misfit = 34 mGal),but lower than the density of the mantle (3,300 kg/m3, rms misfit =34 mGal), or mafic eclogite (3,450 kg/m3) (values taken from ref.16). The average density of the ILC along Profiles A and B thusmatches mafic granulites with ∼30% eclogitization (6), or meta-stable gabbro (16, 19, 20). We stress that we have modeled thegravity anomaly from a smooth interpretation of the RF image
using constant density contrasts at the top and bottom of the ICL.Because our focus is our seismic data we prefer to show an ac-ceptable gravity fit from a simple model rather than a perfect fitfrom a very complex model. Our modeling approach and resultagrees with previous models (16) that permit gravitationally stablebut chemically metastable mafic ILC beneath Profiles A and B,incompletely eclogitized but with the potential to rapidly chemi-cally equilibrate leading to gravitational instability.
Localized Foundering of the ILCSouthern Tibet stands out globally for its unusual lower-crustaland upper-mantle earthquakes (15, 21, 22) (Figs. 1 and 2 and SIAppendix, Fig. S4). These earthquakes require a strong litho-spheric mantle (15, 21) capable of brittle failure, and may beassociated with eclogitization of the lower crust (23). When weproject earthquakes with depths well-determined by waveform
o84 o86 o88 o90 o92 o94 o96
o26
o28
o30
o32
AAB
B
Qiangtang Terrane
YZS
MFT
BNS
Lhasa Terrane
Naqu
YGG
PXG
TYG JF
CSG
Thimphu
C0
50
100 25 60 90 120 150 210 265 300 330
0
50
100
25 60 90 120 150 210 245 300 330
30 60 90 120 150 180 210 320 345
Dep
th( k
m)
0
50
100
Back azimuth(Deg.)
d
m
dm
YS91
YS78
LM47
De p
th(k
m)
Dep
th( k
m)
??
YZSYS91
YS78
YZS
PXG
LM47
d
d
m
mm
md
Dep
th(k
m)
Ao
85 YGGPXGTYG
YGGPXGTYG СSGB
120
60
0
120
60
0
dm
East
LM47
YS91 YS78
−0.10−0.05
0.000.050.10
Amplitude
o86
o87
o88
o89
o90
o9 1
o92
o9 3
o9 4
o95
T3 T5
−500 −400 −300 −200 −100 0 100 200 300 400 km
T3 T5
T7
T8
T10 T11
T12S8
Fig. 2. RF images with no vertical exaggeration, showing the principal contrasts within the entire crust and uppermost mantle along Profiles A and B. Redand blue colors represent interfaces with increasing and decreasing impedance with depth, respectively. The “d” indicates the doublet conversion, or theconversion from the top of the ILC (5–8). The “m” denotes the conversion from the Indian crust–mantle boundary (or Moho). Focal mechanisms from28.5–30.5°N (15) in A and B are projected onto the profiles along the strike of nearby grabens (SI Appendix, Table S3). Depths are referred to sea level. Thingray lines at 65-km depth are for reference. Representative RFs (stacked every 5° of back-azimuth with time transformed to depth) are shown in C. Note thatthe Moho has eluded imaging beneath the station YS91 for some northern azimuthal arrivals (where marked “?”), suggesting the thinning of the ILC mayhave also occurred on the northern side of the station. (Lower Right) Small blue and green crosses show the piercing points at 65-km depth of all RFs used inProfiles A and B, respectively. (Inset) Maps show the corresponding piercing points for the three representative stations (YS91, YS78, and LM47) identified in Aand B and shown in C.
24744 | www.pnas.org/cgi/doi/10.1073/pnas.2000015117 Shi et al.
Dow
nloa
ded
by g
uest
on
Feb
ruar
y 6,
202
2
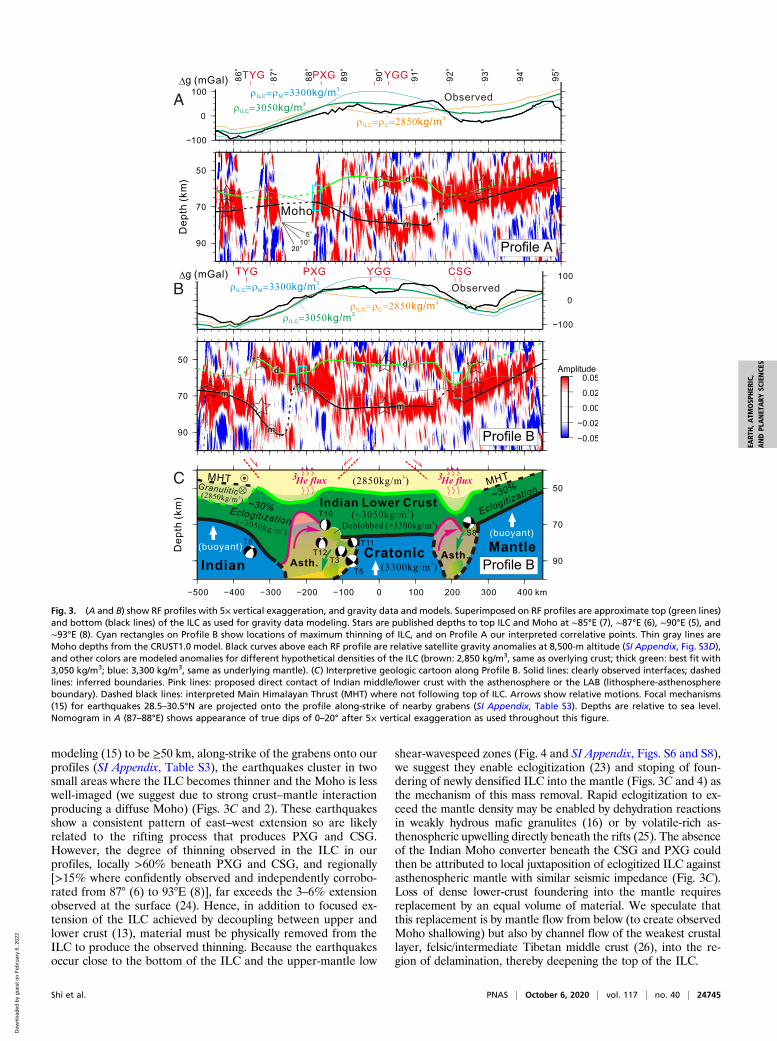
modeling (15) to be ≥50 km, along-strike of the grabens onto ourprofiles (SI Appendix, Table S3), the earthquakes cluster in twosmall areas where the ILC becomes thinner and the Moho is lesswell-imaged (we suggest due to strong crust–mantle interactionproducing a diffuse Moho) (Figs. 3C and 2). These earthquakesshow a consistent pattern of east–west extension so are likelyrelated to the rifting process that produces PXG and CSG.However, the degree of thinning observed in the ILC in ourprofiles, locally >60% beneath PXG and CSG, and regionally[>15% where confidently observed and independently corrobo-rated from 87° (6) to 93°E (8)], far exceeds the 3–6% extensionobserved at the surface (24). Hence, in addition to focused ex-tension of the ILC achieved by decoupling between upper andlower crust (13), material must be physically removed from theILC to produce the observed thinning. Because the earthquakesoccur close to the bottom of the ILC and the upper-mantle low
shear-wavespeed zones (Fig. 4 and SI Appendix, Figs. S6 and S8),we suggest they enable eclogitization (23) and stoping of foun-dering of newly densified ILC into the mantle (Figs. 3C and 4) asthe mechanism of this mass removal. Rapid eclogitization to ex-ceed the mantle density may be enabled by dehydration reactionsin weakly hydrous mafic granulites (16) or by volatile-rich as-thenospheric upwelling directly beneath the rifts (25). The absenceof the Indian Moho converter beneath the CSG and PXG couldthen be attributed to local juxtaposition of eclogitized ILC againstasthenospheric mantle with similar seismic impedance (Fig. 3C).Loss of dense lower-crust foundering into the mantle requiresreplacement by an equal volume of material. We speculate thatthis replacement is by mantle flow from below (to create observedMoho shallowing) but also by channel flow of the weakest crustallayer, felsic/intermediate Tibetan middle crust (26), into the re-gion of delamination, thereby deepening the top of the ILC.
C
A
B
Fig. 3. (A and B) show RF profiles with 5× vertical exaggeration, and gravity data and models. Superimposed on RF profiles are approximate top (green lines)and bottom (black lines) of the ILC as used for gravity data modeling. Stars are published depths to top ILC and Moho at ∼85°E (7), ∼87°E (6), ∼90°E (5), and∼93°E (8). Cyan rectangles on Profile B show locations of maximum thinning of ILC, and on Profile A our interpreted correlative points. Thin gray lines areMoho depths from the CRUST1.0 model. Black curves above each RF profile are relative satellite gravity anomalies at 8,500-m altitude (SI Appendix, Fig. S3D),and other colors are modeled anomalies for different hypothetical densities of the ILC (brown: 2,850 kg/m3, same as overlying crust; thick green: best fit with3,050 kg/m3; blue: 3,300 kg/m3, same as underlying mantle). (C) Interpretive geologic cartoon along Profile B. Solid lines: clearly observed interfaces; dashedlines: inferred boundaries. Pink lines: proposed direct contact of Indian middle/lower crust with the asthenosphere or the LAB (lithosphere-asthenosphereboundary). Dashed black lines: interpreted Main Himalayan Thrust (MHT) where not following top of ILC. Arrows show relative motions. Focal mechanisms(15) for earthquakes 28.5–30.5°N are projected onto the profile along-strike of nearby grabens (SI Appendix, Table S3). Depths are relative to sea level.Nomogram in A (87–88°E) shows appearance of true dips of 0–20° after 5× vertical exaggeration as used throughout this figure.
Shi et al. PNAS | October 6, 2020 | vol. 117 | no. 40 | 24745
EART
H,A
TMOSP
HER
IC,
ANDPL
ANET
ARY
SCIENCE
S
Dow
nloa
ded
by g
uest
on
Feb
ruar
y 6,
202
2

Localized foundering of Indian lower crust into upwelling as-thenospheric mantle beneath the CSG and the PXG is consistentwith the observation in these rifts of primordial mantle 3He in thermalsprings that is a signature of incipiently melting (i.e., asthenospheric)mantle directly beneath the crust (27, 28). Adjoint-tomographic im-ages suggest lithospheric foundering of high-wavespeed upper-mantle“blobs” as small as ∼300 km across, north of the YZS at 88° and 92°(29), but lack the resolution to show smaller features. Our own travel-time tomographic models show ∼100-km length-scale high-velocitybodies beneath the two grabens (Fig. 4 and SI Appendix, Figs. S6and S8) provide additional support for localized foundering of theunderthrusting Indian continental lithosphere.The inefficient conversion at the top of ILC beneath the YZS
near the west ends of our profiles (Figs. 2 and 3 and refs. 7, 17)lies directly above low-wavespeed anomalies in the upper mantle(Fig. 4 and SI Appendix, Figs. S6 and S8 and ref. 30), therefore islikely causally linked to in situ high mantle temperature, whichmay have suppressed eclogitization (19) in the ILC and therebydecreased the seismic impedance contrast at its top boundary.
Non-coaxial Rifting Deformation in Southern TibetDelamination of the lower lithosphere (25) and channel flow inthe middle crust (13) have both been linked to west–east ex-tension of Tibet manifested at the surface by the NNE-trendingextensional grabens in southern Tibet. Our two regions of steeplydipping and disrupted Moho along Profile B are broadly beneaththe CSG and PXG (Fig. 1) but because the widths of disruptionare comparable with the rift spacing in southern Tibet and be-cause we see no evidence of disruption beneath the Yadong-Gulu graben (YGG) or TYG (Fig. 3) we have insufficient datato prove a direct link between surface faulting and Moho faulting(13). Nonetheless the two foci of crustal thinning on Profile Bare so close to the CSG and PXG that we speculate their originsare linked. Tearing of subducting Indian mantle lithosphere (31)along inherited Indian basement faults (32) could focus lower-
crustal delamination or foundering (25) thereby weakening thecrust and focusing surface extension (Fig. 4). The existence of adecoupling midcrustal channel means that surface extension isnot required to be vertically above the foundering lower crust (13).Such non-coaxial rifting can explain both the presence of Mohodisruption at ∼91.5°E on Profile A ∼50 km west of the CSG (10),and the absence of Moho disruption beneath the YGG on eitherprofile. We note that the lateral extent of regions of shallowMohoand thinned ILC are broader west-to-east on Profile A than on oursouthern Profile B. Tomographic images suggest this may be asso-ciated with processes at the northern limit of the ILC at the Moho,where the ILC likely subducts (7, 9, 10) rather than underthrustsTibetan crust, allowing Tibetan (noncratonic) mantle at the Mohoto infiltrate above ILC (Fig. 4 and SI Appendix, Figs. S6 and S8).Our results suggest that two competing processes, under-
plating and localized foundering, are operating simultaneously inthe collision zone, with the former maintaining or increasing crustalthickness and the latter reducing crustal thickness. The thicknessand northern limit of ILC underplating southern Tibet is the netresult of these opposing processes. The zones of lower-crustalfoundering represent slab segmentation (slab tears) that can geo-metrically accommodate the curvature of the Himalayan arc.
Materials and MethodsWe focus our images on lower-crustal and upper-mantle structures (Fig. 3).We obtained the images using 12974 P-wave RFs derived from 168 seismicstations (yellow-filled diamonds in Fig. 1) and the CCP stacking method. TheRFs were calculated with the time-domain iterative deconvolution technique(33), in which the Gaussian filter factor was set to 1.5 to mitigate high-frequency conversions from the upper crust and retain signal from the lowercrust and upper mantle. All of the RFs were migrated from time to depth bytracing the rays from the location of each seismic station through a layeredreference model (SI Appendix, Table S1). No lateral or vertical smoothing wasapplied to the images, to best image east–west variability. We also used tele-seismic travel-time tomography to study upper-mantle processes associatedwith the localized foundering of ILC (Fig. 4 and SI Appendix, Figs. S5–S9). Intotal, 21,731 S-wave (S, sS, ScS, SKS, and SKKS) arrival times from 1,128
27˚28˚ 29˚2222222222222222222222222222222229˚
30˚31˚
32˚33˚
3333333333333333333333333333333333333330˚33333333333331˚
333333333333333333332˚30.1
0.05
0.05
-0.05
300
100
200
INDIA
Indian Upper Crust
MHT
Crust
Partially Eclogitized IndianLower
86˚
88˚
90˚
92˚
94˚India
PartPar
27˚22222222222222222222222222222222222222222222222222222222222888888888888888888˚
86˚
88˚
90˚
92˚
Indian Lower Crust
LAB (Zhao et al.,2011)
Tibetan Crust
29˚
Indian Lower Crustst
201111)111
Tibetan Crust
0.1
an Upper Crust
MHT
Crustt
ially Eclogitized Indian
ially Eclogitized IndiaLower
555
5505550550505050500
22222229˚
MFT
YZS
MHT
(Schulte-Pelkum
et al.,2005)
(Nábělek et al.,2009)
PXG
PXG
CSG
YGG
TYGo‘31 N’ boundary
?
(Ren &
Shen,2008)
Indian Mantle
Foundering
Asth.
upwelling
FounderingIndian Mantle
(poor data coverage)
INDIA
Downwelling
ASIA
S
E N
W
δVs (km/s)
He flux3
He flux3
He flux3
He flux3
Fig. 4. Interpretive cartoon (with exaggerated topography) of processes currently operating in the India–Tibet collision zone. Beneath the Moho we showmantle S-wave velocity structure from our teleseismic tomography (SI Appendix, Figs. S6 and S8). ILC is simultaneously underplating and foundering beneaththe CSG and PXG grabens, and foundering then subducting at the northern end of the collision zone. West–east cuts in the three-dimensional block modelare along our Profiles A and B. South–north cut along 85°E from ref. 7. Arrows are inferred directions of lithospheric foundering (dark blue) and as-thenospheric upwelling (purple) in the upper mantle.
24746 | www.pnas.org/cgi/doi/10.1073/pnas.2000015117 Shi et al.
Dow
nloa
ded
by g
uest
on
Feb
ruar
y 6,
202
2

earthquakes and 725 seismic stations were used to invert the upper-mantleS-wave velocity structure. More details are given in SI Appendix, Text.
Data Availability. All RF and travel-time data used in this study are available(34) (https://purl.stanford.edu/jz904sc7304).
ACKNOWLEDGMENTS. This study is supported by the China National NaturalScience Foundation Grants (41674099 and 41374109), the Chinese GeologicalSurvey Grants (1212011220903 and 1212011120185), and the US NSF Grant(EAR1628282). We thank Jim Mechie for sharing his ideas and Eric Sandvoland two anonymous reviewers for comments that have greatly improved themanuscript.
1. E. Argand, La tectonique de l’Asie. Int. Geol. Congr. Rep. Sess. 13, 170–372 (1924).2. P. Tapponnier et al., Oblique stepwise rise and growth of the Tibet plateau. Science
294, 1671–1677 (2001).3. P. England, G. Houseman, Extension during continental convergence, with applica-
tion to the Tibetan Plateau. J. Geophys. Res. 94, 17561–17579 (1989).4. M. K. Clark, L. H. Royden, Topographic ooze: Building the eastern margin of Tibet by
lower crustal flow. Geology 28, 703–706 (2000).5. R. Kind et al., Seismic images of crust and upper mantle beneath Tibet: Evidence for
Eurasian plate subduction. Science 298, 1219–1221 (2002).6. V. Schulte-Pelkum et al., Imaging the Indian subcontinent beneath the Himalaya.
Nature 435, 1222–1225 (2005).7. J. Nábelek et al.; Hi-CLIMB Team, Underplating in the Himalaya-Tibet collision zone
revealed by the Hi-CLIMB experiment. Science 325, 1371–1374 (2009).8. B. Zurek, “The evolution and modification of continental lithosphere, dynamics of
‘indentor corners’ and imaging the lithosphere across the eastern syntaxis of Tibet,”Ph.D. thesis, Lehigh University, Bethlehem, PA (2008), p. 259, ProQuest Dissertations &Theses Global 304564606. https://search.proquest.com/docview/304564606. Accessed8 September 2020.
9. D. Shi et al., Receiver function imaging of crustal suture, steep subduction, andmantle wedge in the eastern India-Tibet continental collision zone. Earth Planet. Sci.Lett. 414, 6–15 (2015).
10. D. Shi et al., West-east transition from underplating to steep subduction in the India-Tibet collision zone revealed by receiver-function profiles. Earth Planet. Sci. Lett. 452,171–177 (2016).
11. R. Gao et al., Crustal-scale duplexing beneath the Yarlung Zangbo suture in thewestern Himalaya. Nat. Geosci. 9, 555–560 (2016).
12. M. Ingalls, D. B. Rowley, B. Currie, A. S. Colman, Large-scale subduction of continentalcrust implied by India–Asia mass-balance calculation. Nat. Geosci. 9, 848–853 (2016).
13. X. Tian et al., Weakly coupled lithospheric extension in southern Tibet. Earth Planet.Sci. Lett. 430, 171–177 (2015).
14. M. H. Taylor, A. Yin, Active structures of the Himalayan-Tibetan orogen and theirrelationships to earthquakes, contemporary strain field, and Cenozoic volcanism.Geosphere 5, 199–214 (2009).
15. W. P. Chen, Z. Yang, Earthquakes beneath the Himalayas and Tibet: Evidence forstrong lithospheric mantle. Science 304, 1949–1952 (2004).
16. G. Hetényi et al., Density distribution of the India plate beneath the Tibetan plateau:Geophysical and petrological constraints on the kinetics of lower-crustal eclogitiza-tion. Earth Planet. Sci. Lett. 264, 226–244 (2007).
17. G. Wittlinger, V. Farra, G. Hetényi, J. Vergne, J. Náb�elek, Seismic velocities in southernTibet lower crust: A receiver function approach for eclogite detection. Geophys. J. Int.177, 1037–1049 (2009).
18. Y. Wang et al., Differential crustal deformation across the Cona-Oiga rift, southernTibetan Plateau. J. Asian Earth Sci. 177, 177–185 (2019).
19. A. E. Ringwood, D. H. Green, An experimental investigation of the gabbro-eclogitetransformation and some geophysical implications. Tectonophysics 3, 383–427 (1966).
20. M. Jull, P. B. Kelemen, On the conditions for lower-crustal convective instability.J. Geophys. Res. 106, 6423–6446 (2001).
21. V. Schulte-Pelkum et al., Mantle earthquakes in the Himalayan collision zone. Geol-
ogy 47, 1–5, https://doi.org/10.1130/G46378.1 (2019).22. K. Priestley, J. Jackson, D. McKenzie, Lithospheric structure and deep earthquakes
beneath India, the Himalaya and southern Tibet. Geophys. J. Int. 172, 345–362 (2008).23. B. Jamtveit, Y. Ben-Zion, F. Renard, H. Austrheim, Earthquake-induced transformation
of the lower crust. Nature 556, 487–491 (2018).24. S. Bian et al., Late Pliocene onset of the Cona rift, eastern Himalaya, confirms east-
ward propagation of extension in Himalayan-Tibetan orogen. Earth Planet. Sci. Lett.
544, 116383 (2020).25. Y. Ren, Y. Shen, Finite frequency tomography in southeastern Tibet: Evidence for the
causal relationship between mantle lithosphere delamination and the north–south
trending rifts. J. Geophys. Res. 113, B10316 (2008).26. S. L. Klemperer, Crustal flow in Tibet: Geophysical evidence for the physical state of
Tibetan lithosphere, and inferred patterns of active flow. Geol. Soc. Lond. Spec. Publ.268, 39–70 (2006).
27. Z. Hou, Z. Li, Possible location for underthrusting front of the Indus continent: Con-
straints from helium isotope of the geothermal gas in southern Tibet and EasternTibet. Acta Geol. Sin. 78, 482–493 (2004).
28. S. L. Klemperer et al, Torn subducting cratonic lithosphere shown by mantle fluids:India does not underplate the Lhasa terrane west of 82° or east of 88°E, and does not
underplate the Qiangtang terrane. AGU Fall Meeting Abstracts, T22C-01 (2019).
https://agu.confex.com/agu/fm19/meetingapp.cgi/Paper/545424. Accessed 8 Septem-ber 2020.
29. M. Chen et al., Lithospheric foundering and underthrusting imaged beneath Tibet.
Nat. Commun. 8, 15659 (2017).30. H. Zhang, J. Zhao, Q. Xu, Crustal and upper mantle velocity structure beneath central
Tibet by P-wave teleseismic tomography. Geophys. J. Int. 190, 1325–1334 (2012).31. X. Liang et al., 3D imaging of subducting and fragmenting Indian continental litho-
sphere beneath southern and central Tibet using body-wave finite-frequency to-
mography. Earth Planet. Sci. Lett. 443, 162–175 (2016).32. L. Godin, R. S. La Roche, L. Waffle, L. B. Harris, Influence of inherited Indian basement
faults on the evolution of the Himalayan Orogen. Geol. Soc. Lond. Spec. Publ. 481,251–276 (2019).
33. J. Ligorria, C. J. Ammon, Iterative deconvolution and receiver function estimation.
Bull. Seismol. Soc. Am. 89, 1395–1400 (1999).34. D. Shi, S. L. Klemperer, J. Shi, Z. Wu, W. Zhao, Localized Foundering of Indian Lower
Crust in the India-Tibet Collision Zone: Supplemental Data Files of Seismic and Gravity
Data. Stanford Digital Repository. Available at: https://purl.stanford.edu/jz904sc7304.Stanford Digital Repository, Stanford University, Stanford, California, https://purl.
stanford.edu/jz904sc7304. https://purl.stanford.edu/jz904sc7304 Published ahead ofprint.
Shi et al. PNAS | October 6, 2020 | vol. 117 | no. 40 | 24747
EART
H,A
TMOSP
HER
IC,
ANDPL
ANET
ARY
SCIENCE
S
Dow
nloa
ded
by g
uest
on
Feb
ruar
y 6,
202
2