localization performance of real and virtual sound … · localization performance of real and...
TRANSCRIPT

RTO-MP-HFM-123 29 - 1
Localization Performance of Real and Virtual Sound Sources
M.Sc.E.E. Jan Abildgaard Pedersen AM3D A/S
Riihimäkivej 6 DK-9200 Aalborg
Denmark
M.Sc.E.E. Torben Jørgensen Terma A/S
Hovmarken 4 DK-8520 Lystrup
Denmark
E-mail: [email protected] / [email protected]
ABSTRACT
This paper describes how a 3D-Audio system for use in fighter aircrafts was evaluated in an experiment, by comparing localization performance between real and virtual sound sources. Virtual sound sources from 58 selected directions were evaluated, while 16 of these directions were also evaluated using real sound sources, i.e. loudspeakers. 13 pilots from the Royal Danish Air Force and 13 civil persons were used in the test. The localization performance was split into a constant and a stochastic difference between the perceived direction and the desired direction (stimulus). The constant difference is a localization offset and the stochastic difference is a measure for the localization uncertainty. Stimuli length of both 250 ms and 2 s enabled investigation of the importance of head movements, i.e. using head tracking. Real and virtual sound sources could be located with an uncertainty of 10o and 14o degrees for azimuth while the uncertainty for elevation was 12o and 24o (real and virtual sound sources). No significant localization offset was found for azimuth, while an average offset for elevation of 3o – 6o degrees was found using long stimuli. A significant difference between the localization offset obtained in different directions was found – especially for elevation, where the offset was found to have a strong correlation to the stimuli elevation.
1 INTRODUCTION
3D-Audio is used in fighter aircrafts to enhance the situational awareness. This includes 3D-Audio indication of the directions of detected approaching missiles as well as channel separation of several simultaneous sound signals, e.g. speech from ground control, wingman and alarm signals. The 3D-Audio system included headphone playback system, head tracker and a digital signal processor (DSP). This paper describes the design and the results of a psychoacoustic test, which was used to evaluate such a 3D-Audio system. In particular the localization performance was evaluated, i.e. the capability of positioning sound sources in 3D space at predetermined positions, which enables listeners to localize sound sources at desired positions with some uncertainty. The experiment focused only on the localization performance in relation to direction - distance was not considered. Separate work focusing on distance perception has been presented earlier by other authors [1], [2], [3].

Localization Performance of Real and Virtual Sound Sources
29 - 2 RTO-MP-HFM-123
Localization performance has been a subject for research for many years and a long list of authors has presented work including localization performance of real sound sources, phantom sound sources and virtual sound sources [4], [5], [6], [7], [8], [9], [10], [11]. Many of these papers focus on the localization performance of virtual sound sources, i.e. binaural sound reproduction systems, where test subjects wear headphones and the signals fed to each ear has been recorded using a dummy head or has been processed by head-related transfer functions (HRTF) [5]. Either the recording or the processing will enable listeners to localize sound sources in full 3D as if the listener was present at the recording position or at the synthesized listening position. Head tracking enables the signals fed to the two ears to change accordingly to head movements, so that the perception of the virtual sound source remains while moving the head. The perception of the virtual sound source not only remains because of the head tracking system, it is improved dramatically [5], [10], [11]. Especially front-back ambiguity is almost solved in 3D-Audio systems, which includes a head tracker [11].
When evaluating the localization performance of 3D-Audio systems different strategies has been proposed. One way is to determine the difference between the direction of stimuli (desired direction) and the perceived direction. This will show how large the errors can be when trying to position a virtual sound source in 3D space, i.e. an absolute measure of the angle between the desired and observed position. In a given application this could be compared to the actual needs or requirements for localization performance. However an obvious reference would be real life localization performance, i.e. localization performance of real sound sources [9]. Most 3D-audio systems are implementing an approximation to a real sound field, which means that if the localization performance of the 3D-Audio system is approximately the same as for real sound sources, then the localization performance of the 3D-Audio system is optimal.
The experiment described in this paper included a listening test, where the same test subjects evaluated the localization performance of both a 3D-audio system and a setup of real sound sources. Care was taken to ensure that all conditions were equal for the two evaluations. The only difference was the fact that test subjects did wear headphones when they evaluated the 3D-Audio system, which was not the case when they evaluated the real sound sources.
2 STRATEGY FOR THE EXPERIMENT
2.1 Purpose of the experiment
The purpose of this experiment was to provide information about the localization performance of a 3D-Audio system in relation to usage in “Mission Critical” systems. Specifically the performance measures for systems, where alarm signals are given a direction corresponding to objects that need attention, were of interest. It was a desire to determine the localization performance in situations that resemble the real life use of an auditory display for “Mission Critical” systems. The localization performance for virtual sources was compared to the localization performance for real sound sources. In this experiment headphones were used for virtual sound sources and loudspeakers were used for real sound sources.
2.2 Psychoacoustic method
First the subjects heard one sound signal from one direction either via headphones (virtual sources) or via one loudspeaker (real sources) and were then asked to point to the direction, where they perceived the sound source, i.e. the single stimuli method. Simply pointing to the direction where they perceived the sound source to come from was an intuitive method, which should decrease the need for very long and intensive training sessions.

Localization Performance of Real and Virtual Sound Sources
RTO-MP-HFM-123 29 - 3
A laser pointer was mounted on the pointing device in such a way, that a light dot gave visual feedback to the subject to ensure, that the answered direction was indeed the direction, where they perceived the sound to originate from. Different and independent random sequences of directions and sound source type (real or virtual) were used for each subject.
The main experiment was preceded by a structured training session, which introduced the test subjects to the concept of direction of sound sources as well as running test sessions using both virtual and real sound sources. The aim of the training sessions were to minimize the increased variance introduced by using subjects, who were naive in the task, methods and procedures used in the experiment.
Visibility of the real sound sources, i.e. loudspeakers, would have introduced a bias into the experiment, because subjects would only point to directions, where they could see a loudspeaker – not in directions in between. This bias was avoided by installation of an acoustically transparent curtain (side, top and bottom) surrounding the subjects in such a way that no loudspeakers were visible.
2.3 Localization Performance and definition of direction
The localization performance was split into a constant and a stochastic difference between the perceived direction and the desired direction, i.e. stimulus. The constant difference is a localization offset and the stochastic difference is a measure for the localization uncertainty. A given direction relative to the head of the listener was characterised by the two Euler angles: azimuth and elevation.
Azimuth defines a rotation about the z-axis in a coordinate system, where origo is the centre of the listeners head, z-axis pointing upward and y-axis pointing straight forward, i.e. x-axis pointing to the right hand side. Azimuth is 0 for a direction straight ahead, i.e. in the direction of the y-axis. Azimuth is positive when turning in the direction to the left (counter clockwise), e.g. azimuth is +90o for a direction directly to the left of the listener and 270o for a direction directly to the right of the listener.
Elevation is a rotation around the x-axis, where a positive angle means upward and a negative angle means downward relative to the horizontal plane for the listeners head, e.g. +90o is right above the listeners head and -90o is directly below the listener. Elevation is 0o in the horizontal plane.
2.4 Virtual and real sound sources
The perceived direction of a sound will be different from the desired/real direction of the presented sound. This is true both when using virtual and real sound sources. This means, that when judging the localization performance of a 3D-Audio system (virtual sources), one could compare the results to results obtained using real sound sources placed in the desired direction relative to the subject.
A large number of directions were used for virtual sound sources because the 3D-Audio system was the main focus of the experiment. Azimuth and elevation were considered to be two independent variables in the experiment, which meant that separate selection of values for azimuth and elevation were performed. At first 107 directions were considered for use in the experiment for virtual sources, however due to left/right symmetry of the basic set of directions this number was lowered to 58 asymmetric directions, which basically covered the same directions as the basic set. This decision was made to lower the time consumption of the experiment and because verification of left/right symmetry was not part of the purpose of this experiment.
For practical reasons, a significant lower number of real sound sources were used: 16 loudspeakers. These 16 directions for the real sources were a subset of the 58 directions used for virtual sources. A test session was either a loudspeaker session or a virtual source session, so that test subjects did not have to put on
Localization Performance of Real and Virtual Sound Sources
29 - 4 RTO-MP-HFM-123
headphones or remove them during a test session.
2.5 Controlled parameters in the experiment
The controlled parameters of the experiment were:
• Azimuth angle
• Elevation angle
• Test subject
• Stimuli
• Sound source type: virtual or real
3 DESIGN OF THE EXPERIMENT
3.1 Stimuli
3.1.1 Spectral and temporal characteristics
White noise was selected as the basic stimuli. Both short and long bursts were used: 250 ms and 2 s. Short bursts of white noise were used to prevent subjects from being able to turn their head as part of localizing the sound sources. This stimulus was used to evaluate the static localization performance. Earlier work has proved that the head movement has a dramatic impact on the localization performance, i.e. the difference between static and dynamic sound localization performance [5], [10], [11], [13]. Dynamic localization performance, where then evaluated using the long noise bursts, where subjects had time to use head movements as part of the localization task. During the training sessions only long bursts were used. If a test session lasted longer than 15 min. a break was automatically inserted by the program, which controlled the test. After a break of approximately 5 min. the test session was continued.
Training sessions:
• Long bursts of white noise: 2.00 s.
Experiment sessions:
• Short bursts of white noise: 0.25 s.
• Long bursts of white noise: 2.00 s.
• Maximum 15 min. without breaks
The level of the stimuli was adjusted to 84 dB SPL(LIN) = 75 dB SPL(A) at the listening position while playing the noise signal through a loudspeaker. A dummy head, “Valdemar” [5], [6], [7], were placed on the listening position and used to ensure the same reproduction level using loudspeakers and headphones.

Localization Performance of Real and Virtual Sound Sources
RTO-MP-HFM-123 29 - 5
3.1.2 Directions of virtual and real sound sources
Azimuth and elevation had to be independent since they were regarded as two controlled parameters of the experiment. Basically it was decided to use 15 values for azimuth and 9 values for elevation. This corresponds to the 107 directions, because azimuth are undefined for the two elevation values +90o and -90o .The values for azimuth angle were 0o, 24o, 48o, 72o, 96o, 120o, 144o, 168o, 192o, 216o, 240o, 264o, 288o, 312o and 336o. The values for elevation angle were -90o, -66o, -44o, -22o, 0o, 22o, 44o, 66o and 90o. These 107 directions were then reduced to 58 simply by removing either the left or the right direction in a couple, which were left/right symmetric. The used 58 direction for virtual sound sources is shown in figure 3.1.
Figure 3.1: Directions for the 58 virtual sound sources without left/right symmetry.
This means that the number of values used for azimuth reduced to 8:
• Azimuth: 0o, 24o, 72o, 120o, 168o, 216o, 264o, 312o
• Elevation: -90o, -66o, -44o, -22o, 0o, 22o, 44o, 66o, 90o
16 of the 58 directions were then selected for real sound sources, i.e. loudspeakers were mounted in these 16 directions. Figure 3.2 shows these 16 directions in a similar way as in figure 3.1. Finally table 3.1 gives the complete list of the 58 directions including “Direction ID”, elevation angles, azimuth angles and an indication of “Real Source”, which means that such a direction were used both as a virtual and a real sound source.

Localization Performance of Real and Virtual Sound Sources
29 - 6 RTO-MP-HFM-123
Figure 3.2: Directions for the 16 real sound sources (loudspeakers) shown as red squares, which are a subset of the 58 directions used for virtual sources (blue disks).
Table 3.1: Direction of all 58 virtual and 16 real sound sources.
Direction ID Elevation Azimuth Real Source
1 -90o 0o - 2 -66o 0o X 3 -66o 24o - 4 -66o 72o - 5 -66o 120o X 6 -66o 168o - 7 -66o 216o - 8 -66o 264o X 9 -66o 312o -
10 -44o 0o - 11 -44o 24o - 12 -44o 72o X 13 -44o 120o - 14 -44o 168o - 15 -44o 216o X 16 -44o 264o - 17 -44o 312o X 18 -22o 0o X 19 -22o 24o - 20 -22o 72o - 21 -22o 120o - 22 -22o 168o X 23 -22o 216o - 24 -22o 264o - 25 -22o 312o - 26 0o 0o X 27 0o 24o X 28 0o 72o - 29 0o 120o X

Localization Performance of Real and Virtual Sound Sources
RTO-MP-HFM-123 29 - 7
30 0o 168o - 31 0o 216o - 32 0o 264o X 33 0o 312o - 34 22o 0o - 35 22o 24o - 36 22o 72o X 37 22o 120o - 38 22o 168o - 39 22o 216o - 40 22o 264o - 41 22o 312o - 42 44o 0o - 43 44o 24o - 44 44o 72o - 45 44o 120o - 46 44o 168o - 47 44o 216o - 48 44o 264o - 49 44o 312o X 50 66o 0o - 51 66o 24o - 52 66o 72o - 53 66o 120o - 54 66o 168o - 55 66o 216o X 56 66o 264o - 57 66o 312o - 58 90o 0o X
3.1.3 Processing signals to create virtual sound sources
Signals for right ear and for left ear were convolved in real time with the Head-Related Transfer Functions (HRTF) which corresponded to the direction of the desired sound source position relative to the orientation and position of the listeners head. This was enabled by fitting the headphone with a Head Tracker, which continuously did sent the positions and orientations to the program, which was performing processing of the signals. The used HRTF database did hold measurements from 11950 different directions, i.e. 2o angular resolution [5]. The complete real time 3D-Audio system including HRTF database, head tracker, convolution, binaural reverberation etc. was a product developed by AM3D A/S [12]. The processing also included equalization for the transfer function of the used headphone [5]. A calibration of the Head Tracker was performed before the start of each test session.
3.2 Physical setup
3.2.1 Reproduction system for real sound sources
The physical setup consisted of 16 real sound sources, i.e. loudspeakers, positioned in a distance of 2.13 m (7 feet) from a listening position, see figure 3.3. A curtain cylinder surrounded the listening position to avoid visibility of the loudspeakers. The light in the room was switched off during all tests and light was shined on the curtain from inside the cylinder, which ensured no visibility of objects outside the cylinder. The curtain cylinder was fitted both with a circular top and a circular bottom. The height of the curtain cylinder was 3.70 m and the diameter was 2.90 m.
The test subjects were standing on an adjustable platform, which elevated the ears of all subjects to a height of 2.15 m above floor level. Figure 3.3 shows the used elevation angles, while figure 3.4 shows a

Localization Performance of Real and Virtual Sound Sources
29 - 8 RTO-MP-HFM-123
top view, where the used azimuth angles are shown. The physical setup was established in a large Television Studio at the facilities of AM3D A/S. The adjustable platform measured 30 cm by 30 cm, which constrained the possibility for test subjects to move away from the reference listening position. However the subjects were allowed to turn their whole body around in order to localize the sound and for precise pointing toward the position, where they perceived the sound to originate from.
The sound pressure responses of all 16 loudspeakers were measured at the listening position, and individual equalization were applied to each loudspeaker to ensure very similar response from all 16 loudspeakers. The resulting amplitude responses of all the loudspeakers were flat in the range from 140 Hz to 15 kHz.
Ø2.90 m
h=3.
70 m
Floor
0.30
m
Listening position
Figure 3.3: Side view of the physical setup, where 16 loudspeakers were positioned around a listening position in a distance of 2.13 m. A curtain cylinder (grey) surrounded the listening position. Diameter of the cylinder was 2.90 m and the height was 3.70 m. Both the top and
bottom of the cylinder was fitted with curtain disks to close up the cylinder. Test subjects were standing on a platform (green) to ensure an ear height of 2.15 m.
Figure 3.5 shows the complete setup including the curtain cylinder and the loudspeakers mounted around it. This picture was taken from the left hand side, i.e. from the direction, where azimuth was +90 degrees. It follows from this, that the loudspeakers seen in the left side of the picture, were the loudspeakers directly in front of the listener, i.e. in the direction, where azimuth was 0 degrees.

Localization Performance of Real and Virtual Sound Sources
RTO-MP-HFM-123 29 - 9
FrontBack
Right
Left
2X
Figure 3.4: Top view of the physical setup, where 16 loudspeakers were positioned around a listening position in a distance of 2.13 m. A curtain disk (grey) forms the two ends of the closed
cylinder. The diameter of the disks was 2.90 m. Three loudspeakers were pointing almost upwards (elevation = -66o), which is indicated by the upward facing loudspeakers. Two
Loudspeakers were pointing downwards or almost downwards, which is indicated by the downward facing loudspeakers. All loudspeakers were positioned in a distance of 2.13 m from the listening position, but show up at different projected distances in this 2D top view diagram
due to different values of elevation angle for the 16 different loudspeakers.
Figure 3.5: Picture of the curtain cylinder with loudspeakers mounted around it.

Localization Performance of Real and Virtual Sound Sources
29 - 10 RTO-MP-HFM-123
3.2.2 Reproduction system for virtual sound sources
The reproduction setup for virtual sources consists of signal processing inside the 3D-Audio system and the test subject wearing headphones, which were equipped with a head tracker. Based on the position and orientation of the test subjects head combined with the desired direction of the virtual sound source digital filters were applied to the short or long white noise burst as described in section 3.1.3. The selected headphone was a “Beyerdynamic – DT 990 PRO”, which has a specified frequency range of 5 Hz – 35 kHz. The head tracker updated the position and orientation of the headphones with a rate of 60 Hz. The maximum latency was 35 ms. Each headphone session started with a calibration of the head tracker by instructing the subject to look straight forward towards a fixed point on the curtain, which was in the same height as the eyes of the subject and in the direction defined as zero azimuth.
3.2.3 Pointing device
The test subjects had to show their perceived direction by pointing. For this a toy gun equipped with a tracking device was used. The test subjects were instructed to point by aiming at a target using both hands and straight arms. This ensured that the toy gun was held in a position directly in front of the test subjects, i.e. not of the either right or left hand side. The test subject were also instructed to turn their whole body as part of the localization task and when pointing they should be facing the position, where they perceived the sound to originate from. This should prevent subject from pointing and answering in an imprecise way, e.g. by shooting over their shoulder to point to a position behind them. Subjects were instructed to notice where they were pointing by observing where the laser dot shined on the curtain. The update rate of the tracker mounted on the toy gun was also 60 Hz, and this tracker was calibrated at the start of each session by instructing the test subject to point and aim at the same fix point on the curtain as described in section 3.2.2. This was performed at the same time as the calibration of the head tracker.
3.2.4 Automated test system
Presentation of stimuli in the predetermined directions, adjusting the signal processing according to the position and orientation of the head tracker, performing all the necessary signal processing and recording the answered directions by reading the data from the gun tracker was all performed by an integrated system, which was build around a PC including test system software and signal processing software, head tracker control and power amplifiers. Figure 3.6 shows the structure of this system. The system included a user interface which was used by the test operator to control the test.

Localization Performance of Real and Virtual Sound Sources
RTO-MP-HFM-123 29 - 11
Figure 3.6: Structure of the automated test system
3.3 Procedure for the experiment
3.3.1 Selection of test subjects
The 3D-Audio system under test is targeted towards applications in fighter aircrafts. This led to the desire to test if fighter pilots have special requirements for a 3D-Audio system. In practise this was ensured by recruiting half of test subjects from the Royal Danish Air Force: 13 pilots from the Air Force Bases in Aalborg and Karup, Denmark. The other half of test subjects was civil persons, primarily students from Aalborg University, Denmark. This led to a total number of test subjects of 26 persons.
3.3.2 Screening and instruction of test subjects
All test subjects had a test of hearing threshold, i.e. audiogram. All test subjects were ensured to fall within a range of hearing loss between +20 dB to -10 dB, based on the standard hearing threshold (ISO 389). Then the test subjects had their picture taken, determination of leading eye, collection of personal facts (name, age, sex, experience in listening tests, ear height above the floor and total height) and they had to read a 2 page instruction, which described their task in the experiment. A short discussion between the test operator and the test subject should minimize the risk of misunderstandings. The height of the platform in the bottom of the curtain cylinder was then adjusted according to the measured height of the ears of the test subjects to ensure that the height of the ears when standing on the platform was 2.15 m in all cases. The subjects were not permitted to view the loudspeakers in the setup prior or during the experiment.
3D-Audio processing software
Audio Generator
Headphone Amplifier
Headtracker
Pointing Device Tracker
Test Execution Application
Storage Test data
Control data: Start, Stop.
Global Virtual Sound Source Position
Global Head position and orientation

Localization Performance of Real and Virtual Sound Sources
29 - 12 RTO-MP-HFM-123
3.3.3 Test sessions
The whole experiment was split into 6 test session for each test subject:
• Headphone familiarization (training: 16 directions, 3 repetitions, long stimuli)
• Virtual sound sources, 2 s stimuli
• Virtual sound sources, 250 ms stimuli
• Loudspeaker familiarization (training, 16 directions, 3 repetitions, long stimuli)
• Real sound sources, 2 s stimuli
• Real sound sources, 250 ms stimuli
The order of these 6 sessions was made random for each person by random selection of 1 out of 4 possible sequences:
• Sequence A: Virtual sound sources first 2 s stimuli first
• Sequence B: Virtual sound sources first 250 ms stimuli first
• Sequence C: Real sound sources first 2 s stimuli first
• Sequence D: Real sound sources first 250 ms stimuli first
Following this terminology then sequence A is similar to the sequence given in the start of section 3.3.3.
Each sound source direction was used 3 times for each subject using both headphones and loudspeakers.
The total number of stimuli and answers were:
Headphone familiarization: 26 persons x 16 directions x 3 repetitions = 1248 stimuli Virtual sources: 26 persons x 58 directions x 3 repetitions x 2 stimuli length = 9048 stimuli Loudspeaker familiarization: 26 persons x 16 directions x 3 repetitions = 1248 stimuli Real sources: 26 persons x 16 directions x 3 repetitions x 2 stimuli length = 2496 stimuli
Total: 14040 stimuli, which was equal to 39 hours of effective test (approx. 10 sec/stimuli)
This was equal to 1.5 hour of effective testing time for 1 test subject, but screening, instruction and pauses led to a total testing time for 1 test subject of approx. 2.5 hours. The automatic control software inserted a pause in any test session after each 15 min. of testing time. The 2.5 hour for 1 test subject corresponded to a total testing time of 65 hours.
3.3.4 One test session
The procedure for any one session was:
• The test subject was positioned in the reference position: standing on the platform in the centre of the curtain cylinder facing the fix point on the curtain, which indicated zero azimuth and zero elevation.
• The subjects calibrated both the head tracker and the gun tracker by aiming with two-handed grip and straight arms towards the fix point on the curtain and by looking straight ahead towards the same fix point. The calibration was effectuated by pressing the trigger on the toy gun. In the case of real sound sources then only the gun tracker was calibrated.
• Before each stimulus, the test subject reported “Ready” to the system by pressing the trigger after

Localization Performance of Real and Virtual Sound Sources
RTO-MP-HFM-123 29 - 13
returning to the reference position facing the fix point.
• Each stimulus signal was presented
• Answered direction was given by the subject through aiming with two-handed grip and straight arms toward the perceived direction and pressing the trigger.
4 RESULTS
4.1 Basic data analysis
The localization error, calculated as the difference between the answered direction and the desired direction, was regarded as a random variable. The distribution was assumed to be a Normal distribution.
Unbiased estimators for mean (average), µ , and variance, 2σ , were calculated from the raw directional data obtained, and standard deviation,σ , of the error was simply calculated as the square root of the estimated variance [14]. A 95% confidence interval centred at the estimated mean (average) having a width equal to 3.92 times the standard deviation was then determined as a model describing the basic data [14].
The basic data analysis was performed using data from all 26 test subjects but limited to 1 specific direction, 1 length of stimuli and 1 specific reproduction method. Data from virtual sound sources, 2 s stimuli in the direction ID=28 are plotted in figure 4.1. Direction ID=28 is located in the horizontal plane, i.e. elevation=0o. The azimuth for the direction is 72o (to the left relative to front direction). For such a specific subset of data 78 answers were obtained (26 persons x 3 repetitions).
Figure 4.1: 78 answers for the direction indicated by the black horizontal and vertical lines. Each answer is indicated by a blue circle. Data were obtained using virtual sources and 2 s stimuli.
The azimuth and elevation values for each answer were then made relative to the stimuli direction by

Localization Performance of Real and Virtual Sound Sources
29 - 14 RTO-MP-HFM-123
subtracting the stimuli azimuth and elevation. Figure 4.2 shows these relative answers, i.e. the localization errors. The red rectangle indicates 95% confidence intervals for azimuth and elevation, while the average azimuth error, aµ , and average elevation error, eµ , are indicated by black horizontal and vertical lines. The
statistical parameters for these data are given in table 4.1.
Figure 4.2: Localization error calculated from the 78 answers obtained using virtual sources and 2 s stimuli in direction 28 (azimuth=72o,elevation=0o). The red rectangle indicates 95%
confidence interval for azimuth and elevation errors. Each localization error is indicated by a blue circle. Black horizontal and vertical lines indicate the global average azimuth and elevation
errors.
Table 4.1: Statistical characteristics for the localization error obtained in the direction ID=28 using virtual sources and 2 s stimuli.
Azimuth Elevation
Average error ( µ ) -0.1o 2.6o
Standard deviation (σ ) 6.0o 6.5o
95% confidence interval [-11.9o ; 11.6 o] [-10.1 o ; 15.4 o]
Equations 4.1 and 4.2 give the stochastic model for the localization error both for azimuth and elevation.
),( 2aaazimuth Nerror σµ∈ (4.1)
),( 2eeelevation Nerror σµ∈ (4.2)

Localization Performance of Real and Virtual Sound Sources
RTO-MP-HFM-123 29 - 15
4.2 Direction offset and uncertainty across all directions
The analysis process described in section 4.1 was repeated for all 58 directions used for virtual sources. Figure 4.3 shows the average azimuth error, aµ , for all 58 directions, which shows that the average
error, aµ , must be modelled as a stochastic variable itself. This stochastic variable is also assumed to be a
Normal distribution. The black line indicates the over all average for azimuth error, i.e. a global average azimuth error, aµ , and the 95% confidence interval for the average azimuth error is indicated by red
horizontal lines.
Figure 4.3: Average azimuth error calculated for the 58 directions used for virtual sound sources indicated by blue circles. The basic data were obtained using virtual sources and 2 s stimuli.
The black horizontal line indicates the global average azimuth error, and the red horizontal lines indicate the 95% confidence interval for the average azimuth error.
Equation 4.3 gives the stochastic model for the distribution of average azimuth error, aµ , at different
directions, as shown in figure 4.3. The standard deviation of the average error is termed: aaverage,σ . The
global average azimuth error, globala ,µ , was calculated as given in equation 4.4 based on the average
azimuth error, )(iaµ , in all 58 directions.
),( 2,, aaverageglobalaa N σµµ ∈ (4.3)
∑=
•=58
1, )(
58
1
iaglobala iµµ (4.4)
The localization error can now be modelled as the sum of two stochastic variables, both Normal distributed, which in turn yields one Normal distributed stochastic variable with an increased variance.

Localization Performance of Real and Virtual Sound Sources
29 - 16 RTO-MP-HFM-123
Equation 4.5 then gives the total stochastic model for the localization error, where totala ,σ is the total
standard deviation of the azimuth error, which can be calculated using equation 4.6 [14]. This was done by assuming that the stochastic element within isolated directions was independent from the stochastic element between directions [14].
),( 2,, totalaglobalaazimuth Nerror σµ= (4.5)
22,
2, aaaveragetotala σσσ += (4.6)
Figure 4.4 shows the average elevation error for the 58 directions used for virtual sources, 2 s stimuli. Here it should be noted, that the average error seems to correlate to the direction ID. In fact the average elevation error was found to be a function of the stimuli elevation and the global average elevation error,
globale,µ . Figure 4.5 shows the relationship between the average elevation error, eµ , the stimuli elevation,
eS , and the global average elevation error, globale,µ , which is also described in Equation 4.7.
oeglobaleee SS 7.525.0, +•−=+•= µαµ (4.7)
α is an “Elevation error factor”, which describes how large a fraction of an increase in stimuli elevation is reflected in an increased elevation error, i.e. larger stimuli elevation yields larger elevation error. Figures 4.6 and 4.7 show the standard deviations for azimuth errors and elevation errors as a function of stimuli direction ID. Figure 4.8 shows how the standard deviations for elevation errors increased when stimuli moved away from the horizontal plane (elevation=0o ).
Figure 4.4: Average elevation error calculated for the 58 directions used for virtual sound sources indicated by blue circles. The basic data were obtained using virtual sources and 2 s
stimuli. The black horizontal line indicates the global average elevation error, and the red horizontal lines indicate the 95% confidence interval for the average elevation error.

Localization Performance of Real and Virtual Sound Sources
RTO-MP-HFM-123 29 - 17
Figure 4.5: Average elevation error calculated for 58 directions plotted as a function of stimuli elevation. The basic data were obtained using virtual sources and 2 s stimuli. The black straight
line indicates a simple relationship between average elevation error and stimuli elevation.
Figure 4.6: Standard deviations for azimuth error calculated for the 58 directions used for virtual sound sources indicated by blue circles. The basic data were obtained using virtual sources and 2 s stimuli. The black horizontal line indicates the average standard deviation across directions.

Localization Performance of Real and Virtual Sound Sources
29 - 18 RTO-MP-HFM-123
Figure 4.7: Standard deviations for elevation error calculated for the 58 directions used for virtual sound sources. The basic data were obtained using virtual sources and 2 s stimuli. The
black horizontal line indicates the average standard deviation across directions.
Figure 4.8: Standard deviations for elevation error calculated for 58 directions plotted as a function of stimuli elevation. The basic data were obtained using virtual sources and 2 s stimuli.
The black horizontal line indicates the average standard deviation across directions.

Localization Performance of Real and Virtual Sound Sources
RTO-MP-HFM-123 29 - 19
Figure 4.9 shows all 4524 answers obtained using virtual sound sources and 2 s stimuli. The black horizontal and vertical lines show the global average for azimuth error, globala ,µ , and elevation error,
globale,µ . The red rectangle indicates 95% confidence intervals for azimuth and elevation, which are based
on the statistical parameters given in table 4.2.
Figure 4.9: Localization error calculated from 4524 answers obtained using virtual sources and 2 s stimuli in all 58 directions. The red rectangle indicates 95% confidence interval for azimuth and
elevation errors. Each localization error is indicated by a blue circle. Black horizontal and vertical lines indicate the global average azimuth and elevation errors.
Table 4.2: Statistical characteristics for the localization error obtained using virtual sources and 2 s stimuli.
Azimuth Elevation
Average error ( globalµ ) -0.4o 5.7o
Standard deviation ( totalσ ) 7.4o 15.7o
95% confidence interval [-14.8 o ; 14.1 o] [-25.2 o ; 36.5 o]
The localization offset was then removed by calculating the localization error as the difference between the answered directions and the average of the answered directions for a given stimuli direction. This is equivalent to compensating for the localization offset in the different directions, see figures 4.3, 4.4 and 4.5. It follows from this that the average localization error becomes zero in all stimuli directions, and the global average localization error vanishes to zero. The standard deviation of the average localization error also becomes zero because the localization error was constant (zero) in all stimuli directions. Though the
Localization Performance of Real and Virtual Sound Sources
29 - 20 RTO-MP-HFM-123
total standard deviation for the localization error, totalσ , now becomes equal to the standard deviation for
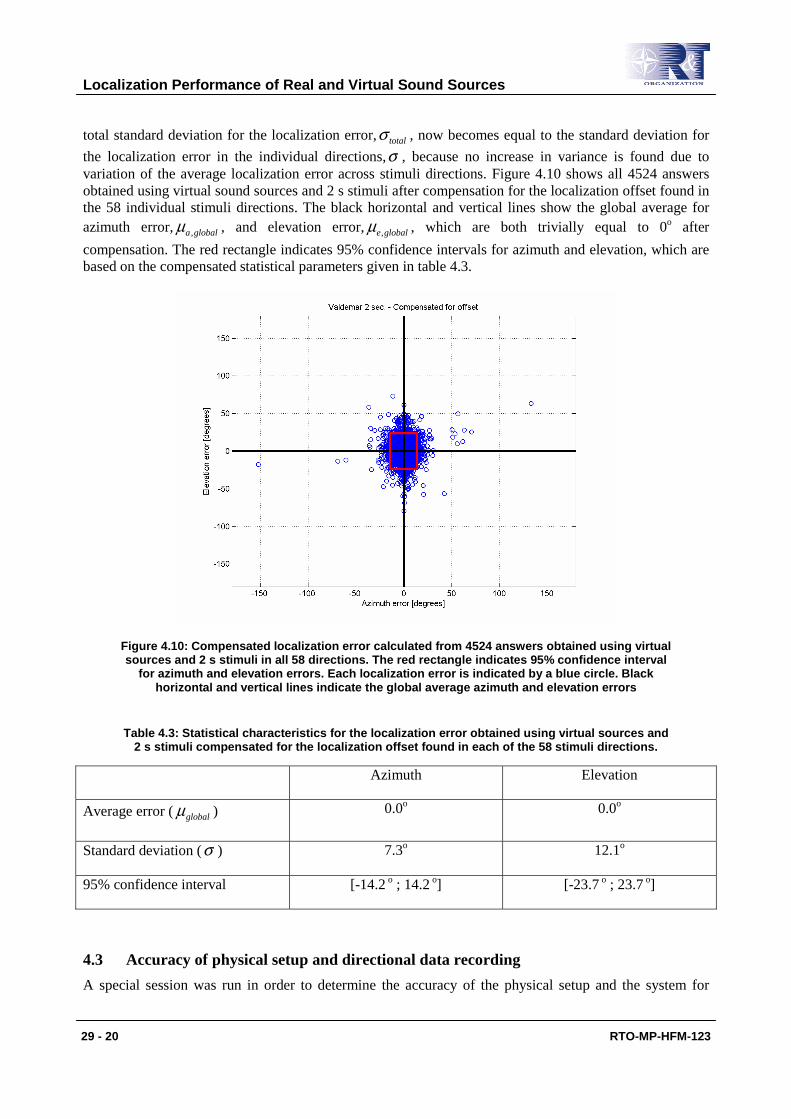
the localization error in the individual directions,σ , because no increase in variance is found due to variation of the average localization error across stimuli directions. Figure 4.10 shows all 4524 answers obtained using virtual sound sources and 2 s stimuli after compensation for the localization offset found in the 58 individual stimuli directions. The black horizontal and vertical lines show the global average for azimuth error, globala ,µ , and elevation error, globale,µ , which are both trivially equal to 0o after
compensation. The red rectangle indicates 95% confidence intervals for azimuth and elevation, which are based on the compensated statistical parameters given in table 4.3.
Figure 4.10: Compensated localization error calculated from 4524 answers obtained using virtual sources and 2 s stimuli in all 58 directions. The red rectangle indicates 95% confidence interval
for azimuth and elevation errors. Each localization error is indicated by a blue circle. Black horizontal and vertical lines indicate the global average azimuth and elevation errors
Table 4.3: Statistical characteristics for the localization error obtained using virtual sources and 2 s stimuli compensated for the localization offset found in each of the 58 stimuli directions.
Azimuth Elevation
Average error ( globalµ ) 0.0o 0.0o
Standard deviation (σ ) 7.3o 12.1o
95% confidence interval [-14.2 o ; 14.2 o] [-23.7 o ; 23.7 o]
4.3 Accuracy of physical setup and directional data recording
A special session was run in order to determine the accuracy of the physical setup and the system for

Localization Performance of Real and Virtual Sound Sources
RTO-MP-HFM-123 29 - 21
recording the directional data, i.e. the positions of the real sound sources (loudspeakers) and the tracker system, which determines the position and orientation of the toy gun. A test subject was placed on the platform inside the curtain cylinder and was instructed to point to each of the 16 loudspeakers one at a time. The test subject was assisted in this task by a person outside the curtain, who ensured that the laser dot shined in the centre of the loudspeaker (+/- 0.5 cm). The light in the room was turned on during this session to enable visibility of the loudspeaker from inside the cylinder. The obtained directional data was then analyzed in a similar way as described in section 4.2. Table 4.4 gives the results of this analysis.
averageσ is a measure for the accuracy of the positions of the loudspeakers relative the theoretical correct
positions as defined in table 3.1.σ on the other hand is a measure for the accuracy of the system for recording the directional data, i.e. gun tracker. The uncompensated confidence interval gives the total localization uncertainty including both the uncertainty of loudspeaker positions and the gun tracker. The compensated confidence interval is the uncertainty only for the gun tracker. This compensation for localization offset was described in section 4.2.
Two methods were tried out for determining the answered direction:
• Direction given by the orientation of the toy gun
• Direction given by a straight line passing through the centre of the head of the test subject and the calculated position of the laser dot on the curtain.
Similar results were obtained by the two methods, which led to usage of the orientation of the toy gun for all directions in this paper.
Table 4.4: Statistical parameters for accuracy of physical setup and directional data recording.
Azimuth Elevation
Average localization error ( globalµ ) -0.1o -0.9o
Standard deviation for the average ( averageσ ) 1.6o 2.2o
Standard deviation in each stimuli direction (σ ) 0.9o 0.6o
Total standard deviation ( totalσ ) 1.8o 2.3o
95% confidence interval [-3.7 o ; 3.5 o] [-5.4 o ; 3.6 o]
95% confidence interval (compensated) [-1.8 o ; 1.8 o] [-1.2 o ; 1.2 o]

Localization Performance of Real and Virtual Sound Sources
29 - 22 RTO-MP-HFM-123
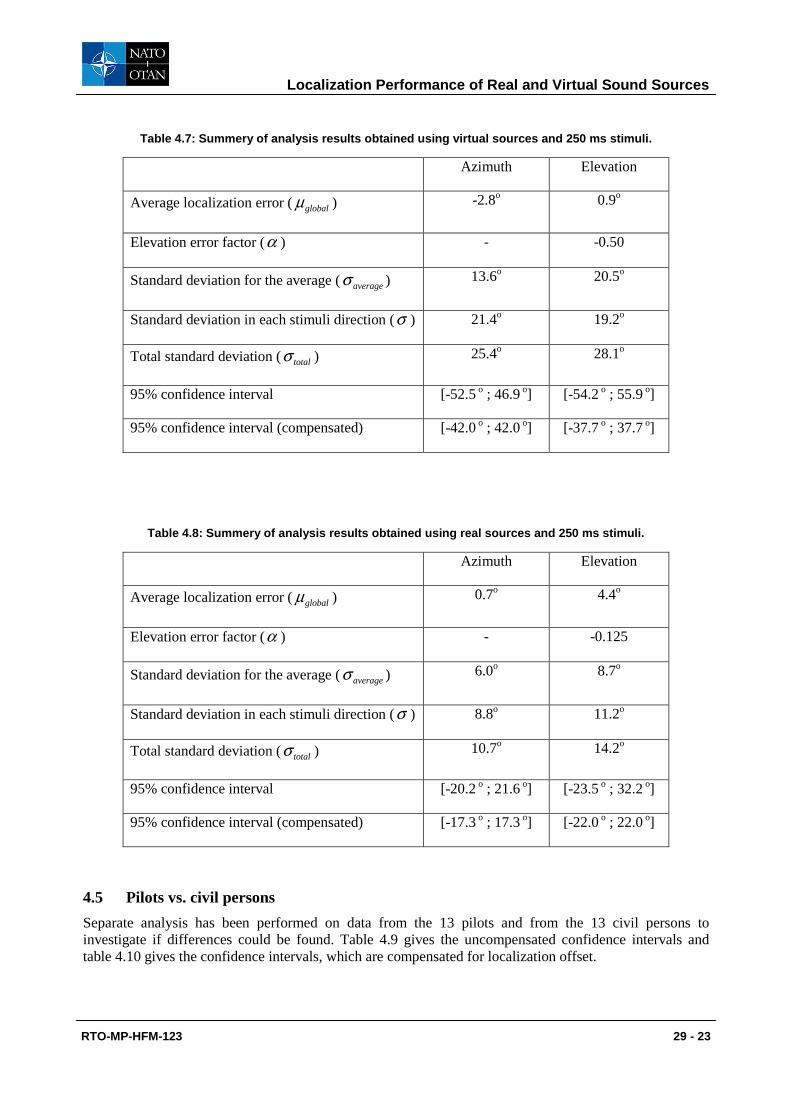
4.4 Summery of results for sound source type and stimuli length
Table 4.5, 4.6, 4.7 and 4.8 gives a summery of the results obtained using the 4 combinations of long/short stimuli and virtual/real sound sources.
Table 4.5: Summery of analysis results obtained using virtual sources and 2 s stimuli.
Azimuth Elevation
Average localization error ( globalµ ) -0.4o 5.7o
Elevation error factor (α ) - -0.25
Standard deviation for the average ( averageσ ) 1.4o 10.1o
Standard deviation in each stimuli direction (σ ) 7.3o 12.1o
Total standard deviation ( totalσ ) 7.4o 15.7o
95% confidence interval [-14.8 o ; 14.1 o] [-25.2 o ; 36.5 o]
95% confidence interval (compensated) [-14.2 o ; 14.2 o] [-23.7 o ; 23.7 o]
Table 4.6: Summery of analysis results obtained using real sources and 2 s stimuli.
Azimuth Elevation
Average localization error ( globalµ ) 0.1o 2.9o
Elevation error factor (α ) - -0.125
Standard deviation for the average ( averageσ ) 1.3o 4.8o
Standard deviation in each stimuli direction (σ ) 4.9o 6.2o
Total standard deviation ( totalσ ) 5.1o 7.8o
95% confidence interval [-9.9 o ; 10.0 o] [-12.4 o ; 18.2 o]
95% confidence interval (compensated) [-9.6 o ; 9.6 o] [-12.1 o ; 12.1 o]
Localization Performance of Real and Virtual Sound Sources
RTO-MP-HFM-123 29 - 23
Table 4.7: Summery of analysis results obtained using virtual sources and 250 ms stimuli.
Azimuth Elevation
Average localization error ( globalµ ) -2.8o 0.9o
Elevation error factor (α ) - -0.50
Standard deviation for the average ( averageσ ) 13.6o 20.5o
Standard deviation in each stimuli direction (σ ) 21.4o 19.2o
Total standard deviation ( totalσ ) 25.4o 28.1o
95% confidence interval [-52.5 o ; 46.9 o] [-54.2 o ; 55.9 o]
95% confidence interval (compensated) [-42.0 o ; 42.0 o] [-37.7 o ; 37.7 o]
Table 4.8: Summery of analysis results obtained using real sources and 250 ms stimuli.
Azimuth Elevation
Average localization error ( globalµ ) 0.7o 4.4o
Elevation error factor (α ) - -0.125
Standard deviation for the average ( averageσ ) 6.0o 8.7o
Standard deviation in each stimuli direction (σ ) 8.8o 11.2o
Total standard deviation ( totalσ ) 10.7o 14.2o
95% confidence interval [-20.2 o ; 21.6 o] [-23.5 o ; 32.2 o]
95% confidence interval (compensated) [-17.3 o ; 17.3 o] [-22.0 o ; 22.0 o]
4.5 Pilots vs. civil persons
Separate analysis has been performed on data from the 13 pilots and from the 13 civil persons to investigate if differences could be found. Table 4.9 gives the uncompensated confidence intervals and table 4.10 gives the confidence intervals, which are compensated for localization offset.

Localization Performance of Real and Virtual Sound Sources
29 - 24 RTO-MP-HFM-123
Table 4.9: 95% confidence intervals – no compensation for localization offset.
Azimuth Elevation
virtual sources – 2 s – pilots [-13.1 o ; 9.5 o] [-26.1 o ; 35.2 o]
virtual sources – 2 s – civil persons [-15.2 o ; 17.5 o] [-24.2 o ; 37.7 o]
real sources – 2 s – pilots [-8.0 o ; 6.7 o] [-11.6 o ; 17.9 o]
real sources – 2 s – civil persons [-10.3 o ; 11.9 o] [-12.8 o ; 18.3 o]
virtual sources – 250 ms – pilots [-57.2 o ; 48.2 o] [-52.4 o ; 57.5 o]
virtual sources – 250 ms – civil persons [-47.6 o ; 45.3 o] [-55.6 o ; 54.1 o]
real sources – 250 ms – pilots [-21.6 o ; 21.6 o] [-25.3 o ; 36.0 o]
real sources – 250 ms – civil persons [-18.4 o ; 21.1 o] [-21.2 o ; 28.0 o]
Table 4.10: Compensated 95% confidence intervals.
Azimuth Elevation
virtual sources – 2 s – pilots [-11.0 o ; 11.0 o] [-22.7 o ; 22.7 o]
virtual sources – 2 s – civil persons [-15.9 o ; 15.9 o] [-24.2 o ; 24.2 o]
real sources – 2 s – pilots [-6.9 o ; 6.9 o] [-11.4 o ; 11.4 o]
real sources – 2 s – civil persons [-10.6 o ; 10.6 o] [-12.0 o ; 12.0 o]
virtual sources – 250 ms – pilots [-41.1 o ; 41.1 o] [-38.3 o ; 38.3 o]
virtual sources – 250 ms – civil persons [-40.5 o ; 40.5 o] [-36.0 o ; 36.0 o]
real sources – 250 ms – pilots [-16.4 o ; 16.4 o] [-24.0 o ; 24.0 o]
real sources – 250 ms – civil persons [-16.9 o ; 16.9 o] [-18.8 o ; 18.8 o]
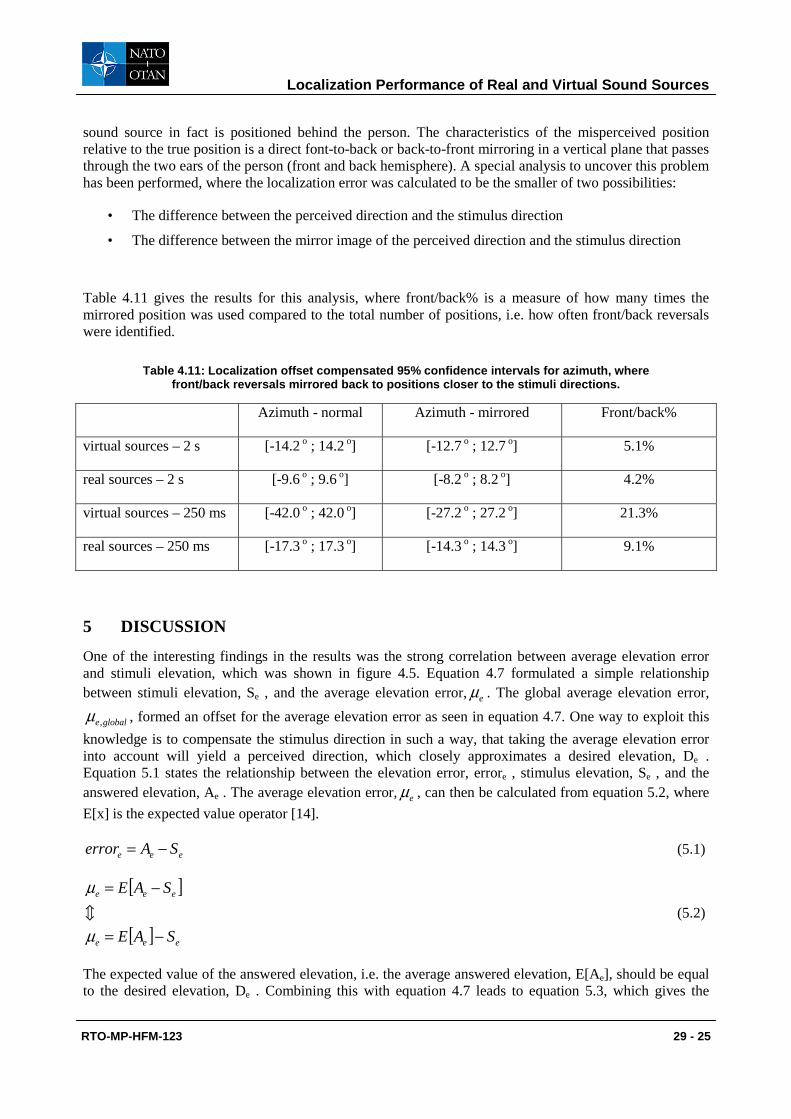
4.6 Front/back reversals
Front-back ambiguity has been found to be a significant problem for 3D-Audio systems, however systems including a head tracker have been shown to almost solve this problem [11]. The front-back ambiguity or front/back reversal occurs when a sound event is perceived in a position in front of the person when the
Localization Performance of Real and Virtual Sound Sources
RTO-MP-HFM-123 29 - 25
sound source in fact is positioned behind the person. The characteristics of the misperceived position relative to the true position is a direct font-to-back or back-to-front mirroring in a vertical plane that passes through the two ears of the person (front and back hemisphere). A special analysis to uncover this problem has been performed, where the localization error was calculated to be the smaller of two possibilities:
• The difference between the perceived direction and the stimulus direction
• The difference between the mirror image of the perceived direction and the stimulus direction
Table 4.11 gives the results for this analysis, where front/back% is a measure of how many times the mirrored position was used compared to the total number of positions, i.e. how often front/back reversals were identified.
Table 4.11: Localization offset compensated 95% confidence intervals for azimuth, where front/back reversals mirrored back to positions closer to the stimuli directions.
Azimuth - normal Azimuth - mirrored Front/back%
virtual sources – 2 s [-14.2 o ; 14.2 o] [-12.7 o ; 12.7 o] 5.1%
real sources – 2 s [-9.6 o ; 9.6 o] [-8.2 o ; 8.2 o] 4.2%
virtual sources – 250 ms [-42.0 o ; 42.0 o] [-27.2 o ; 27.2 o] 21.3%
real sources – 250 ms [-17.3 o ; 17.3 o] [-14.3 o ; 14.3 o] 9.1%
5 DISCUSSION
One of the interesting findings in the results was the strong correlation between average elevation error and stimuli elevation, which was shown in figure 4.5. Equation 4.7 formulated a simple relationship between stimuli elevation, Se , and the average elevation error, eµ . The global average elevation error,
globale,µ , formed an offset for the average elevation error as seen in equation 4.7. One way to exploit this
knowledge is to compensate the stimulus direction in such a way, that taking the average elevation error into account will yield a perceived direction, which closely approximates a desired elevation, De . Equation 5.1 states the relationship between the elevation error, errore , stimulus elevation, Se , and the answered elevation, Ae . The average elevation error, eµ , can then be calculated from equation 5.2, where
E[x] is the expected value operator [14].
eee SAerror −= (5.1)
[ ]
[ ] eee
eee
SAE
SAE
−=
−=
µ
µc (5.2)
The expected value of the answered elevation, i.e. the average answered elevation, E[Ae], should be equal to the desired elevation, De . Combining this with equation 4.7 leads to equation 5.3, which gives the
Localization Performance of Real and Virtual Sound Sources
29 - 26 RTO-MP-HFM-123
relationship between the desired elevation, De , and the stimuli elevation, Se . Isolating the stimuli direction, Se , leads to equation 5.4, which specifies the needed stimuli direction for a given desired elevation in order to compensate for the found relationship between average elevation error and stimuli direction.
globaleeeglobaleeeee SSSSD ,, )1( µαµαµ +•+=++•=+= (5.3)
αµ+
−=
1,globalee
e
DS (5.4)
Both the global average elevation error, globale,µ , and the elevation error factor,α , can be found in tables
4.5, 4.6, 4.7 and 4.8. Using equation 5.4 for calculating the needed stimuli leads generally to stimuli elevation angles larger than the desired elevation angles, e.g. for a desired elevation angle of 60o require a stimuli elevation angle of 72.4o using virtual sources and 2 s stimuli (table 4.5).
However stimuli elevation angles can’t go above +90o or below -90o. This fact imposes a limit onto the range of possible desired elevation angles. Setting the stimuli elevation, Se , to +90o and -90o in equation 5.3 leads to a lower and upper limit for desired elevation angles to -61.8o and +73.2o. The impact of this statement is that positions near the “poles of the sphere”, i.e. -90o elevation and +90o, represents a special challenge, which require further research.
Why should stimuli elevation angle be larger than the desired elevation angle? One possible answer could be that humans are more specialized in localizing in the horizontal plane due to everyday life, where the majority of sound events take place in the same level above the ground as our ears. This combined with the fact that the human ears are located in a way, which favours the discrimination from left to right rather than down to up, may explain why humans has a default localization near the horizontal plane?
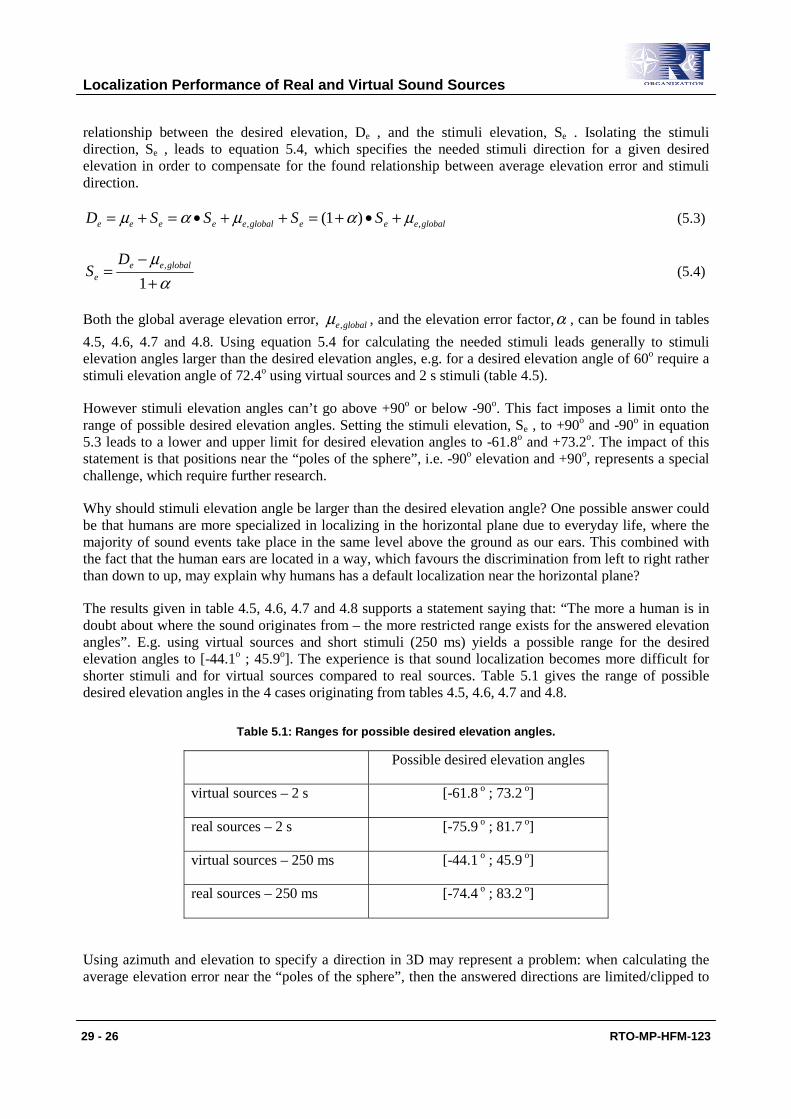
The results given in table 4.5, 4.6, 4.7 and 4.8 supports a statement saying that: “The more a human is in doubt about where the sound originates from – the more restricted range exists for the answered elevation angles”. E.g. using virtual sources and short stimuli (250 ms) yields a possible range for the desired elevation angles to [-44.1o ; 45.9o]. The experience is that sound localization becomes more difficult for shorter stimuli and for virtual sources compared to real sources. Table 5.1 gives the range of possible desired elevation angles in the 4 cases originating from tables 4.5, 4.6, 4.7 and 4.8.
Table 5.1: Ranges for possible desired elevation angles.
Possible desired elevation angles
virtual sources – 2 s [-61.8 o ; 73.2 o]
real sources – 2 s [-75.9 o ; 81.7 o]
virtual sources – 250 ms [-44.1 o ; 45.9 o]
real sources – 250 ms [-74.4 o ; 83.2 o]
Using azimuth and elevation to specify a direction in 3D may represent a problem: when calculating the average elevation error near the “poles of the sphere”, then the answered directions are limited/clipped to

Localization Performance of Real and Virtual Sound Sources
RTO-MP-HFM-123 29 - 27
the range +/- 90o. E.g. for stimuli elevation angle = +90o , where test subjects will point to directions distributed in an area around the “pole of the sphere”. Any position away from the “pole of the sphere” will yield a negative elevation error – the elevation error can’t be positive in this situation by the definition of elevation angle. It follows from this, that even if the answered directions are evenly distributed around the “pole of the sphere”, then the average elevation error will not be zero, i.e. it will be negative. This led to a special analysis, where the average localization error wasn’t spilt into azimuth and elevation error – it was performed as an average of complex numbers, which represented the localization error in polar form. However this didn’t change the result dramatically, but the standard deviation for elevation error did decrease.
Figure 4.9 and 4.10 confirms in a graphical way the fit between the obtained localization errors and the stochastic model including the calculated parameters. Figure 4.10 shows how compensation for the localization offset do decrease the overall localization uncertainty in a significant way. It follows from this, that it is very important to separate the variance due to different localization offsets in different direction from the variance due to localization uncertainty in each direction.
Table 4.4 shows that both the accuracy of the physical setup and the accuracy of the directional data recording system were sufficient compared to the results obtained in the experiment.
Standard deviation for azimuth using real sources and 2 s stimuli was found to be 4.9o (table 4.6), which is comparable to results obtained by other authors: 1.5o (in the stimuli range +/-30o ) [4], 8o (average absolute localization error) [9] and 1o to 3o [8]. The standard deviation for elevation errors using real sources and 2 s stimuli was found to be 6.2o, which again could be compared to the average absolute localization error found by [9]: 8o. Differences in choice of stimuli, stimuli length, physical setup, range and distribution of sound source positions may be possible explanations for these differences. It should be noted, that this experiment covered the full sphere of directions, i.e. combinations of azimuth and elevation covering the full sphere.
Virtual sources and stimuli length of 2 s yielded a standard deviation of 7.3o for azimuth and 12.1o for elevation. The average absolute localization error for virtual sources was found by [9] to be 11o and 10o by [13]. Using short stimuli (250 ms) this was found to increase to 21.4o for azimuth and 19.2o for elevation. This compares to the data presented by [13]: 18o, which was a test restricted to the horizontal plane.
The standard deviations obtained for pilots generally were found to be smaller compared to civil persons. A significantly lower standard deviation was found for azimuth errors for pilots compared to civil persons: 5.0o vs. 8.0o. The ability to focus on a task at hand and to use the input from the auditory system may be an explanation for this result?
The front/back reversal rate was found to be 4.2% (2 s stimuli) and 9.1% (250 ms stimuli) for real sources, which is lower than the results obtained by [9]: 12%. However this shows that even when using real sources the auditory system has a significant rate of front/back reversals. The rate for virtual sources was found to be 5.1% (2 s stimuli) and 21.3% (250 ms). In [9] the front/back reversal rate was found to be 20% for virtual sources and in [13] the rate was found to be 4% (2 s stimuli) and 10% (250 ms). It is clear, that short stimuli, i.e. no head movement, greatly increases the problem with front/back reversals both for real and virtual sources, however the increase was substantially larger for virtual sources.
The main results of the paper show that the uncertainty for azimuth for virtual sources does compare to the real sources. However the uncertainty for elevation is significantly higher for the virtual sources. Actually the uncertainty for elevation for virtual sources (2 s stimuli) compares well with real sources for short stimuli (250 ms). The uncertainty both for azimuth and elevation increased for shorter stimuli, where head movements can’t be used in the localization task. This was particularly clear for virtual sources.

Localization Performance of Real and Virtual Sound Sources
29 - 28 RTO-MP-HFM-123
6 CONCLUSION
The localization uncertainty was much higher for short stimuli (0.25 sec.) compared to long stimuli (2 sec.). The long stimuli enabled head movements to be used in the localization task.
Pilots had a lower localization uncertainty compared to civil persons. Head movements, i.e. long stimuli, greatly reduced the problem of front/back reversals, especially for virtual sound sources.
No significant localization offset was found for azimuth, while an offset for elevation of 3 – 6 degrees was found using long stimuli. A significant difference between the localization offsets (average error) obtained in different directions was found – especially for elevation, where the offset was found to have a strong correlation to the stimuli elevation. It follows from this, that a significant part of the uncertainty for elevation can be removed by compensating for these individual offsets in the different directions (Compensated for localization offset).
A simple formula was devised for calculating the needed stimuli elevation from a desired elevation angle, which generally introduces larger stimuli elevation angles compared to the desired elevation angle.
Due to the needed compensation of elevation angle a restricted range of desired elevation angles was determined, which showed a problem of how to position sound sources near the “poles of the sphere”, i.e. near elevation = +90o and -90o.
The results of the analysis of the obtained directional data compared well to results presented by other authors under the observation that significant differences existed between the different experiments: stimuli, stimuli length, reproduction setup, range and distribution for azimuth and elevation angles and sound source type. This experiment covered the full sphere of directions: both azimuth and elevation.
The localization uncertainty for virtual sound sources was found to be larger than for real sound sources, especially for elevation. However the localization performance of virtual sound sources was comparable to the performance of real sound sources:
95% confidence interval (compensated for offset):
Real Sound Sources: Azimuth=[-9.6 ; 9.6] Elevation=[-12.1 ; 12.1]
Virtual Sources: Azimuth=[-14.2 ; 14.2] Elevation=[-23.7 ; 23.7]
7 ACKNOWLEDGMENT
The authors would like to thank Douglas S. Brungart, Wright-Patterson Air Force Base, for taking part in the early stage discussions about the physical setup for the experiment. Aalborg University is thanked for contributing to the experiment by providing loudspeakers and power amplifiers. The authors would also like to thank their colleagues from AM3D A/S and Terma A/S for contributing to the work, setting up and carrying out the experiment, for inspiration, for their experience and for decisive discussions: Michael Holmberg, Steffen Vang Madsen, Peter Theilgaard Hounum, Preben Schmidt Nielsen, Kim Eriksen, Simon Attermann Brinch, Robert Stepien and Per Schmock. Finally the authors would like to thank the 26 test subject for taking part in the experiment, i.e. 13 pilots from the Royal Danish Air Force, from the Air Force Bases in Aalborg and Karup, Denmark, and 13 civil persons, primary students in Acoustics at Aalborg University, Denmark.

Localization Performance of Real and Virtual Sound Sources
RTO-MP-HFM-123 29 - 29
8 REFERENCES
[1] Douglas S. Brungart: “A Speech-Based Auditory Distance Display”, presented at the AES 109th convention, Los Angeles, 2000, September 22–25. Preprint number 4816.
[2] S. H. Nielsen: “Auditory Distance Perception in Different Rooms”, Journal of the Audio Engineering Society, Volume 41, 1993, pp. 755–770.
[3] A. W. Bronkhorst and T. Houtgast: “Auditory distance perception in rooms”, Nature, Volume 397, 1999, pp. 517-520.
[4] Sylvain Choisel and Karin Zimmer: “A Pointing Technique with Visual Feedback for Sound Source Localization Experiments”, presented at the AES 115th convention, New York, 2003, October 10–13. Preprint number 5904.
[5] Pauli Minnaar: “Simulating an Acoustical Environment with Binaural Technology – investigations of binaural recording and synthesis”, Ph.D. thesis obtained at Aalborg University, Denmark, September 2001.
[6] Pauli Minnaar, Søren Krarup Olesen, Flemming Christensen and Henrik Møller: “Localization with Binaural Recordings from Artificial and Human Heads”, Journal of the Audio Engineering Society, Volume 49, No. 5, 2001, pp. 323–336.
[7] H. Møller, D. Hammershøi, C. B. Jensen and M. F. Sørensen: “Evaluation of artificial heads in listening tests”, Journal of the Audio Engineering Society, Volume 47, No. 3, 1999, pp. 83–100.
[8] J. Blauert: “Spatial hearing: The psychophysics of human sound localization”, MIT Press., Cambridge, USA, Revised edition, 1997.
[9] A. W. Bronkhorst: “Localization of Real and Virtual Sound Sources”, Journal of the Acoustical Society of America, Volume 98, No. 5, 1995, pp. 2542–2553.
[10] D. R. Begault, E. M. Wenzel, A. S. Lee and M. R. Anderson: “Direct comparison of the impact of head tracking, reverberation and individualized head-related transfer functions on the spatial perception of a virtual speech source”, presented at the AES 108th Convention of the Audio Engineering Society, Paris, France, 2000, February 19–22. Preprint number 5134.
[11] F. L. Wightman and D. J. Kistler: “Resolution of front-back ambiguity in spatial hearing by listener and source movement”, Journal of the Acoustical Society of America, Volume 105, No. 5, 1999, pp. 2841–2853.
[12] Company web site for AM3D A/S, including explanation of technology: www.am3d.com
[13] Douglas S. Brungart et al: “The interaction between head-tracker latency, source duration, and response time in the localization of virtual sound sources”, Proceedings of ICAD 04- Tenth Meeting of the International Conference on Auditory Display, Sydney, Australia, July 6-9, 2004.
[14] Sheldon M. Ross: “Introduction to Probability and Statistics for Engineers and Scientists”. ISBN 0-471-60815-7.