locality-preserving dimensionality reduction and classification for
TRANSCRIPT

IEEE TRANSACTIONS ON GEOSCIENCE AND REMOTE SENSING, VOL. 50, NO. 4, APRIL 2012 1185
Locality-Preserving Dimensionality Reduction andClassification for Hyperspectral Image Analysis
Wei Li, Student Member, IEEE, Saurabh Prasad, Member, IEEE, James E. Fowler, Senior Member, IEEE, andLori Mann Bruce, Senior Member, IEEE
Abstract—Hyperspectral imagery typically provides a wealth ofinformation captured in a wide range of the electromagnetic spec-trum for each pixel in the image; however, when used in statisticalpattern-classification tasks, the resulting high-dimensional featurespaces often tend to result in ill-conditioned formulations. Populardimensionality-reduction techniques such as principal componentanalysis, linear discriminant analysis, and their variants typi-cally assume a Gaussian distribution. The quadratic maximum-likelihood classifier commonly employed for hyperspectralanalysis also assumes single-Gaussian class-conditional distribu-tions. Departing from this single-Gaussian assumption, a classifi-cation paradigm designed to exploit the rich statistical structureof the data is proposed. The proposed framework employs localFisher’s discriminant analysis to reduce the dimensionality of thedata while preserving its multimodal structure, while a subsequentGaussian mixture model or support vector machine provides effec-tive classification of the reduced-dimension multimodal data. Ex-perimental results on several different multiple-class hyperspec-tral-classification tasks demonstrate that the proposed approachsignificantly outperforms several traditional alternatives.
Index Terms—Dimensionality reduction, Gaussian-mixture-model (GMM), hyperspectral data, local discriminant analysis,support vector machine.
I. INTRODUCTION
S TATISTICAL PATTERN-CLASSIFICATION systems forthe analysis of hyperspectral imagery (HSI) typically em-
ploy dimensionality reduction followed by classification inorder to learn statistical models for each class in the reduced-dimension feature space, subsequently using that informationto classify unlabeled HSI pixels/samples. Dimensionality-reduction algorithms [1], as the name suggests, are typically de-signed to reduce the dimensionality of the feature space withoutlosing desirable information. HSI data typically have hundreds(even thousands) of spectral bands per pixel, and these bandsare often highly correlated. Dimensionality reduction seeks todecrease computational complexity and ameliorate statisticalill-conditioning by discarding redundant features that can po-tentially deteriorate classification performance [2], [3]. Popu-
Manuscript received April 13, 2011; revised July 19, 2011; acceptedAugust 7, 2011. Date of publication October 3, 2011; date of current versionMarch 28, 2012. This material is based upon the work supported in part bythe National Science Foundation under Grant CCF-0915307 and in part by theNational Geospatial-Intelligence Agency under Grant HM1582-10-1-0001.
The authors are with the Department of Electrical and Computer Engineeringand the Geosystems Research Institute, Mississippi State University, Starkville,MS 39762 USA (e-mail: [email protected]; [email protected];[email protected]; [email protected]).
Color versions of one or more of the figures in this paper are available onlineat http://ieeexplore.ieee.org.
Digital Object Identifier 10.1109/TGRS.2011.2165957
lar dimensionality-reduction techniques include unsupervisedapproaches, such as principal component analysis (PCA) andindependent component analysis (ICA), as well as supervisedapproaches, such as Fisher’s linear discriminant analysis (LDA)[4], [5]. There are numerous variants of these techniques. Forexample, in [6], segmented PCA is applied to group originalbands of the HSI data into subsets of highly correlated adjacentbands which are, however, suboptimal at best for a generalpattern-classification problem [7]. After dimensionality reduc-tion, classification is applied. A popular parametric classifica-tion strategy typically employed after dimensionality reductionis based on the maximum-likelihood estimation (MLE) [8] ofposterior probabilities.
A key limitation to techniques such as PCA, LDA, MLE,and their variants is that they assume that the class-conditionaldistributions are Gaussian [9]. However, real-life observationaldata are often not Gaussian and, in extreme cases, are ac-tually strongly multimodal. PCA and LDA are likely to failas dimensionality-reduction techniques under such conditions.In this paper, we propose a classification paradigm that isdesigned to exploit the rich statistical structure of the data.It does not make the simplifying single-Gaussian assumption,and performs effective dimensionality reduction and classifi-cation of highly non-Gaussian multimodal high-dimensionalHSI data. Toward that goal, we adopt a recently proposedlocal Fisher’s discriminant analysis (LFDA) [10] to reducethe dimensionality of HSI data before employing a Gaussian-mixture-model (GMM) classifier or a support-vector-machine(SVM) classifier. Unlike LDA, LFDA is designed to handlemultimodal non-Gaussian class distributions, and preserves theunderlying structure of such distributions in the projection.
GMM [11] classifiers have proved beneficial for a varietyof classification tasks, such as speech and speaker recognition,biometrics, etc. Although some preliminary studies of GMMshave been undertaken for HSI analysis [12], [13], GMMsare not a popular tool within the hyperspectral-classificationcommunity. The fundamental hesitation most researchers havewhen employing a technique such as GMMs for HSI anal-ysis is the impractical size of the resulting parameter space.Learning such high-dimensional parameter vectors using lim-ited (and costly) ground-truth/training data is highly im-practical. On the other hand, employing conventional lineardimensionality-reduction techniques such as PCA and LDAas preprocessing often destroys the underlying multimodalstructure of the data, rendering GMMs ineffective. In con-trast, in this paper, we adopt locality-preserving dimension-ality reduction—specifically, LFDA—for GMM classification.
0196-2892/$26.00 © 2011 IEEE

1186 IEEE TRANSACTIONS ON GEOSCIENCE AND REMOTE SENSING, VOL. 50, NO. 4, APRIL 2012
Furthermore, we demonstrate that an appropriately optimizedLFDA preprocessing ensures that the GMM models learned inthe HSI feature space do not have an unreasonably large numberof free parameters to be estimated from training data.
LFDA significantly outperforms traditional superviseddimensionality-reduction tools, preserving the multimodalstructure of the data in the reduced-dimension projected space.With that observation, we also test the benefit of LFDA forSVM [14] classifiers. SVMs seek to separate classes by learningan optimal decision hyperplane that best separates the trainingsamples in a kernel-induced feature space. Nonlinear kernelprojections within the SVM framework often help convertnonlinear separation in the input space to a linear separationin the kernel-induced space, wherein a margin-maximizinghyperplane classifier is employed. In recent work [15]–[17],SVMs have been shown to be effective for remote-sensingimage classification, especially when the training-data-set sizeis small. In this paper, we also demonstrate that the locality-preserving property of LFDA yields very effective dimension-ality reduction for SVM classifiers as well. We demonstrate thevarious practical aspects of the proposed algorithms pertinentto HSI classification, including optimizing system parameters(such as the dimensionality of the LFDA projected subspace,GMM initialization, number of Gaussian mixtures, kernel pa-rameter for the SVM classifier, etc).
The remainder of this paper is organized as follows. InSection II, we discuss conventional dimensionality-reductiontechniques and provide a motivation for LFDA-based dimen-sionality reduction for hyperspectral classification. We also pro-vide a description of the LFDA algorithm as well as empiricalevidence of its benefits with a synthetic data set. In Section III,we describe in detail the GMM and SVM classifiers used inthis paper as well as the motivation for employing LFDA asa dimensionality-reduction preprocessing for classification ofHSI data. In Section IV, we provide a description of the ex-perimental hyperspectral data set used to validate the proposedapproach, describe the experimental setup, and show how to op-timize the proposed system. We validate the proposed approachwith several popular hyperspectral remote-sensing data sets,studying the classification performance by comparing to currentstate-of-the-art parametric classification methods over a widerange of practical operating conditions, such as pixel mixingand reduced training-sample size. We conclude by summarizingour results and suggesting future directions in Section V.
II. DIMENSIONALITY REDUCTION
Dimensionality reduction is a critical preprocessing step forHSI analysis. Owing to the dense spectral sampling of HSI data,the associated spectral information in the hyperspectral bands istypically highly correlated and of very high dimension. Hence,dimensionality reduction is commonly applied as a preprocess-ing step to reduce the dimensionality of the data to ensure awell-conditioned representation of the class-conditional statis-tics. Common dimensionality-reduction methods include PCA,LDA, and their many variants, such as subspace LDA [7], step-wise LDA [3], etc. PCA seeks to find a linear transformationwhich projects the data from a high-dimensional space to a
lower dimensional subspace by maximizing the variance of thedata in the projected subspace. The optimal projection in thissense is determined by the eigenvectors corresponding to thelargest eigenvalues of the covariance matrix of the original data.PCA constitutes unsupervised dimensionality reduction and iscommonly employed by researchers for classification and rep-resentation tasks. However, PCA provides, at best, suboptimaldimensionality reduction for classification tasks—that is, it iswell understood that PCA can potentially discard informationuseful to the classification task at hand, particularly if suchinformation is contained along the low-energy directions [7].
On the other hand, LDA is also commonly employed toproject high-dimensional data onto a smaller dimensional sub-space. However, LDA maximizes the between-class scatterwhile minimizing the within-class scatter (more specifically, itseeks to find a transformation that maximizes Fisher’s ratio inthe projected subspace). In that respect, under the assumption ofhomoscedastic Gaussian class-conditional distributions, LDA isoptimized for classification tasks.
The LDA transformation is obtained by solving a generalizedeigenvalue problem
SbΦ = ΛSwΦ (1)
where Λ is the diagonal eigenvalue matrix, Φ is the transforma-tion matrix, Sb is the between-class scatter matrix, and Sw is thewithin-class scatter matrix. Although it is designed to maximizeclass separation in the projected subspace (as measured byFisher’s ratio), it is still suboptimal in that it assumes that class-conditional distributions are Gaussian with a homoscedasticcovariance structure. Such an approach will not perform wellwhen the data are heteroscedastic and can completely breakdown if the data are multimodal. Finally, the dimensionality ofthe projected subspace after an LDA transformation is upperbounded by c− 1 by design (c is the number of classes inthe classification task), which is another major drawback ofLDA, particularly when the dimensionality of the input spaceis very high, and c is small. A significant amount of potentiallyuseful information can be lost when the final dimensionality isdrastically smaller than the dimensionality of the input space.A detailed analysis of PCA, LDA, and their variants can befound in [1] and [7].
A. LFDA
LFDA [10] has been recently proposed as an extension toLDA, which, by not restricting the class distributions to be uni-modal Gaussian, is expected to outperform LDA significantlyfor many practical classification situations. LFDA combines theproperties of LDA and locality-preserving projections (LPP)[18]. Unlike LDA or PCA, LPP is a linear manifold-learningtechnique that seeks to find a linear map that preserves thelocal structure of neighboring samples in the input space. Inother words, after an LPP mapping, neighborhood points in theoriginal input space remain neighbors in the LPP-embeddedspace, and vice versa. In [10], a detailed description of LPPand LFDA is provided. By invoking a similar idea exploitedin LPP, LFDA obtains good between-class separation in the
LI et al.: LOCALITY-PRESERVING DIMENSIONALITY REDUCTION AND CLASSIFICATION 1187
projection while preserving the within-class local structure (i.e.,neighboring data pairs in the original space remain close underthe projection) at the same time. It is hence expected thatLFDA will surpass LDA and LPP as a dimensionality-reductionprojection when the data are significantly non-Gaussian or evenseverely multimodal.
Consider a data set with training samples X = {xi}ni=1
in Rd (d-dimensional feature space) and class labels yi ∈
{1, 2, . . . , c}, where c is the number of classes and n is the totalnumber of training samples. Let nl be the number of availabletraining samples for the lth class,
∑cl=1 nl = n. Define Ai,j ∈
[0, 1] as the affinity between xi and xj
Ai,j = exp
(−‖xi − xj‖2
γiγj
)(2)
where γi = ‖xi − x(knn)i ‖ denotes the local scaling of data
samples in the neighborhood of xi, and x(knn)i is the knn-nearest
neighbor of xi. Ai,j is then a symmetric matrix (referred to asthe affinity matrix) of size n× n which measures the distanceamong data samples. Note that there are clearly many differentways to define an affinity matrix, but the heat kernel, as definedin (2), has been shown to result in very effective locality-preserving properties.
In LFDA, the local between-class S(lb) and within-classS(lw) scatter matrices are defined as
S(lb) =1
2
n∑i,j=1
W(lb)i,j (xi − xj)(xi − xj)
� (3)
S(lw) =1
2
n∑i,j=1
W(lw)i,j (xi − xj)(xi − xj)
� (4)
where W (lb) and W (lw) are n× n matrices defined as
W(lb)i,j =
{Ai,j(1/n− 1/nl), if yi = yj = l1/n, if yi �= yj
(5)
W(lw)i,j =
{Ai,j/nl, if yi = yj = l0, if yi �= yj .
(6)
Maximizing Fisher’s ratio as defined using the local scattermatrices, we have that
ΦLFDA = arg maxΦLFDA
tr
[(Φ�
LFDAS(lw)ΦLFDA
)−1
Φ�LFDAS
(lb)ΦLFDA
](7)
is given by S(lb)ΦLFDA = ΛS(lw)ΦLFDA, where Λ is the diag-onal eigenvalue matrix and ΦLFDA ∈ R
d is the transformationmatrix.
It is readily seen that, in LFDA, the global between- andwithin-class scatter matrices in the original expression forFisher’s ratio are replaced by their local versions defined in (3)and (4). LFDA can thus be viewed as a localized variant of LDAbecause it does not force far-apart data pairs of the same classto be close. Another way to picture this is as follows. By design,
the contribution of samples within a class that are far apart tothe scatter matrix is very small, while that of samples that areclose to each other is significantly higher. On the other hand, intraditional LDA, all samples within a class contribute equallyto the scatter matrices. When class-conditional distributionsare significantly multimodal, traditional LDA fails because inestimating global scatter across all samples within a class, thelocal structure of the samples distributed over the various modesis lost. LFDA, on the other hand, treats samples of a class withineach cluster/mode independently when estimating the scattermatrices, thereby preserving local neighborhoods even whenthe data distributions are complex. Hence, the linear projectionlearned using LFDA can be expected to maximize Fisher’sratio (from between- to within-class scatter) even when inputclass-conditional distributions are multimodal. Clearly, whenAi,j = 1 ∀i, j, LFDA degenerates to traditional LDA. Due tothe data-dependent weighting by W in the estimation of thescatter matrices, unlike LDA, the final dimensionality after anLFDA projection is not upper bounded by c− 1.
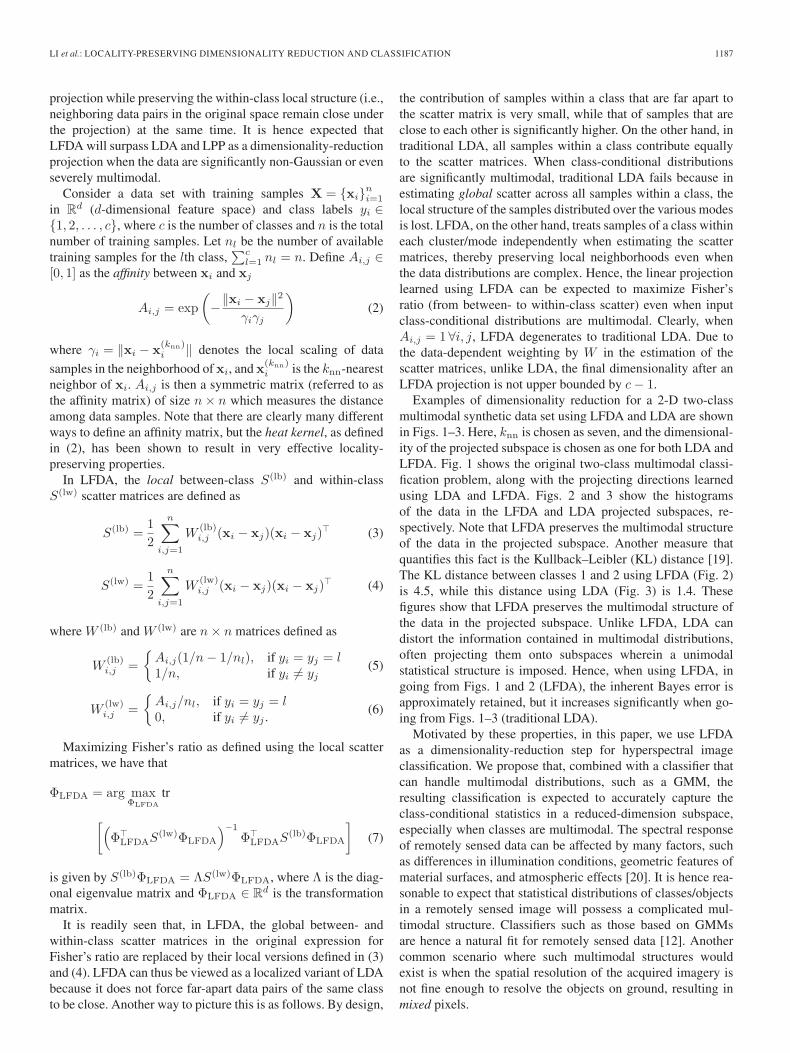
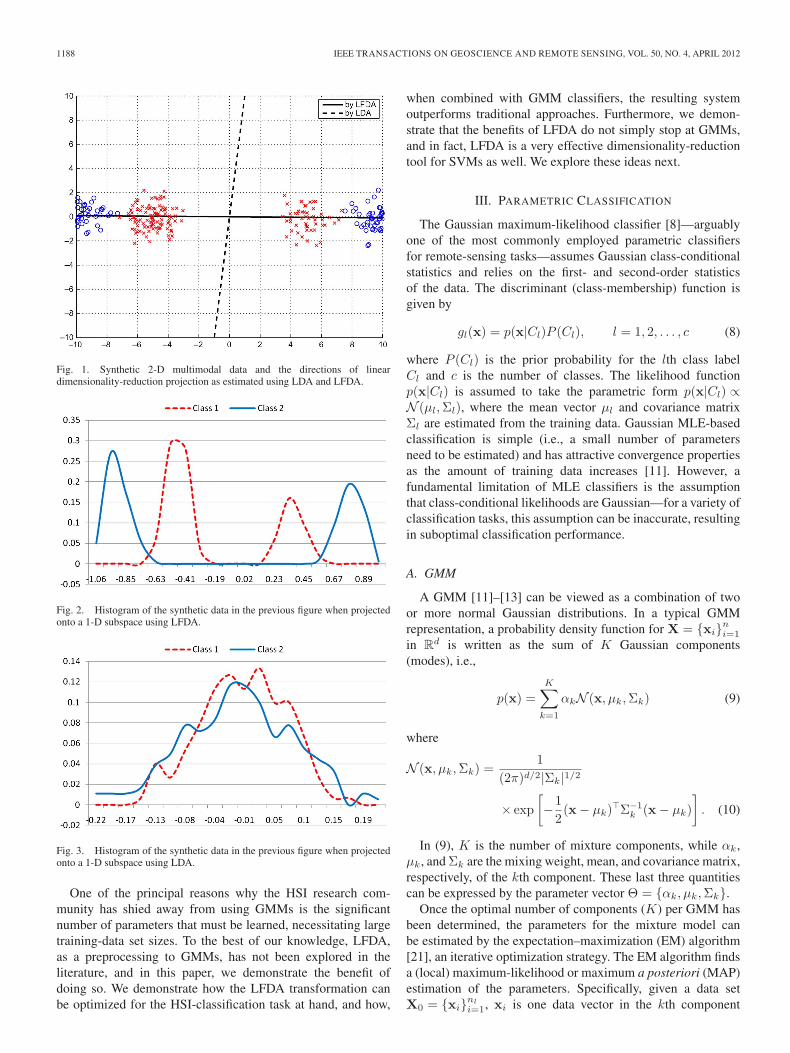
Examples of dimensionality reduction for a 2-D two-classmultimodal synthetic data set using LFDA and LDA are shownin Figs. 1–3. Here, knn is chosen as seven, and the dimensional-ity of the projected subspace is chosen as one for both LDA andLFDA. Fig. 1 shows the original two-class multimodal classi-fication problem, along with the projecting directions learnedusing LDA and LFDA. Figs. 2 and 3 show the histogramsof the data in the LFDA and LDA projected subspaces, re-spectively. Note that LFDA preserves the multimodal structureof the data in the projected subspace. Another measure thatquantifies this fact is the Kullback–Leibler (KL) distance [19].The KL distance between classes 1 and 2 using LFDA (Fig. 2)is 4.5, while this distance using LDA (Fig. 3) is 1.4. Thesefigures show that LFDA preserves the multimodal structure ofthe data in the projected subspace. Unlike LFDA, LDA candistort the information contained in multimodal distributions,often projecting them onto subspaces wherein a unimodalstatistical structure is imposed. Hence, when using LFDA, ingoing from Figs. 1 and 2 (LFDA), the inherent Bayes error isapproximately retained, but it increases significantly when go-ing from Figs. 1–3 (traditional LDA).
Motivated by these properties, in this paper, we use LFDAas a dimensionality-reduction step for hyperspectral imageclassification. We propose that, combined with a classifier thatcan handle multimodal distributions, such as a GMM, theresulting classification is expected to accurately capture theclass-conditional statistics in a reduced-dimension subspace,especially when classes are multimodal. The spectral responseof remotely sensed data can be affected by many factors, suchas differences in illumination conditions, geometric features ofmaterial surfaces, and atmospheric effects [20]. It is hence rea-sonable to expect that statistical distributions of classes/objectsin a remotely sensed image will possess a complicated mul-timodal structure. Classifiers such as those based on GMMsare hence a natural fit for remotely sensed data [12]. Anothercommon scenario where such multimodal structures wouldexist is when the spatial resolution of the acquired imagery isnot fine enough to resolve the objects on ground, resulting inmixed pixels.
1188 IEEE TRANSACTIONS ON GEOSCIENCE AND REMOTE SENSING, VOL. 50, NO. 4, APRIL 2012
Fig. 1. Synthetic 2-D multimodal data and the directions of lineardimensionality-reduction projection as estimated using LDA and LFDA.
Fig. 2. Histogram of the synthetic data in the previous figure when projectedonto a 1-D subspace using LFDA.
Fig. 3. Histogram of the synthetic data in the previous figure when projectedonto a 1-D subspace using LDA.
One of the principal reasons why the HSI research com-munity has shied away from using GMMs is the significantnumber of parameters that must be learned, necessitating largetraining-data set sizes. To the best of our knowledge, LFDA,as a preprocessing to GMMs, has not been explored in theliterature, and in this paper, we demonstrate the benefit ofdoing so. We demonstrate how the LFDA transformation canbe optimized for the HSI-classification task at hand, and how,
when combined with GMM classifiers, the resulting systemoutperforms traditional approaches. Furthermore, we demon-strate that the benefits of LFDA do not simply stop at GMMs,and in fact, LFDA is a very effective dimensionality-reductiontool for SVMs as well. We explore these ideas next.
III. PARAMETRIC CLASSIFICATION
The Gaussian maximum-likelihood classifier [8]—arguablyone of the most commonly employed parametric classifiersfor remote-sensing tasks—assumes Gaussian class-conditionalstatistics and relies on the first- and second-order statisticsof the data. The discriminant (class-membership) function isgiven by
gl(x) = p(x|Cl)P (Cl), l = 1, 2, . . . , c (8)
where P (Cl) is the prior probability for the lth class labelCl and c is the number of classes. The likelihood functionp(x|Cl) is assumed to take the parametric form p(x|Cl) ∝N (µl,Σl), where the mean vector µl and covariance matrixΣl are estimated from the training data. Gaussian MLE-basedclassification is simple (i.e., a small number of parametersneed to be estimated) and has attractive convergence propertiesas the amount of training data increases [11]. However, afundamental limitation of MLE classifiers is the assumptionthat class-conditional likelihoods are Gaussian—for a variety ofclassification tasks, this assumption can be inaccurate, resultingin suboptimal classification performance.
A. GMM
A GMM [11]–[13] can be viewed as a combination of twoor more normal Gaussian distributions. In a typical GMMrepresentation, a probability density function for X = {xi}ni=1
in Rd is written as the sum of K Gaussian components
(modes), i.e.,
p(x) =
K∑k=1
αkN (x, µk,Σk) (9)
where
N (x, µk,Σk) =1
(2π)d/2|Σk|1/2
× exp
[−1
2(x− µk)
�Σ−1k (x− µk)
]. (10)
In (9), K is the number of mixture components, while αk,µk, and Σk are the mixing weight, mean, and covariance matrix,respectively, of the kth component. These last three quantitiescan be expressed by the parameter vector Θ = {αk, µk,Σk}.
Once the optimal number of components (K) per GMM hasbeen determined, the parameters for the mixture model canbe estimated by the expectation–maximization (EM) algorithm[21], an iterative optimization strategy. The EM algorithm findsa (local) maximum-likelihood or maximum a posteriori (MAP)estimation of the parameters. Specifically, given a data setX0 = {xi}nl
i=1, xi is one data vector in the kth component

LI et al.: LOCALITY-PRESERVING DIMENSIONALITY REDUCTION AND CLASSIFICATION 1189
subset Qk, and nl is the number of samples in Qk. The resultingcomplete data log-likelihood is
L(Θ,X0) =K∑
k=1
∑i∈Qk
p(k|xi,Θ) log [αkN (xi, µk,Σk)] (11)
where p(k|xi,Θ) is the posterior probability for the kth com-ponent of the GMM and can be written as
p(k|xi,Θ) =αkN (xi, µk,Σk)∑Kk=1 αkN (xi, µk,Σk)
. (12)
At each iteration, the parameter Θ is obtained by max-imizing the likelihood function L(Θ,X0) described in (11)(the M-step). The parameter set is then updated (12) with anexpected value of these parameters for the next iteration (theE-step)
α̂k =1
nl
nl∑i=1
p(k|xi,Θ) (13)
µ̂k =
∑nl
i=1 p(k|xi,Θ)xi∑nl
i=1 p(k|xi,Θ)(14)
Σ̂k =
∑nl
i=1 p(k|xi,Θ)(x− µk)(x− µk)�∑nl
i=1 p(k|xi,Θ). (15)
The aforementioned procedure is iterated until the relativedifference between successive values of the complete datalog-likelihood provided by (11) reaches some predeterminedconvergence threshold [22].
Estimating an appropriate number of components/modes (K)is important to successful learning and deployment of GMMsfor classification tasks. The Akaike information criterion (AIC)[23] is a commonly employed metric to estimate an optimalvalue for K. For the parameter vector Θ, the AIC is expressedin terms of the likelihood function as
AIC(Θ) = −2Lmax(Θ,X0) + 2K (16)
where Lmax(Θ,X0) is the maximum log-likelihood functionaccording to each model and K is the number of clusters to beestimated. The preferred model is the one with the minimumAIC(Θ) value.
The Bayes information criterion (BIC) [24] is another metriccommonly used for estimating an optimal value of K in GMMmodels, and it is given as
BIC = −2Lmax(Θ,X0) +K log(n) (17)
where n is the total number of samples. It has been reported inthe pattern-recognition community (i.e., [25]) that, for certainapplications, the AIC tends to overestimate the value of K,while the BIC often yields a much smaller K and is hence moreeffective. In this paper,we study the efficacy of both the AIC andBIC for GMM-based classification of high-dimensional HSI.
As we mentioned previously, the size of the resulting pa-rameter space often makes GMMs impractical in HSI-analysistasks. For example, if the HSI data are d dimensional, thenthe resulting dimensionality of the parameter space for aK-component GMM, assuming full covariance matrices, is
K(1 + d(d− 1)/2) +Kd. For d = 100 and K = 10 (a reason-able choice for the HSI dimensionality and number of mixturecomponents, respectively), the resulting parameter space hasdimension 50 510. Learning such high-dimensional parametervectors using limited (and costly) ground-truth/training data ishighly impractical.
We have demonstrated in Section II how LFDA can sig-nificantly outperform LDA as a dimensionality-reduction tool,preserving the multimodal structure of the data in the reduced-dimension projected space. Consider the hypothetical exampleprovided earlier—for an LFDA projection of a 100-D spaceonto a 10-D subspace, the resulting parameter space for a ten-mixture GMM reduces from 50 510 down to 560. We henceargue that LFDA serves as an ideal dimensionality-reductionprojection for GMM classifiers; we test this hypothesis for achallenging hyperspectral-classification task in the experimen-tal results to follow in Section IV. First, we consider SVMs asan alternative to GMMs for classification.
B. SVM
For a training-data set X = {xi}ni=1 in Rd with class labels
yi ∈ {+1,−1} and a nonlinear kernel mapping φ(·), an SVM[16] classifies binary data by determining an optimal hyper-plane in the kernel-induced space by solving
minω,ξi,b
{1
2‖ω‖2 + ς
n∑i=1
ξi
}(18)
subject to the constraints
yi (〈φ(ω,xi)〉+ b) ≥ 1− ξi (19)
for ξi ≥ 0 and i = 1, . . . , n, where ω is normal to the optimaldecision hyperplane (i.e., 〈ω, φ(x)〉+ b = 0), n denotes thenumber of samples, b is the bias term, ς is the regularizationparameter which controls the generalization capacity of themachine, and ξi is the positive slack variable allowing one to ac-commodate permitted errors appropriately. The aforementionedproblem is solved by maximizing its Lagrangian dual form [17]
maxα
n∑
i=1
αi −1
2
n∑i,j=1
αiαiyiyjK(xi,xj)
(20)
where α1, α2, . . . , αn are nonzero Lagrange multipliers con-strained to 0 ≤ αi ≤ ς , and Σiαiyi = 0, for i = 1, . . . , n. Somecommonly implemented kernel functions are the linear kernel,the polynomial kernel, and the radial-basis-function (RBF)kernel [16]. In this paper, RBF is considered
K(xi,xj) = exp
(−‖xi − xj‖2
2σ2
)(21)
where σ is a width parameter characterizing the RBF. Finally,the decision function is represented as
f(x) = sgn
(n∑
i=1
yiαiK(xi,x) + b
). (22)
1190 IEEE TRANSACTIONS ON GEOSCIENCE AND REMOTE SENSING, VOL. 50, NO. 4, APRIL 2012
As mentioned before, traditional SVMs are binary classi-fiers by design. Various approaches exist to extend the binarySVMs to tasks involving more than two classes [26], [27].The most popular approach is one-against-all [28], which trainsthe SVM for every possible class pair. It is common to em-ploy a backward feature-reduction algorithm—recursive fea-ture elimination (RFE) [28]—to eliminate redundant featuresthat do not contribute positively to the SVM classifier. TheRFE approach focuses on retaining features that maximize theseparation margin while minimizing the generalization error.RFE-SVM is therefore becoming increasingly popular in high-dimensional classification applications, such as HSI analysis[15]–[17]. Hence, it serves as a powerful baseline against whichto compare our proposed methods.
In this paper, we demonstrate the use of LFDA as an alternatedimensionality-reduction tool for SVM classifiers. The locality-preserving quality of LFDA is the key motivation behind study-ing its benefits with SVM classifiers for HSI classification.By preserving locality and neighborhood relations, complexnonlinear decision surfaces in the input space are expected tobe preserved in the low-dimensional LFDA projected subspace,wherein an SVM classifier can operate to attain linear separa-tion in a kernel-induced space. Furthermore, since the LFDAembedding optimizes Fisher’s ratio, one can be assured that theprojected subspace will possess good class separation.
IV. EXPERIMENTAL RESULTS
In this section, we validate our approach with several popularHSI data sets and present experimental results demonstrat-ing the benefits of LFDA-based dimensionality reduction fornonlinear classifiers such as GMMs and SVMs. We reportthe performance of classification systems as measured by theoverall classification accuracy, along with the 95% confidenceintervals for these estimates. The primary objectives of theexperimental results reported in the next two subsections areas follows: 1) tuning the parameters of the classification sys-tem (dimensionality reduction and classification) for the HSItask at hand and 2) quantifying the efficacy of LFDA-baseddimensionality reduction for HSI classification and comparingit to that of traditional state-of-the-art methods commonlyemployed by researchers in the HSI community, over a widerange of operating conditions (i.e., studying the sensitivity ofthe classification algorithm to the amount of training data used,as well as the extent of pixel mixing in the data set). All dataused in this paper are normalized to have a range of [0, 1].
A. Experimental Hyperspectral Data
The first experimental HSI data set employed was acquiredusing the National Aeronautics and Space Administration’sAirborne Visible/Infrared Imaging Spectrometer sensor andwas collected over northwest Indiana’s Indian Pines test sitein June 1992.1 The image represents a vegetation-classificationscenario with 145 × 145 pixels and 220 bands in the 0.4- to
1ftp://ftp.ecn.purdue.edu/biehl/MultiSpec.
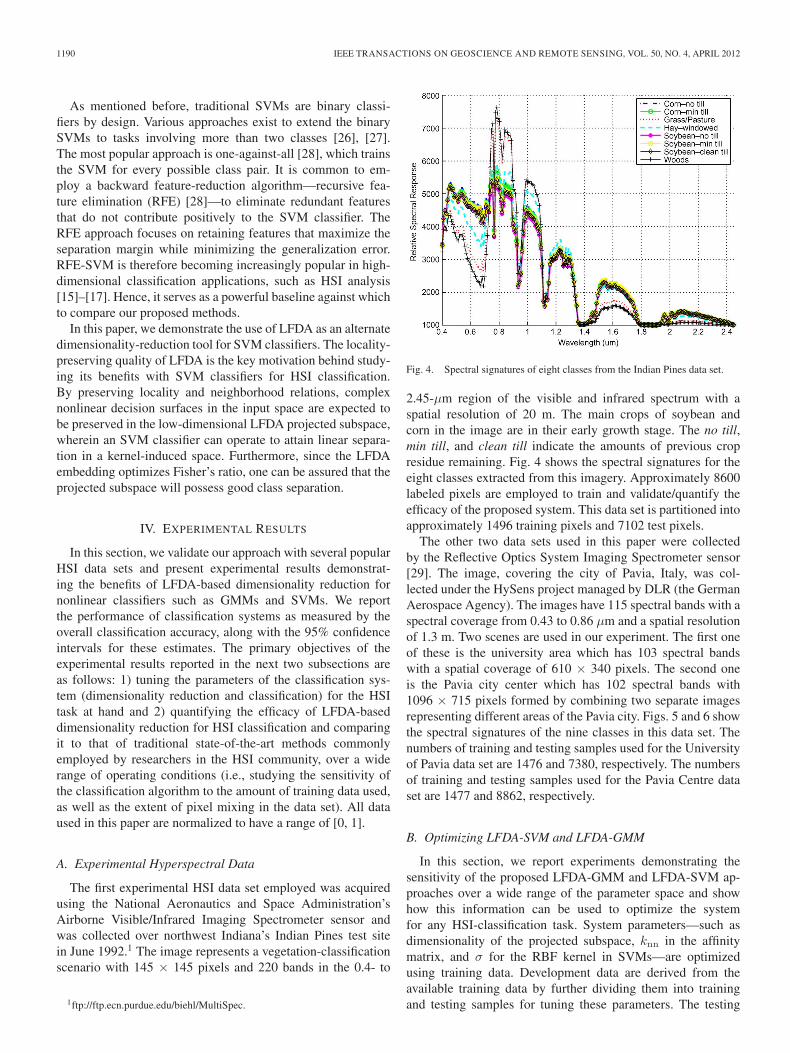
Fig. 4. Spectral signatures of eight classes from the Indian Pines data set.
2.45-µm region of the visible and infrared spectrum with aspatial resolution of 20 m. The main crops of soybean andcorn in the image are in their early growth stage. The no till,min till, and clean till indicate the amounts of previous cropresidue remaining. Fig. 4 shows the spectral signatures for theeight classes extracted from this imagery. Approximately 8600labeled pixels are employed to train and validate/quantify theefficacy of the proposed system. This data set is partitioned intoapproximately 1496 training pixels and 7102 test pixels.
The other two data sets used in this paper were collectedby the Reflective Optics System Imaging Spectrometer sensor[29]. The image, covering the city of Pavia, Italy, was col-lected under the HySens project managed by DLR (the GermanAerospace Agency). The images have 115 spectral bands with aspectral coverage from 0.43 to 0.86 µm and a spatial resolutionof 1.3 m. Two scenes are used in our experiment. The first oneof these is the university area which has 103 spectral bandswith a spatial coverage of 610 × 340 pixels. The second oneis the Pavia city center which has 102 spectral bands with1096 × 715 pixels formed by combining two separate imagesrepresenting different areas of the Pavia city. Figs. 5 and 6 showthe spectral signatures of the nine classes in this data set. Thenumbers of training and testing samples used for the Universityof Pavia data set are 1476 and 7380, respectively. The numbersof training and testing samples used for the Pavia Centre dataset are 1477 and 8862, respectively.
B. Optimizing LFDA-SVM and LFDA-GMM
In this section, we report experiments demonstrating thesensitivity of the proposed LFDA-GMM and LFDA-SVM ap-proaches over a wide range of the parameter space and showhow this information can be used to optimize the systemfor any HSI-classification task. System parameters—such asdimensionality of the projected subspace, knn in the affinitymatrix, and σ for the RBF kernel in SVMs—are optimizedusing training data. Development data are derived from theavailable training data by further dividing them into trainingand testing samples for tuning these parameters. The testing

LI et al.: LOCALITY-PRESERVING DIMENSIONALITY REDUCTION AND CLASSIFICATION 1191
Fig. 5. Spectral signatures of nine classes from the University of Paviadata set.
Fig. 6. Spectral signatures of nine classes from the Pavia Centre data set.
accuracy obtained using this development data set is used togauge an effective range for the system parameters to ensure areliable classification performance.
As we mentioned previously, unlike traditional LDA, thedimensionality of the LFDA projected subspace is not restrictedto c− 1. As a result, when LFDA is applied for dimensionalityreduction of hyperspectral data, we need to find an optimaldimensionality for the LFDA projection. It is also expected thatthe knn term used to estimate γi in (2) will affect the affinitymatrix in LFDA. Fig. 7 shows the overall development-dataaccuracy of LFDA-GMM as a function of knn and reduceddimension for the University of Pavia HSI data set. It is clearfrom Fig. 7 that the system is sensitive to the choice of systemparameters, but these follow a systematic trend, consistentlyseen across all the data sets. In particular, it can be seen thatthe performance peaks at small values of both the reduceddimension and knn. The optimal dimensionality of the LFDAprojected subspace is expected to vary with the data set athand. However, as can be seen in Fig. 7, an optimal value of
Fig. 7. LFDA-GMM for the University of Pavia data set: Overall developmentaccuracy versus reduced dimension and parameter knn.
the reduced-dimension parameter for all data sets is obviouslysmaller than the true dimensionality of the input space. Forexample, a reduced dimension of ten appears to be optimalfor the University of Pavia data set. Although the extent ofdimensionality reduction is significant in such a projection, aGMM classifier trained on the LFDA projected subspace is ex-pected to capture the underlying statistical structure accuratelywithout the accompanying excessive overdimensionality of theresulting parameter vector that would have been experienced ifit were trained on the original input space.
Fig. 8 shows the overall development-data accuracy ofLFDA-SVM for the University of Pavia data set. The SVMperformance is known to be sensitive to the width parameter(σ) for the RBF kernel in (21), as is LFDA to the reduceddimension and knn. We performed a grid search over a widerange of all these system parameters, studying the development-data accuracy as a function of these parameters. In a practicalsetting, one can study these performance curves to optimallytune the system. Fig. 9 shows the overall development-dataaccuracy as a function of reduced dimension for the RFE-SVMbaseline algorithm with several values of σ. Table I summa-rizes the optimal parameters that we chose for LFDA-GMM,LFDA-SVM, and RFE-SVM. We note that the optimal re-duced dimension for LFDA-SVM is obviously smaller thanthat for RFE-SVM. This further suggests that LFDA is ableto find a transformation that can significantly reduce the di-mensionality while preserving the rich statistical structure ofthe data—something that a feature-elimination strategy cannotachieve.
The quality (i.e., the accuracy or goodness of fit) of theGMM model learned from the training data is sensitive to theinitialization of the parameter space, because the convergenceof the EM algorithm employed in GMM training would dependon the initial seed selection of the parameter space. In thispaper, as is commonly done, a K-means clustering is usedfor initializing the parameter vector [30]. To determine anappropriate value of K, we incrementally increase the num-ber of mixture components. Following this, a metric such asBIC or AIC is employed to determine the optimal number of

1192 IEEE TRANSACTIONS ON GEOSCIENCE AND REMOTE SENSING, VOL. 50, NO. 4, APRIL 2012
Fig. 8. LFDA-SVM for the University of Pavia data set: Overall developmentaccuracy versus reduced dimension, knn, and σ.
components for the GMM. Table II shows the number ofmixtures estimated using these two metrics for the Pavia Centredata set. The maximum number of components per class is setto five, and each column in the table corresponds to a uniqueclass in the data set. From Table II, we observe that the numberof components estimated using AIC is consistently greaterthan that estimated using BIC. We found the overall accuracywith AIC to be almost the same as that with BIC. Hence, weconclude that, for such HSI-classification tasks, BIC is better
Fig. 9. RFE-SVM for the University of Pavia data set: Overall developmentaccuracy versus reduced dimension and σ.
TABLE IOPTIMAL PARAMETERS FOR THE VARIOUS ALGORITHMS AFTER
TUNING FOR EXPERIMENTAL HYPERSPECTRAL DATA
TABLE IINUMBER OF COMPONENTS ESTIMATED USING BIC AND AIC FOR THE
PAVIA CENTRE DATA SET, WITH TA VARYING FROM 100% TO 50%
suited to determine the number of mixtures in the GMM model;we thus employ BIC in all experiments that follow. It is alsoimportant to point out that a full covariance matrix is used andlearned for each Gaussian mode in the GMM models. To furtherreduce complexity, a diagonal covariance matrix can be used,but that is not necessary in this paper because of the significantdimensionality reduction already attained by LFDA.

LI et al.: LOCALITY-PRESERVING DIMENSIONALITY REDUCTION AND CLASSIFICATION 1193
Fig. 10. Indian Pines: Overall accuracy versus pixel-mixing abundance, both expressed in percentage, for several different classification methods.
Fig. 11. University of Pavia: Overall accuracy versus pixel-mixing abundance, both expressed in percentage, for several different classification methods.
Fig. 12. Pavia Centre: Overall accuracy versus pixel-mixing abundance, both expressed in percentage, for several different classification methods.
C. Comparison Against Current State-of-the-Art ParametricClassification Techniques
To demonstrate the benefits of LFDA as a powerfuldimensionality-reduction tool for HSI classification, we com-pare its performance using GMM and SVM classifiers withthat of other traditional dimensionality-reduction methods, in-cluding LDA, regularized LDA (RLDA), and subspace LDA.Data distribution in LDA-projected subspaces tends to be Gaus-sian, which is hence followed by the conventional quadraticGaussian MLE classifier. RLDA [31] alleviates the problem ofan unstable inverse commonly encountered in traditional LDAunder small-sample-size and high-dimensionality situations.The resulting algorithms are thus referred to as LDA-MLE andRLDA-MLE in this paper.
In subspace LDA [7], an intermediate PCA transformation isemployed to discard the null space of the within-class scattermatrix, following which LDA is applied. This is an alternatemechanism to alleviate ill-conditioning in LDA formulations.Additionally, subspace LDA is an interesting algorithm towhich to compare LFDA, since LFDA essentially combinesLPP (an unsupervised linear manifold learning) and LDA (asupervised dimensionality reduction) to exploit the benefits ofLPP within the LDA setup. Subspace LDA followed by GMM(subspace LDA-GMM) is hence another algorithm we study tohighlight the benefits of LFDA-GMM.
By design, LDA, RLDA, and subspace LDA result in a(c− 1)-dimensional feature subspace after the dimensionality-reduction projection. The extent of dimensionality reductionafter LFDA, as discussed previously, is determined by studying

1194 IEEE TRANSACTIONS ON GEOSCIENCE AND REMOTE SENSING, VOL. 50, NO. 4, APRIL 2012
Fig. 13. Indian Pines: Overall accuracy (expressed in percentage) versus the training-data set size.
Fig. 14. University of Pavia: Overall accuracy (expressed in percentage) versus the training-data set size.
Fig. 15. Pavia Centre: Overall accuracy (expressed in percentage) versus the training-data set size.
the performance as a function of different subspace dimensionsand choosing a value that maximizes the development-dataaccuracy.
Another algorithm that we will employ as a baseline is RFE-SVM, which is an established and powerful dimensionality-reduction and classification approach. Finally, we recentlystudied a kernel extension of the LFDA algorithm—kernelLFDA with MLE classifier (KLFDA-MLE) for HSI clas-sification [32]. We found KLFDA-MLE to outperformpowerful approaches such as RFE-SVM in [28]. In thispaper, we use this as an additional baseline algorithm towhich to compare the performance of LFDA-SVM andLFDA-GMM.
A comparison of the proposed methods (LFDA-GMM andLFDA-SVM) with these state-of-the-art parametric classifica-tion techniques is shown in Figs. 10–18. To simulate real-
life challenging operating conditions, we provide results fora wide range of pixel-mixing conditions. In many situations,the spatial resolution may not be fine enough to resolve theobject of interest on ground, and inadvertent mixing betweenmultiple classes may occur [33]. In this experiment, we usethe data sets described previously and linearly mix signaturesfrom background classes with the signature of the class beingclassified. We report results over a range of percentage target-abundance (TA) values. For example, a TA of 70% indicatesthat 30% of background signatures were mixed linearly with70% of the target class. An abundance of 100% implies thatpure pixels are employed without any mixing. Here, “targetclass” simply refers to the true class of the pixel currentlybeing classified/tested. The background signatures/pixels usedfor mixing the target class are gathered (with uniform weights)from across all the other classes.
LI et al.: LOCALITY-PRESERVING DIMENSIONALITY REDUCTION AND CLASSIFICATION 1195
Figs. 10–12 show the overall accuracy as a function ofTA for all four HSI data sets. The methods proposed in thispaper—both LFDA-GMM and LFDA-SVM—are indeed verypowerful classification approaches, outperforming traditionalstate-of-the-art approaches significantly, even under adverse TAconditions.
We also conducted an experiment wherein we varied theamount of training data and studied the sensitivity of the pro-posed methods relative to conventional methods over a range oftraining-data set sizes [34]. In practical situations, the numberof training samples available is often insufficient to estimatemodels for each class. We report the overall accuracy of theseclassification systems as a function of the relative training-sample size in Figs. 13–15. This relative training-sample size(on the horizontal axis) is expressed relative to the spectraldimensionality of the HSI data. Hence, an abundance of 6Nimplies that the amount of training data used is six timesthe dimensionality of the feature space (here, N denotes thedimensionality of the original feature space, or the number ofspectral bands for this classification task). To avoid any spatialbiases, we randomly chose a subset of training samples foreach sample-size value and repeated the experiment 20 times,reporting the average classification accuracy. Note that, withdecreasing training-data set size, the overall accuracy for allsystems decreases, as expected. However, the overall accuracyof LFDA-GMM and LFDA-SVM is always higher than that ofthe other baseline methods. Even at a very low training-data setsize (e.g., 3.4N in Fig. 10), the performance of the proposedmethods is impressive.
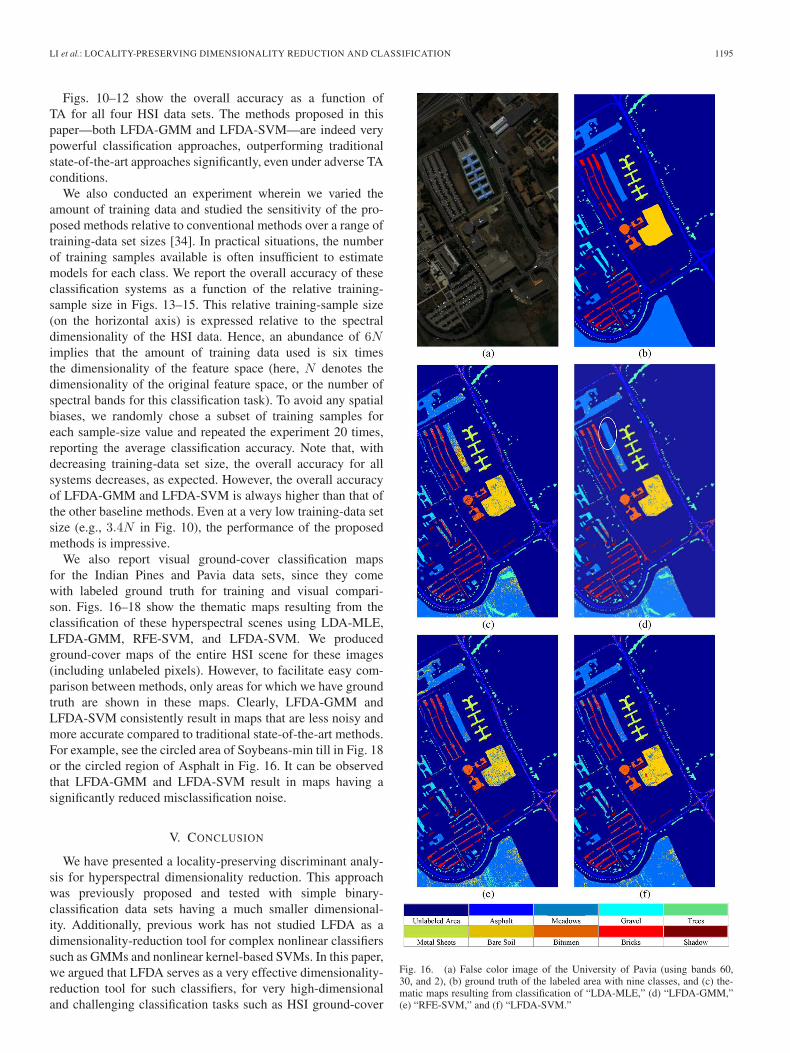
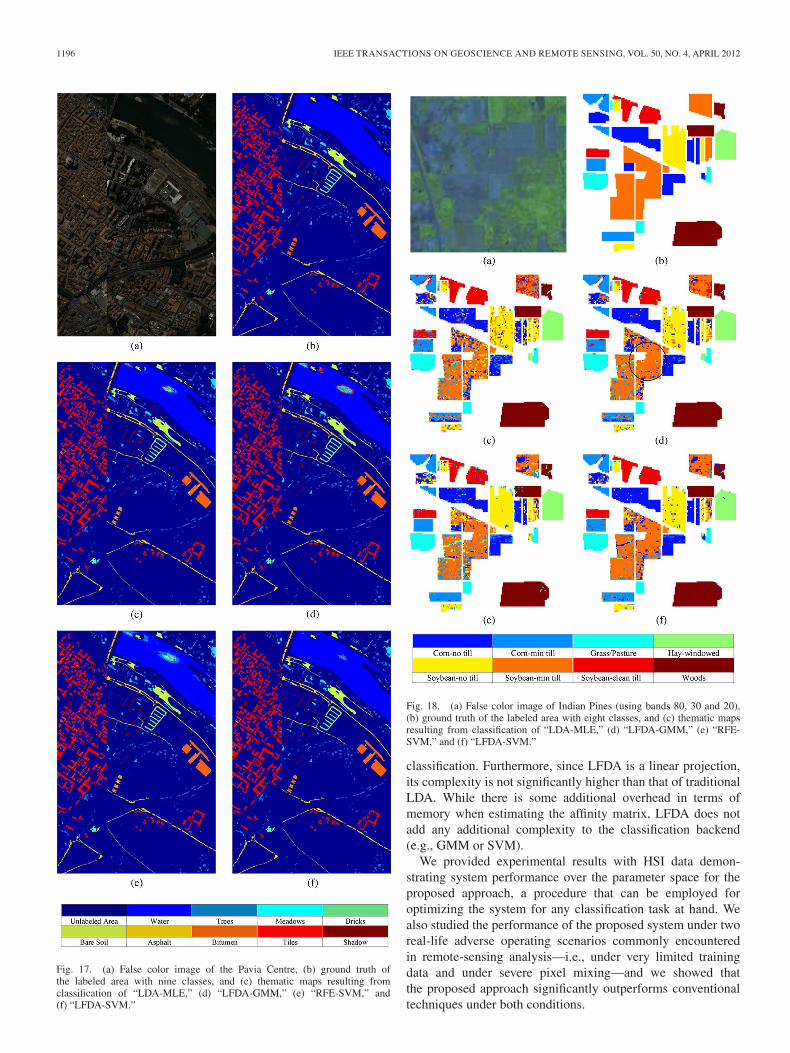
We also report visual ground-cover classification mapsfor the Indian Pines and Pavia data sets, since they comewith labeled ground truth for training and visual compari-son. Figs. 16–18 show the thematic maps resulting from theclassification of these hyperspectral scenes using LDA-MLE,LFDA-GMM, RFE-SVM, and LFDA-SVM. We producedground-cover maps of the entire HSI scene for these images(including unlabeled pixels). However, to facilitate easy com-parison between methods, only areas for which we have groundtruth are shown in these maps. Clearly, LFDA-GMM andLFDA-SVM consistently result in maps that are less noisy andmore accurate compared to traditional state-of-the-art methods.For example, see the circled area of Soybeans-min till in Fig. 18or the circled region of Asphalt in Fig. 16. It can be observedthat LFDA-GMM and LFDA-SVM result in maps having asignificantly reduced misclassification noise.
V. CONCLUSION
We have presented a locality-preserving discriminant analy-sis for hyperspectral dimensionality reduction. This approachwas previously proposed and tested with simple binary-classification data sets having a much smaller dimensional-ity. Additionally, previous work has not studied LFDA as adimensionality-reduction tool for complex nonlinear classifierssuch as GMMs and nonlinear kernel-based SVMs. In this paper,we argued that LFDA serves as a very effective dimensionality-reduction tool for such classifiers, for very high-dimensionaland challenging classification tasks such as HSI ground-cover
Fig. 16. (a) False color image of the University of Pavia (using bands 60,30, and 2), (b) ground truth of the labeled area with nine classes, and (c) the-matic maps resulting from classification of “LDA-MLE,” (d) “LFDA-GMM,”(e) “RFE-SVM,” and (f) “LFDA-SVM.”
1196 IEEE TRANSACTIONS ON GEOSCIENCE AND REMOTE SENSING, VOL. 50, NO. 4, APRIL 2012
Fig. 17. (a) False color image of the Pavia Centre, (b) ground truth ofthe labeled area with nine classes, and (c) thematic maps resulting fromclassification of “LDA-MLE,” (d) “LFDA-GMM,” (e) “RFE-SVM,” and(f) “LFDA-SVM.”
Fig. 18. (a) False color image of Indian Pines (using bands 80, 30 and 20),(b) ground truth of the labeled area with eight classes, and (c) thematic mapsresulting from classification of “LDA-MLE,” (d) “LFDA-GMM,” (e) “RFE-SVM,” and (f) “LFDA-SVM.”
classification. Furthermore, since LFDA is a linear projection,its complexity is not significantly higher than that of traditionalLDA. While there is some additional overhead in terms ofmemory when estimating the affinity matrix, LFDA does notadd any additional complexity to the classification backend(e.g., GMM or SVM).
We provided experimental results with HSI data demon-strating system performance over the parameter space for theproposed approach, a procedure that can be employed foroptimizing the system for any classification task at hand. Wealso studied the performance of the proposed system under tworeal-life adverse operating scenarios commonly encounteredin remote-sensing analysis—i.e., under very limited trainingdata and under severe pixel mixing—and we showed thatthe proposed approach significantly outperforms conventionaltechniques under both conditions.
LI et al.: LOCALITY-PRESERVING DIMENSIONALITY REDUCTION AND CLASSIFICATION 1197
We note that, although we have not included results ofGMM classification without any dimensionality reduction inthis paper, we performed such classification as well and foundthat the overall classification performance of basic GMMs withHSI data is dismally low—for example, with the Universityof Pavia data set, when all of the training data were used, theaccuracy was a low 53%, while when the amount of trainingdata was dropped to 4.3N , the accuracy dropped to 20%,indicating that GMM training effectively broke down due toan immensely high-dimensional parameter space. These obser-vations further corroborate our arguments as to the benefits ofLFDA as a dimensionality-reduction tool for classifiers suchas GMMs.
We note also that, in this paper, we have considered classifi-cation tasks involving up to nine classes in a relatively well-structured environment. However, this data complexity canindeed be scaled up to complicated scenes involving many moreclasses—in fact, we expect the LFDA-GMM/SVM approach tobe even more effective at capturing subtle statistical differencesfor classification in such complex environments.
REFERENCES
[1] R. O. Duda, P. E. Hart, and D. G. Stork, Pattern Classification, 2nd ed.New York: Wiley, 2001.
[2] C. Lee and D. A. Landgrebe, “Analyzing high-dimensional multispectraldata,” IEEE Trans. Geosci. Remote Sens., vol. 31, no. 4, pp. 792–800,Jul. 1993.
[3] S. Prasad and L. M. Bruce, “Decision fusion with confidence-basedweight assignment for hyperspectral target recognition,” IEEE Trans.Geosci. Remote Sens., vol. 46, no. 5, pp. 1448–1456, May 2008.
[4] L. Zhang, Y. Zhong, B. Huang, J. Gong, and P. Li, “Dimensionality re-duction based on clonal selection for hyperspectral imagery,” IEEE Trans.Geosci. Remote Sens., vol. 45, no. 12, pp. 4172–4186, Dec. 2007.
[5] M. D. Farrell and R. M. Mersereau, “On the impact of PCA dimensionreduction for hyperspectral detection of difficult targets,” IEEE Geosci.Remote Sens. Lett., vol. 2, no. 2, pp. 192–195, Apr. 2005.
[6] X. Jia and J. A. Richards, “Segmented principal components transforma-tion for efficient hyperspectral remote-sensing image display and classifi-cation,” IEEE Trans. Geosci. Remote Sens., vol. 37, no. 1, pp. 538–542,Jan. 1999.
[7] S. Prasad and L. M. Bruce, “Limitations of principal component analysisfor hyperspectral target recognition,” IEEE Geosci. Remote Sens. Lett.,vol. 5, no. 4, pp. 625–629, Oct. 2008.
[8] S. Di Zenzo, R. Bernstein, S. D. Degloria, and H. C. Kolsky, “Gaussianmaximum likelihood and contextual classification algorithms for mul-ticrop classification,” IEEE Trans. Geosci. Remote Sens., vol. GRS-25,no. 6, pp. 805–814, Nov. 1987.
[9] A. M. Martinez and A. C. Kak, “PCA versus LDA,” IEEE Trans. PatternAnal. Mach. Intell., vol. 23, no. 2, pp. 228–233, Feb. 2001.
[10] M. Sugiyama, “Dimensionality reduction of multimodal labeled data bylocal Fisher discriminant analysis,” J. Mach. Learn. Res., vol. 8, no. 5,pp. 1027–1061, May 2007.
[11] S. Tadjudin and D. A. Landgrebe, “Robust parameter estimation for mix-ture model,” IEEE Trans. Geosci. Remote Sens., vol. 38, no. 1, pp. 439–445, Jan. 2000.
[12] M. M. Dundar and D. A. Landgrebe, “A model-based mixture-supervisedclassification approach in hyperspectral data analysis,” IEEE Trans.Geosci. Remote Sens., vol. 40, no. 12, pp. 2692–2699, Dec. 2002.
[13] A. Berge and A. H. S. Solberg, “Structured Gaussian components forhyperspectral image classification,” IEEE Trans. Geosci. Remote Sens.,vol. 44, no. 11, pp. 3386–3396, Nov. 2006.
[14] C. Cortes and V. N. Vapnik, “Support vector networks,” Mach. Learn.,vol. 20, no. 3, pp. 273–297, Sep. 1995.
[15] F. Melgani and L. Bruzzone, “Classification of hyperspectral remote sens-ing images with support vector machines,” IEEE Trans. Geosci. RemoteSens., vol. 42, no. 8, pp. 1778–1790, Aug. 2004.
[16] G. Camps-Valls and L. Bruzzone, “Kernel-based methods for hyperspec-tral image classification,” IEEE Trans. Geosci. Remote Sens., vol. 43,no. 6, pp. 1351–1362, Jun. 2005.
[17] D. Tuia, G. Camps-Valls, G. Matasci, and M. Kanevski, “Learning rel-evant image features with multiple-kernel classifications,” IEEE Trans.Geosci. Remote Sens., vol. 48, no. 10, pp. 3780–3791, Oct. 2010.
[18] X. He and P. Niyogo, “Locality preserving projections,” in Advancesin Neural Information Processing System, S. Thrun, L. Saul, andB. Schölkopf, Eds. Cambridge, MA: MIT Press, 2004.
[19] M. N. Do, “Fast approximation of Kullback–Leibler distance for depen-dence trees and hidden Markov models,” IEEE Signal Process. Lett.,vol. 10, no. 4, pp. 115–118, Apr. 2003.
[20] G. Shaw and D. Manolakis, “Signal processing for hyperspectral imageexploitation,” IEEE Signal Process. Mag., vol. 19, no. 1, pp. 12–16,Jan. 2002.
[21] N. Vlassis and A. Likas, “A greedy EM algorithm for Gaussian mixturelearning,” Neural Process. Lett., vol. 15, no. 1, pp. 77–87, Feb. 2002.
[22] A. P. Benavent, F. E. Ruiz, and J. M. S. Martínez, “EBEM: An entropy-based EM algorithm for Gaussian mixture models,” in Proc. IEEE Int.Conf. Pattern Recognit., New York, Jun. 2006, vol. 2, pp. 451–455.
[23] H. Akaike, “A new look at the statistical model identification,” IEEETrans. Autom. Control, vol. AC-19, no. 6, pp. 716–723, Dec. 1974.
[24] G. Schwarz, “Estimating the dimension of a model,” Ann. Stat., vol. 6,no. 2, pp. 461–464, Mar. 1978.
[25] R. J. Steele and A. E. Raftery, “Performance of Bayesian Model SelectionCriteria for Gaussian Mixture Models,” Dept. Stat., Univ. Washington,Washington, DC, Tech. Rep. 559, Sep. 2009.
[26] V. N. Vapnik, The Nature of Statistical Learning Theory. New York:Springer-Verlag, 1995.
[27] I. Guyon, J. Weston, S. Barhill, and V. Vapnik, “Gene selection for cancerclassification using support vector machines,” Mach. Learn., vol. 46,no. 1–3, pp. 389–422, Jan. 2002.
[28] R. Archibald and G. Fann, “Feature selection and classification of hy-perspectral images with support vector machines,” IEEE Geosci. RemoteSens. Lett., vol. 4, no. 4, pp. 674–677, Oct. 2007.
[29] P. Gamba, “A collection of data for urban area characterization,” in Proc.IEEE Int. Geosci. Remote Sens. Symp., Anchorage, AK, Sep. 2004, vol. 1,pp. 69–72.
[30] T. Su and J. G. Dy, “In search of deterministic methods for initializing k-means and Gaussian mixture clustering,” Intell. Data Anal., vol. 11, no. 4,pp. 319–338, Sep. 2007.
[31] T. V. Bandos, L. Bruzzone, and G. Camps-Valls, “Classification of hy-perspectral images with regularized linear discriminant analysis,” IEEETrans. Geosci. Remote Sens., vol. 47, no. 3, pp. 862–873, Mar. 2009.
[32] W. Li, S. Prasad, J. E. Fowler, and L. M. Bruce, “Locality-preservingdiscriminant analysis in kernel-induced spaces for hyperspectral imageclassification,” IEEE Geosci. Remote Sens. Lett., vol. 8, no. 5, pp. 894–898, Sep. 2011.
[33] N. Dobigeon, S. Moussaoui, M. Coulon, J. Y. Tourneret, and A. O. Hero,“Joint Bayesian endmember extraction and linear unmixing for hyper-spectral imagery,” IEEE Trans. Signal Process., vol. 57, no. 11, pp. 4355–4368, Nov. 2009.
[34] F. A. Mianji and Y. Zhang, “Robust hyperspectral classification usingrelevance vector machine,” IEEE Trans. Geosci. Remote Sens., vol. 49,no. 6, pp. 2100–2112, Jun. 2011.
Wei Li (S’11) received the B.E. degree in commu-nications engineering from Xidian University, Xi’an,China, in 2007 and the M.S. degree in electrical en-gineering from Sun Yat-Sen University, Guangzhou,China, in 2009. He is currently working toward thePh.D. degree in the Department of Electrical andComputer Engineering, Mississippi State University,Starkville. His supervisor is Dr. James E. Fowler, andhis co-advisor is Dr. Saurabh Prasad.
Since 2009, he has been a Research Assistant withthe Geosystems Research Institute, Mississippi State
University. His research interests include hyperspectral image compression andstatistical pattern recognition.

1198 IEEE TRANSACTIONS ON GEOSCIENCE AND REMOTE SENSING, VOL. 50, NO. 4, APRIL 2012
Saurabh Prasad (S’05–M’09) received the B.S.degree in electrical engineering from Jamia MilliaIslamia, New Delhi, India, in 2003, the M.S. degreein electrical engineering from Old Dominion Univer-sity, Norfolk, VA, in 2005, and the Ph.D. degree inelectrical engineering from Mississippi State Univer-sity, Starkville, in 2008.
He is currently an Assistant Research Professorwith the Geosystems Research Institute (GRI) andan Adjunct Assistant Professor with the Departmentof Electrical and Computer Engineering, Mississippi
State University. He has been the Lead Author of several successful grantproposals to agencies such as the National Geospatial-Intelligence Agency,the National Aeronautics and Space Administration, and the Department ofHomeland Security, and serves as the Principal Investigator/Technical Lead forthese projects at Mississippi State University. His research interests include sta-tistical pattern recognition, adaptive signal processing and kernel methods formedical imaging, and optical and SAR remote sensing. In particular, his currentresearch work involves the use of information fusion techniques for designingrobust statistical pattern-classification algorithms for hyperspectral remote-sensing systems operating under low-signal-to-noise-ratio, mixed-pixel, andsmall-training-sample-size conditions.
Dr. Prasad is an active Reviewer for the IEEE TRANSACTIONS ON GEO-SCIENCE AND REMOTE SENSING, the IEEE GEOSCIENCE AND REMOTE
SENSING LETTERS, and the Elsevier Pattern Recognition Letters. He wasawarded the GRI’s Graduate Research Assistant of the Year Award in May 2007and the Office-of-Research Outstanding Graduate Student Research Awardin April 2008 at Mississippi State University. In July 2008, he received theBest Student Paper Award at IGARSS’2008 held in Boston, MA. In October2010, he received the State Pride Faculty Award at Mississippi State Universityfor his academic and research contributions. He was the Lead Editor of thebook entitled Optical Remote Sensing: Advances in Signal Processing andExploitation Techniques, published in March 2011.
James E. Fowler (S’91–M’96–SM’02) received theB.S. degree in computer and information scienceengineering and the M.S. and Ph.D. degrees in elec-trical engineering from The Ohio State University,Columbus, in 1990, 1992, and 1996, respectively.
In 1995, he was an Intern Researcher at AT&TLabs, Holmdel, NJ, and in 1997, he held a NationalScience Foundation-sponsored postdoctoral assign-ment at the Université de Nice-Sophia Antipolis,Nice, France. In 2004, he was a Visiting Professorwith the Département Traitement du Signal et des
Images, École Nationale Supérieure des Télécommunications, Paris, France.He is currently a Billie J. Ball Professor and the Graduate Program Directorof the Department of Electrical and Computer Engineering, Mississippi StateUniversity, Starkville. He is also a Researcher with the Geosystems ResearchInstitute, Mississippi State.
Dr. Fowler is an Associate Editor for the IEEE TRANSACTIONS ON IMAGE
PROCESSING and the EURASIP Journal on Image and Video Processing. Heformerly served as an Associate Editor for the IEEE TRANSACTIONS ON
MULTIMEDIA and the IEEE SIGNAL PROCESSING LETTERS. He is the Vice-Chair of the Image, Video, and Multidimensional Signal Processing TechnicalCommittee of the IEEE Signal Processing Society as well as the Publicity Chairof the Program Committee for the Data Compression Conference.
Lori Mann Bruce (S’90–M’96–SM’01) receivedthe B.S., M.S., and Ph.D. degrees in electricaland computer engineering from The University ofAlabama, Huntsville, and the Georgia Institute ofTechnology, Atlanta.
She is the Associate Dean for Research and Grad-uate Studies in the Bagley College of Engineering,Mississippi State University, Starkville. She has beena Faculty Member for 14 years, during which shehas taught approximately 40 engineering courses atthe undergraduate and graduate levels. Her research
in image processing and remote sensing has been funded by the Departmentof Homeland Security, the Department of Energy, the Department of Trans-portation, the National Aeronautics and Space Administration, the NationalGeospatial-Intelligence Agency, the National Science Foundation, the UnitedStates Geological Survey, and industry, resulting in over 100 peer-reviewedpublications and the matriculation of more than 75 graduate students (25 asmajor professor and more than 50 as thesis/dissertation committee member).
Dr. Bruce is an active member of the IEEE Geoscience and Remote SensingSociety, and she is a member of the Phi Kappa Phi, Eta Kappa Nu, and TauBeta Pi honor societies, and prior to becoming a faculty member, she held theprestigious title of National Science Foundation Research Fellow.