local water quality assessment
TRANSCRIPT

Goodson
1
Local Water Quality Assessment
Kenneth Goodson
ENV 115
Dr. Blake Mathys
2 December 2016
Goodson
2
Abstract
The importance of the quality of water is essential to biodiversity. The methods
involved display diversity, richness and whether evenness is apparent. The results show facts
to what is happening with fish tendencies to preference of water quality. We gathered that
more intolerant fish in the less disturbed part of the stream. We found a correlation between
water and fish quality from implementing the scientific method of reasons to support
hypothetical study.
Introduction
The economic issue of water and fish quality has to do with methods used to sustain
the overall approach of aquaculture to be experienced diversely of cultures for years to come.
For instance the earth has some facts that cannot be undermined with the known
significance 71% of globe is covered with water and 97% of earth’s water in oceans. The
freshwater availability is 0.024% of the ocean parted into aquifers and surface waters which
then trickles down to creeks carrying the fish to their local habitat. (Miller Jr. and Spoolman
2010)
For a view on local quality of water’s contribution to the types of fish being able to
cope with their specific habitat we gathered and released fish from and back into the local
Alum Creek. The Alum Creek is 3,387-acre reservoir and 4,630 acres of fields and
woodlands providing sufficient recreational opportunities. The direction of the flow is south.
There is a dam on Alum Creek. From the scientific method we came up with two hypotheses.
We hypothesize that biodiversity will decrease from upstream to downstream due to
increased disturbance/human impact. The second hypothesis is that fish farther downstream

Goodson
3
will be generally more pollution tolerant, since we expect pollution and disturbance to increase
when moving downstream.
Public Drinking Water Supply Use
There is a sum of 119 public water areas using surface water. (Ohio Environmental
Protection Agency 2016)
Methods
We collected data on 8/31/16, 9/19/16, 10/5/16 and 10/12/16 throughout the semester of
over 10 kinds of diverse fish species in Columbus, OH USA. The findings took place within the
local backyard of the Ohio Dominican University of Alum Creek. The temperature settings of
the days were 68°F, 82°F, 70°F and 76°F. We focused gathering fishes in locals such as
farthest and intermediate upstream and farthest and intermediate downstream of Alum Creek.
The strategic gathering techniques applied was the successful seine nets which was
either by hand from the expert or from individuals on both ends letting the species flow into
the seine nets to gather the kinds of fish. We took heed to the implementation of making sure
the habitat remain sustainably controlled within their natural flow of prescribed habitat.
Majority of the class were able to wear recommended equipment for the capturing of
fish provided from the school for each day.

Goodson
4
Methods: Shannon Diversity Index
H = - Σ Pi ln Pi: Shannon Diversity Index equation
We use the equation to identify richness (how many species are there) and evenness. (how
equally individual species are spread amongst the species there) A narrow perspective of the
4 streams of 20 species the farthest upstream, on the day of 10/5/16, 8/31/16 intermediate
upstream, 10/12/16 intermediate downstream and 9/19/16 farthest downstream we seine:
Species Farthest
Upstream Intermediate
Upstream Intermediate Downstream
Farthest Downstream
Bluntnose Minnow 18 6 59 18
Sand Shiner 51 41 59 52
Silver Shiner 63 47 28 14
Spotfin Shiner 3 5 9 5
Brook Silverside 3 1 15 25
Johnny Darter 8 6 6 6
Greenside Darter 4 8 3 6
Banded Darter 33 21 1 9
Rainbow Darter 6 3
Central Stoneroller Minnow
1 1
2
Blackstripe Minnow 22 7
Bluegill 2 10
Green Sunfish 1 2
Northern Hogsucker 1 1
Largemouth Bass 2
Longear Sunfish 2
Golden Redhorse 1
Common White Sucker 1
Logperch 1
Scarlet Shiner 1 2
Goodson
5
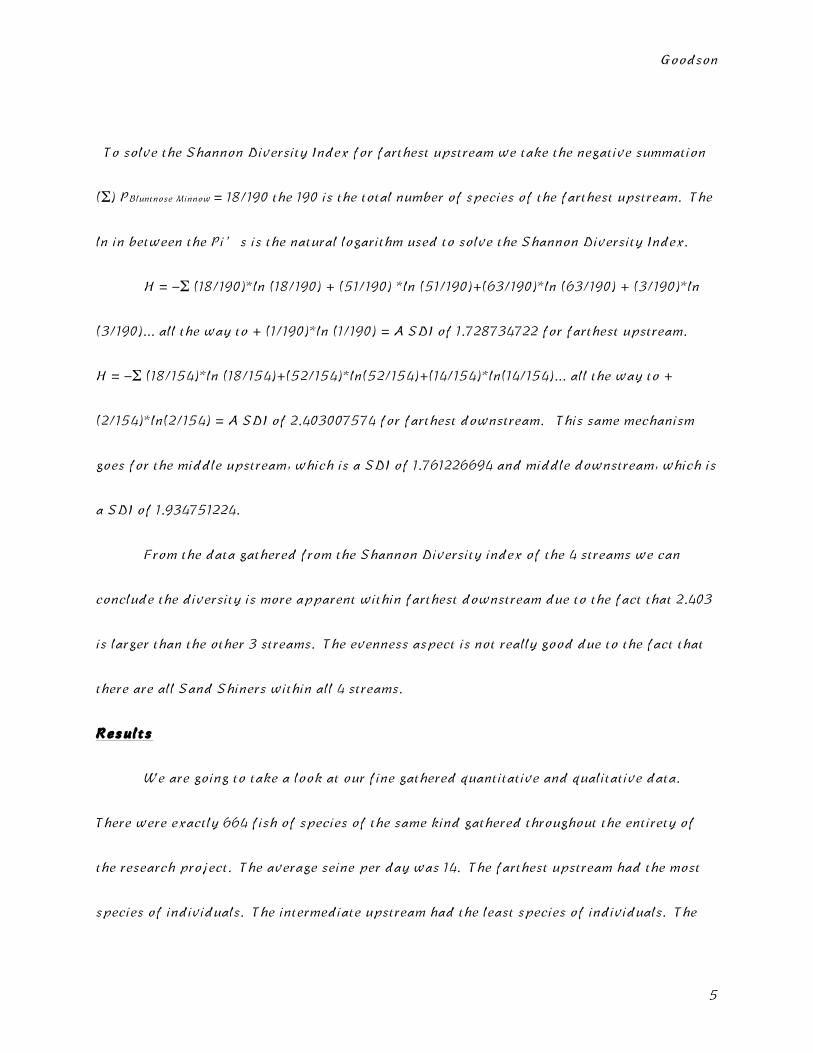
To solve the Shannon Diversity Index for farthest upstream we take the negative summation
(Σ) PBluntnose Minnow = 18/190 the 190 is the total number of species of the farthest upstream. The
ln in between the Pi’s is the natural logarithm used to solve the Shannon Diversity Index.
H = -Σ (18/190)*ln (18/190) + (51/190) *ln (51/190)+(63/190)*ln (63/190) + (3/190)*ln
(3/190)... all the way to + (1/190)*ln (1/190) = A SDI of 1.728734722 for farthest upstream.
H = -Σ (18/154)*ln (18/154)+(52/154)*ln(52/154)+(14/154)*ln(14/154)... all the way to +
(2/154)*ln(2/154) = A SDI of 2.403007574 for farthest downstream. This same mechanism
goes for the middle upstream, which is a SDI of 1.761226694 and middle downstream, which is
a SDI of 1.934751224.
From the data gathered from the Shannon Diversity index of the 4 streams we can
conclude the diversity is more apparent within farthest downstream due to the fact that 2.403
is larger than the other 3 streams. The evenness aspect is not really good due to the fact that
there are all Sand Shiners within all 4 streams.
Results
We are going to take a look at our fine gathered quantitative and qualitative data.
There were exactly 664 fish of species of the same kind gathered throughout the entirety of
the research project. The average seine per day was 14. The farthest upstream had the most
species of individuals. The intermediate upstream had the least species of individuals. The
Goodson
6
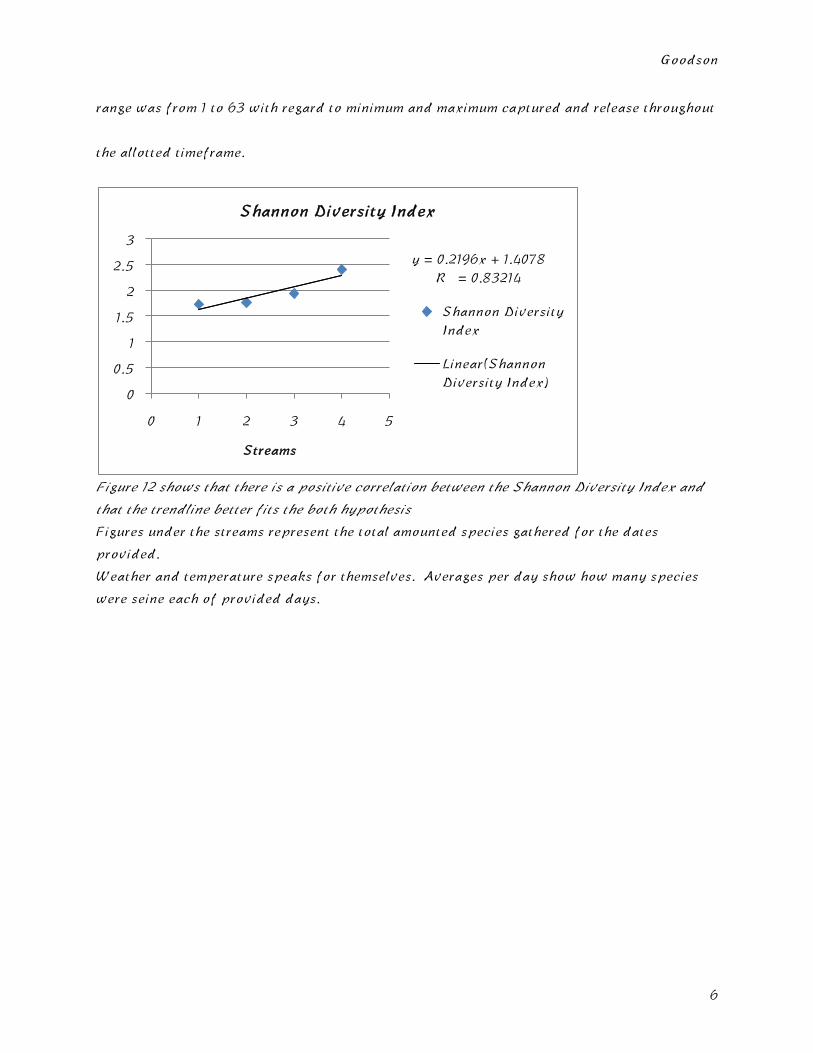
range was from 1 to 63 with regard to minimum and maximum captured and release throughout
the allotted timeframe.
Figure 12 shows that there is a positive correlation between the Shannon Diversity Index and
that the trendline better fits the both hypothesis
Figures under the streams represent the total amounted species gathered for the dates
provided.
Weather and temperature speaks for themselves. Averages per day show how many species
were seine each of provided days.
y = 0.2196x + 1.4078 R² = 0.83214
0
0.5
1
1.5
2
2.5
3
0 1 2 3 4 5
Streams
Shannon Diversity Index
Shannon Diversity Index
Linear(Shannon Diversity Index)
Goodson
7
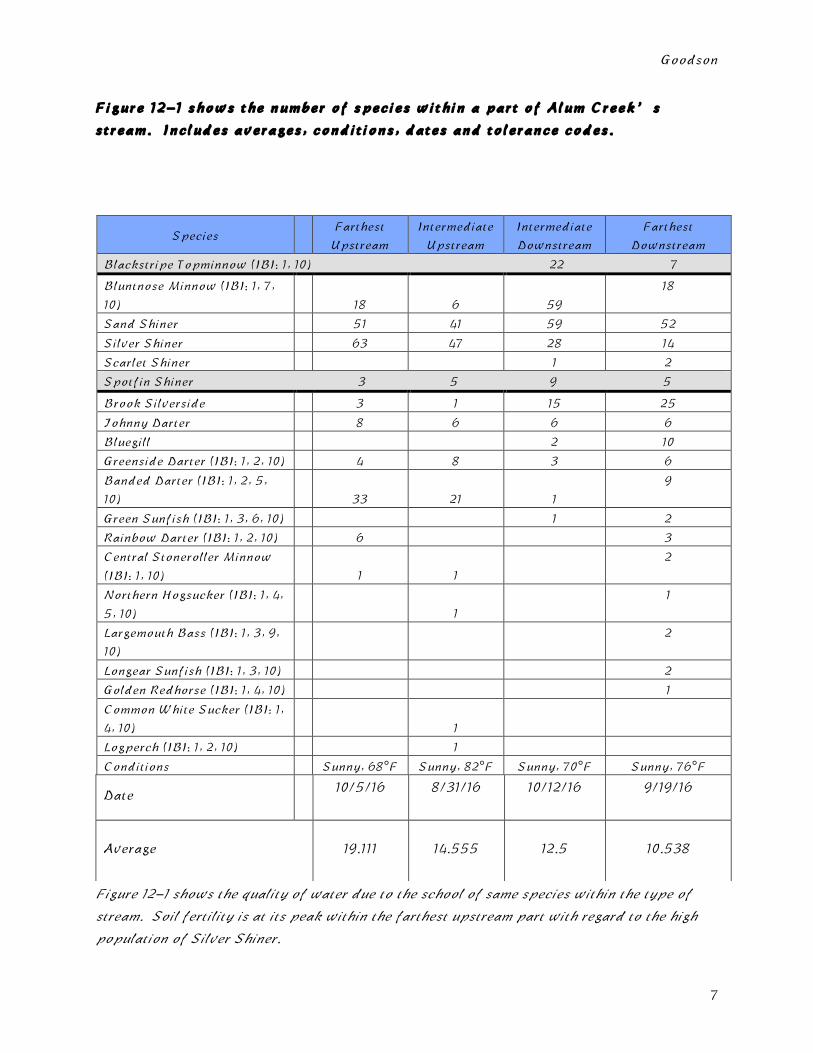
Figure 12-1 shows the number of species within a part of Alum Creek’s
stream. Includes averages, conditions, dates and tolerance codes.
Figure 12-1 shows the quality of water due to the school of same species within the type of
stream. Soil fertility is at its peak within the farthest upstream part with regard to the high
population of Silver Shiner.
Species Farthest
Upstream Intermediate
Upstream Intermediate Downstream
Farthest Downstream
Blackstripe Topminnow (IBI: 1, 10) 22 7
Bluntnose Minnow (IBI: 1, 7,
10)
18 6 59
18
Sand Shiner 51 41 59 52
Silver Shiner 63 47 28 14
Scarlet Shiner 1 2
Spotfin Shiner 3 5 9 5
Brook Silverside 3 1 15 25
Johnny Darter 8 6 6 6
Bluegill 2 10
Greenside Darter (IBI: 1, 2, 10) 4 8 3 6
Banded Darter (IBI: 1, 2, 5, 10)
33 21 1
9
Green Sunfish (IBI: 1, 3, 6, 10) 1 2
Rainbow Darter (IBI: 1, 2, 10) 6 3
Central Stoneroller Minnow
(IBI: 1, 10)
1 1
2
Northern Hogsucker (IBI: 1, 4,
5, 10)
1
1
Largemouth Bass (IBI: 1, 3, 9, 10)
2
Longear Sunfish (IBI: 1, 3, 10) 2
Golden Redhorse (IBI: 1, 4, 10) 1
Common White Sucker (IBI: 1, 4, 10)
1
Logperch (IBI: 1, 2, 10) 1
Conditions Sunny, 68°F Sunny, 82°F Sunny, 70°F Sunny, 76°F
Date 10/5/16 8/31/16 10/12/16 9/19/16
Average 19.111 14.555 12.5 10.538
Goodson
8
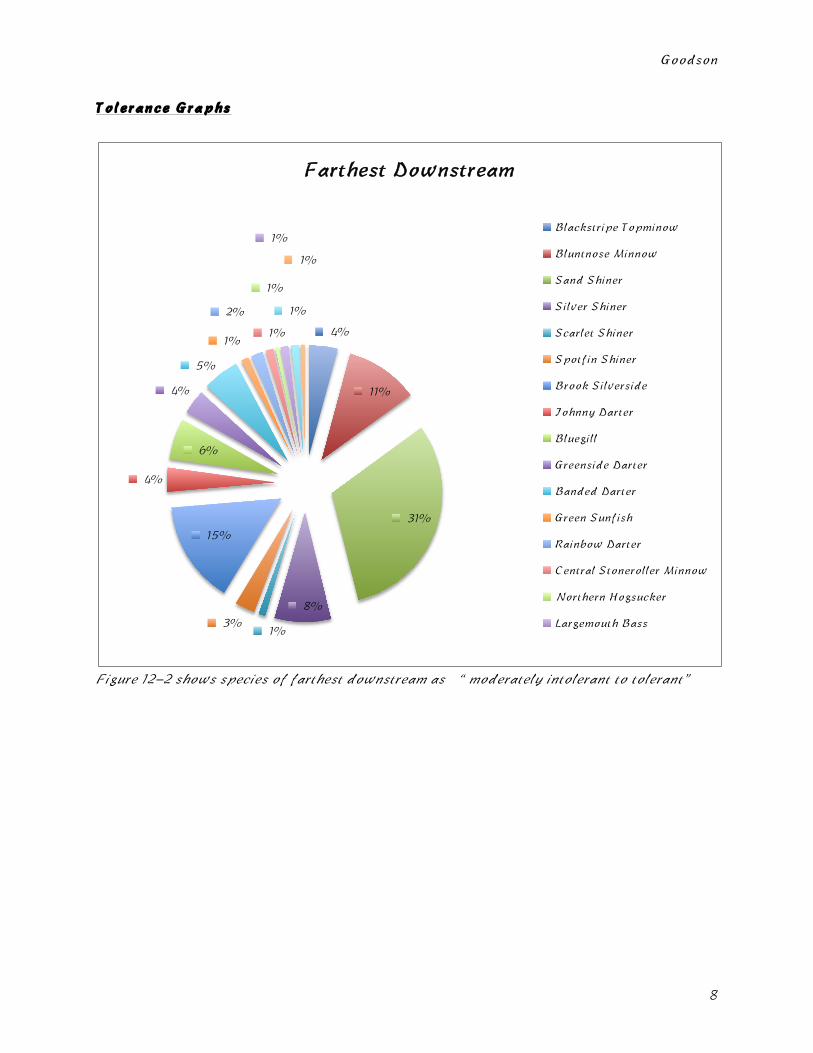
Tolerance Graphs
Figure 12-2 shows species of farthest downstream as “ moderately intolerant to tolerant”
4%
11%
31%
8%
1% 3%
15%
4%
6%
4%
5%
1%
2%
1%
1%
1%
1%
1%
Farthest Downstream
Blackstripe Topminow
Bluntnose Minnow
Sand Shiner
Silver Shiner
Scarlet Shiner
Spotfin Shiner
Brook Silverside
Johnny Darter
Bluegill
Greenside Darter
Banded Darter
Green Sunfish
Rainbow Darter
Central Stoneroller Minnow
Northern Hogsucker
Largemouth Bass

Goodson
9
Figure 12-3 shows species of intermediate downstream as “ moderately intolerant to
tolerant”
Figure 12-4 shows of species within farthest upstream as “ intolerant”
11%
29%
29%
14%
1%
4%
7%
3%
Intermediate Downstream
Blackstripe Topminow
Bluntnose Minnow
Sand Shiner
Silver Shiner
Scarlet Shiner
Spotfin Shiner
Brook Silverside
Johnny Darter
Bluegill
Greenside Darter
Banded Darter
9%
27%
33%
2%
2%
4%
2%
17%
3%
1%
Farthest Upstream
Blackstripe Topminow
Bluntnose Minnow
Sand Shiner
Silver Shiner
Scarlet Shiner
Spotfin Shiner
Brook Silverside
Johnny Darter
Bluegill
Greenside Darter

Goodson
10
Figure 12-5 shows of species within intermediate upstream as “intolerant”
We further gathered that biodiversity increased from upstream to downstream due to
increased disturbance/human impact. The farthest downstream location sampled on
September 9, 2016 has a species richness of 18 and a Shannon diversity value of 2.403. Since
this is the greatest of the other 3 stream quality types, the acknowledgement of farthest
downstream has more diversity than intermediate downstream, intermediate upstream and
farthest upstream.
According to the EPA perch are the species intolerant to pollutants and accordingly to
our research there was only a perch found in the pollutant areas. Another statement is that
some species have become tolerant to pollutants due to their overall genetics and adaptation
4%
29%
34%
4%
1%
4%
6%
15%
1% 1%
1%
1%
Intermediate Upstream
Blackstripe Topminow
Bluntnose Minnow
Sand Shiner
Silver Shiner
Scarlet Shiner
Spotfin Shiner
Brook Silverside
Johnny Darter
Bluegill
Greenside Darter
Banded Darter
Goodson
11
to the pollutants such as the Brook Silverside. EPA has acknowledged the fact that fish
farther downstream generally are more pollutant tolerant since we expect pollution and
disturbance to increase when moving downstream.
Discussion
We supported the hypothesis that fish farthest downstream are usually more pollution
tolerant, since we expect pollution and disturbance to increase when moving downstream.
The hypothetical statement that biodiversity will decrease from upstream to downstream due
to increased disturbance/human impact was not supported. From the study gathered we
found that the overall population of the local Alum Creek has an instrumental value of
biodiversity with regard to fish and the amount of them.
Similar to the mechanism used from the Shannon Index Diversity equation of American
Fisheries Society (2005) productive findings to water quality to fish preference was realized.
The diversity aspect of Alum Creek is significant along with the operation of harvest methods
applied. Akin to the concept of United States Environmental Protection Agency (1999)
protocols were enforced as inexpensive screening tools for interpreting if a stream is
supporting or not supporting a designated aquatic biotic use. Due to the strip cutting method
applied the fertility of the soil along with the known gain of habitat shows a local
sustainability approach towards Alum Creek natural capital.

Goodson
12
Standardized to the results of Miller Jr. and Spoolman (2010) reservoirs like Alum
Creek provided an economic income of Recreation to conduct this research. We gathered that
schools of species of fish were using the intermediate downstream of Alum Creek as a key
area for reproductive practices. Alike to the results of United States Environmental
Protection Agency (2008) some species of families possess long life spans; many fish species
are familiar to the general public and provide recreational opportunities. Study also show
that some species prefer the atmosphere or area of Alum Creek’s farthest upstream.
Diversity increased downstream due to the lazy ambience current over both coarse and fine
subtrates combined with the massage like vibrations of passing vehicles sent from the pillars
to stream.
A suggestive future research that could better support this situation is vibration
readers or recorders within the 4 types of streams to understand the type preferred whether it
be pulsating, constant, none or others. The strip cutting logging operation has impacted the
water quality of upstream and downstream due to enhanced soil fertility pouring into the
streams adding longevity life spans to Sand and Silver Shiners just to point out a few species.
Goodson
13
Literature Cited
American Fisheries Society. (2005). Changes in Fish Assemblage Status in Ohio’s
Nonwadeable Rivers and Streams over Two Decades. Ohio: Author.
Miller Jr., G. Tyler, Spoolman E. Scott. (2010). Environmental Science.
Australia_Brazil_Japan_Korea_Mexico_Singapore_Spain_United
Kingdom_United States: Brooks/Cole Cengage Learning.
Ohio Environmental Protection Agency. (2016). Ohio Integrated Water Quality Monitoring and
Assessment Report. Columbus, OH: Author.
United States Environmental Protection Agency. (2008). An Introduction to Freshwater Fishes
As Biological Indicators. Washington, DC: Author.
United States Environmental Protection Agency. (1999). Rapid Bioassessment Protocols for
Use in Wadeable Streams and Rivers. Washington, DC: Author.