local road users survey - gov.uk
TRANSCRIPT
1
Local Road Users Survey: Research report December 2016
Kantar Public (formerly TNS BMRB) Karen Bunt, Carryn Smit, Charlotte Witsø

2
Contents
1. Executive Summary .................................................................................................................................................................................................... 4
2. Introduction and background.................................................................................................................................................................................... 6
2.1 The Bus Services Bill .................................................................................................................................................................................................. 6
2.2 The Cycling and Walking Investment Strategy (CWIS) ........................................................................................................................................... 6
2.3 The Local Road Users Survey .................................................................................................................................................................................... 7
3. Method ........................................................................................................................................................................................................................ 8
3.1 Fieldwork ................................................................................................................................................................................................................... 8
3.2 The questions ............................................................................................................................................................................................................ 8
4. Current travel behaviour in local area...................................................................................................................................................................... 9
4.1 A note about disability .............................................................................................................................................................................................. 9
4.2 Demographic profile of those who walked ........................................................................................................................................................... 10
4.3 Demographic profile of those who used private modes of transport ................................................................................................................. 10
4.4 Demographic profile of those who take the bus .................................................................................................................................................. 11
4.5 Demographic profile of those who take National Rail trains, trams or London underground .......................................................................... 12
4.6 Demographic profile of those who cycle ............................................................................................................................................................... 12
4.7 Summary of demographic profiles for frequent users of different modes of transport ................................................................................... 13
4.8 Types of transport used for different types of journeys in the local area .......................................................................................................... 13
4.9 Important factors in deciding which modes of transport to use ......................................................................................................................... 16
5. Walking ...................................................................................................................................................................................................................... 18
5.1 Willingness to walk more in the local area............................................................................................................................................................ 18
5.2 Barriers to walking more in the local area ............................................................................................................................................................ 19
5.3 Factors which could motivate people to walk more in their local area .............................................................................................................. 20
5.4 Perceptions of safety when walking during the day............................................................................................................................................. 21
6. Bus Use ...................................................................................................................................................................................................................... 22
6.1 Willingness to use buses in the local area ............................................................................................................................................................. 22
6.2 Barriers to using buses in the local area ................................................................................................................................................................ 23
6.3 Factors which would motivate people to use their local buses more................................................................................................................. 24
6.4 Extent to which people viewed taking the bus as a fit with who they are were ................................................................................................ 25
7. Cycling ........................................................................................................................................................................................................................ 28

3
7.1 Willingness to cycle more in the local area ........................................................................................................................................................... 28
7.2 Barriers to cycling more in the local area .............................................................................................................................................................. 29
7.3 Factors which could motivate people to cycle more in their local area ............................................................................................................. 31
7.4 Views on cycling facilities ....................................................................................................................................................................................... 32
Appendix A – More details about method................................................................................................................................................................. 35
Fieldwork........................................................................................................................................................................................................................ 35
Quota sampling.............................................................................................................................................................................................................. 35
Weighting ....................................................................................................................................................................................................................... 35
Appendix B - Questionnaire......................................................................................................................................................................................... 37

4
1. Executive Summary Key findings from the transport behaviours section:
• The highest proportion (66%) of respondents frequently walked (three or more times a week) for at least some of their local journeys. Frequent walkers tended to be younger, urbanites and a high proportion of respondents from an ethic minority background.
• An almost equally high proportion (64%) of respondents used private modes of transport (car or motorcycle as a driver or passenger) three or more times a week. These respondents tended to be middle age, social grades ABC1, employed full-time, married, and have children. The use of private modes was most common across all journey types. Of those who rarely travelled by car or motorcycle the majority (65%) did not do so because they because they did not own or have access to these modes of transport.
• Just over half (55%) of respondents took the bus more than twice a year.
• Cycling was the least frequently used mode of transport with three quarters (75%) cycling only twice a year or less often. Young respondents and males were more likely to cycle.
• Similarly, National Rail trains, tram or the London underground were not a popular mode of transport with just under half (48%) of respondents using at least one of these modes to get around the local area twice a year or less often.
Key findings from the walking section:
• The majority (69%) agreed that they would be willing to walk more for journeys in their local area. Overall, one in five (21%) strongly agreed with this.
• For those who were unwilling to walk more for journeys in their local area, the main barriers to walking were the journey would take too long (46%), having health or disability issues (26%) and not liking walking in general (16%). Speed seemed to be a more pressing issue for younger respondents, while health issues were highlighted by older respondents.
• Willingness to walk also varied based on current behaviours. Respondents who walked three or more times a week were the most likely to be willing to walk more (79%). Nevertheless, almost two in five (37%) of those who did not walk regularly and a quarter (28%) of those who did not currently walk much at all (less than twice a year or never) expressed an interest in walking more, suggesting a potential to drive significant behaviour change in these groups.
• Factors which would potentially motivate citizens to walk more related to a mix of: 1) The physical road facilities – such as well-lit streets, better maintained pavements, wider pavements 2) How the respondent felt while walking – such as whether they felt fit or healthy, safe (i.e. due to crime or behaviour from other road users), and whether they would have liked a companion to walk with.
• Those who agreed they would be willing to walk more were more likely to mention concerns about safety and the condition of walking facilities, while those unwilling to walk more tended to highlight issues around fitness or to say that nothing would encourage them to walk.

5
Key findings from the bus section:
• Two in five (38%) respondents said they would be willing to travel more by bus. Willingness to travel more by bus appears to be associated to age, with the youngest and the oldest respondents the most willing, and urban density, with those in conurbations more willing to use the buses more regularly than those living in other urban or rural areas.
• Among those unwilling to travel by bus, a quarter (25%) of respondents associated their unwillingness with a lack of convenience; they considered other modes of transport easier to use. The top factors respondents found to be important when deciding which type of transport to use were speed (47%), reliability (37%) and ease of access (35%) all of which fit under the umbrella of convenience.
• Cheaper fares (36%), more frequent services (32%) and more bus routes (24%) were the top three factors that would encourage respondents to use the buses more in their local area.
• Three in ten (30%) agreed that taking the bus fits with their lifestyle and who they are, while close to half (49%) disagreed. This could suggest that a substantial portion of the English population may avoid travelling by bus due to social perceptions.
Key findings from the cycling section:
• Three in ten (30%) agreed that they would be willing to cycle more for journeys in their local area.
• Willingness to cycle more was associated with current behaviour, as those already cycling three or more times a week (86%) or once or twice a week (78%) were the most likely to be willing to cycle more.
• Among those unwilling to cycle more, the main barriers were not having access to a bike (32%), being too old or unfit (23%) and not liking cycling (21%).
• The top factor which would motivate people to cycle more were cycle lanes being separated from motor traffic (33%) and better behaviour from other road users (18%).
• Among the top five motivating factors, three – separate cycle lanes (33%), better behaviour from road users (18%) and better information about alternative cycle routes (11%) – were related to the experience on the road during the journey. The other two – better cycle parking facilities (14%) and better shower facilities (7%) – were related to the respondents experience at the end point of the journey.
• Three in ten (31%) respondents agreed that cycling facilities in their area were good while an almost equal proportion (28%) disagreed. A relatively high proportion said they did not know (15%). Those cycling more than twice a year were more likely to agree that facilities were good than those who very rarely or never cycled.

6
2. Introduction and background The Local Road Users Survey was initiated by the Department for Transport (DfT) to update and address evidence gaps relating to public attitudes towards local transport. The evidence and insights from this research will inform implementation of the Bus Service Bill and the Cycling and Walking Investment Strategy introduced by DfT earlier this year, which aim to increase use of buses, walking and cycling for local journeys.
2.1 The Bus Services Bill When Bus Minister Andrew Jones introduced the new Bill earlier this year he described a good bus service as being able to “help cut congestion and deliver better journeys for hard-working people”1. The overarching aim of the Bill is to increase the number of people using buses. This is to be achieved by better addressing the public’s transport needs. The devolution of bus services is the key to this transformation; the following specific actions were proposed2:
• Reforming the bus franchising system: it is argued that franchising rights should be automatically available to all areas, similar to the arrangement that combined authorities currently have
• Enhancing partnerships: decentralising power to facilitate advanced quality partnerships within the sector between local authorities and bus operators. This is thought to enable swift, needs-based solutions and development for bus services
• Improving passenger information: specifically open data for timetabling, routes and fares to assist more accurate journey planning
• Other reforms to promote bus services, including funding and Oyster-style ticketing
This Bill concluded its reporting stage in October 20163 with members voting on a variety of different initiatives for finalisation in November 2016. Findings from this research will support further action to drive increased bus use.
2.2 The Cycling and Walking Investment Strategy (CWIS) The overarching aim of this Strategy is to make these active modes of transport the “natural choice” for shorter journeys as well as a part of longer ones4. The Strategy is the foundation for DfT’s long term ambition of a transformative change in travel behaviours that will deliver benefits to individual members of the public (in the form of improved wellbeing), to workplaces (through healthier workforces) and to cities (through less congestion and better infrastructure). The Strategy highlights three core areas for improvement:
• Safety • Mobility • Streets
1 https://www.gov.uk/government/speeches/the-buses-bill 2 http://researchbriefings.parliament.uk/ResearchBriefing/Summary/LLN-2016-0030 3 https://www.parliament.uk/business/news/2016/june/bus-services-bill/ 4 https://www.gov.uk/government/uploads/system/uploads/attachment_data/file/512895/cycling-and-walking-investment-strategy.pdf

7
2.3 The Local Road Users Survey The overall aim of Local Road Users Survey was to examine current travel behaviours and attitudes towards buses, cycling and walking to better understand:
• The public’s overall inclination to increase use of buses, walking and cycling as modes of transport
• Barriers preventing the public from using these modes more frequently • Triggers that could motivate increased use of these modes
The results from this research will provide a reliable evidence base for DfT, while additional demographic details will also provide insight to effectively target appropriate audiences in the implementation of the Bus Bill and CWIS to maximise effectiveness and uptake.

8
3. Method
3.1 Fieldwork The Local Road Users Survey questions were included on the Kantar TNS face-to-face omnibus– a multi-client survey which surveys a cross section of adults aged 16 and over. This study uses a proprietary random location sampling approach to ensure that a representative cross section of adults is surveyed in each wave. This is a more cost-efficient, yet still robust, approach compared with random probability sampling.
A total of 3,499 interviews were conducted with respondents aged 16 or older in England. Fieldwork was conducted between October 5th and 11th 2016 across two waves of the survey.5
The results were weighted at the analysis stage to be fully representative of adults in England according to the latest census data. All the results presented in this report are based on weighted data. 6
3.2 The questions Twenty questions were developed to address DfT’s research needs. This development was informed by the Bus Bill and Cycling and Walking Investment Strategy but also by previous studies done in this area, including the National Travel Survey7, the Climate Change and Transport Choice survey8 as well as various surveys conduct by Kantar TNS for TfL.
In addition to questions exploring attitudes to using buses, cycling and walking, the study also examined current transport use for travel in the local area as well as key demographics (as a standard part of the Omnibus survey). See appendix B for the full questionnaire.
5 For a more in-depth explanation of the methods used for this survey, please see the appendix A. 6 Confidence testing is used to indicate whether findings are statistically different, but errors around these measures may be greater than with a random probability approach. 7 https://www.gov.uk/government/statistics/national-travel-survey-2014 8 https://www.gov.uk/government/uploads/system/uploads/attachment_data/file/49971/climate-change-transport-choices-full.pdf

9
4. Current travel behaviour in local area This section examines current travel behaviour for local journeys, how this varies across the population and what drives the choice of transport mode. Respondents were asked about the modes of transport they currently used for local journeys, collecting details about frequency across modes as well as what modes were use for different journey types. Factors that they considered important in choosing their mode of transport were explored as well as a specific question to understand the attitudes of those rarely using private modes of transport, specifically cars and motorcycles.
Most people currently walk (90%) or use cars (85%) for journeys in their local areas. Just over half use buses (55%) or trains (52%), whilst only a quarter (25%) cycle for local journeys. Walking and driving are also the most frequently used modes of transport, with 66% and 64% using these modes at least three times a week. The other modes of transport are less frequently used. A third (32%) use buses at least once a week, one in five (18%) use trains at least once a week and one in seven (15%) cycle at least once a week (see table 4.1 for a full breakdown).
Table 4.1 – How often respondents used the following types of transport to get around their local area
Walk - some or all
of your journey
Car or motorcycle as a driver
or passenger
Bus National Rail trains, tram or London
underground Bicycle
Any use 90% 85% 55% 52% 25% 3 or more times a week 66% 64% 18% 10% 7% Once or twice a week 18% 15% 14% 8% 8% Less than that, but more than once a month 5% 5% 12% 14% 5%
Less than that, but more than twice a year 2% 2% 11% 20% 5%
Less than that, or never 10% 15% 45% 48% 75% Unweighted Base 3499 3499 3499 3499 3499
Source: Q1 Which type of transport do you use to get around your local area, and how often you use it? Base : All adults in England aged 16 or over
4.1 A note about disability The Local Road User Survey started out with a couple of questions about disability or long standing health problems in relation to using the various modes of transport of interest. Practically, this ensured that only appropriate questions followed but also provided an important analytic lens through which to understand certain preferences and attitudes. It will be important to keep the needs and attitudes of disabled people in mind throughout the development of especially the Bus Bill, but also, to a lesser extent, the Cycling and Walking Investment Strategy.
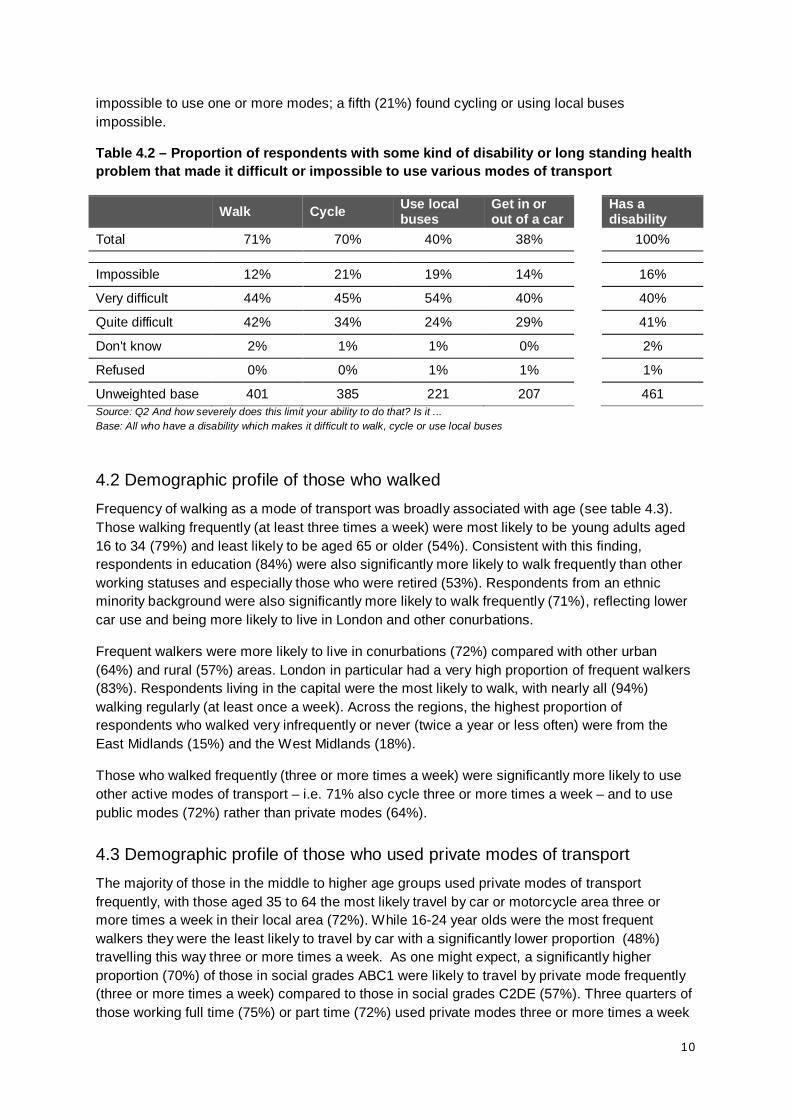
Overall, just over one in ten (13%) respondents reported having a disability or long standing health problem that made it challenging to use certain modes of transport. Table 4.2 shows the extent to which these respondents found it difficult or impossible to travel by various modes of transport. In total, seven in ten respondents with a disability or health problem had difficulty walking (71%) or cycling (70%). One in four had difficulty taking the bus (40%) or getting in and out of a car (38%). Of all those who had some kind of disability, one in six (16%) would find it
10
impossible to use one or more modes; a fifth (21%) found cycling or using local buses impossible.
Table 4.2 – Proportion of respondents with some kind of disability or long standing health problem that made it difficult or impossible to use various modes of transport
Walk Cycle Use local buses
Get in or out of a car Has a
disability Total 71% 70% 40% 38%
100%
Impossible 12% 21% 19% 14%
16%
Very difficult 44% 45% 54% 40%
40%
Quite difficult 42% 34% 24% 29%
41%
Don't know 2% 1% 1% 0%
2%
Refused 0% 0% 1% 1%
1%
Unweighted base 401 385 221 207 461 Source: Q2 And how severely does this limit your ability to do that? Is it ... Base: All who have a disability which makes it difficult to walk, cycle or use local buses
4.2 Demographic profile of those who walked Frequency of walking as a mode of transport was broadly associated with age (see table 4.3). Those walking frequently (at least three times a week) were most likely to be young adults aged 16 to 34 (79%) and least likely to be aged 65 or older (54%). Consistent with this finding, respondents in education (84%) were also significantly more likely to walk frequently than other working statuses and especially those who were retired (53%). Respondents from an ethnic minority background were also significantly more likely to walk frequently (71%), reflecting lower car use and being more likely to live in London and other conurbations.
Frequent walkers were more likely to live in conurbations (72%) compared with other urban (64%) and rural (57%) areas. London in particular had a very high proportion of frequent walkers (83%). Respondents living in the capital were the most likely to walk, with nearly all (94%) walking regularly (at least once a week). Across the regions, the highest proportion of respondents who walked very infrequently or never (twice a year or less often) were from the East Midlands (15%) and the West Midlands (18%).
Those who walked frequently (three or more times a week) were significantly more likely to use other active modes of transport – i.e. 71% also cycle three or more times a week – and to use public modes (72%) rather than private modes (64%).
4.3 Demographic profile of those who used private modes of transport The majority of those in the middle to higher age groups used private modes of transport frequently, with those aged 35 to 64 the most likely travel by car or motorcycle area three or more times a week in their local area (72%). While 16-24 year olds were the most frequent walkers they were the least likely to travel by car with a significantly lower proportion (48%) travelling this way three or more times a week. As one might expect, a significantly higher proportion (70%) of those in social grades ABC1 were likely to travel by private mode frequently (three or more times a week) compared to those in social grades C2DE (57%). Three quarters of those working full time (75%) or part time (72%) used private modes three or more times a week

11
– significantly more than those who were retired (60%), in education (36%)9 or not working (48%).
A significantly higher proportion of those who were married (77%) travelled this way three or more times a week while a significantly higher proportion (25%) of those who were single only travelled this way twice a year or less often. Perhaps related, significantly more respondents with one or more children (73%) used private modes of transport three or more times a week.
Of the respondents living in urban areas other than conurbations, seven in ten (71%) used cars or motorcycles to travel three or more times a week – significantly more than in rural areas (65%). As might perhaps be expected, those living in conurbations are the least likely to use private modes (56%). Londoners travelled by private mode significantly less frequently than respondents from other areas, and more than a third (36%) almost never (twice a year or less often) travelled this way. On the other hand, those in the North East (74%) and West Midland (74%) areas travelled especially frequently (three or more times a weeks) by private vehicle.
Of all the modes of transport those who travel by bus (at least once or twice a year) were the least likely to also travel by private mode – 21% of bus users used a car or motorcycle only twice a year or less often (a significantly higher proportion than other modes of transport).
Seventeen percent of respondents rarely (twice a year or less frequently) used private modes of transport either as a driver or passenger. Of these respondents, the most common reason given for this was not owning or having access to these private modes of transport, with nearly two thirds (65%) citing this as a reason. The second most common reason was not having a driver’s licence (29%), followed by preferring to use other modes of transport (17%).
4.4 Demographic profile of those who take the bus Respondents within the youngest and oldest age bands typically used the bus more frequently than the middle-aged respondents. Respondents aged 16-24 years old were the most likely to travel by bus three or more times per week (34%) while those aged 65 or older were the most likely to use the bus once or twice a week (20%). Women were more likely than men to take the bus three or more times a week (21%, compared to 15%) and, conversely, a higher proportion of men than women almost never took the bus (48%, compared to 40%). A comparison of the social grades revealed a similar dynamic, with a significantly higher proportion of those in grades C2DE (23%) taking the bus three or more times a week than those in grades ABC1 (15%). Relatedly, a higher proportion of those in grades ABC1 almost never took the bus (48%) compared with those classified as C2DE (40%).
Single respondents and those without any children took the bus more frequently. A significantly higher proportion (44%) of unmarried respondents travelled by bus once a week or more often compared with married respondents (27%). Nearly half (48%) of all parents took the bus only twice a year or less frequently while only 43% of those without children did the same. More than double the proportion of respondents of an ethnic minority background (34%) took the bus frequently (three or more times a week) compared with respondents of a white background (16%). Again, this could be related to the fact that a high proportion of respondents from an ethnic minority background live in London.
Regionally, those living in conurbation areas took the bus more frequently (29% three times a week or more often) than those in other urban (12%) or rural (10%) areas. London, specifically,
9 Small base size=87 (unweighted)
12
had the highest proportion of the most frequent bus travellers (45% three or more times a week) as well as regular bus travellers (24% once a week or more), while the East of England had the highest proportion of the least frequent bus travellers (65% twice a year or less often).
Of those who took the bus frequently (three or more times a week) a higher proportion were also likely to have walked (19%) or used train or tram transportation (23%) at least once a year, compared with using a car or motorcycle (14%) or a bicycle (15%). Respondents with a disability and those without any disability used the bus with similar frequencies – 18% of both groups used it three or more times a week while 45% of those with a disability almost never used it compared with 44% of those without a disability.
4.5 Demographic profile of those who take National Rail trains, trams or London underground Respondents that fell within the broad age band of 16 and 54 were significantly more likely to use this mode of transport three or more times a week compared with those 55 years and older (13%, compared to 4%) (see table 4.3 for a full breakdown). Relatedly, those in full time employment (16%) and education (17%) were significantly more likely to travel three or more times a week by rail, while, those who were retired (61%) or not working (56%) were significantly more likely to use this mode very infrequently (twice a year or less).
Three in five (60%) respondents in social grades ABC1 used rail services more than twice a year, significantly more than those in grades C2DE (43%). A distinguishing feature of respondents who travelled very frequently by rail was ethnicity. A significantly higher proportion (37%) of ethnic minority respondents travelled by rail once a week or more compared with respondents of a white background (16%). Geographical location was another key distinguisher. A significantly higher proportion (60%) of respondents in London used rail services once a week or more frequently compared with other regions.
4.6 Demographic profile of those who cycle Unsurprisingly younger respondents tended to cycle the most frequently (see table 4.3). As one might expect, the majority (89%) of respondents aged 65 and older cycled very infrequently (twice a year or less). This is consistent with the findings of the Climate Change and Transport Choice research10 that found older respondents to have more concerns about cycling. Men were more likely to cycle more frequently, with nearly double the proportion (27%) of men cycling more than once a month compared with women (14%). Respondents in social grades C2DE were significantly more likely to cycle rarely or never than those in grades ABC1 (80% compared to 70%). Across working status, the highest proportion of frequent cyclers was those in education (15%). A significantly higher proportion (84%) of ethnic minority respondents cycled very infrequently (twice a year or less often) compared with respondents of a white background (74%). This finding aligns with the need identified in the CWIS to increase cycling in typically under-represented groups, such as those from ethnic minority backgrounds.
Regional differences were less pronounced than for other modes of transport. A significantly higher proportion (19%) of respondents in the South West cycled once or twice a week while a significantly higher proportion (85%) of respondents in the North East cycled twice a year or less frequently compared than most other regions.
10 https://www.gov.uk/government/uploads/system/uploads/attachment_data/file/49971/climate-change-transport-choices-full.pdf

13
Table 4.3 – Frequent travel (three or more times a week) on various modes of transport by age
Total 16-24 25-34 35-44 45-54 55-64 65+
Walk - some or all of your journey 66% 78% 73% 67% 69% 59% 54% Car or motorcycle 64% 48% 62% 72% 71% 74% 59% Bus 18% 34% 18% 16% 11% 11% 21% National Rail trains, trams or London underground 10% 14% 15% 14% 11% 5% 3%
Bicycle 7% 10% 8% 6% 8% 8% 3% Unweighted Base 3499 487 525 535 448 461 1043 Source: Q3 How often do you use the following types of transport to get around your local area? Bus; bicycle; car or motorcycle as a driver or passenger; walk; National Rail trains, tram or London Underground. Base: Adults in England aged 16 or over
4.7 Summary of demographic profiles for frequent users of different modes of transport The demographic profiles for the use of different modes of transport described in this section resonate well with some of the segments from the Climate Change and Transport Choice survey9. In summary;
• Frequent walkers: tended to be younger, in education, of ethnic minority background, live in a conurbation and especially in London, generally engaged in other active modes of transport, such as cycling. This aligns with the ‘Young urbanites without cars’ segment from the Climate Change and Transport Choice survey, who were described as a “relatively young, affluent and well-educated segment [many of whom] lived in London, the rest in other urban areas. City centre living meant that day-to-day they did not travel far and many walked to work. They did not see themselves as needing a car…”.
• Frequent users of private modes of transport: tended to be middle-aged to older, married, with children, of a white ethnic background, wealthier, live in the North East and West Midlands, and tended not to use other types of transport. This aligns with the ‘Educated Suburban Families’ segment from the Climate Change and Transport Choice survey who were described as predominantly “financially comfortable…Mainly aged 30-59, most worked full-time and many still had children living at home…drove a lot”.
• Frequent users of buses: a high proportion of younger respondents (similar to walkers) but (diverging from walkers) also a high proportion of older respondents, more females, social grades C2DE, more respondents of an ethnic minority background, single respondents and those with no children, geographically similar to walkers, tending to live in a conurbation and especially in London, use active and other public modes. The best alignment with the Climate Change and Transport Choice segments would be a mix of the ‘Young urbanites without cars’, the ‘Urban low income without cars’ and the ‘Elderly without cars’ segments.
• Frequent cyclers: overall fewer, tended to be somewhat younger, males, social grades ABC1, live in the South West. Although there are some differences, this group aligns best with the ‘Young urbanites without cars’ segment from the Climate Change and Transport Choice survey (described above).
4.8 Types of transport used for different types of journeys in the local area Respondents were presented with different types of journeys in their local area – such as commuting, shopping or going to school – and asked to select all the modes of transport they
14
used for these journeys. The majority (54%) reported using only a single mode of transport across all the journey types asked about, while only one in six (16%) used multi-mode travel for these journeys. Three in ten (30%) said these types of journey did not apply to them. Among those who did make the relevant journey type, multi-mode travelling was more common for visiting friends or relatives (28%), for leisure activities (26%) and to go shopping (21%) than for commuting (20%), traveling on work business (17%) or taking children to school (13%). The journey types where people were more prone to use multi-mode travel were also the journeys where the most people walked or took the bus (see table 4.4 for a full breakdown). Across all the journey types, travelling by bicycle was the least popular option. Although results for the previous section suggested that overall travel by car was less frequent than walking (see table 4.1), travel by car dominated across the journey types (see tables 4.4). This is consistent with findings from the Climate Change and Transport Choices study which found the majority of respondents (87%) frequently used private vehicles11.
Overall, similar demographic profiles emerged across the journey types compared to the usage frequency of the various modes, explored in the previous section. The more detailed analysis that follows highlights some key points and draws out any additional distinctions.
4.8.1 Commuting and travelling for work journeys
A relatively high proportion of respondents did not make this journey type (40% did not commute while 48% did not travel locally for work). As shown in table 4.4 the majority of respondents who did make this journey type used a private mode to commute (62%) or to travel for work journeys (70%).
Across journey types, the lowest proportion (16%) of respondents who travelled locally on work business walked while a relatively high proportion (19%) took some form of rail service. Cycling (6%) was relatively popular among commuters. While fairly consistent across age groups, as seen with overall frequency of cycling significantly more men (5%) chose to commute this way compared with women (2%).
A quarter (25%) of respondents between the ages of 16 to 24 used the bus to commute and, consistently, nearly a third (31%) of respondents in education commuted by bus – a significantly higher proportion than in other age or working status groups. Respondents in these groups were also significantly more likely to walk as part of their commute, with 34% of 16 to 24 year olds doing so and 43% of those in education.
Commuting in London showed a very different pattern compared with the overall results and most other regions. Firstly, a significantly higher proportion (26%) used multi-mode travel in the capital. A significantly lower proportion (17%) of respondents in London used private modes to commute compared with all other regions. Using the train, trams or the London underground was collectively the most popular way to commute among London respondents (36%) while use of this mode was very low for most other regions. Taking the bus (24%) and walking (25%) were also significantly more popular in London – with a quarter of respondents commuting this way.
4.8.2 Shopping
Nearly all respondents (96%) went shopping, and the patterns of transport use for shopping were similar to general patterns; a higher proportion of those in the younger age groups (16 to 34)
11 https://www.gov.uk/government/uploads/system/uploads/attachment_data/file/49971/climate-change-transport-choices-full.pdf

15
used public and active modes compared to other ages. One in five (20%) used multi-mode travel for shopping.
A significantly higher proportion (84%) of married respondents used the car for shopping compared with single respondents (50%) who were more likely to walk (41%) than married respondents (23%). This could be related to having children which follows a similar travel pattern; a significantly higher proportion (76%) of respondents with at least one child used private modes of transport to shop while a significantly higher proportion (32%) of respondents without children walked. These patterns could be related to the amount of shopping required and the mode that can best accommodate this.
4.8.3 Visiting friends or relatives and travelling for leisure activities
A relatively high proportion of respondents who made these kinds of journeys took the bus for leisure activities (18%) and to visit friends and/or family (17%) compared with other journey types. This may relate to there being less urgency or having more time to travel for these types of journeys. Visiting friends or family was the journey type with the most multi-mode travel (27%), closely followed by travelling for leisure activities (24%). Although nearly seven in ten (71%) of those visiting friends or family did so via private modes, walking (28%) and taking the bus (17%) was also relatively common. A similar dynamic was evident for leisure activities, with three in five (62%) travelling by car, 29% walking and 16% taking the bus.
4.8.4 Taking children to school
Nearly two thirds (73%) of respondents did not take children to school. A significantly higher proportion (59%) of those aged 35 to 44 years old did make this journey compared with other age groups. Across the different journey types, respondents who took children to school tended to vary their mode for this journey type the least – 87% using a single mode of transport. Of the respondents who did take children to school, only just over half (54%) used a car or motorcycle – the lowest proportion across all the journey types. Half (50%) of those who took their children to school walked – the highest proportion of respondents across the journey types. This was similar across socio-economic grades. A very low proportion (7%) of those who took their children to school took the bus although this proportion was significantly higher (10%) for those in social grades C2DE compared with those in social grades ABC1 (4%). Cycling was the least popular option for taking kids to school – only 2% did so among those who made this journey.
Table 4.4 – Types of transport used for different types of journeys in the local area excluding those who didn’t make that kind of journey
To commute to work / school
On work business
To go shopping
For leisure
activities
To visit friends and/or
relatives
To take children to school
Bus 15% 12% 15% 18% 17% 7% Bicycle 6% 4% 3% 6% 4% 2% Car or motorcycle as a driver or passenger 62% 70% 72% 68% 74% 54%
Walk 26% 16% 31% 32% 29% 50% National Rail trains, Tram or London underground
15% 19% 3% 10% 12% 2%
Single mode 80% 83% 79% 74% 72% 87%
16
More than one mode 20% 17% 21% 26% 28% 13%
Unweighted base (all make this type of journey)
2107 1821 3368 3176 3377 929
All make this type of journey 60% 52% 96% 91% 97% 27%
Unweighted base: all 3499 3499 3499 3499 3499 3499 Source: Please tell me which types of transport you use for different types of journeys in your local area. Which types of transport do you use … Base: Adults in England aged 16 or over
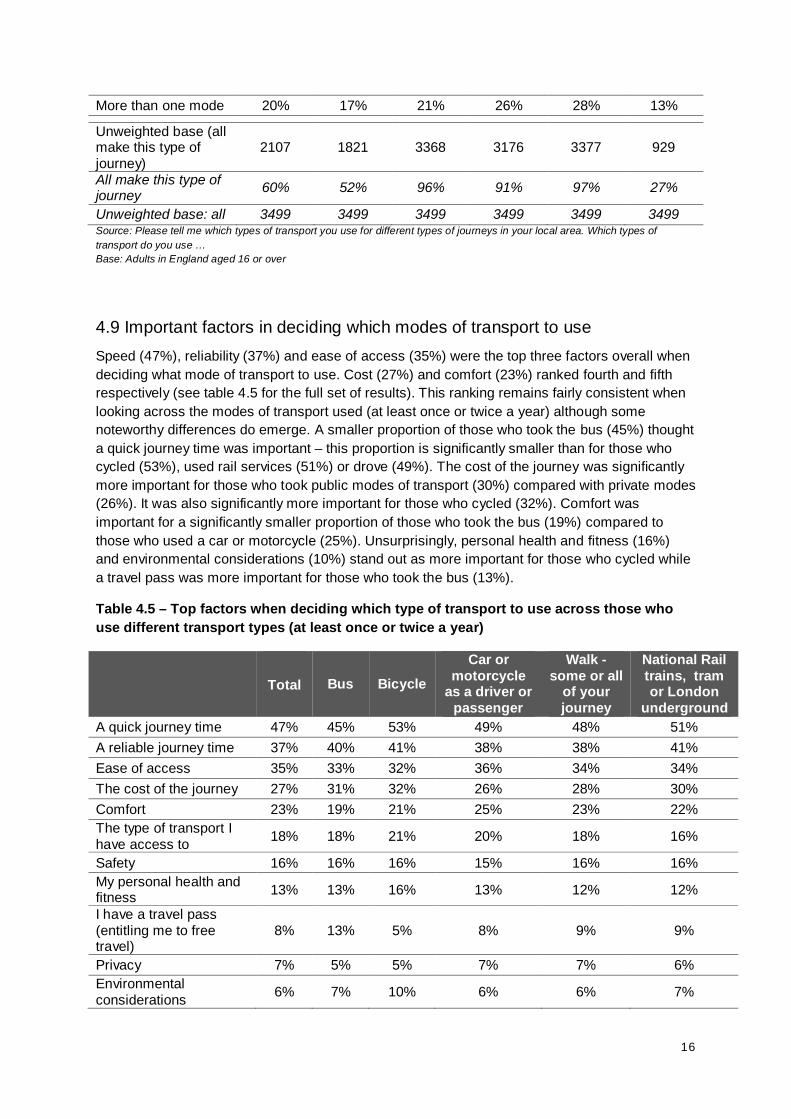
4.9 Important factors in deciding which modes of transport to use Speed (47%), reliability (37%) and ease of access (35%) were the top three factors overall when deciding what mode of transport to use. Cost (27%) and comfort (23%) ranked fourth and fifth respectively (see table 4.5 for the full set of results). This ranking remains fairly consistent when looking across the modes of transport used (at least once or twice a year) although some noteworthy differences do emerge. A smaller proportion of those who took the bus (45%) thought a quick journey time was important – this proportion is significantly smaller than for those who cycled (53%), used rail services (51%) or drove (49%). The cost of the journey was significantly more important for those who took public modes of transport (30%) compared with private modes (26%). It was also significantly more important for those who cycled (32%). Comfort was important for a significantly smaller proportion of those who took the bus (19%) compared to those who used a car or motorcycle (25%). Unsurprisingly, personal health and fitness (16%) and environmental considerations (10%) stand out as more important for those who cycled while a travel pass was more important for those who took the bus (13%).
Table 4.5 – Top factors when deciding which type of transport to use across those who use different transport types (at least once or twice a year)
Total Bus Bicycle
Car or motorcycle
as a driver or passenger
Walk - some or all
of your journey
National Rail trains, tram or London
underground A quick journey time 47% 45% 53% 49% 48% 51% A reliable journey time 37% 40% 41% 38% 38% 41% Ease of access 35% 33% 32% 36% 34% 34% The cost of the journey 27% 31% 32% 26% 28% 30% Comfort 23% 19% 21% 25% 23% 22% The type of transport I have access to 18% 18% 21% 20% 18% 16%
Safety 16% 16% 16% 15% 16% 16% My personal health and fitness 13% 13% 16% 13% 12% 12%
I have a travel pass (entitling me to free travel)
8% 13% 5% 8% 9% 9%
Privacy 7% 5% 5% 7% 7% 6% Environmental considerations 6% 7% 10% 6% 6% 7%

17
Other 1% 1% * * 1% 1% Nothing 1% * * 1% 1% * Don’t know * * - * * * Unweighted 3499 1984 763 2959 3135 1700 Source: Which, if any, of the following factors are important to you when deciding which type of transport to use in your local area? Please select up to three factors. Base: Adults in England aged 16 or over * indicates less than 1% of respondents chose this option
The importance rankings do shift somewhat across the age groups. As shown at table 4.6 a quick journey was significantly less important for those aged 65 and older (31%) than for other age groups. For this group, ease of access (38%) was the primary concern with reliability (31%) and speed (31%) ranking second. A quick journey (47%) and the cost of the journey (46%) were most important for the youngest age group (16-24 year olds) – a significantly higher proportion of respondents in this age group flagged cost as important.
Table 4.6 – Top factors when deciding which type of transport to use across age groups
Total 16-24 25-34 35-44 45-54 55-64 65+ A quick journey time 47% 54% 51% 52% 52% 45% 31% A reliable journey time 37% 34% 37% 42% 40% 41% 31% Ease of access 35% 30% 34% 39% 32% 35% 38% The cost of the journey 27% 46% 35% 26% 25% 23% 14% Comfort 23% 20% 24% 27% 21% 25% 23% The type of transport I have access to 18% 19% 17% 15% 18% 22% 19% Safety 16% 18% 24% 16% 16% 14% 11% My personal health and fitness 13% 8% 8% 15% 14% 16% 19% I have a travel pass (entitling me to free travel) 8% 5% 3% 3% 2% 7% 24%
Privacy 7% 5% 7% 10% 9% 6% 6% Environmental considerations 6% 4% 6% 7% 7% 5% 5% Unweighted Base 3499 487 525 535 448 461 1043 Source: Which, if any, of the following factors are important to you when deciding which type of transport to use in your local area? Please select up to three factors. Base: Adults in England aged 16 or over
Important factors were comparable for men and women except when it came to comfort and safety – a significantly higher proportion of women (18%) prioritised safety compared with men (15%), while a significantly higher proportion of men (26%) considered comfort important compared with women (21%). The cost of the journey was important for a significantly higher proportion (34%) of respondents of an ethnic minority background compared with respondents of a white background (26%).
A quick journey time was more important for those living in conurbation areas (49%) than for those in rural areas (42%). While reliability (39%) and ease of access (38%) were more important for other urban areas. As could be expected, the type of transport respondents had access to was an important factor for a significantly higher proportion of respondents in rural areas (27%) compared with conurbation (13%) and other urban areas (19%).

18
5. Walking This chapter examines attitudes to walking and what would motivate citizens to walk more for journeys in the local area. The questions related to walking were asked of all respondents who did not have a disability making it impossible to walk. Overall, nine percent of respondents said that they had a disability or a long standing health issue which made it difficult for them to walk. Of these, 12% said that it would be impossible for them to walk. These respondents were excluded from the walking section of the survey.
5.1 Willingness to walk more in the local area The majority (69%) of respondents agreed that they would be willing to walk more for journeys in their local area, with one in five (21%) strongly agreeing that they would be willing to walk more.
Willingness to walk more was closely associated with age; those under 65 years old were significantly more willing to walk overall, with those most willing to walk aged 16 to 34 (79%). Those aged 55 to 64 (64%) and 65 or over (52%) were less likely to agree that they would be willing to walk more (for a full breakdown, see table 5.1).
Table 5.1 – Whether respondents agree that they would walk more for journeys in their local area
Total 16-24 25-34 35-44 45-54 55-64 65+
Strongly agree 21% 25% 25% 23% 22% 20% 13%
Agree 48% 54% 54% 53% 50% 44% 39%
Neither agree nor disagree 14% 13% 10% 12% 13% 16% 18%
Disagree 10% 5% 8% 6% 8% 10% 18%
Strongly disagree 6% 3% 1% 4% 5% 9% 11%
Unweighted Base 3455 486 523 534 438 455 1019
Source: Q8A To what extent do you agree or disagree with the following statement: "I am willing to walk more often for journeys in my local area". Base: All who do not have a disability which makes it impossible to walk Respondents in social grades ABC1 were more likely to be willing to walk than those in social grades C2DE (73%, compared to 65%). This could be influenced by the higher number of over 65s in social grades C2DE; 25%, compared to 19% in grades ABC1. There was no significant difference between men (70%) and women (69%) regarding their willingness to walk.
Respondents of an ethnic minority background had a more positive attitude to walking more than those with a white background (78%, compared to 68%). However, this could be influenced by the fact that the former were more likely to live in London and other conurbations. In general, there was a correlation between urbanity and willingness to walk. Respondents living conurbations (74%) were more willing to walk than those in other urban areas (69%). Both these groups were more willing to walk than those living in rural areas (58%).
Willingness to walk more reflected current behaviours. Respondents who currently walk frequently (three or more times a week) or regularly (at least once a week) were the most likely to be willing to walk more (79% and 64% respectively agreed). However, almost two in five (37%) of those who did not walk regularly and a quarter (28%) of those who did not walk much at all (less than twice a year or never) expressed an interest in walking more, pointing to an opportunity to
19
drive significant behaviour change in these groups.
Willingness to walk was higher among those using active modes frequently (76%) and those using public modes frequently (75%). On the other hand, those who used private modes frequently (68%) or public modes infrequently (66%) were less likely to be willing to walk more, suggesting that these groups might need more encouragement to walk more.
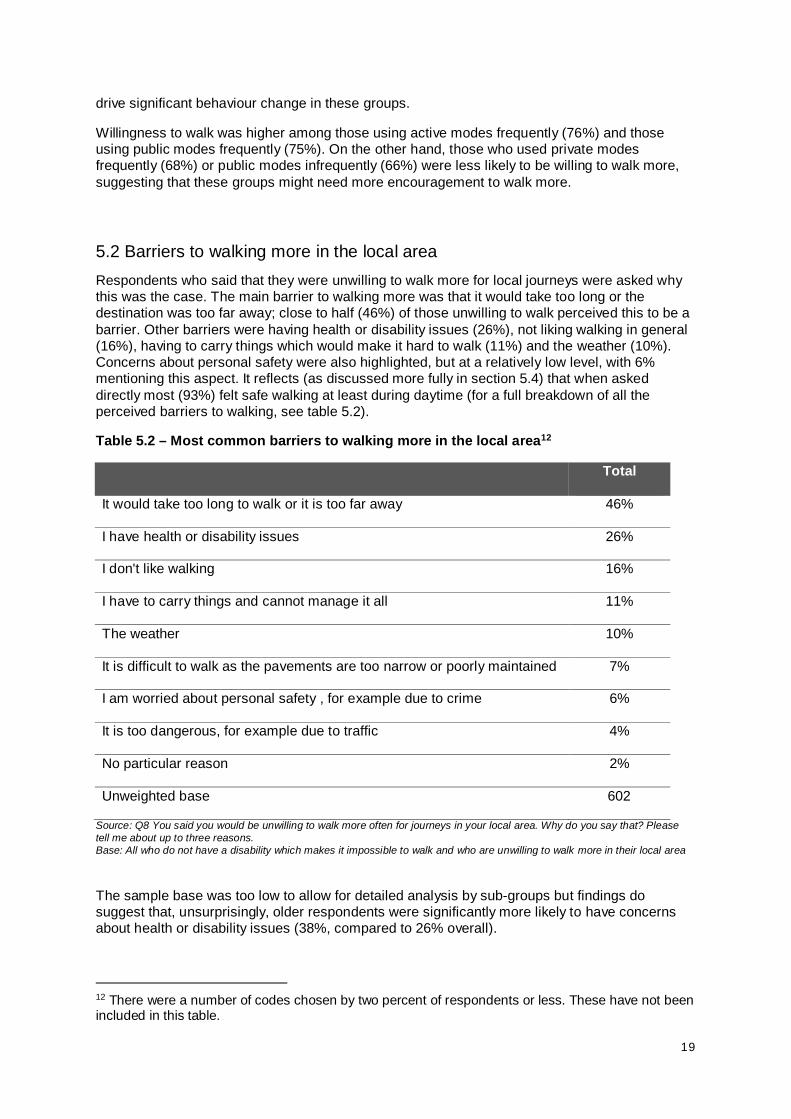
5.2 Barriers to walking more in the local area Respondents who said that they were unwilling to walk more for local journeys were asked why this was the case. The main barrier to walking more was that it would take too long or the destination was too far away; close to half (46%) of those unwilling to walk perceived this to be a barrier. Other barriers were having health or disability issues (26%), not liking walking in general (16%), having to carry things which would make it hard to walk (11%) and the weather (10%). Concerns about personal safety were also highlighted, but at a relatively low level, with 6% mentioning this aspect. It reflects (as discussed more fully in section 5.4) that when asked directly most (93%) felt safe walking at least during daytime (for a full breakdown of all the perceived barriers to walking, see table 5.2).
Table 5.2 – Most common barriers to walking more in the local area12
Total
It would take too long to walk or it is too far away 46%
I have health or disability issues 26%
I don't like walking 16%
I have to carry things and cannot manage it all 11%
The weather 10%
It is difficult to walk as the pavements are too narrow or poorly maintained 7%
I am worried about personal safety , for example due to crime 6%
It is too dangerous, for example due to traffic 4%
No particular reason 2%
Unweighted base 602
Source: Q8 You said you would be unwilling to walk more often for journeys in your local area. Why do you say that? Please tell me about up to three reasons.
Base: All who do not have a disability which makes it impossible to walk and who are unwilling to walk more in their local area
The sample base was too low to allow for detailed analysis by sub-groups but findings do suggest that, unsurprisingly, older respondents were significantly more likely to have concerns about health or disability issues (38%, compared to 26% overall).
12 There were a number of codes chosen by two percent of respondents or less. These have not been included in this table.

20
5.3 Factors which could motivate people to walk more in their local area All respondents in the walking section were asked what would encourage them to walk more. One in five (21%) mentioned having well-lit streets, one in five (18%) mentioned being more fit or healthy while one in six (17%) mentioned better maintained pavements (see table 5.3 for a full breakdown).
Table 5.3 – Factors which could motivate people to walk more in their local area13
Total
Well-lit streets 21%
I was more fit or healthy 18%
Better maintained pavements 17%
Less fear or crime or anti-social behaviour 14%
If I had someone to walk with 13%
Better behaviour from people on the road 11%
Wider pavements 10%
If it was more difficult or expensive to park my car 9%
Better information about walking routes 9%
Nothing would encourage me 27%
Don’t know 2%
Unweighted Base 3455
Source: Q9 Which, if any, of the following reasons would encourage you to walk more for journeys in your local area? Please select up to three reasons. Base: All who do not have a disability which makes it impossible to walk
The top motivating factors related to the physical road facilities – such as well-lit streets, better maintained pavements, and wider pavements – as well as more personal factors – such as whether they felt fit or healthy, safe (i.e. due to crime or behaviour from other road users) and whether they needed a walking companion. Better facilities as well as crime concerns are all issues of safety that appear to be underlying responses. Improvements in these key areas might encourage more people to consider walking in their local area. Those who agreed they would be willing to walk more were more likely to mention concerns about safety (17%) and the condition of walking facilities (well-lit streets: 26%; better maintained pavements: 20%), while those unwilling to walk more tended to highlight issues around health and fitness (26%) or to say that nothing would encourage them to walk (39%).
A quarter (27%) of all respondents said that nothing would encourage them to walk more.
13 There were a number of codes chosen by one percent of respondents or less. These have not been included in this table.
21
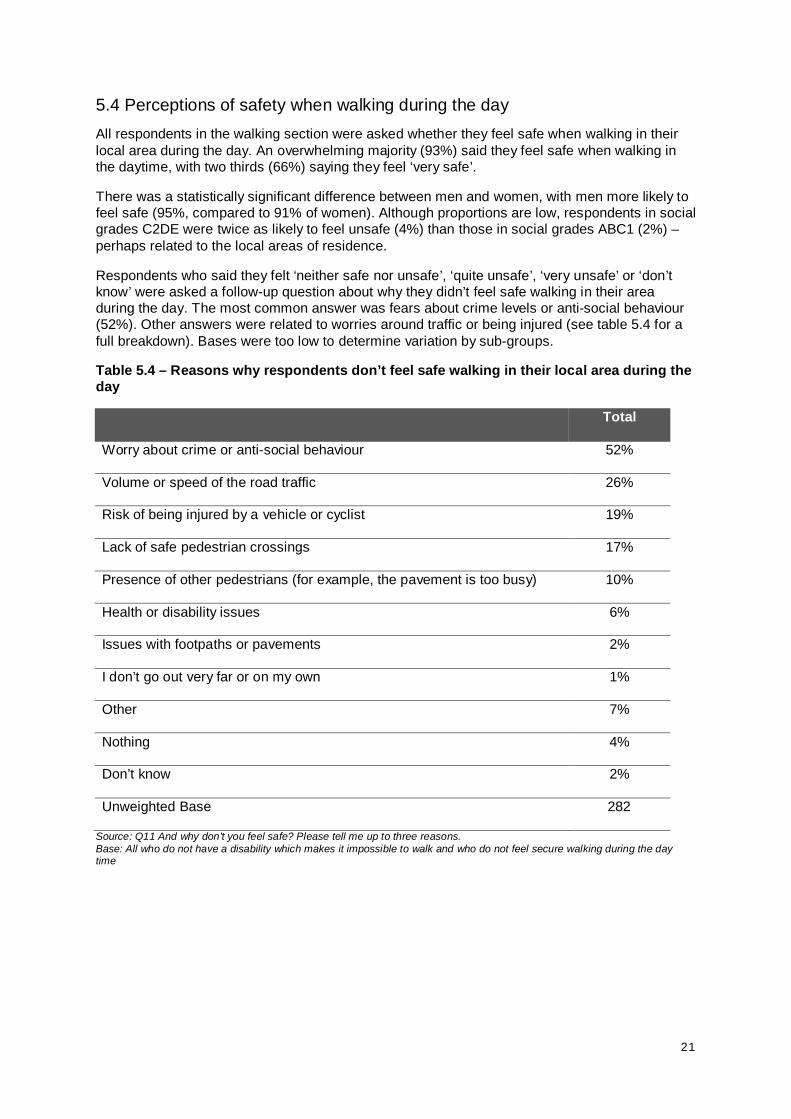
5.4 Perceptions of safety when walking during the day All respondents in the walking section were asked whether they feel safe when walking in their local area during the day. An overwhelming majority (93%) said they feel safe when walking in the daytime, with two thirds (66%) saying they feel ‘very safe’.
There was a statistically significant difference between men and women, with men more likely to feel safe (95%, compared to 91% of women). Although proportions are low, respondents in social grades C2DE were twice as likely to feel unsafe (4%) than those in social grades ABC1 (2%) – perhaps related to the local areas of residence.
Respondents who said they felt ‘neither safe nor unsafe’, ‘quite unsafe’, ‘very unsafe’ or ‘don’t know’ were asked a follow-up question about why they didn’t feel safe walking in their area during the day. The most common answer was fears about crime levels or anti-social behaviour (52%). Other answers were related to worries around traffic or being injured (see table 5.4 for a full breakdown). Bases were too low to determine variation by sub-groups.
Table 5.4 – Reasons why respondents don’t feel safe walking in their local area during the day
Total
Worry about crime or anti-social behaviour 52%
Volume or speed of the road traffic 26%
Risk of being injured by a vehicle or cyclist 19%
Lack of safe pedestrian crossings 17%
Presence of other pedestrians (for example, the pavement is too busy) 10%
Health or disability issues 6%
Issues with footpaths or pavements 2%
I don’t go out very far or on my own 1%
Other 7%
Nothing 4%
Don’t know 2%
Unweighted Base 282
Source: Q11 And why don't you feel safe? Please tell me up to three reasons. Base: All who do not have a disability which makes it impossible to walk and who do not feel secure walking during the day time

22
6. Bus Use In this section we asked people about their opinions of the bus facilities in their local area, to gain a deeper understanding of attitudes to bus use. This was about their use of buses for journeys within their local area or for commuting, rather than longer journeys on coaches. This section will explore what would encourage respondents to use the buses in their local areas more frequently, and what barriers stand in the way of this. We also asked respondents about the extent to which they felt that taking the bus fits with their lifestyle and who they are as people, to measure social attitudes towards this mode of transport.
This section was asked of all respondents who did not have a disability that made it impossible for them to use the bus since those with such a disability would not be in a position to answer these questions. Overall, five percent of respondents said they had a disability or a long standing health issue making it difficult to use local buses. Of these, 19% said their disability made it impossible to use local buses. This equated to one percent of all respondents.
6.1 Willingness to use buses in the local area We asked respondents how willing they would be to take the bus in their local area. As shown in table 6.1, overall two in five (38%) agreed that they would be willing to use local buses more frequently, while only slightly more (42%) disagreed. Of these, one in five (19%) strongly disagreed with the statement that they would be willing to travel by bus more regularly. The profile of respondents willing to take the bus more was broadly similar to those taking the bus frequently, specifically a high proportion of respondents:
• within the younger and older age bands • classified as social grades C2DE • who were females • of an ethnic minority background • who lived in a conurbation and especially in London
Willingness to travel by bus appears to be associated with age; more respondents aged 65 or older (45%) or 16 to 24 (42%) were willing to take the bus than the middle aged groups (for details, see table 6.1). It would seem that respondents not of an age where they typically tended work were more willing to travel by bus. This is confirmed in table 6.2, which shows that those who were in education (47%), retired (43%) or not in work (42%) were more likely to be willing to travel more by bus than those who were in full time (33%) or part time work (34%). Relatedly, respondents in social grades C2DE were more likely to be willing to take the bus more compared with those in social grades ABC1 (41%, compared to 36%).
Table 6.1 – Level of agreement across age ranges and willingness to use the bus more
Total 16-24 25-34 35-44 45-54 55-64 65+
Agree net 38% 42% 38% 38% 34% 32% 45%
Disagree net 42% 33% 43% 45% 50% 48% 34%
Unweighted base 3458 486 524 534 440 453 1021
Source: Q12 The extent of to which they agree/disagree with the statement: ‘I am willing to travel by bus more often for journeys in my local area’ Base: all adults in England who did not have a disability which made it impossible to use buses

23
Table 6.2 – Whether respondents agreed that they would be more willing to take the bus
Total Full time Part time Retired In
education Not
working
Strongly agree 7% 7% 7% 8% 7% 9%
Agree 31% 26% 27% 35% 40% 34%
Neither agree nor disagree 19% 17% 21% 19% 22% 19%
Disagree 23% 26% 22% 20% 17% 21%
Strongly disagree 19% 22% 21% 17% 13% 15%
Agree (net) 38% 33% 34% 43% 47% 42%
Disagree (net) 42% 48% 43% 37% 29% 37%
Unweighted base 3458 1103 472 1118 228 537
Source: Q12 The extent of to which they agree/disagree with the statement: ‘I am willing to travel by bus more often for journeys in my local area’ Base: all adults in England who did not have a disability which made it impossible to use buses
There was a significant difference between men and women in their willingness to use the bus, with 41% of women being more willing to travel by bus, as opposed to only 35% of men. Respondents of a minority ethnic background were more like to be willing to use the bus more than those of a white background (47%, compared to 37%). Regional differences link to this pattern across ethnicity due to a high proportion of respondents from an ethnic minority background living in London where a significantly higher proportion (57%) of respondents were willing to take the bus more frequently. More broadly, those living in conurbation areas (46%) were more likely to agree they would be willing to use the bus more, compared to only a third in other urban areas (34%) and in rural areas (32%).
Individuals who were already using public transport were more likely to be willing to use the buses in their local area more. Fifty-seven percent of respondents who were already using the bus were willing to use the buses more. More generally, those already using public transport were the most likely to be willing to use the bus more (49%), followed by those using active modes of transport (39%) while those using private modes of transport were the least likely to be willing (34%).
6.2 Barriers to using buses in the local area Respondents who were unwilling to travel more by bus in their local area were asked a follow-up question about barriers to doing so. A quarter (25%) of respondents associated their unwillingness with a lack of convenience; they considered other modes of transport easier to use. The top factors respondents found to be important when deciding which type of transport to use (as reported in section 4.9) included speed (47%), reliability (37%) and ease of access (35%) all of which fit under the broad umbrella of convenience. The second most important barrier to willingness to use buses more fits directly into this theme too; 20% of respondents were deterred by slow journey times. Addressing these perceptions of convenience and speed are factors that initiatives coming from the Bus Bill could aim to address.

24
Although cost ranked third (18%) overall as a barrier, it was the primary barrier among respondents aged 16 to 24 who were unwilling to travel by bus more (25%). This is a noteworthy discovery in light of the findings (discussed earlier in the report) that cost was an important factor in deciding which mode of transport to use for this age group (47%), and that this is the age group currently travelling most frequently by bus (for details of these choices see table 6.4).
Table 6.4 – Barriers to bus use by age
Total 16-24 25-34 35-44 45-54 55-64 65+
Not convenient, easier by other mode 25% 19% 18% 24% 31% 26% 28%
Bus journey is too slow 20% 23% 29% 24% 17% 16% 11%
Buses are expensive 18% 25% 27% 24% 16% 14% 4%
Buses are not frequent enough 15% 9% 13% 15% 17% 18% 17%
I have to carry things 13% 10% 16% 17% 9% 13% 14%
Buses do not run when/where I want to go 11% 5% 8% 12% 13% 19% 8%
Buses are not reliable and punctual 9% 11% 11% 9% 9% 8% 8%
Buses are uncomfortable 8% 10% 9% 11% 5% 7% 7%
I would need to change bus/ no direct route 6% 4% 11% 6% 6% 6% 3%
I don't know what bus services are available 5% 8% 4% 5% 5% 7% 2%
Buses are not accessible/difficult to get on and off 5% 0 1% 2% 7% 4% 12%
Bus stop is not near home\destination 4% 2% 2% 3% 2% 5% 6%
I do not feel safe 3% 4% 1% 6% 1% 2% 4%
Other 16% 18% 12% 12% 12% 16% 23%
Nothing 2% 3% 1% 2% 3% 3% 1%
Unweighted Base 1421 173 225 246 213 218 346 Source: Q13 Why unwilling to travel by bus more often in the local area Base: all adults in England who did not have a disability which made it impossible to use buses and who are unwilling to travel more by bus in their local area
Respondents in social grades ABC1 were more likely to attribute their unwillingness to use buses more to inconvenience than those in social grades C2DE (29%, compared to 19%). While significantly more men (44%) than women (40%) were unwilling to use the bus more, the reasons were fairly consistent with those that women gave. The only significant difference across gender was that twice as many women (18%) as men (9%) determined that they had too much to carry to travel by bus more regularly.
6.3 Factors which would motivate people to use their local buses more Respondents were asked to select up to three factors that would motivate increased bus use. Cheaper fares (36%), more frequent services (32%) and more bus routes (24%) were the top three factors that would encourage respondents to use the buses more in their local area. Sixteen percent of respondents said that nothing would encourage them to use their local bus services more regularly, however, with a significantly higher proportions of older respondents (55 years and older; 22%) feeling this way than other age groups.
There were significant differences in motivations across age groups suggesting that different age groups have different priorities for using the bus. Younger people aged 16 to 24 (49%) and 25 to

25
34 (51%) wanted journeys to be cheaper, perhaps because these groups tend to be in economic infancy, and may not be in work, or have only just started working. For those aged 65 or older, however, price was only a minor concern (10%).The main motivating factor for those older than 65 years was the desire for more frequent services (34%).
Table 6.6 – Motivating factors with age
Total 16-24 25-34 35-44 45-54 55-64 65+
Cheaper fares 36% 49% 51% 40% 41% 31% 10%
More frequent services 32% 30% 34% 33% 31% 29% 34%
More bus routes 24% 22% 26% 26% 21% 25% 23%
Quicker journey times 20% 23% 22% 23% 19% 19% 17%
Better facilities at bus stops 8% 5% 8% 7% 5% 8% 11%
More 'park and ride' schemes 7% 4% 6% 7% 8% 11% 8%
Better information 7% 7% 5% 9% 6% 8% 6%
Better facilities on buses e.g. Wi--Fi 6% 12% 8% 6% 3% 4% 3% Live travel arrival information at bus stops 5% 6% 7% 6% 4% 5% 4%
More difficult or expensive to park my car\motorcycle 5% 4% 4% 5% 5% 6% 5%
'Hopper’-like fares 4% 6% 5% 7% 5% 3% 2%
Other 4% 6% 3% 2% 7% 5% 9%
Nothing 16% 12% 11% 15% 15% 22% 22%
Unweighted Base 3458 486 524 534 440 453 1021 Source: Q14 Things that would encourage travelling by bus more for journeys in the local area Base: all adults in England who did not have a disability which made it impossible to use buses
There were also significant regional differences across motivational factors. In London, a significantly higher proportion of respondents wanted quicker journey times (29%), live travel information (9%) and multi-use tickets (9%) – something that was in fact introduced in September 2016 (i.e. the ‘Hopper-fare’). A higher proportion of respondents in Yorkshire and the Humber (14%) and the South East (9%) would be motivated by more ‘park and ride’ schemes, allowing them to shorten their car journeys in exchange for public transport use.
6.4 Extent to which people viewed taking the bus as a fit with who they are were In order to better understand social perceptions of buses and of travelling by bus, respondents were asked how bus travel fitted with their lifestyles and personal identities. As a means of mass transit, for some buses hold the stigma of being for those too poor to afford their own means of transportation. In order to understand how much, if at all, this stigmatisation still affects travellers, respondents were asked if they thought taking the bus fits with their lifestyle and who they are.
It seems likely that this stigmatisation persists, as nearly half (49%) of respondents disagreed with the idea that using buses fitted with their lifestyle and who they are while only 30% actively agreed (the rest remaining neutral or saying they did not know). Nearly a quarter (23%) of respondents strongly disagreed that travelling by bus fitted their lifestyle, suggesting that a substantial portion of the English population may avoid travelling by bus due to social perceptions. This also relates to the top barriers identified as hindering respondents’ willingness

26
to use the bus more frequently; ease or convenience and journey time. These factors are strongly related to lifestyle as they involve time, an important currency in modern life; lower journey times would allow people more time to complete tasks they felt were more important.
The extent to which respondents were willing to travel by bus and the extent to which respondents considered bus travel to fit with their lifestyles were strongly associated. Overall 56% of respondents gave the exact same answer on the willingness to use the bus more question and this question about how bus travel fitted with their lifestyle and identify. Almost two thirds (64%) of respondents who were willing to some extent to use the bus more felt like it fitted with their lifestyles and who they were. On the other hand, 86% of those who were unwilling to use the bus more disagreed to some extent that bus travel suited them personally. Specifically, a high proportion (76%) of those who were the least willing to use the bus more also indicated the strongest disagreement to buses fitting them and their lifestyle.
Agreement with the statement that the bus fits with their lifestyle and who they are was significantly higher among the youngest (16-24; 38%) and oldest (65+; 40%) respondents reflecting the pattern across age of those who currently use the bus most and are also willing to use it more frequently. But even among these more positive age groups, those who disagreed outweighed those who agreed; with 40% of 16-24 year olds and 42% of 65+ year olds disagreeing.
In the past, many middle class people prided themselves upon having their own transportation, seen as a luxury, and as such there still appears to be remnants of this evident in the data. A significantly higher proportion (54%) of respondents classified as social grades ABC1 disagreed with the idea that buses suited their lifestyle compared with respondents in social grades C2DE (44%) (For more detail, see table 6.7). This relates to findings from the Climate Change and Travel Choice study which asked respondents whether they agreed with the statement “I think that successful people tend to travel by car rather than by bus” to which 52% of respondents agreed. This links with the idea that success and social standing are linked to modes of transport and transport stigma.
Table 6.7 – Taking the bus fits with my lifestyle and who I am, with demographic information on social grade and ethnicity
Total ABC1 C2DE White Minority Ethnicities
Agree net 30% 26% 36% 29% 41%
Disagree net 49% 54% 44% 51% 35%
Unweighted base 3458 1591 1867 3066 371
Source: Q15 The extent of to which they agree/disagree with the statement: ‘Taking the bus fits with my lifestyle and who I am’ Base: all adults in England who did not have a disability which made it impossible to use buses
A higher proportion (41%) of respondents of a minority ethnic background agreed that buses suited them than respondents of a white background (29%). Respondents from the West Midlands region disagreed most with the statement (61%), whereas respondents in London agreed most with the statement (51%).
Motivating factors for those who felt that travelling by bus was not in line with their lifestyle, that would encourage them to use buses more regularly, were cheaper fares (26%) and more

27
frequent services (21%) which may be an indicator that although many of the respondents who stated bus travel did not suit them were of the upper/middle class, cheaper travel may prove to be a mitigating factor in the social stigma associated with public transport.

28
7. Cycling The final part of our study asked respondents about their attitudes to cycling and their views on cycling facilities in their local area. As with the previous two chapters, this chapter will look at barriers to cycling as well as what would motivate citizens to cycle more for journeys in the local area.
This final section of questions was asked of all respondents who did not have a disability making it impossible to cycle. In total, nine percent of respondents said that they had a disability or long standing health issue which makes it difficult for them to use a bicycle. Of these, 21% said that it would be impossible for them to use a bike. This constitutes two percent of the overall respondents. These respondents were excluded from the cycling section.
7.1 Willingness to cycle more in the local area As reported in Chapter 4, cycling was the least popular mode of transport with only a quarter (25%) of respondents travelling locally by bicycle more than twice a year. Three in ten (30%) respondents agreed that they would be willing to cycle more for journeys. However, over half of respondents (53%) disagreed, with a third of all respondents (34%) strongly disagreeing. Disagreement, and hence unwillingness, is a lot higher than for walking (15%) or taking the bus (42%) more frequently. This finding suggests that there may be more barriers to cycling than other modes, but also reflects lower current use of this mode.
Willingness to cycle seems to be less related to age than walking or taking the bus. Although the younger age groups are more willing to cycle than the two oldest age groups, there is not a clear pattern among respondents younger than 55 years old. As with walking those in the older age groups (55 and older) show the least willingness to travel this way. Those aged 55 to 64 are slightly less willing to cycle more (56%) while, as might be expected, those aged 65 or older are the least willing to cycle more (73%). This age group were also significantly more likely to strongly disagree than most other age groups with over half feeling this way (54%) (see table 7.1 for more details).
Table 7.1 – Whether respondents agree or disagree that they would cycle more for journeys in their local area
Total 16-24 25-34 35-44 45-54 55-64 65+
Strongly agree 6% 7% 7% 8% 8% 7% 2%
Agree 23% 30% 33% 28% 24% 21% 9%
Neither agree nor disagree 12% 13% 12% 13% 13% 11% 9%
Disagree 20% 22% 21% 18% 21% 19% 19%
Strongly disagree 34% 23% 23% 29% 30% 37% 54%
Agree (Net) 30% 37% 39% 36% 32% 28% 11%
Disagree (Net) 53% 46% 43% 46% 51% 56% 73%
Unweighted Base 3426 486 522 532 438 451 997 Source: Q16 To what extent do you agree or disagree with the following statement: "I am willing to cycle more often for journeys in my local area" Base: all adults in England who did not have a disability which made it impossible to cycle
There were significant differences across various subgroups with regards to willingness to cycle more. Men were more likely to agree that they would be willing to cycle more compared with women (37%, compared to 22%), while women were more likely to disagree to this than men (60%, compared to 47%). Again this reflects the pattern of current use across gender; 32% of men cycled more than twice a year compared with only 19% of women. Respondents in social grades ABC1 were more likely to agree that they would be willing to cycle more than those in
29
grades C2DE (34%, compared to 24%). Moreover, those living in urban areas other than cities were more likely to agree than those living in cities and rural areas (33%, compared to 27% and 26%). Specifically a high proportion (35%) of respondents in the South West region were willing to cycle more corresponding with the finding that respondent in this region were also currently cycling the most (42% more than twice a year).
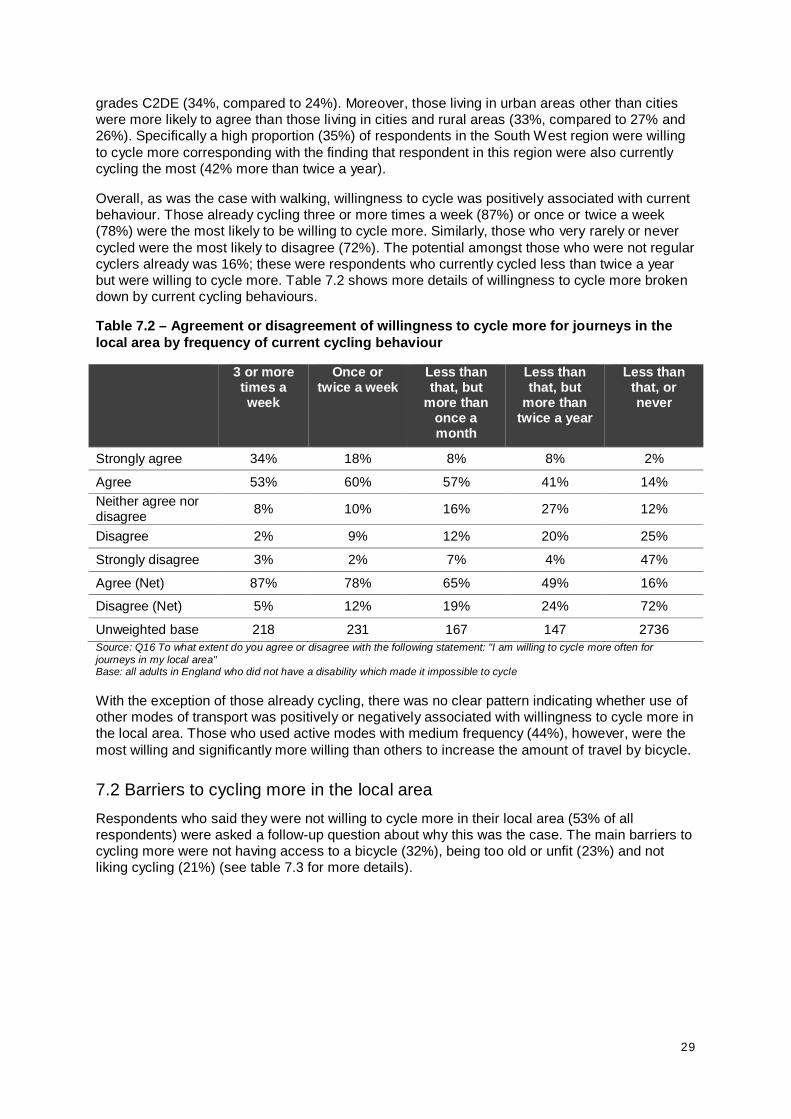
Overall, as was the case with walking, willingness to cycle was positively associated with current behaviour. Those already cycling three or more times a week (87%) or once or twice a week (78%) were the most likely to be willing to cycle more. Similarly, those who very rarely or never cycled were the most likely to disagree (72%). The potential amongst those who were not regular cyclers already was 16%; these were respondents who currently cycled less than twice a year but were willing to cycle more. Table 7.2 shows more details of willingness to cycle more broken down by current cycling behaviours.
Table 7.2 – Agreement or disagreement of willingness to cycle more for journeys in the local area by frequency of current cycling behaviour
3 or more times a week
Once or twice a week
Less than that, but
more than once a month
Less than that, but
more than twice a year
Less than that, or never
Strongly agree 34% 18% 8% 8% 2%
Agree 53% 60% 57% 41% 14% Neither agree nor disagree 8% 10% 16% 27% 12%
Disagree 2% 9% 12% 20% 25%
Strongly disagree 3% 2% 7% 4% 47%
Agree (Net) 87% 78% 65% 49% 16%
Disagree (Net) 5% 12% 19% 24% 72%
Unweighted base 218 231 167 147 2736 Source: Q16 To what extent do you agree or disagree with the following statement: "I am willing to cycle more often for journeys in my local area" Base: all adults in England who did not have a disability which made it impossible to cycle
With the exception of those already cycling, there was no clear pattern indicating whether use of other modes of transport was positively or negatively associated with willingness to cycle more in the local area. Those who used active modes with medium frequency (44%), however, were the most willing and significantly more willing than others to increase the amount of travel by bicycle.
7.2 Barriers to cycling more in the local area Respondents who said they were not willing to cycle more in their local area (53% of all respondents) were asked a follow-up question about why this was the case. The main barriers to cycling more were not having access to a bicycle (32%), being too old or unfit (23%) and not liking cycling (21%) (see table 7.3 for more details).

30
Table 7.3 – Barriers to cycling more in the local area14
Total
I don’t have access to a bicycle 32%
I am too old or unfit 23%
I don’t like cycling 21%
It’s too dangerous 15%
I have to carry things, and cannot manage it all 11%
I can’t ride a bike or I am not confident riding a bicycle 10%
It takes too long to cycle or is too far away 6%
There are not enough lanes or paths along my route 4%
Weather 4%
I have health or disability issues 3%
I am worried about my personal safety (e.g. due to crime) 3%
Lack of secure facilities to park or store bicycle 3%
Too many hills 1%
Other 1%
Nothing 1%
Unweighted base 1941
Q17 You said you would be unwilling to cycle more often for journeys in your local area. Why do you say that? Please tell me up to three reasons. Base: all adults in England who did not have a disability which made it impossible to cycle and were unwilling to cycle more
The WCIS seeks to increase cycling among typically under-represented groups (for example women or older people). Those aged 55 or older were the most likely to say that they were too old or unfit to ride a bike; in particular those 65 or older (51%) but also a high proportion of those between the ages of 55 and 64 (30%). The youngest respondents, aged 16 to 24, were significantly more likely than any other age group (42%), except those aged 25 to 34 (33%), to say not having access to a bike was a barrier to cycling more. As pointed out previously, women were less likely to already cycle (only 19% doing so more than twice a year) and were also less willing to cycle more (22%) compared with men. Two reasons that stood out as significantly more relevant for women compared with men were 1) not being confident riding a bicycle (14% versus 5% for men) and 2) having to carry things (13% versus 8% for women).
Those living in London were more likely to say cycling would be too dangerous than all other regions in the country except the South West. A quarter (26%) of the respondents in the capital said cycling would be too dangerous. The highest proportions of respondents in the East
14 There were a small number of codes (5) chosen by less than 1% of respondents which have been excluded from the tables due to space. These are included in the published tables.
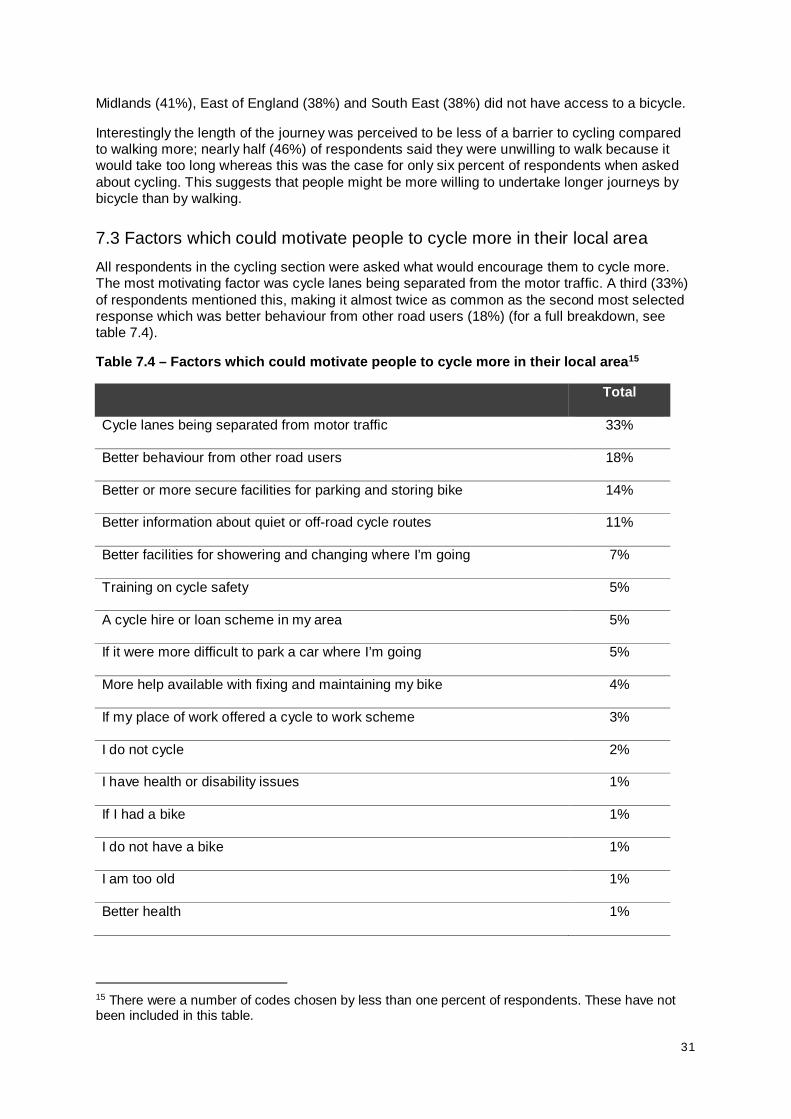
31
Midlands (41%), East of England (38%) and South East (38%) did not have access to a bicycle.
Interestingly the length of the journey was perceived to be less of a barrier to cycling compared to walking more; nearly half (46%) of respondents said they were unwilling to walk because it would take too long whereas this was the case for only six percent of respondents when asked about cycling. This suggests that people might be more willing to undertake longer journeys by bicycle than by walking.
7.3 Factors which could motivate people to cycle more in their local area All respondents in the cycling section were asked what would encourage them to cycle more. The most motivating factor was cycle lanes being separated from the motor traffic. A third (33%) of respondents mentioned this, making it almost twice as common as the second most selected response which was better behaviour from other road users (18%) (for a full breakdown, see table 7.4).
Table 7.4 – Factors which could motivate people to cycle more in their local area15
Total
Cycle lanes being separated from motor traffic 33%
Better behaviour from other road users 18%
Better or more secure facilities for parking and storing bike 14%
Better information about quiet or off-road cycle routes 11%
Better facilities for showering and changing where I’m going 7%
Training on cycle safety 5%
A cycle hire or loan scheme in my area 5%
If it were more difficult to park a car where I’m going 5%
More help available with fixing and maintaining my bike 4%
If my place of work offered a cycle to work scheme 3%
I do not cycle 2%
I have health or disability issues 1%
If I had a bike 1%
I do not have a bike 1%
I am too old 1%
Better health 1%
15 There were a number of codes chosen by less than one percent of respondents. These have not been included in this table.
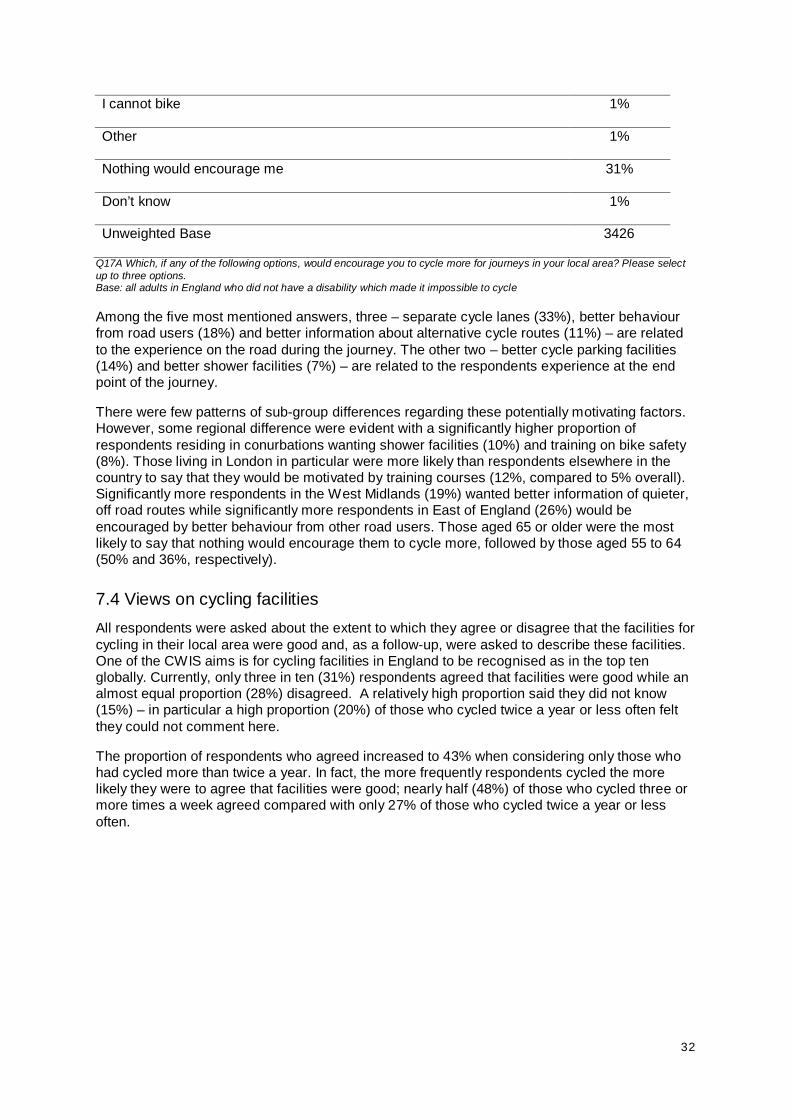
32
I cannot bike 1%
Other 1%
Nothing would encourage me 31%
Don’t know 1%
Unweighted Base 3426
Q17A Which, if any of the following options, would encourage you to cycle more for journeys in your local area? Please select up to three options. Base: all adults in England who did not have a disability which made it impossible to cycle
Among the five most mentioned answers, three – separate cycle lanes (33%), better behaviour from road users (18%) and better information about alternative cycle routes (11%) – are related to the experience on the road during the journey. The other two – better cycle parking facilities (14%) and better shower facilities (7%) – are related to the respondents experience at the end point of the journey.
There were few patterns of sub-group differences regarding these potentially motivating factors. However, some regional difference were evident with a significantly higher proportion of respondents residing in conurbations wanting shower facilities (10%) and training on bike safety (8%). Those living in London in particular were more likely than respondents elsewhere in the country to say that they would be motivated by training courses (12%, compared to 5% overall). Significantly more respondents in the West Midlands (19%) wanted better information of quieter, off road routes while significantly more respondents in East of England (26%) would be encouraged by better behaviour from other road users. Those aged 65 or older were the most likely to say that nothing would encourage them to cycle more, followed by those aged 55 to 64 (50% and 36%, respectively).
7.4 Views on cycling facilities All respondents were asked about the extent to which they agree or disagree that the facilities for cycling in their local area were good and, as a follow-up, were asked to describe these facilities. One of the CWIS aims is for cycling facilities in England to be recognised as in the top ten globally. Currently, only three in ten (31%) respondents agreed that facilities were good while an almost equal proportion (28%) disagreed. A relatively high proportion said they did not know (15%) – in particular a high proportion (20%) of those who cycled twice a year or less often felt they could not comment here.
The proportion of respondents who agreed increased to 43% when considering only those who had cycled more than twice a year. In fact, the more frequently respondents cycled the more likely they were to agree that facilities were good; nearly half (48%) of those who cycled three or more times a week agreed compared with only 27% of those who cycled twice a year or less often.
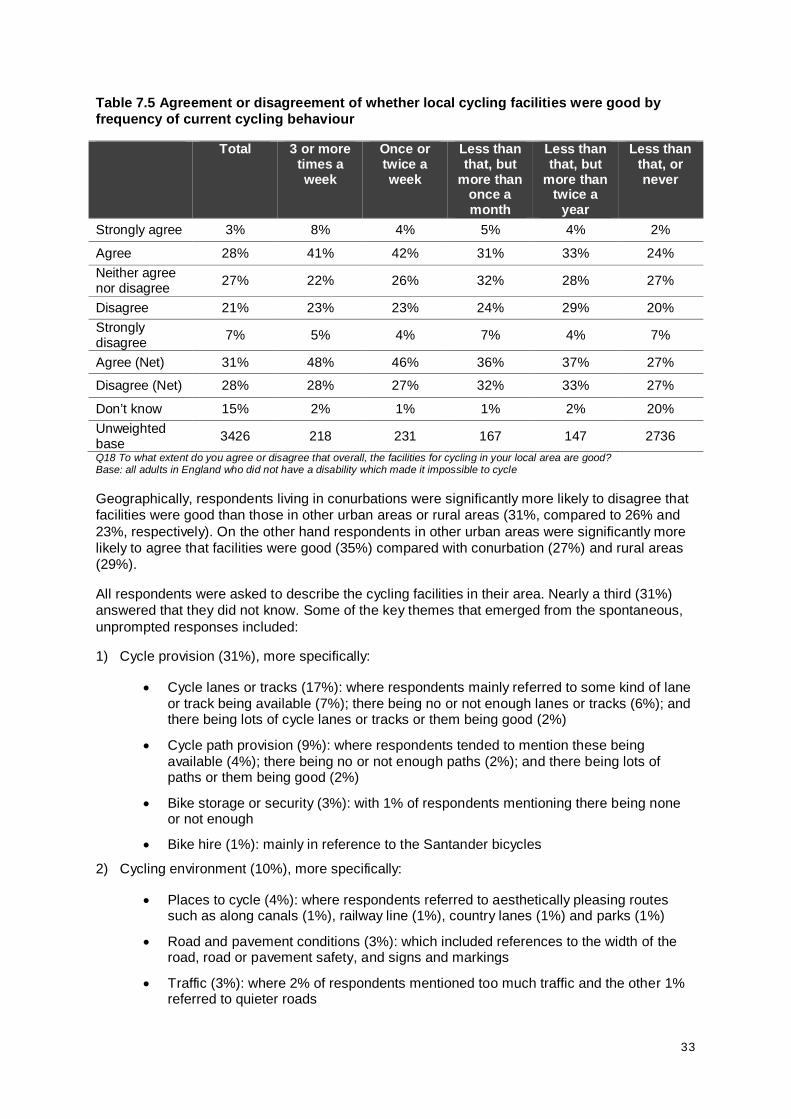
33
Table 7.5 Agreement or disagreement of whether local cycling facilities were good by frequency of current cycling behaviour
Total 3 or more times a week
Once or twice a week
Less than that, but
more than once a month
Less than that, but
more than twice a
year
Less than that, or never
Strongly agree 3% 8% 4% 5% 4% 2%
Agree 28% 41% 42% 31% 33% 24% Neither agree nor disagree 27% 22% 26% 32% 28% 27%
Disagree 21% 23% 23% 24% 29% 20% Strongly disagree 7% 5% 4% 7% 4% 7%
Agree (Net) 31% 48% 46% 36% 37% 27%
Disagree (Net) 28% 28% 27% 32% 33% 27%
Don’t know 15% 2% 1% 1% 2% 20% Unweighted base 3426 218 231 167 147 2736 Q18 To what extent do you agree or disagree that overall, the facilities for cycling in your local area are good? Base: all adults in England who did not have a disability which made it impossible to cycle
Geographically, respondents living in conurbations were significantly more likely to disagree that facilities were good than those in other urban areas or rural areas (31%, compared to 26% and 23%, respectively). On the other hand respondents in other urban areas were significantly more likely to agree that facilities were good (35%) compared with conurbation (27%) and rural areas (29%).
All respondents were asked to describe the cycling facilities in their area. Nearly a third (31%) answered that they did not know. Some of the key themes that emerged from the spontaneous, unprompted responses included:
1) Cycle provision (31%), more specifically:
• Cycle lanes or tracks (17%): where respondents mainly referred to some kind of lane or track being available (7%); there being no or not enough lanes or tracks (6%); and there being lots of cycle lanes or tracks or them being good (2%)
• Cycle path provision (9%): where respondents tended to mention these being available (4%); there being no or not enough paths (2%); and there being lots of paths or them being good (2%)
• Bike storage or security (3%): with 1% of respondents mentioning there being none or not enough
• Bike hire (1%): mainly in reference to the Santander bicycles
2) Cycling environment (10%), more specifically:
• Places to cycle (4%): where respondents referred to aesthetically pleasing routes such as along canals (1%), railway line (1%), country lanes (1%) and parks (1%)
• Road and pavement conditions (3%): which included references to the width of the road, road or pavement safety, and signs and markings
• Traffic (3%): where 2% of respondents mentioned too much traffic and the other 1% referred to quieter roads

34
Outside of these two main groups, five percent of respondents made a more general positive reference, five percent a neutral one and eight percent a negative one. Eleven percent of respondents claimed there were no cycling facilities in their local areas. A significantly higher proportion of respondents in the North East (26%) and West Midland (19%) gave this response compared with most other regions. The remainder of responses fell into a rather fragmented variety of descriptions.

35
Appendix A – More details about method
Fieldwork The Local Road Users Survey questions were included on a face-to-face omnibus survey – a multi-client survey for short studies. The Kantar TNS face-to-face in-home Omnibus is conducted at regular intervals; specifically, data collection for the Local Road User questions was conducted in England across two waves:
1) 05 - 09 October 2016 during which 1,758 completes were collected 2) 07 - 11 October 2016 during which 1,741 completes were collected
This enabled the full sample of 3,499 completes to be collected in a short timeframe. Fieldwork was conducted during the afternoon and evening on weekdays as well across weekends. Each interviewer was equipped with a tablet computer which allow for high quality data collection with full verbatim responses where required.
Quota sampling In addition to conventional quota sampling Kantar TNS Omnibus uses random location sampling. Specifically, a computerised sampling system is used to integrate the Postcode Address File (PAF) with the 2011 Census small area data at output area level. This enabled replicated waves of multi-stage stratified samples to be drawn with accurate and up to date address selection using PPS methods (probability proportional to size). Quotas are managed quotas to incorporate key characteristics; notably employment status, which is known to have a bearing on individuals’ probabilities of being at home and so available for interview. To ensure a balanced sample of adults within the effective contacted addresses, quotas are set by gender and within this work status as well as presence of children. Additionally, interviewers worked within rules that governed the distribution, spacing and timings of interviews. Within each sample point, only one interview was undertaken per household and a minimum of three households were left between each successful interview. In general, sampling points all have the same quota set. However, there are two sets of quotas:
• London • The rest of England excluding London
This difference is primarily because in general interviewers tend to achieve fewer interviews in London – so the quotas are set to account for this.
Weighting Despite following the above quota plan we applied weighting for the following reasons:
• To ensure the data matched the latest and highest quality census data sources • To reduce error. There are two main components to error: bias (how accurate the results are)
and variance (linked to the size of the margins of error – the greater the variance, the larger the margins of error).
Accordingly, to reduce the sample bias we created the optimal weighting approach; following statistical procedures to select the most appropriate variables from the latest census data. The following variables were included:
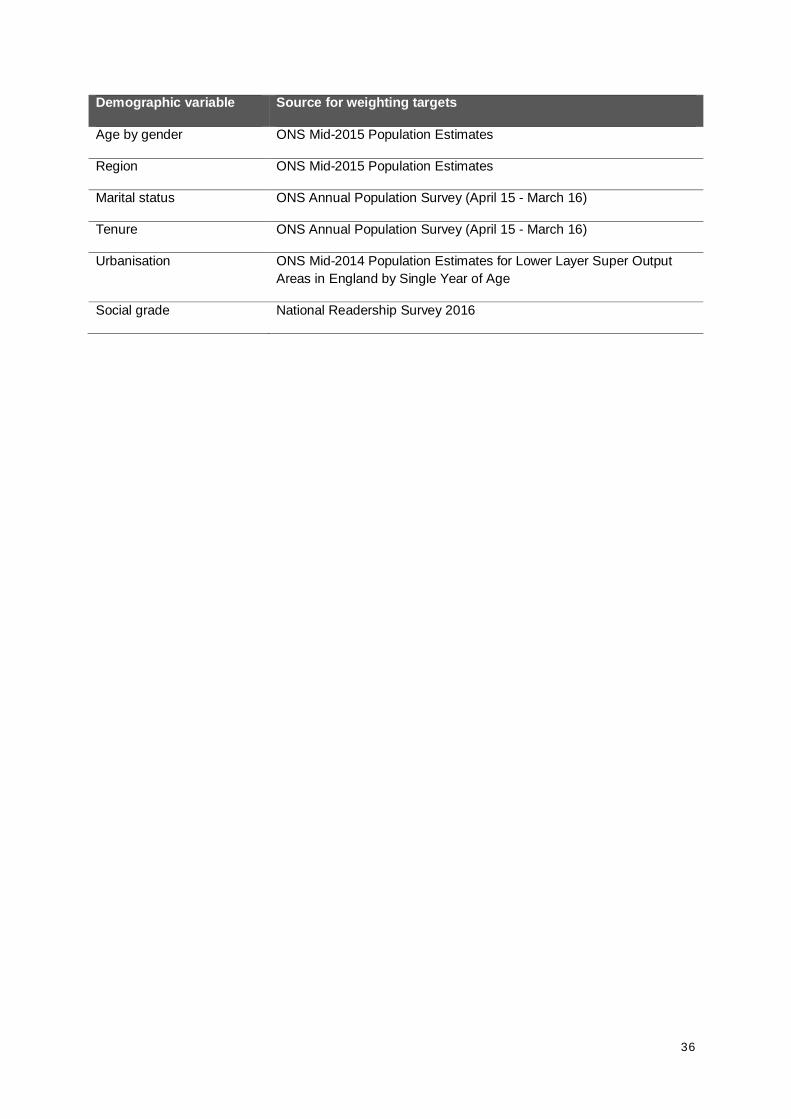
36
Demographic variable Source for weighting targets
Age by gender ONS Mid-2015 Population Estimates
Region ONS Mid-2015 Population Estimates
Marital status ONS Annual Population Survey (April 15 - March 16)
Tenure ONS Annual Population Survey (April 15 - March 16)
Urbanisation ONS Mid-2014 Population Estimates for Lower Layer Super Output Areas in England by Single Year of Age
Social grade National Readership Survey 2016

37
Appendix B - Questionnaire
B001: Introduction Begin block
Q001 - Q001: F1 = All adults 16+ in England Text
Not back
I would now like to ask you some questions about walking, cycling and using buses in your local area.
Q002 - Q002: F1 = All adults 16+ in England Multi coded
Not back | Min = 1
First of all, do you have any disability or long standing health problem that makes it difficult for you to do any of the following?
READ OUT
Rotated
1 Walk (Go out on foot ) 2 Cycle 3 Use local buses 4 Get in or out of a car 5 None of these (do not read) *Position fixed *Exclusive 6 Prefer not to say (do not read) *Position fixed *Exclusive
Researcher notes: This question is adapted from the "Climate change and transport choice segmentation (B2)" and the "National Travel Survey (NTS): Individual (2007-2014)"
Q003 - Q003: F2 = All who have a disability which makes it difficult to walk (Q002\1) or cycle (Q002\2) or use buses (Q002\3) or use a car (Q002\4)
Single coded
Not back
And how severely does this limit your ability to do that? Is it ...
READ OUT
Normal
1 Impossible 2 Very difficult 3 Quite difficult 6 Don't know (do not read)

38
7 Refused (do not read)
Researcher notes: This question is adapted from the "Climate change and transport choice segmentation (B2)"
Q004 - Q004: F1 = All adults 16+ in England Matrix
Not back | Number of rows: 5 | Number of columns: 5
How often do you use the following types of transport to get around your local area?
READ OUT
Rotated
Rendered as Dynamic Grid
3 or more times a week
Once or twice a week
Less than that, but more than once a month
Less than that, but more than twice a year
Less than that, or never
Bus
Bicycle
Car or motorcycle as a driver or passenger
Walk - some or all of your journey
National Rail trains, tram or London underground
Researcher notes: This question is adapted from a TFL survey Scripter notes: If selected '1: Walk (Go out on foot )' at Q002 AND '1.Impossible' at Q003 DO
NOT show '4:Walk - some or all of your journey' If selected '2: Cycle' at Q002 AND '1.Impossible' at Q003 DO NOT show '2:Bicycle'
If selected '3: Use local buses' at Q002 AND '1.Impossible' at Q003 DO NOT show '1:Bus' If selected 4’car or motorcycle’ at Q002 and “1 Impossible” at Q003 DO NOT show 3 “Car or
motorcycle”
Q005 - Q005: F3 = All who rarely use a car or motorcycle (Q004\4,5 for code 3 car or motorcycle)
Multi coded

39
Not back | Min = 1
You said you don't use the car or motorcycle that often (as a passenger or a driver). Why is that?
READ OUT
Rotated
1 Do not own or have access to a car or motorcycle 2 Do not have a driving licence 3 Prefer to use other types of transport 4 Other (please specify) *Open *Position fixed

40
Q006 - Q006: F1 = All adults 16+ in England Matrix
Not back | Number of rows: 6 | Number of columns: 6
Please tell me which types of transport you use for different types of journeys in your local area. Which types of transport do you use …
READ OUT
Rotated
Rendered as Dynamic Grid
To commute to work or to school
To go shopping
For leisure activities e.g. going to the cinema or to sports
On work business
To visit friends and/or relatives
To takE children to school
Bus
Bicycle
Car or motorcycle as a driver or passenger
Walk
National Rail trains, Tram or London underground
I don't make this kind of journey
Researcher notes: This question has been adapted from "Understanding Society (USOC)" Scripter notes: Route out modes of transport coded as "Less than that or never" at Q004 If selected '1: Walk (Go out on foot )' at Q002 AND '1.Impossible' at Q003 DO NOT show
'4:Walk’ If selected '2: Cycle' at Q002 AND '1.Impossible' at Q003 DO NOT show '2:Bicycle'
If selected '3: Use local buses' at Q002 AND '1.Impossible' at Q003 DO NOT show '1:Bus'

41
Q007 - Q007: F1 = All adults 16+ in England Multi coded
Not back | Min = 1 | Max = 3
Which, if any, of the following factors are important to you when deciding which type of transport to use in your local area? Please select up to three factors.
ADD IF NECESSARY: This can include any type of transport, such as bus, bicycle, car, walking, train, or any other type of transport READ OUT Respondent can choose up to three reasons.
Rotated
1 Privacy 2 Comfort 3 Environmental considerations 4 A reliable journey time 5 A quick journey time 6 The cost of the journey 7 My personal health and fitness 8 Ease of access 9 The type of transport I have access to (e.g. car ownership, bicycle ownership, access
to public transport) 10 I have a travel pass (entitling me to free travel) 11 Safety 12 Other (please specify) *Open *Exclusive
Scripter notes: Ask only code 8 depending on Q002/Q003. Exact routing pending client confirmation of questions.
B001: Introduction End block
Ask only if NOT Q002 - Q002,1 and NOT Q003 - Q003,1
B002: Walking section - F4 = All adults 16+ in England who do not have a disability that make it impossible to walk (NOT (Q002\1) AND (Q003\1))
Begin block

42
Q008 - Q008: F4 = All adults 16+ in England who do not have a disability that make it impossible to walk (NOT (Q002\1) AND (Q003\1))
Text
Not back
In this part of the survey, I am interested in your views on walking and the walking facilities in your local area.
IF NECESSARY: You can include running or jogging when you think of walking if you do this to get from A to B, for example to commute, but please don't include running or jogging you do as a leisure activity.
Q009 - Q009: F4 = All adults 16+ in England who do not have a disability that make it impossible to walk (NOT (Q002\1) AND (Q003\1))
Single coded
Not back
To what extent do you agree or disagree with the following statement:
"I am willing to walk more often for journeys in my local area"
READ OUT IF NECESSARY: You can include running or jogging when you think of walking if you do this to get from A to B, for example to commute, but please don't include running or jogging you do as a leisure activity.
Flipped
1 Strongly agree 2 Agree 3 Neither agree nor disagree 4 Disagree 5 Strongly disagree 6 Don't know (do not read) *Position fixed 7 Refused (do not read) *Position fixed

43
Q010 - Q010: F5 = All who do not have a disability that make it impossible to walk (NOT (Q002\1) AND (Q003\1)) AND who are unwilling to walk more in their local area (Q009\4,5)
Multi coded
Not back | Min = 1 | Max = 3
You said you would be unwilling to walk more often for journeys in your local area. Why do you say that? Please tell me about up to three reasons.
DO NOT PROMPT PROBE IF NECESSARY - Anything else? Respondent can choose up to three reasons.
Normal
1 It would take too long to walk/too far away 2 I am worried about personal safety e.g. due to crime 3 I have to carry things - e.g. tools, shopping or children - and cannot manage it all 4 The weather 5 It’s too dangerous e.g. because of too much traffic 6 It’s difficult to walk as pavements to narrow or poorly maintained 7 I don't like walking 8 Other (please specify) *Open *Position fixed
Researcher notes: Code suggestions similar to National Travel Survey (NTS)
We suggest making this question an unprompted list to get a more truthful answer.
Q011 - Q011: F4 = All adults 16+ in England who do not have a disability that make it impossible to walk (NOT (Q002\1) AND (Q003\1))
Multi coded
Not back | Min = 1 | Max = 3
Which, if any, of the following reasons would encourage you to walk more for journeys in your local area? Please select up to three reasons.
READ OUT Respondent can choose up to three reasons.
Rotated
1 Less fear of crime/anti-social behaviour 2 If it is more difficult/expensive to park my car 3 Better information about walking routes 4 Better behaviour from people on the road (drivers, cyclists etc.)
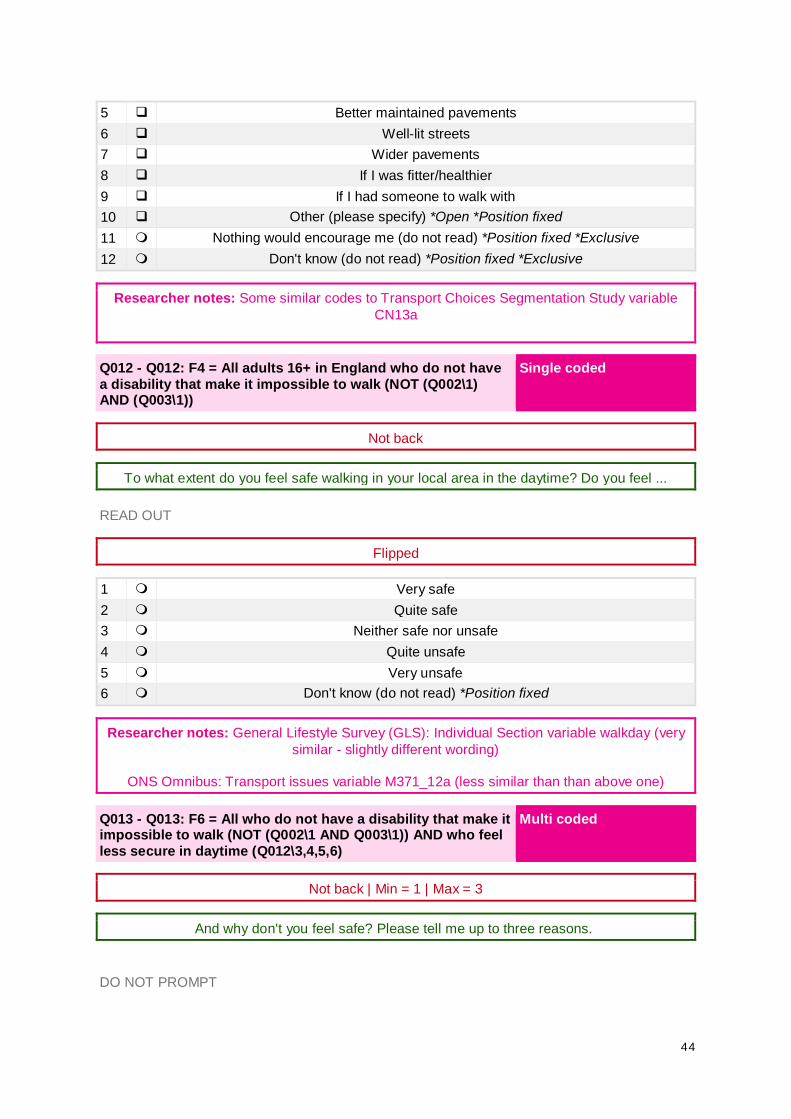
44
5 Better maintained pavements 6 Well-lit streets 7 Wider pavements 8 If I was fitter/healthier 9 If I had someone to walk with 10 Other (please specify) *Open *Position fixed 11 Nothing would encourage me (do not read) *Position fixed *Exclusive 12 Don't know (do not read) *Position fixed *Exclusive
Researcher notes: Some similar codes to Transport Choices Segmentation Study variable CN13a
Q012 - Q012: F4 = All adults 16+ in England who do not have a disability that make it impossible to walk (NOT (Q002\1) AND (Q003\1))
Single coded
Not back
To what extent do you feel safe walking in your local area in the daytime? Do you feel ...
READ OUT
Flipped
1 Very safe 2 Quite safe 3 Neither safe nor unsafe 4 Quite unsafe 5 Very unsafe 6 Don't know (do not read) *Position fixed
Researcher notes: General Lifestyle Survey (GLS): Individual Section variable walkday (very similar - slightly different wording)
ONS Omnibus: Transport issues variable M371_12a (less similar than than above one)
Q013 - Q013: F6 = All who do not have a disability that make it impossible to walk (NOT (Q002\1 AND Q003\1)) AND who feel less secure in daytime (Q012\3,4,5,6)
Multi coded
Not back | Min = 1 | Max = 3
And why don't you feel safe? Please tell me up to three reasons.
DO NOT PROMPT

45
PROBE IF NECESSARY - Anything else? Respondent can choose up to three reasons.
Rotated
1 Worry about crime levels/anti-social behaviour 2 Risk of being injured by a vehicle or cyclist 3 Volume or speed of road traffic 4 Presence of other pedestrians (e.g. pavement is too busy) 5 Lack of safe pedestrian crossings 6 Other (please specify) *Open *Position fixed
Researcher notes: We suggest making this question an unprompted list to get a more truthful answer.
B002: Walking section - F4 = All adults 16+ in England who do not have a disability that make it impossible to walk (NOT (Q002\1) AND (Q003\1))
End block
Ask only if (NOT Q002 - Q002,3 and NOT Q003 - Q003,1)
B003: Buses -F7 = All adults 16+ in England who do not have a disability that make it impossible to use the bus (NOT(Q002\3) AND (Q003\1))
Begin block
Q014 - Q014: F7 = All adults 16+ in England who do not have a disability that make it impossible to use the bus (NOT (Q002\3) AND (Q003\1))
Text
Not back
In this part of the survey, I am interested in your views on travelling by bus in your local area
Q015 - Q015: F7 = All adults 16+ in England who do not have a disability that make it impossible to use the bus (NOT (Q002\3) AND (Q003\1))
Single coded
Not back
To what extent do you agree or disagree with the following statement:
"I am willing to travel by bus more often for journeys in my local area"
READ OUT
Flipped
1 Strongly agree 2 Agree 3 Neither agree nor disagree

46
4 Disagree 5 Strongly disagree 6 Don't know (do not read) *Position fixed 7 Refused (do not read) *Position fixed
Q016 - Q016: F8 = All who do not have a disability that make it impossible to use the bus (NOT(Q002\3) AND (Q003\1)) AND who are unwilling to take the bus (Q015\4,5)
Multi coded
Not back | Min = 1 | Max = 3
You said you would be unwilling to travel by bus more often in your local area. Why do you say that? Please tell me about up to three reasons.
DO NOT PROMPT PROBE IF NECESSARY - Anything else? Respondent can select up to three answers.
Rotated
1 I have to carry things - such as tools, shopping, children - and cannot manage it all 2 I would need to change bus / no direct route 3 I don't know what bus services are available 4 Buses do not run when or where I want to travel 5 Bus journey is too slow 6 Buses are not frequent enough 7 Buses are not reliable and punctual 8 Bus stop is not near home/destination 9 Buses are expensive 10 Not convenient to go by bus, easier by other mode of transport 11 Buses are uncomfortable 12 I do not feel safe 13 Buses are not accessible / are difficult to get on and off 14 Other (please specify) *Open *Position fixed 15 Don't know *Position fixed *Exclusive
Researcher notes: Some similar codes to Transport Choices Segmentation Study variable CN14 (question not the same though)
We suggest making this question an unprompted list to get a more truthful answer.

47
Q017 - Q017: F7 = All adults 16+ in England who do not have a disability that make it impossible to use the bus (NOT (Q002\3) AND (Q003\1))
Multi coded
Not back | Min = 1 | Max = 3
Which, if any, of the following reasons would encourage you to travel more often by bus in your local area? Please select up to three reasons.
READ OUT Respondent can say up to three reasons.
Rotated
1 Making it more difficult or expensive to park my car/motorcycle 2 Better information e.g. about bus fares, routes, timetables 3 Live travel arrival information at bus stops 4 Cheaper fares 5 More bus routes 6 More frequent services 7 Better facilities at bus stops e.g. sheltered bus stops 8 Better facilities on buses e.g. Wi-Fi on the bus 9 Quicker journey times 10 More "park and ride" schemes 11 If I could use one ticket on multiple buses within an hour, such as the "Hopper fare"
system in London 12 Other (please specify) *Open *Position fixed
Researcher notes: Some similar codes to Transport Choices Segmentation Study variable CN14 (question not the same though)
Q018 - Q018: F7 = All adults 16+ in England who do not have a disability that make it impossible to use the bus(NOT (Q002\3) AND (Q003\1))
Single coded
Not back
To what extent do you agree or disagree with the following statement:
“Taking the bus fits with my lifestyle and who I am”
READ OUT
Flipped

48
1 Strongly agree 2 Agree 3 Neither agree nor disagree 4 Disagree 5 Strongly disagree 6 Don't know (do not read) *Position fixed 7 Refused (do not read) *Position fixed
B003: Buses -F7 = All adults 16+ in England who do not have a disability that make it impossible to use the bus (NOT (Q002\3) AND (Q003\1))
End block
Ask only if (NOT Q002 - Q002,2) and (NOT Q003 - Q003,1)
B004: Cycling - F9 = All adults 16+ in England who do not have a disability that make it impossible to cycle (NOT (Q002\2) AND (Q003\1))
Begin block
Q019 - Q019: F9 = All adults 16+ in England who do not have a disability that make it impossible to cycle (NOT (Q002\2) AND (Q003\1))
Text
Not back
In this part of the survey, I am interested in your views on cycling and provision for cycling in your local area
Q020 - Q020: F9 = All adults 16+ in England who do not have a disability that make it impossible to cycle (NOT (Q002\2) AND (Q003\1))
Single coded
Not back
To what extent do you agree or disagree with the following statement:
"I am willing to cycle more often for journeys in my local area"
READ OUT
Flipped
1 Strongly agree 2 Agree 3 Neither agree nor disagree 4 Disagree 5 Strongly disagree 6 Don't know (do not read) *Position fixed 7 Refused (do not read) *Position fixed

49
Q021 - Q021: F10 = All who do not have a disability that make it impossible to cycle (NOT (Q002\2) AND (Q003\1)) AND who are unwilling to cycle more in their local area (Q020\4,5)
Multi coded
Not back | Min = 1 | Max = 3
You said you would be unwilling to cycle more often for journeys in your local area. Why do you say that? Please tell me up to three reasons.
DO NOT PROMPT PROBE IF NECESSARY - Anything else? Respondent can select up to three answers.
Rotated
1 I have to carry things - such as tools, shopping, or children - and cannot manage it all 2 I don’t have access to a bicycle 3 I can’t or am not confident riding a bicycle 4 It takes too long to cycle / too far away 5 It’s too dangerous (e.g. because of too much traffic) 6 Weather 7 I am too old/unfit 8 There are not enough cycle lanes/paths along my route 9 I am worried about personal safety (e.g. due to crime) 10 Lack of secure facilities to park or store bicycle 11 I don't like cycling 12 Other (please specify) *Open *Position fixed 13 Don't know *Position fixed *Exclusive
Researcher notes: Some similar codes to Transport Choices Segmentation Study variable CN63 (question not the same though)
We suggest making this question an unprompted list to get a more truthful answer.
Q022 - Q022: F9 = All adults 16+ in England who do not have a disability that make it impossible to cycle (NOT (Q002\2) AND (Q003\1))
Multi coded
Not back | Min = 1 | Max = 3
Which, if any of the following options, would encourage you to cycle more for journeys in your local area? Please select up to three options
Please select up to three options READ OUT

50
Rotated
1 Cycle lanes that are separated from motor traffic 2 Better facilities for showering and changing where I’m going 3 Better/more secure facilities for parking and storing bike 4 A cycle hire or loan scheme in my area 5 If it were more difficult to park a car where I’m going (e.g. more expensive or fewer
spaces) 6 Better information about quiet or off-road cycle routes 7 More help available with fixing and maintaining my bike 8 Training on cycle safety 9 Better behaviour from others on the road (e.g. drivers, other cyclists, pedestrians) 10 If my place of work offered a cycle to work scheme (where purchase of a bicycle is
subsidised) 11 Other (please specify) *Open *Position fixed
Researcher notes: Question source TBC
Q023 - Q023: F9 = All adults 16+ in England who do not have a disability that make it impossible to cycle (NOT (Q002\2) AND (Q003\1))
Single coded
Not back
To what extent do you agree or disagree that overall, the facilities for cycling in your local area are good?
READ OUT INTERVIEWER: IF ASKED, BY ‘FACILITIES’ I MEAN THINGS SUCH AS CYCLE LANES, CYCLE PARKING, SIGNAGE, LIGHTING AND ROADS GENERALLY.
Flipped
1 Strongly agree 2 Agree 3 Neither agree nor disagree 4 Disagree 5 Strongly disagree 99 Don't know (do not read) *Position fixed *Exclusive

51
Q024 - Q024: F9 = All adults 16+ in England who do not have a disability that make it impossible to cycle (NOT (Q002\2) AND (Q003\1))
Open
Not back
Please describe the cycling facilities in your local area.
PROBE IF NECESSARY - Anything else?
99 don't know (do not read) *Position fixed *Exclusive
B004: Cycling - F9 = All adults 16+ in England who do not have a disability that make it impossible to cycle (NOT(Q002\2) AND (Q003\1))
End block