local plan key facts evidence paper january 2020 · bangladeshi 11.2% black caribbean 10.9% white...
TRANSCRIPT

Local Plan Key Facts Evidence Paper
1
Local Plan
Key Facts Evidence Paper
January 2020
Local Plan Key Facts Evidence Paper
2
Contents
Introduction 3
London Borough of Barnet in Context 3
Barnet’s Population 4
Labour Market 4
Qualifications 5
Occupations and Earnings 6
Housing 6
Barnet’s Economy 8
Barnet’s Town Centres 10
Transport 13
Environment 14
Health and Well being 15

Local Plan Key Facts Evidence Paper
3
1. Introduction
The Local Plan, once adopted, will set out the planning policies for
London Borough of Barnet up to 2036. The National Planning Policy
Framework states that Local Plans should be “underpinned by relevant
and up-to-date evidence. This should be adequate and proportionate,
focused tightly on supporting and justifying the policies concerned, and
take into account relevant market signals” (paragraph 31). In order to be
found sound, a Local Plan will need to be justified and supported by a
proportionate evidence base.
The purpose of this Paper is to provide an overview of the key facts and
figures about Barnet and how these have helped shape Local Plan
policies. It contains facts and figures related to Barnet’s socio-economic
and environmental context.
This Paper does not represent the complete evidence base. The full
evidence base comprises a wide range of documents which have been
produced in support of the draft Barnet Local Plan and this Paper should
be read in conjunction with those documents.
2. London Borough of Barnet in Context
Barnet is an outer London Borough adjacent to the London Boroughs of
Enfield, Haringey, Camden, Brent and Harrow. To the north, it borders
Hertsmere District in Hertfordshire.
Barnet lies in the Thames Basin, its landform is characterised by gentle
undulations shelving to the south, with the western part of the Borough
generally lower lying. Much of the Borough lies on London Clay with more
fertile alluvial soils along the river valleys of the Silkstream, Dollis and
Pymmes Brooks.
There are three rivers in Barnet that remain at the surface and form
distinctive habitats and valuable green corridors. The most significant
open water habitat is the Welsh Harp Reservoir, a Site of Special Scientific
Interest (SSSI) that supports a significant variety of wildfowl.
Barnet is one of the greenest boroughs in London, 28% of the Borough is
designated as Green Belt. Overall, there are 1,192 hectares of public open
space across the Borough.
Barnet is well connected through a comprehensive road and rail network;
the M1 provides access to the North and the M25, and the A1000 links
the Borough with Central London. Additionally, the North Circular Road
(A406) provides major connections east and west. Barnet has good access
to both the Northern Line and overground rail services.
Figure 1: London Borough of Barnet

Local Plan Key Facts Evidence Paper
4
3. Barnet’s Population
Barnet’s population has increased by 12% since 2011. The estimated
population is 400,000, which makes Barnet the most populous London
Borough.
The Borough’s overall population is projected to increase to 452,000 by
2036, which is an increase of 13%.
The highest rates of population growth are forecast to occur around the
planned development areas in the west of the Borough, particularly in
Golders Green, Colindale, Mill Hill, West Hendon and Edgware
Between 2018 – 2030, the Joint Strategic Needs Assessment predicts that
there will be a 33% increase in the number of older people (65+). This is
compared to a 2% decrease in the number of young people (0-19) and a
4% increase for working age people (16 – 64)1.
Barnet has a higher proportion of people aged 85 and over (3.1%)
compared to Outer London (1.8%) and the UK (2.3%). Hampstead Garden
Suburb and High Barnet have the largest proportion of people who are
over 65. Within Brunswick Park and Hale wards higher levels of growth
(of around 6% ) in the proportion of the population aged 65+ are
expected.
Barnet’s population is projected to become more diverse, with the
proportion of Black, Asian and Minority Ethnic (BAME) people in the
Borough rising from 39% in 2018 to 42% in 2030. The White ethnic group
is projected to decrease over the same period.
1 These figures are based on the GLA Borough Preferred Option for 2018
Figure 2: Percentage change in ethnic groups in Barnet (2018 – 2030)
Ethnic Group % change between
2018 – 2030
Other Ethnic Group 28.2%
Other Asian 27.1%
Chinese 21.0%
Arab 20.4%
Other Mixed 19.3%
Other White 19.1%
Black African 16.1%
Other Black 15.8%
White & Black African 14.5%
Pakistani 13.8%
Bangladeshi 11.2%
Black Caribbean 10.9%
White & Asian 10.1%
Indian 9.7%
White & Black Caribbean 8.2%
White Irish -0.6%
White British -0.7%
White Ethnic Group 5.3%
Black, Asian and Minority Ethnic
(BAME)
18.1%
Local Plan Key Facts Evidence Paper
5
4. Labour Market
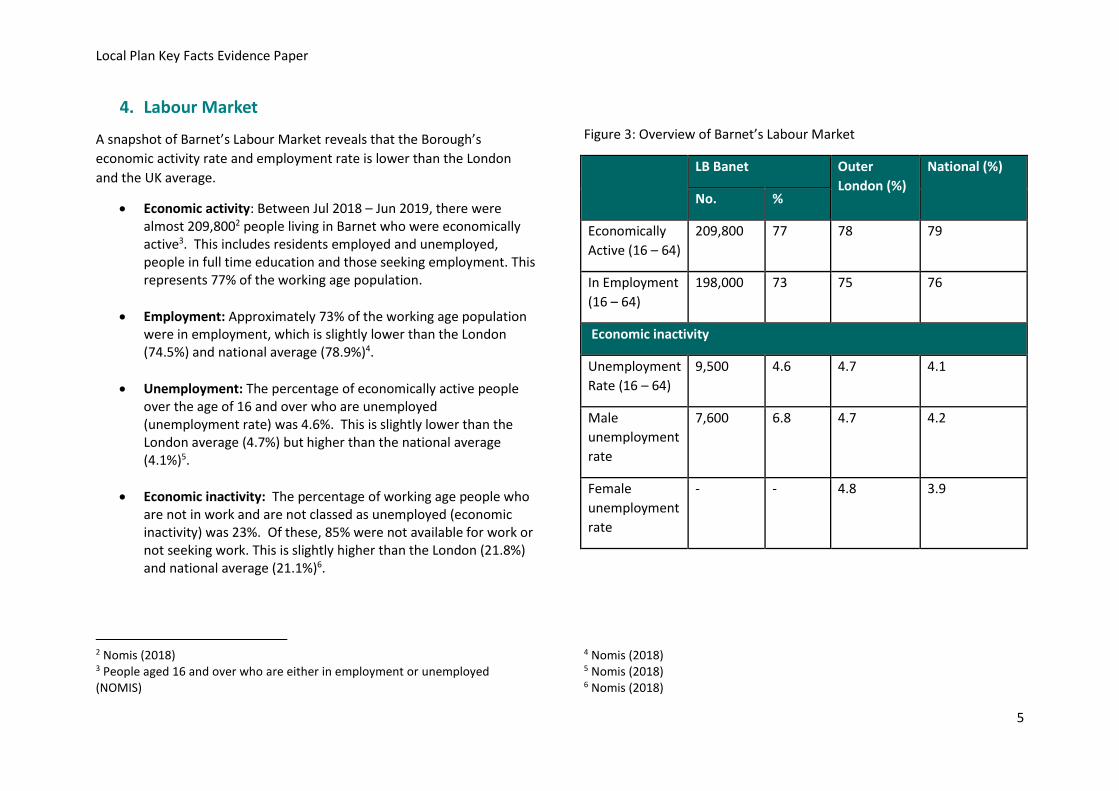
A snapshot of Barnet’s Labour Market reveals that the Borough’s
economic activity rate and employment rate is lower than the London
and the UK average.
• Economic activity: Between Jul 2018 – Jun 2019, there were almost 209,8002 people living in Barnet who were economically active3. This includes residents employed and unemployed, people in full time education and those seeking employment. This represents 77% of the working age population.
• Employment: Approximately 73% of the working age population were in employment, which is slightly lower than the London (74.5%) and national average (78.9%)4.
• Unemployment: The percentage of economically active people over the age of 16 and over who are unemployed (unemployment rate) was 4.6%. This is slightly lower than the London average (4.7%) but higher than the national average (4.1%)5.
• Economic inactivity: The percentage of working age people who are not in work and are not classed as unemployed (economic inactivity) was 23%. Of these, 85% were not available for work or not seeking work. This is slightly higher than the London (21.8%) and national average (21.1%)6.
2 Nomis (2018) 3 People aged 16 and over who are either in employment or unemployed (NOMIS)
Figure 3: Overview of Barnet’s Labour Market
LB Banet Outer
London (%)
National (%)
No. %
Economically
Active (16 – 64)
209,800 77 78 79
In Employment
(16 – 64)
198,000 73 75 76
Economic inactivity
Unemployment
Rate (16 – 64)
9,500 4.6 4.7 4.1
Male
unemployment
rate
7,600 6.8 4.7
4.2
Female
unemployment
rate
- - 4.8 3.9
4 Nomis (2018) 5 Nomis (2018) 6 Nomis (2018)

Local Plan Key Facts Evidence Paper
6
5. Qualifications
In terms of qualifications and educational attainment, 51% of Barnet’s
residents in 2018 have a ‘high’ level qualification (defined as NVQ Level 4
or above), compared to 53% for London and 39% for the rest of the UK.
In Barnet, 6.2% of residents hold no qualification, which is lower than
both the London (6.6%) and national (7.8%) average.
Approximately 67% held ‘mid’ level qualification (defined as qualifications
at NVQ level 3 or trade apprenticeships) which is lower than London
(66%) but higher than the national average (57%).
Figure 4: Qualifications (Jan 2018 – Dec 2018)
Source: Nomis
6. Occupations and Earnings
Analysis of employment by occupation data shows that 14.8% of Barnet’s
workers are in Manager, Director and Senior Official occupations. This is
higher than both the London and national average. When this category is
combined with professional occupants, 46% of Barnet’s workforce falls
into this combined work group (compared to 39.3% for London and
32.1% nationally). The higher level of senior occupants is linked with the
Borough’s high educational attainment level (see figure 4 ).
Figure 5: Occupations
Occupations Barnet
(%)
London
(%)
National
(%)
Managers, Directors and senior
officials
14 13 11
Professional Occupations 31 26 21
Associate Professional & Technical 14 19 15
Admin & and Secretarial 12 9 20
Skilled Trades Occupation 8 7 10
Caring, Leisure and Other Services 5 7 9
Sales & Customer Services 5 6 7
Process plant & Machine
operatives
3 5 6
Elementary Occupations 7 8 10
Source: Nomis
7. Housing
Barnet’s population is expected to significantly increase over the plan
period. To accommodate this level of growth, the Council will need to
0 50 100 150 200 250 300
NVQ4 and above
NVQ3 and above
NVQ2 and above
Other qualifications
No qualifications
Qualifications 2019
Barnet London National

Local Plan Key Facts Evidence Paper
7
deliver a minimum of 46,000 new homes over the same period. A
snapshot of housing in Barnet reveals
Approximately 43% of the existing housing stock of 151,000 dwellings is
made up of flats or maisonettes. It is expected that this figure will exceed
50% before 2030.
Since 2014, the average house price in Barnet has increased from 391,000
to £545,0007 and is now 15 times the Borough median household income
of £36,0008 and placing Barnet within the 10 most expensive Boroughs in
London.
Private sector rents have also increased with average rents around £1400,
which is higher than the average outer London rent of £1300 and the
third highest in London. Private sector rents have increased by 24% since
20119.
Issues of affordability have resulted in a shift in housing tenure within the
Borough. Figure 6 shows that private rented sector accommodation has
increased from 17% of households in 2001 to 26% in 2016.
Housing Delivery and Need
Since 2011, over 10,000 new homes have been built in Barnet, of which 2,657 are affordable homes for rent or sale. The majority of these new homes are 2 bed properties (49%). In general, one and two bedroom dwellings are the most dominant type of accommodation delivered in Barnet, accounting for 78% of all new homes overall and 86% of flats (as indicated in Figure 7).
7 Barnet Housing Strategy 2019 – 2024 8 Barnet Housing Strategy 2019 – 2024
Figure 6: Housing tenure 2011 – 2016
Figure 7: Proportion of new flats and houses by bedroom 2011/12-
2016/17
9 Barnet Housing Strategy 2019 – 2024

Local Plan Key Facts Evidence Paper
8
The Strategic Housing Market Assessment (SHMA) identified the full
Objectively Assessed Need (OAN) for housing in Barnet as 3,060 dwellings
per year. According to the SHMA the priority size for affordable homes
are 2 bedroom dwellings while for market housing the priority size is 3
bedroom.
8. Barnet’s Economy
Barnet lacks a single strong centre, consequently firms are distributed
among a series of town centres along the A1000, the A406 North Circular
and the A1/M1 corridor. The A1000 centres are mainly; although not
exclusively, office-based in character, whilst the North Circular is largely
occupied by distribution firms. The more significant centres, in job density
terms include: Edgware, East Finchley, Finchley Church End, Brent Street
Hendon and North Finchley, with secondary centres in Chipping Barnet
and New Barnet (see Figure 8).
There are around 23,000 businesses in Barnet, employing 132,000
people. Key employment sectors include:
• Professional and financial
• Care and Health
• Education
• Retail
• Hospitality, Leisure and Recreation
• Business Support Services
• Construction
10 Nomis 2019
Figure 8: Distribution of Barnet’s businesses
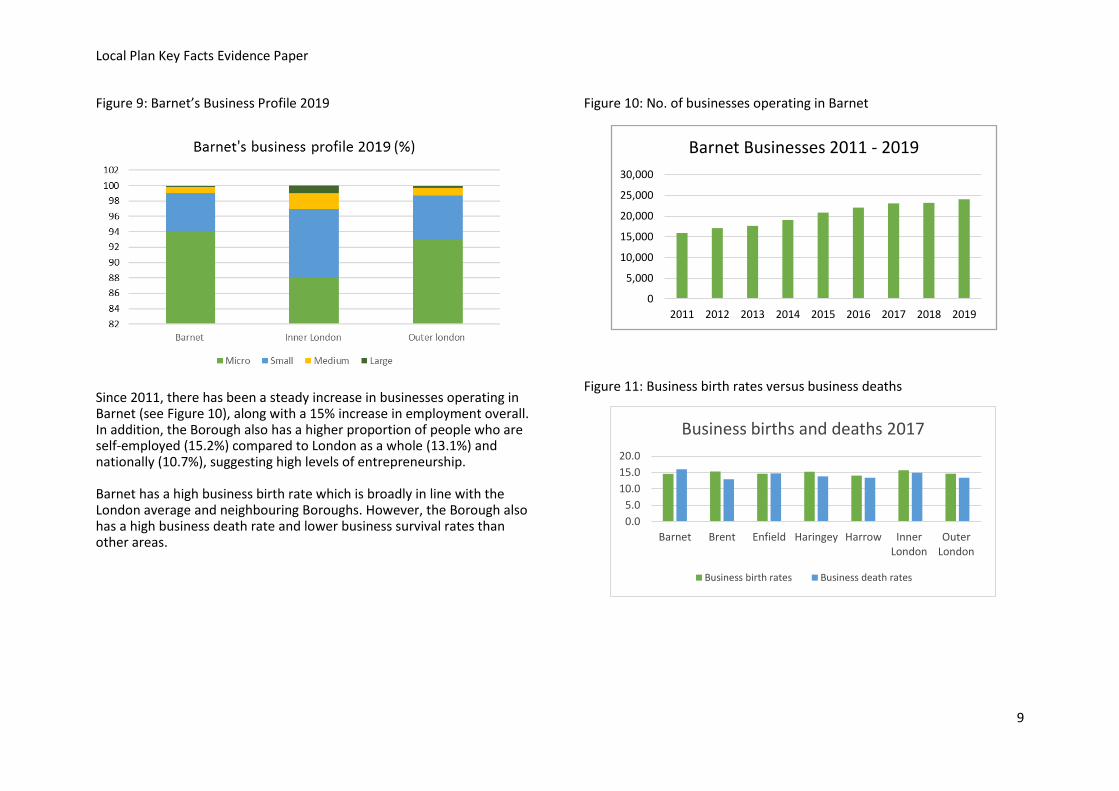
Figure 9 shows that a large proportion of businesses operating in Barnet are classified as ‘micro’ businesses, employing fewer than 9 people and make up approximately 94% of the Boroughs business base10.
Local Plan Key Facts Evidence Paper
9
Figure 9: Barnet’s Business Profile 2019
Since 2011, there has been a steady increase in businesses operating in Barnet (see Figure 10), along with a 15% increase in employment overall. In addition, the Borough also has a higher proportion of people who are self-employed (15.2%) compared to London as a whole (13.1%) and nationally (10.7%), suggesting high levels of entrepreneurship. Barnet has a high business birth rate which is broadly in line with the London average and neighbouring Boroughs. However, the Borough also has a high business death rate and lower business survival rates than other areas.
Figure 10: No. of businesses operating in Barnet
Figure 11: Business birth rates versus business deaths
0
5,000
10,000
15,000
20,000
25,000
30,000
2011 2012 2013 2014 2015 2016 2017 2018 2019
Barnet Businesses 2011 - 2019
0.0
5.0
10.0
15.0
20.0
Barnet Brent Enfield Haringey Harrow InnerLondon
OuterLondon
Business births and deaths 2017
Business birth rates Business death rates

Local Plan Key Facts Evidence Paper
10
9. Barnet’s Town Centres
Barnet’s town centre hierarchy (as set out in the London Plan) consists of
one Major Centre (Edgware), 13 district centres, and 15 local and
neighborhood centres, as well as a regional shopping centre at Brent
Cross. Barnet has it’s own ‘non planning’ designation ‘Main Town
Centres’. These are Burnt Oak, Chipping Barnet, Finchley Central (Church
End), Golders Green and North Finchley. ‘main’ town centres form the
Council’s priorities for investment and revitalisation, supporting local
businesses and delivering mixed use development in accordance with the
place making policies of the Local Plan.
Figure 12: Town Centre employment and performance
The majority of Barnet’s town centres have experienced employment
growth in recent years, with the exception of Edgware (-2%) and
Cricklewood (-5%).
Some of Barnet’s town centres have a specialist niche. Church End also
known as Finchley Central specialises in the Financial & Professional as
well as ICT & Digital sectors while in Cricklewood the retail sector is
strong. Retail is considered weaker in the surrounding areas of Burnt Oak
and Golders Green.
Overview of Barnet’s Main Town Centres
This section provides an overview of the performance for each of Barnet’s
main town centres, ranked against London, Outer London and the
Borough as a whole.
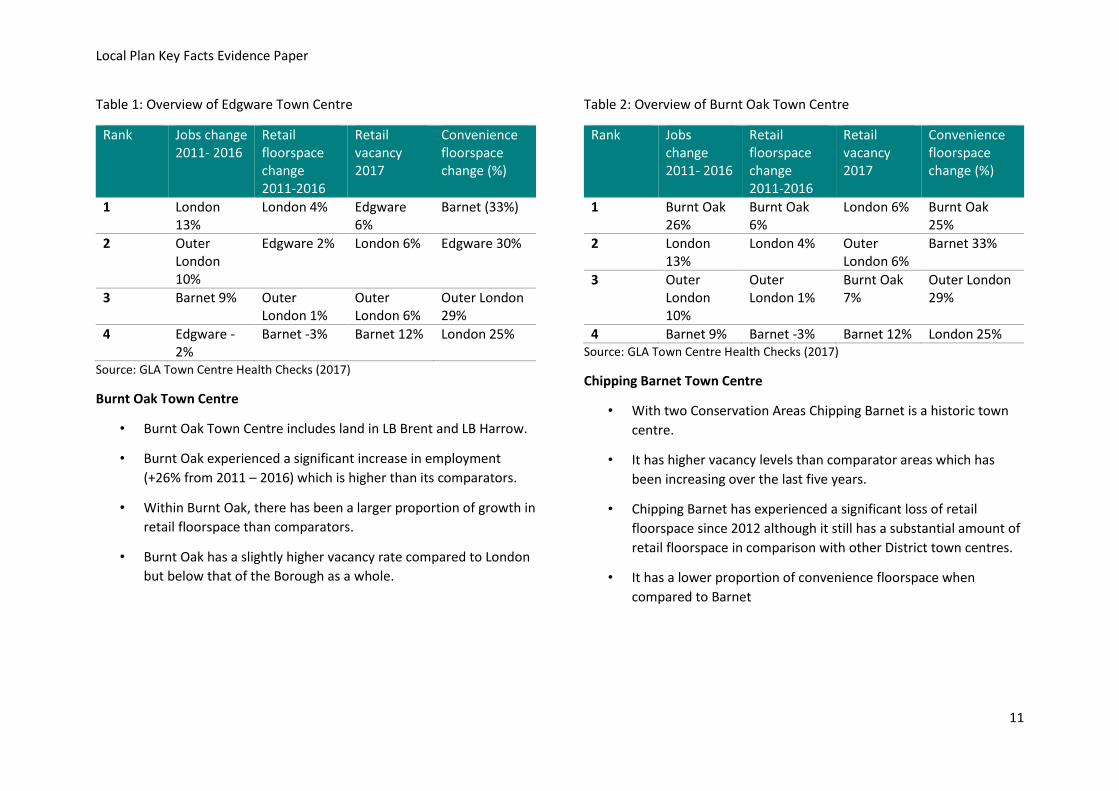
Edgware Town Centre
• Edgware is Barnet’s largest town centre and is the only one
designated as a Major Town Centre
• Edgware has experienced a reduction in employment between
the period 2011 – 2016. It has also lost almost 7,000 sqm of office
floorspace to permitted development rights.
• Edgware's vacancy levels are in line with London and Outer
London average.
Local Plan Key Facts Evidence Paper
11
Table 1: Overview of Edgware Town Centre
Rank Jobs change 2011- 2016
Retail floorspace change 2011-2016
Retail vacancy 2017
Convenience floorspace change (%)
1 London 13%
London 4% Edgware 6%
Barnet (33%)
2 Outer London 10%
Edgware 2% London 6% Edgware 30%
3 Barnet 9% Outer London 1%
Outer London 6%
Outer London 29%
4 Edgware -2%
Barnet -3% Barnet 12% London 25%
Source: GLA Town Centre Health Checks (2017)
Burnt Oak Town Centre
• Burnt Oak Town Centre includes land in LB Brent and LB Harrow.
• Burnt Oak experienced a significant increase in employment
(+26% from 2011 – 2016) which is higher than its comparators.
• Within Burnt Oak, there has been a larger proportion of growth in
retail floorspace than comparators.
• Burnt Oak has a slightly higher vacancy rate compared to London
but below that of the Borough as a whole.
Table 2: Overview of Burnt Oak Town Centre
Rank Jobs change 2011- 2016
Retail floorspace change 2011-2016
Retail vacancy 2017
Convenience floorspace change (%)
1 Burnt Oak 26%
Burnt Oak 6%
London 6% Burnt Oak 25%
2 London 13%
London 4% Outer London 6%
Barnet 33%
3 Outer London 10%
Outer London 1%
Burnt Oak 7%
Outer London 29%
4 Barnet 9% Barnet -3% Barnet 12% London 25% Source: GLA Town Centre Health Checks (2017)
Chipping Barnet Town Centre
• With two Conservation Areas Chipping Barnet is a historic town
centre.
• It has higher vacancy levels than comparator areas which has
been increasing over the last five years.
• Chipping Barnet has experienced a significant loss of retail
floorspace since 2012 although it still has a substantial amount of
retail floorspace in comparison with other District town centres.
• It has a lower proportion of convenience floorspace when
compared to Barnet
Local Plan Key Facts Evidence Paper
12
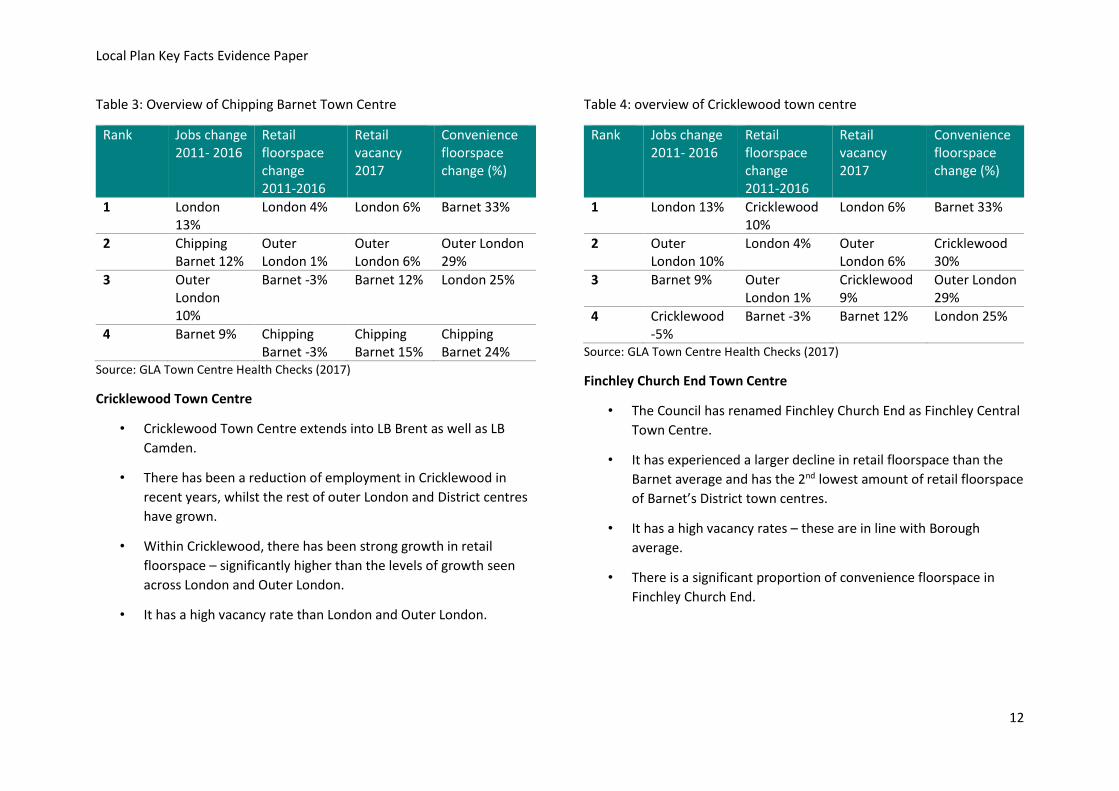
Table 3: Overview of Chipping Barnet Town Centre
Rank Jobs change 2011- 2016
Retail floorspace change 2011-2016
Retail vacancy 2017
Convenience floorspace change (%)
1 London 13%
London 4% London 6% Barnet 33%
2 Chipping Barnet 12%
Outer London 1%
Outer London 6%
Outer London 29%
3 Outer London 10%
Barnet -3% Barnet 12% London 25%
4 Barnet 9% Chipping Barnet -3%
Chipping Barnet 15%
Chipping Barnet 24%
Source: GLA Town Centre Health Checks (2017)
Cricklewood Town Centre
• Cricklewood Town Centre extends into LB Brent as well as LB
Camden.
• There has been a reduction of employment in Cricklewood in
recent years, whilst the rest of outer London and District centres
have grown.
• Within Cricklewood, there has been strong growth in retail
floorspace – significantly higher than the levels of growth seen
across London and Outer London.
• It has a high vacancy rate than London and Outer London.
Table 4: overview of Cricklewood town centre
Rank Jobs change 2011- 2016
Retail floorspace change 2011-2016
Retail vacancy 2017
Convenience floorspace change (%)
1 London 13% Cricklewood 10%
London 6% Barnet 33%
2 Outer London 10%
London 4% Outer London 6%
Cricklewood 30%
3 Barnet 9% Outer London 1%
Cricklewood 9%
Outer London 29%
4 Cricklewood -5%
Barnet -3% Barnet 12% London 25%
Source: GLA Town Centre Health Checks (2017)
Finchley Church End Town Centre
• The Council has renamed Finchley Church End as Finchley Central
Town Centre.
• It has experienced a larger decline in retail floorspace than the
Barnet average and has the 2nd lowest amount of retail floorspace
of Barnet’s District town centres.
• It has a high vacancy rates – these are in line with Borough
average.
• There is a significant proportion of convenience floorspace in
Finchley Church End.

Local Plan Key Facts Evidence Paper
13
Table 5: Overview of Finchley Church End Town Centre
Rank Jobs change 2011- 2016
Retail floorspace change 2011-2016
Retail vacancy 2017
Convenience floorspace change (%)
1 London 13%
London 4% London 6% Church End 47%
2 Outer London 10%
Outer London 1%
Outer London 6%
Barnet 33%
3 Barnet 9% Barnet -3% Barnet 12% Outer London 23%
4 Church End 5%
Church End -5%
Church End 13%
London 25%
Source: GLA Town Centre Health Checks (2017)
North Finchley Town Centre
• North Finchley is one of Barnet’s largest District town centres.
• It has experienced the highest level of employment growth across
all District town centres and comparator areas.
• It has experienced the largest decline in retail floorspace in recent
years but still a high amount of retail floorspace compared to
other District town centres.
• North Finchley has higher vacancy rates than comparator areas.
Table 6: Overview of North Finchley Town Centre
Rank Jobs change 2011- 2016
Retail floorspace change 2011-2016
Retail vacancy 2017
Convenience floorspace change (%)
1 North Finchley 29%
London 4% London 6% Barnet 33%
2 London 13%
Outer London 1%
Outer London 6%
Outer London 29%
3 Outer London 10%
Barnet -3% Barnet 12% North Finchley 29%
4 Barnet 9% North Finchley -9%
North Finchley 13%
London 25%
Source: GLA Town Centre Health Checks (2017)
10. Transport
Barnet is well connected by major roads and is of critical strategic
importance and a key freight route. In 2018, Barnet residents owned
142,000 private cars which is the 2nd highest level of car ownership in
London.
Transport for London (TfL) have identified a number of congestion
hotspots within the Borough that are expected to worsen with population
and employment growth. These hotspots include the A406 with pinch
points at Henlys Corner and the A5, with pinch points between Brent
Cross and Cricklewood.

Local Plan Key Facts Evidence Paper
14
The Borough is well served by public transport including underground,
national rail and bus routes, however, east-west connections across the
Borough are challenging.
All of the seven ‘Main’ town centres (Burnt Oak, Chipping Barnet,
Finchley Central, Golders Green and North Finchley) have a 4+ PTAL
rating. Low PTAL is more of a problem in the north of the Borough.
Figure 13: Public Transport – Barnet
Transport modes
The car remains the principal mode of travel, accounting for
approximately 44% of all trips made in Barnet. However, car travel had
the largest modal shift between 2011 – 2016 with a 9% decrease.
Approximately 55% of all journeys during the same period were made by
bicycle, foot and public transport.
There have also been small increases in the proportion of people using
more sustainable modes of transport with a 4% increase in walking and
2% increase in the bus travel.
Figure 14: Modal Share of Transport 2016 (% change since 2011)
Rail 2%
(1%)
Underground 7%
(2%)
Bus 13% (2%)
Taxi 1%
(0%)
Car & Passenger
44% (-9%)
Cycling 1%
(0%)
Walking 32% (4%)
Local Plan Key Facts Evidence Paper
15
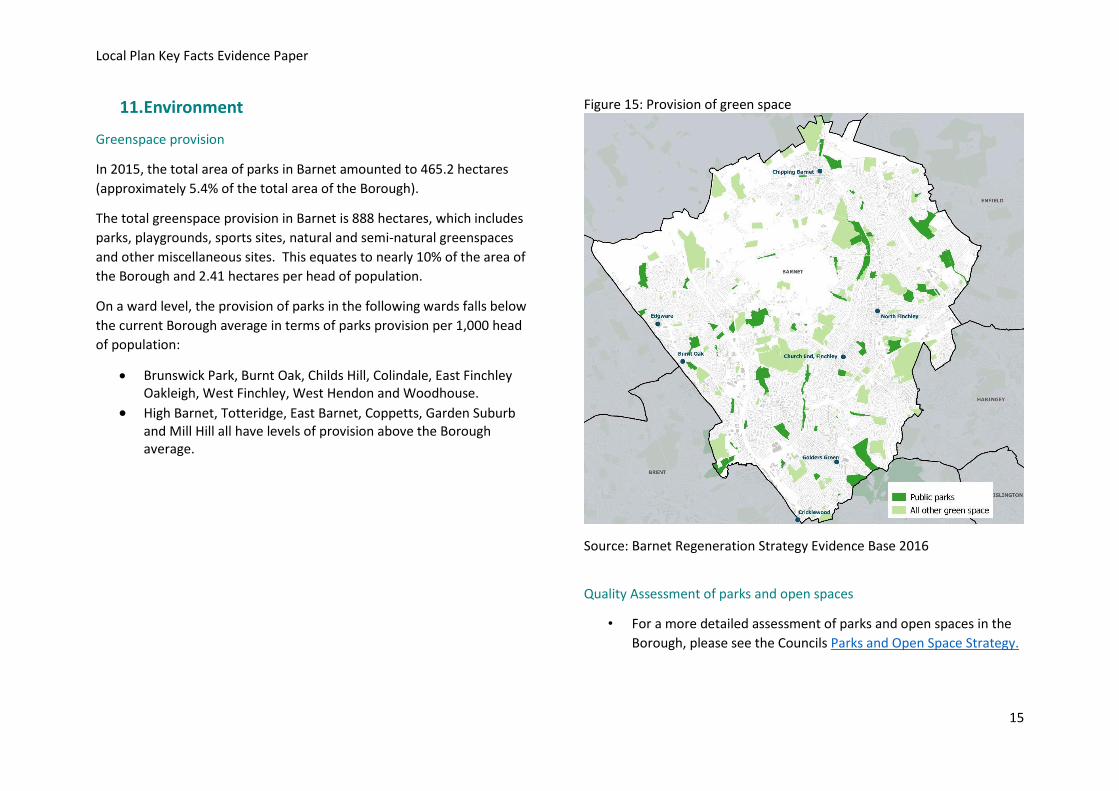
11. Environment
Greenspace provision
In 2015, the total area of parks in Barnet amounted to 465.2 hectares
(approximately 5.4% of the total area of the Borough).
The total greenspace provision in Barnet is 888 hectares, which includes
parks, playgrounds, sports sites, natural and semi-natural greenspaces
and other miscellaneous sites. This equates to nearly 10% of the area of
the Borough and 2.41 hectares per head of population.
On a ward level, the provision of parks in the following wards falls below
the current Borough average in terms of parks provision per 1,000 head
of population:
• Brunswick Park, Burnt Oak, Childs Hill, Colindale, East Finchley Oakleigh, West Finchley, West Hendon and Woodhouse.
• High Barnet, Totteridge, East Barnet, Coppetts, Garden Suburb and Mill Hill all have levels of provision above the Borough average.
Figure 15: Provision of green space
Source: Barnet Regeneration Strategy Evidence Base 2016
Quality Assessment of parks and open spaces
• For a more detailed assessment of parks and open spaces in the
Borough, please see the Councils Parks and Open Space Strategy.

Local Plan Key Facts Evidence Paper
16
Table 7: Quality and Value of parks 2009 -2015
2009 2015
No % of total No. % of total
No. of excellent Parks 5 7 1 1
No of good parks 15 21 9 13
No. of fair parks 38 52 49 69
No. of poor parks 15 21 12 17
Total no. of parks 73 100 73 100
Source: Open Space Strategy 2016 – 2026
12. Health
The health of people in Barnet is generally better than the national average. Life expectancy for both men (82.2 years) and women (85.5) is higher than the London and England average.
There is considerable variation in life expectancy across the Borough. For example, on a ward level, Burnt Oak has the lowest average life expectancy from birth of 78.8 years for males (4.2 years behind the Barnet average) and 81.4 for females. This is lower than the average age for Garden Suburb which has the highest life expectancy of 87.1 from birth for males and 89.5 for females.
Mental Health
Across all ages, the prevalence of mental health problems (including
schizophrenic, bipolar affective disorder and other psychoses) in Barnet
was 1.1%, which is higher than the national average (0.92%) but lower
than the London average (1.10%). Barnet has a lower prevalence of
depression (4.3%) in adults than the national average (5.8%).
The prevalence of mental health problems varies by age and gender, with
males more likely (11.4%) to have experienced or be experiencing a
mental health problem than girls (7.8%). Children aged 11 to 16 years
olds are also more likely (11.5%) than 5 to 10 year olds (7.7%) to
experience mental health problems.
Dementia
By 2036 there are expected to be more people living with dementia in
Barnet. Levels are expected to rise to 7,407 by 2035 which is an increase
of 74%. This presents a significant health and social care challenge to the
Borough.
In 2017, 53% of adults had excess weight (i.e. were either overweight or obese. This is lower than the national average (61%) but similar to the London average (55%).
In 2017/18, 20% of children aged 4 -5 had excess weight which is lower than the London (21.8%) and national average (22.4%).
In 2016/17, there were 29% of adults who were physically inactive, which is significantly higher than both London as a whole (23%) and England (22%).
15% of adults aged 18+ smoke tobacco, which is higher than the London and national average.

Local Plan Key Facts Evidence Paper
17
In 2014, approximately 8.1% of Barnet adults reported drinking over 14 units of alcohol per week which was the lowest of all the 32 London Boroughs and significantly lower than both London (21.6%) and England (25.7%).
There are significant levels of inactivity in Barnet. Approximately 38% of the population participate in activity at least once a week (moderate intensity for 30 minutes or more), 17% participate in a physical activity 3 or more times a week and 52% do not take part in any physical activity11. Physical activity is higher amongst men than woman.
Health and Social care
Based on 2019 projections, Barnet has a higher proportion of adults with
a learning disability (LD) than any London Borough of which 84% are aged
18-64 and 16% are aged 65+.
With the growth of the older population in Barnet and the associated rise
in the number of people living with long term conditions and living longer
with disabilities, there is likely to be ongoing pressure on care provision
within the Borough.
Between 2015 and 2018, the number of long term service users in receipt
of community care services in the Borough increased across all adult age
groups (18+).
For younger adults aged 18-64 (where the main primary support reasons
are learning disability, mental health and physical support), the number
of long term service users receiving community care services rose by 13%.
11 Sport England – Active People Survey Data (APS), Quarter 2 (April 14/2015)
The number of older adults (aged 65+) receiving such services (where
physical support is the main primary support reason, followed by support
for memory and cognition, mental health and learning disability)
increased by 5%.