local government audit service management of … · local government audit service management of...
TRANSCRIPT

Local Government Audit Service
Management of Sickness Absencein Local Authorities
Report No. 28
November 2013
Environment, Community and Local GovernmentComhshaol, Pobal agus Rialtas Áitiúil

Local Government Audit Service
The Local Government Audit Service (LGAS), incorporating the Value for Money (VFM) Unit, being an
external audit service, provides independent scrutiny of the financial stewardship of local authorities.
The sectoral goals of the LGAS are to:
• carry out the audits of local authorities and other bodies in accordance with the Code of Local Government
Audit Practice thereby fostering the highest standards of financial stewardship and public accountability
• promote the achievement of value for money in local authorities by undertaking Value for Money audits
and publishing reports thereon.
It is the responsibility of local authority management to ensure that value for money is achieved by
establishing and maintaining sound arrangements including procedures for planning, appraisal, authorisation
and control of resources.

Local Government Audit Service
Management of Sickness Absencein Local Authorities
Department of the Environment,Community and Local Government

© Department of the Environment, Community and Local Government 2013
This report was prepared on the basis of information, documentation and explanations obtained from thepublic bodies referred to in the report. The draft report was sent to the local authorities that participated inthe study. Where appropriate the comments received were incorporated in the final version of the report.
The website of the Department of the Environment, Community and Local Government is the primarymeans of publishing reports of the Value for Money Unit of the Local Government Audit Service. Shouldany errata arise they will be corrected and noted in the report published athttp://www.environ.ie/en/Publications/LocalGovernment/AuditService/

Contents
PAGE
MINISTER’S FOREWORD 3
GLOSSARY 4
EXECUTIVE SUMMARY 5-9
1. INTRODUCTION 10-17
2. HUMAN RESOURCES MANAGEMENT: 18-38
POLICY, STRATEGY, GUIDELINES
3. ESTIMATED COST OF SICKNESS ABSENCE 39-49
4. MEASUREMENT OF SICKNESS ABSENCE 50-54
5. SICKNESS ABSENCE AND RELATED CAUSES 55-69
6. BENCHMARKING AND PERFORMANCE 70-78
7. MANAGING SICKNESS ABSENCE 79-83
_____________________________________________________________________Local Government Audit Service, VFM Unit

APPENDICES
APPENDIX 1 - Table 1 Full Time Equivalent and Total 85
Working Days
Table 2 Total days’ sickness absence in 2011 86
Table 3 Net Cost and Efficiency Savings 87
Table 4 Net Cost and Efficiency Savings at 88
10 days absence
APPENDIX 2 - Performance Indicators - A User’s Guide 89
Department of Finance
APPENDIX 3 - Performance Indicators 90
APPENDIX 4 - Report Assumptions and Calculations 91-94
APPENDIX 5 - BIBLIOGRAPHY 95-100
APPENDIX 6 - SURVEY 101-117
_____________________________________________________________________Local Government Audit Service, VFM Unit

The Value for Money Unit of the Local Government Audit Service (LGAS), in my Department,
has prepared this comprehensive Report on the centrally important issue of the management of
sickness absence in the local authority sector, following on from the Public Service - Reform Plan
(2011), which included an action on Sick Leave in the Public Service.
It is important to recognise the achievements of local authorities in dealing with the financial
crisis, most significantly, staff reductions of 25% and overall savings of €839 million since 2008. It is
also important to be cognisant of the major Reform programmes underway in terms of Irish Water,
Implementation of the Action Programme – Putting People First and the Shared Service
Programme. Notwithstanding what has been achieved to date and what is underway, the sector is
committed to continuous improvement and in this regard the Report has been prepared with the
support and input from local authorities with a shared set of objectives, namely, to:
- Outline the position in terms of sickness absence levels in the Sector,
- Detail the Sectoral approach to the management of sickness absence and to identify best
practice, and
- Recommend ways of improving existing procedures, practices and systems, thereby
promoting efficiency and cost effectiveness.
Local authorities, through the Attendance Management Committee (AMC) which operates
under the aegis of the Local Government Management Agency (LGMA), have been pro-active in
devising and implementing Attendance Management Guidelines in recent years. I acknowledge
the progress achieved by local authorities in managing the overall level of absenteeism over the
last number of years. While sick absences are a normal part of working life it is important for
both staff and local authority management that the regime in place to manage sick leave is
robust and consistent across the sector.
I am confident that the information, analysis, and recommendations in this report will be
helpful to local authorities in further improving the management of sickness absence, and my
Department will work with local authorities to ensure that the Sector makes full use of the
recommendations in further developing the regime for the management of sickness absence. In
this regard, an oversight committee comprising representatives from my Department, local
authorities and the LGMA will be established shortly to assist with and monitor
implementation.
It is important that the rate of sick leave across the local authority sector is progressively reduced in
order to achieve long term sectoral targets.
I want to thank the LGAS and all other contributors for this Report.
Minister’s Foreword
_____________________________________________________________________Local Government Audit Service, VFM Unit
3
_________________________________
Phil Hogan, T.D.,
Minister for the Environment, Community and Local Government
29 November, 2013

AMC Attendance Management Committee of the LGMA
LGAS Local Government Audit Service
LGMA Local Government Management Agency
Long-Term Sickness Absence is as defined in LGMA policy. Long-term absences constitutes a
certain period or several periods of absence. It normally lasts for periods in excess of twenty working days
and can usually be attributed to a medical condition.
LGMA Sectoral Guidance is sector guidance for Local Government issued to the sector by the
LGMA.
Short-Term Sickness Absence is as defined in LGMA policy. Short-term absences are generally
considered to be absences of up to 20 days. A medical certificate from the employee’s General Practitioner
is required to cover absences of three days or more.
VFM Team Marita Gonsalves Local Government Auditor carried out this study under the
direction of Patrick Guiney Principal Local Government Auditor.
Glossary
_____________________________________________________________________Local Government Audit Service, VFM Unit
4

Executive Summary
5
Sickness absence is a part of work life. Empirical evidence gathered from industry (CIPD, IBEC),
public sector (Comptroller and Auditor General) and the local government sector (Service
Indicator Reports) has been utilised by the Attendance Management Committee (the AMC) of
the Local Government Management Agency (LGMA) to determine tolerable absence rates for the
sector1. Trends in absenteeism for the years 2004–2010 inclusive show that the average rate of
absenteeism for the sector is 4.75% which equates to 10.78 days per employee. This data enabled
the AMC to determine a suitable benchmark for the sector and local authorities agreed to seek to
reduce absenteeism to 4.4%, or under 10 days per employee by 2012. This would represent a
reduction of 7.5%. It was envisaged that a sectoral average of 3.5% should be the longer-term
target.
The Value for Money (VFM) Unit, issued a survey to all 34 city and county councils in respect of
strategy, policy and procedures for sickness absence management to evaluate the effectiveness of
current practices in this regard. The purpose of this study is to:
• Identify the level of application of LGMA sickness absence policy, strategy and
procedures.
• Identify the estimated cost and level of sickness absence in local authorities for the year
ended 31 December 2011.
• Identify efficiency and effectiveness savings in management of sickness absence2.
• Review the arrangements in place to measure, monitor and manage sickness absence.
• Review the extent to which performance indicators, benchmarks and case studies of
efficiency initiatives are used by local authorities to increase effectiveness in the
management of sickness absence.
• Review arrangement for the management of sickness absence.
Human Resources (HR) Management: Policy, Strategy, Guidelines
The survey found that management of sickness absence in the local government sector would
benefit from better reporting of performance locally and nationally in terms of application of
sickness absence strategy policy and procedure. Some key findings are:
• Nineteen authorities had adopted the updated sectoral attendance management policy
and procedure issued in March 2011. Three local authorities adopted the updated policy
in 2012. All other authorities operate under the terms of the 2006 sectoral policy.
• Twenty-four local authorities had adopted the LGMA sectoral human resource strategy
of which twenty had customised to meet local needs. One more local authority adopted
a strategy in 2012. Two local authorities who did not adopt a strategy cited the current
mergers and preparation of an amalgamated strategy as the reason.
_____________________________________________________________________Local Government Audit Service, VFM Unit
1 LGMA ‘Attendance Management Management Guideline Document’ November 20112 See Appendix 2 ‘Performance Indicators a User’s guide’ Department of Finance for definitions of
efficiency and effectiveness indicators.

6
_____________________________________________________________________Local Government Audit Service, VFM Unit
• Eleven authorities review and evaluate the updated sickness absence policy and
procedure annually to assess its effectiveness.
• Ten authorities produce risk assessment reports on sickness absence as part of the risk
management agenda.
• 50% of authorities do not have an attendance management plan.
• Twenty-five authorities did not quantify the number of Return to Work Forms in 2011.
• Not all employees had access to the full range of services under the Employee
Assistance Service.
• Local authorities provide a range of initiatives for staff to promote well-being.
The importance of the role of the line manager was emphasised in particular the need for access
to sickness absence information by all line managers.
Estimated Cost of Sickness Absence
Differing interpretation of LGMA sectoral guidance on cost calculation resulted in significantly
differing average daily costs for individual local authorities. Costs were re-calculated using one
average daily rate of €221.88. This was based on the average daily rate of three local authorities
calculated using 2011 payroll data. Total days sickness absence in local authorities cost
approximately €64.64m in 2011. Direct payroll costs of paid sickness absence net of social
welfare recoupable were used to calculate efficiency and effectiveness savings.
Local authorities need to use one consistent cost methodology to calculate estimated costs of
sickness absence.
Efficiency and Effectiveness Savings
There is a sector target for reduction in sickness absence to 4.4% by the end of 2012. Calculating
estimated costs and comparing with performance against the agreed sector target allows
calculation of estimated efficiency savings. Estimated efficiency savings of approximately
€21.10m were identified for the sector overall by the Unit applying the sector target for
reduction in sickness absence.
The survey found that at 31 December 2011, twelve authorities had set the sectoral target to
reduce sickness absence. Seven local authorities set a specific target between 4.5% and 5.5% and
four local authorities did not identify a specific target. Eleven local authorities set no target. By
31 December 2012, only 17 local authorities had set the sectoral target. Achievement of the
estimated €21.10m efficiency savings will not be possible without setting the sectoral target and
measuring achievement of targets.

7
In 2011, a total of 353,176 working days were lost in local authorities as a result of sickness
absence, an average sickness absenteeism rate of 11.78 days per employee. These days can be
either paid or unpaid.
In 2011, a total of 42,710 working days were lost in local authorities to sickness absence where
payment of salary or wage was discontinued. The percentage of working days lost in this
manner ranged from 0.01% to 2.29% across local authorities.
Approximately €10.07m estimated productivity savings could have been realised had all local
authorities achieved a sickness absence rate of 10 days.
Measurement of Sickness Absence
Measurement of sickness absence illustrates trends over defined periods of time and is a vital
element in management of sickness absence. All local authorities calculate the Organisational
Lost Time Rate for the national service indicators. Only eleven local authorities utilise it to
calculate the rate of sickness absence for programme areas. Lost time rate statistics for team
performance and programme area performance link into organisational performance and
highlight areas that require pro-active initiatives in order to reduce the overall sickness absence
rate. A number of local authorities stated it was not possible to report accurately on instances of
sickness absence at present. A number of local authorities sought to calculate absence rate but
were unable to do so citing the lack of clarity on the definition of average number of employees
or whether only short-term instances should be used. Eight local authorities calculated the
council Bradford Score3 as recommended by sectoral guidance. Five local authorities stated it
could be calculated individually but not for the authority as a whole. It was noted by those that
calculated the Bradford Score that the measurement was primarily used at individual level for
comparative purposes.
Identifying the number of staff who did not have any sickness absence in a given year is an
important staff motivator under the Performance Management Development System (PMDS).
The number of staff for the sector with no recorded spells of sickness absence could not be
calculated as two local authorities did not provide staff figures.
Twenty eight local authorities quantified the number of long and short term sickness absence
days facilitating the ability to target appropriate interventions. Twenty seven local authorities
provided details of staff numbers who took long or short-term sick leave in 2011.Twenty eight
local authorities were able to identify the causes of long and short-term sickness absence. Local
authorities do not have one agreed database to analyse the reasons for long and short term
sickness absence. Identification of causes aids effective targeted interventions.
_____________________________________________________________________Local Government Audit Service, VFM Unit
3 National management guidance stated that the Bradford Factor measures irregularity of attendance by
employees by combining measures of absence frequency and duration. See Chapter 4 Measurement of
Sickness Absence – Irregularity of Attendance.

8
_____________________________________________________________________Local Government Audit Service, VFM Unit
The top causes of short-term sickness absence cited as first cause were flu, colds; respiratory
tract infections; consultant or medical appointments; no cause specified; stomach upset; viral
illness; migraine and pain. The top causes of long-term sickness absence cited as first cause were
musculoskeletal disorders; post-surgery; acute medical conditions e.g. cancers; no cause
specified; stress or depression; pregnancy related illness; heart; unfit for work, general, pain. The
top causes of occupational injury cited as first cause were injury to limbs; falls, slips, sprains;
manual handling; machinery accident, equipment failure; back injury; other injury; head, neck
injury; accident no detail specified and post-traumatic stress.
A total of 4,536 days were declared as days lost to sickness absence due to work-related stress in
the twenty four local authorities that provided the data. Consideration should be given by the
sector to introduce a new metric for unpaid sickness absence with a focus on long-term sickness
and to report separately. Not doing so can mean that local authorities, where there may be a few
people with long-term serious illness, record poorer performance percentages than local
authorities where there is less long-term unpaid sickness absence.
There is scope for improvement in measurement of sickness absence. There is a role for HR in
monitoring trends of long and short term sickness absence and work-related stress. There is also
scope for HR to review progress made achieving efficiency and productivity targets and savings
and reporting annually.
Benchmarking Performance Good Practice Opportunities
Sickness absence has a significant impact on financial resources, staffing resources, on service
delivery and employee morale. Understanding how other bodies perform provides opportunity
to identify good practice. This report sets out a number of case studies outlining initiatives
which have been used to effectively target sickness absence. The report recommends use of the
Common Assessment Framework (CAF) to benchmark performance and to aid continuous
improvement in management of sickness absence. The CAF model is a management tool for
developing excellent public services in and outside of Europe.
The survey found that most local authorities used the national service indicators to benchmark
performance but that only four local authorities used other Irish Public Sector Indicators, three
used Private Sector Indicators and two used Public Sector UK Indicators to benchmark
performance. Nineteen local authorities benchmark against identified good practices. There is
scope to make far greater use of these resources.
Managing Sickness Absence
National HR Payroll and Superannuation System
The Local Government Efficiency Review Group Report 2010 recommended that a uniform
human resource and payroll system be implemented for local authorities (8.9.1). A HR Payroll
and Superannuation System (CoreHR) has been rolled out to 27 local authorities as part of a

9
national project. The Interim Report to the Minister for the Environment, Community and Local
Government and the LGERIG produced by CCMA in March 2012, committed in principle to a
migration plan for the remaining local authorities over time. The Further Report to the Minister for
the Environment, Community and Local Government published by the Local Government Efficiency
Review Implementation Group in April 2013, Appendix A states that the Payroll and
Superannuation HR shared service is currently at design stage, with the Core software being an
integral part of the Design stage.
Local authorities have tackled spending cuts head on and have reported significant efficiency
savings. The sector continues to respond to the challenges facing the sector today including
fundamental restructuring, reducing spending and provision of continued customer-focused
services. Effective management of sickness absence aids this through productivity savings by
doing things better and through payroll efficiency saving by meeting sectoral targets set. A
shared service for HR reporting functions would assist HR in responding to the requirements
contained in ‘Putting People First’ and to focus on more efficient and cost-effective ways of
delivering public services.
_____________________________________________________________________Local Government Audit Service, VFM Unit

1. Introduction
10
_____________________________________________________________________Local Government Audit Service, VFM Unit
Background to the reportObjective 12.5 under Initiative 12 of Department of Public Expenditure and Reform (DPER)
Public Service Reform Programme 20114 commits to review of central sick leave policies in the
Civil and Public Service with a view to improving performance and reducing absence to include
review and revision of sick leave arrangements and absenteeism policies in the Civil Service and
in other sectors.
This is being done against a background of major reform across the public service. The
Government has put in place an Employment Control Framework with sectoral targets for all
parts of the public sector, including the Local Government sector. The employment control
framework for the Local Government sector seeks to achieve a graduated reduction in numbers
from the 37,243 employed in June 2008 to 29,480 by the 31 December 20155, already achieved.
This required substantial reorganisation, restructuring, redeployment and reassignment of staff
in order to ensure the continued delivery of frontline and legally based local government
services. Separately, the Government, as part of the 2010 budgetary process established the Local
Government Efficiency Group to review the cost base, expenditure and numbers employed in
local authorities with a view to making specific recommendations to reduce these costs.6
Employee Control Framework
Local authorities have reduced staff numbers by almost a quarter from 37,243 in 2008 to 28,268
at 31 March 20137. Local government is undergoing a period of unprecedented change. The local
government landscape is facing significant reform and development arising from the
Government’s decisions to establish Irish Water and its action programme for effective local
government ‘Putting People First’, launched in October 20128. The sector continues to progress a
challenging efficiency agenda, and a sectoral jobs strategy, including establishing local enterprise
offices in each local authority. In the period 2008 to 2011, local authority revenue expenditure
has decreased from €4,720m to €4,345m and capital expenditure has decreased from €6,134m
to €2,121m9.
The IPA report, ‘Public Sector Trends 2012’, reports that “there has been a significant drop in the
numbers employed in both the public sector and public service from 2008, with a drop of
around 8 per cent in each case. The biggest drop proportionally being in the non-commercial
state agencies (19 per cent), local authorities (14 per cent) and the justice sector (13 per cent).
Numbers employed in the public sector and public service in 2012, are back down to close to
2005 levels of employment. Just under two per cent of all those in employment in the economy
(public and private) are employed in local authorities”.
4 Programme for Reform November 2011 page 48 Department of Public Expenditure and Reform.5 Workforce Planning in the Local Government Sector September 2012 page 36 Workforce Planning in the Local Government Sector September 2012 page 37 PQ 20499/13 and PQ 28065/13 8 LGAS Annual Activity Report 2013 page 49 LGAS Annual Activity Report 2013 page 13 Financial Overview
11
The IPA report figures are sourced from the Department of Finance’s Budgetary and Economic
Statistics 2012 report published in October 2012 which estimated staff figures as at 31 December
2012 as 30,000. Local authority staff figures returned in the survey data as at 31 December 2011
are 29,971.910. The government public sector early retirement scheme which had a deadline date
of February 2012 significantly reduced staff numbers after that date.
To effectively manage the combination of staff reductions and the very significant change
programmes underway in terms of the Action Programme for Effective Local Government, the
establishment of Irish Water and the Local Government Shared Services Programme, Workforce
Planning is underway and a Sectoral Work-Force Study11 has been undertaken jointly by the
Department of the Environment, Community and Local Government (the Department) and local
authorities which has made recommendations and provided a framework for management
requirements12. The Study recommends that the IPA be commissioned to produce a research
paper on the present and future capacity issues within the Local Government sector13.
Local Government Efficiency Review Group Report
The Report of the Local Government Efficiency Review Group (LGER) 2010 states that local
authorities should build on the positive work done to date to maximise economies of scale and
return for the taxpayer. It recommends that service indicators should be more firmly embedded
and used as part of the efficiency agenda, to drive change and challenge existing approaches to
service delivery. An Implementation Group, (the Group), with an independent chairman, has
been established to drive forward the recommendations contained in the report. The Group has
focused on the key recommendations that will remove costs and yield earliest financial savings
for the benefit of the sector and the economy generally.
In dealing with the financial crises local authorities have reported savings of €830m,
significantly reduced staff numbers and are engaged in a number of significant reform
initiatives14. The report ‘Putting People First’ progresses these initiatives.
Putting People First
Putting People First 2012 outlines Government policy for reform and development across the
local government system. The Report states that improved measurement of efficiency
performance will be assisted by revised Performance Indicators (PIs), will be subject to external
verification through the audit processes, benchmarking and the development of case studies of
best practice15. It sets a challenging agenda, in that the reforms must be completed in advance of
_____________________________________________________________________Local Government Audit Service, VFM Unit
10 See Appendix 4 Report Assumptions and Calculations. 11 The Department and the CCMA ‘Workforce Planning in the Local Government Sector’ September 2012
page 3 12 PQ 17 ref: 20499/1313 The Department and the CCMA ‘Workforce Planning in the Local Government Sector’ September 2012
page 914 PQ 17 ref: 20499/1315 Putting People First 9.1.5 Continuing delivery of efficiencies page 110

12
the 2014 local elections16. The objective of the report is stated as “to ensure that Local
Government is better placed to enhance the well-being and quality of life of citizens and local
communities, while delivering maximum value for money”17. Its Action Plan to 2014 covers
four main themes: Structures; Funding, Accountability and Governance; Economic Development
and Job Creation; and Delivering Services Efficiently18.
Putting People First identifies efficiency savings, including €3m efficiency savings through
introduction of a shared HR and payroll system19, and has identified projects prioritised as
having potential for effective savings and efficiencies including Transactional HR. The report
states that local authorities already have implemented a considerable degree of shared service
arrangements at national, regional and local levels and have done so using various models.
Specific reference is made to the Local Government Management Agency (LGMA)20.
The LGMA and management of Sickness Absence
Under the auspice of the LGMA, a HR Payroll and Superannuation System (CoreHR) known as
the CORE project has been rolled out to 27 of the 34 county/city councils as part of a national
project. The LGMA has stated that the rollout was completed mid-2012 and now has a
development agenda, which includes HR Metrics/Key Performance Indicators (KPIs) for the
post implementation phase. This report makes recommendations on how to improve
productivity and cut absences, on how current PIs developed for sickness absence are being
monitored, and makes recommendations for further PIs.
The LGMA has formally engaged with the sector on attendance management which includes
management of sickness absence, since 2005. Policy, guidelines and strategy is issued through an
Attendance Management Committee (the Committee) which the LGMA stated, was constituted
on a number of occasions between 2005 and 2013. The then Committee was chaired by the
Dublin City Manager and membership comprised of a number of HR professionals from the
sector. All outputs of the Committee were agreed through LGMA corporate governance
structures. The Attendance Management Policy and Procedure was issued to the sector in 2006
and agreed nationally with the staff side through the Local Authority National Council
(LANC)21. A revised Sick Pay Scheme, Policy and Procedure were issued to the Sector in early
2011. Following this, a resource pack comprising a Management Guidance Document and a
guide for Line Managers was circulated to assist local authorities maintain and/or improve
attendance levels and to ensure consistency of practice throughout the sector. The resource pack
updated existing best practice documents that local authorities were using since 2006. The
_____________________________________________________________________Local Government Audit Service, VFM Unit
16 Putting People First Vision Page 717 Putting People First Vision Page 718 Putting People First Vision Page 719 Putting People First 9.1 Local Government Efficiency Implementation 9.1.3 page 10920 Putting People First 9.2 Organisational efficiency in local government 9.2.3 page 11121 Managed through the LGMA the LANC is a forum for processing all industrial relations claims with
national implications.

13
LGMA has confirmed that “the initiative by the Department of Public Expenditure and Reform
(DPER) to standardise and reduce sick pay schemes throughout the public sector has again resulted in a
requirement to reconstitute the Committee, in 2013, reflecting on-going commitment of the sector to
attendance management, until such time as the revised arrangements for sick pay are embedded following
introduction of those arrangements from January 2014” and has stated that ”it is envisaged that the
terms of the revised scheme will be provided for through legislation”. Effective management of sickness
absence requires accurate and timely information on costs, instances of sickness absence, trends
and patterns, improvement targets, assessment of progress made achieving improvements and
evaluation of the effectiveness of management practices. The Value for Money Unit (the Unit) of
the LGAS undertook this study to evaluate the effectiveness of current practices in this regard.
Trends
Trends in sickness absence are reported nationally in the ‘Service Indicators for Local
Authorities’ for the years 2004–2011 inclusive published by the LGMA and are also reported in
Local Authorities’ annual reports. The LGMA ‘Attendance Management, Management
Guideline Document’ states the average rate of sickness absence for the sector for the years 2004–2010
is 4.75% which equates to 10.78 days per employee and that this data has enabled the Committee to
determine a suitable benchmark for the sector. The Committee recommended that “local authorities
seek to reduce absenteeism to 4.4%, or under 10 days per employee by 2012”, noting that “this would
represent a reduction of 7.5%”. The Committee stated that it is further envisaged that a sectoral
average of 3.5% should be the longer-term target; that this target of 4.4% may have already been met or
be achievable for some local authorities in the shorter term, however, all local authorities should seek to
achieve improvement in attendance from year to year. It states that in this regard, the information
gleaned from individual employee performance in this area together with team performance, programme
area performance and upwards to organisational performance should indicate areas that require pro-active
initiatives in order to reduce the overall absence rate. 23 of the 34 local authorities set a target for
reduction in sickness absence by the end of 2012. This report has identified that achieving the
LGMA sectoral target of 4.4% for reduction in sickness absence by 2012 would have resulted in
estimated payroll efficiency savings in the region of €10.13m22 for the sector. Achieving the
long-term LGMA sectoral target of 3.5% for reduction in sickness absence would have resulted
in further estimated payroll efficiency savings of approximately €10.97m23.
Service Indicators in Local Authorities
The National Service Indicators, as published by the LGMA, are quality assured by an
Independent Assessment Panel (the IAP) appointed by the Minister for the Environment,
Community and Local Government, in order to verify the returns proposed for the annual
Report on “Service Indicators in Local Authorities”24. In 2011, the IAP reviewed 5 of the 46
Service Indicators including absenteeism. The IAP report comments on the absence of targets
_____________________________________________________________________Local Government Audit Service, VFM Unit
22 The basis of this calculation is set out in Appendix 4 see also Appendix 1 Table 3.23 The basis of this calculation is set out in Appendix 4 see also Appendix 1 Table 3.24 LGMA Service Indicators in Local Authorities 2011, Appendix 1 Report of the Independent Assessment
Panel Service Indicators in Local Authorities, 2011 page 150.

14
against which to assess performance and notes that “it has been emphasised in previous IAP,
Office for Local Authority Management (OLAM) and other reports, including the Report of the
Local Government Efficiency Review Group (July 2010), that the indicators should be firmly
embedded in management systems and used to monitor and improve performance and aid
decision making in relation to policy outcomes, budgets and expenditure matters”, and that, “in
light of the above, the IAP would yet again urge that each authority be required to put in place
the necessary management processes to link more closely the service indicators with the setting
and achievement of efficiency targets.”
Occupational Health
An additional focus on Occupational Health was included in the VFM Study at the suggestion
of the LGMA, as the frontline and in many cases physical nature of many local authority jobs
presents particular challenges for managing attendance. Many services provided by local
authorities are at the frontline and include fire services, water drainage services, housing
maintenance, roads maintenance, homeless, welfare services, environmental services, planning,
civil defence, recreation and leisure services. Dublin City Council provides fire and emergency
services for the entire Dublin region. The LGMA have stated that a Five Year Plan for the sector
in relation to management of health, safety and welfare, with five high level goals that should
contribute to a reduction in sickness and occupational injury has recently been prepared.
In collaboration with the Programme Management Office (PMO), local authorities have engaged
in a substantial body of work identifying efficiencies and exploring and developing shared
services proposals. Transactional shared services have a culture of continuous improvement. A
business case has been submitted for HR Transactional shared services. The sector has
commenced regionalised procurement for twenty-three local authorities for the provision of
Employee Assistance Services.
Reform Agenda
The Public Service Agreement 2010-2014, Part 5 of the Local Government Sector Agreement
Productivity and Performance Section 5.16 states that “it is essential that the productivity
potential from new work practices is realised in areas such as cross-stream reporting, team-
based working and the development of skills mixes, with a potential consequential effect on
current payments”. It notes that “better management and standardisation of annual and sick
leave will be necessary, to manage continuity of service and peak demands and to effect pay bill
savings ”25. Based on the analysis of survey data collected by the VFM Unit, the estimated cost
of paid sickness absence in local authorities was in the region of €64.64m26 in 2011. A total of
353,17627 working days were lost to sickness absence, approximately11.7828 working days per
_____________________________________________________________________Local Government Audit Service, VFM Unit
25 Public Service Agreement 2010-2014 Productivity and Performance Page 3826 The basis of this calculation is set out in Appendix 4 see also Appendix 1 Table 3.27 The basis of this is set out in Appendix 4 see also Appendix 1 Table 2.28 The basis of this calculation is set out in Appendix 1 Table 2.

15
person. The average sickness absence rate for the sector was 5.19%29 (4.43% certified sickness
absence and 0.76% self-certified sickness absence). The average absenteeism rate for sickness
absence at 5.19% is broadly comparable with other strands of the public service such as the HSE
4.9%30 and the Civil Service 4.21%.
The Minister for Public Expenditure and Reform announced in July 201231, that “reformed sick
leave arrangements in the public service will result in increased productivity, reductions in
absenteeism and a significant reduction in the cost of sickness absence in the public service, are
being implemented”, that “it is intended that cost savings will be achieved through a parallel
approach of revising the current paid sick leave arrangements and implementing more robust
systems to manage sick leave actively by line managers”. Circulars reflecting sickness absence
entitlements and limits for the public service as set out by DPER and will need to be reflected in
updated local authority LGMA sectoral Sick Pay Schemes. The AMC recommended that local
authorities “seek to reduce absenteeism to 4.4%, or under 10 days per employee by 2012”.
Approximately €10.07m estimated efficiency savings could have been realised had all local
authorities achieved a sickness absence rate of 10 days per person. The basis of this calculation is
set out in Appendix 4 see also Appendix 1 Table 4.
VFM Unit Study MethodologyA survey was issued to all 34 city and county councils, in respect of strategy, policy and
procedures for sickness absence management. It also surveyed the arrangements in place to
identify, manage, monitor and control sickness absences, including the measures and initiatives
adopted, to promote wellbeing and attendance. The Study methodology also included:
• Visits to four pilot councils including consultation with appropriate management
personnel to develop the National Survey: Following consultation with the LGMA at all
stages throughout the Study the final decision on methodology and on survey design
was taken by the VFM Unit
• Visits to eight local authorities for data verification and detailed consultation on good
practices identified
• Circulation of the draft report to all city and county managers with request for data
confirmation and comment
_____________________________________________________________________Local Government Audit Service, VFM Unit
29 The basis of this calculation is set out in Appendix 1 Table 2. The combined sickness absence figure
reported in the LGMA Service Indicators in Local Authorities for 2011 is 5.09%. There is a difference of
0.1% with the reported survey combined figure of 5.19%. This relates to timing differences in the
reported number of days short-term and long-term sickness absence and number of FTE employees. 30 HSE statistic on HSE Annual Report 2011 page 3.31 http://per.gov.ie/2012/07/19/reformed-sick-leave-arrangements-in-public-service-will-result-in-
increased-productivity-reductions-in-absenteeism-and-a-significant-reduction-in-the-cost-of-sick-leave-
in-the-public-service/

• Consideration of best practice and performance indicators in the area of sickness
absence management
• Appendix 5 details the list of publications examined.
Performance Improvement
There is scope for improvement in adoption and application of sickness absence strategy, policy
and procedure. There is risk that HR processes for management of sickness absence may not be
aligned to meet the current and future service delivery needs where local authorities have not
adopted a locally agreed strategy based on the LGMA sectoral HR Strategy Framework issued
to local authorities in 2008 or a different strategy to manage Human Resources for example ISO
Accreditation or have not adopted the updated LGMA policy and procedure issued in March
2011. Comparison across the sector or the wider public service is not possible without consistent
policy and consistent measurement of LGMA sectoral targets. Management of sickness absence
in the local government sector would benefit from better reporting of performance locally and
nationally, in terms of application of LGMA sectoral strategy policy and guidance. Further
productivity savings could be achieved by doing things better and more consistently across the
sector. Examples of good practices noted within the sector and the wider Irish public service, are
reported in this Study. Greater use of benchmarking and case studies of efficiency initiatives
will aid evaluation of the economy, efficiency and effectiveness of sickness absence strategy.
Performance Indicators are summarised in Appendix 3.
Reporting Sickness AbsenceThe need for robust reporting
Comparison of performance across the sector and with the wider public service is not possible
without consistent measurement of achievable targets and reporting progress. Statistics on the
average sickness absence percentage and the estimated cost of sickness absence in the local
authority sector highlighted the need to evaluate the application of sectoral policy and processes
for the management and reporting of sickness absence in the sector. This report quantifies the
financial impact and scale of sickness absence, the causes of sickness absence, arrangements in
place to manage, monitor and control absence including well-being interventions, as a strong
and coherent sector approach to application of sickness absence policies and procedures
maximises integration and efficiency across the local government sector including reporting on
sickness absence and the effectiveness of the arrangements in place to manage it.
Reporting Sickness Absence Nationally
Attendance levels reported in the national Service Indicators for sickness absence relates to the
percentage of working days lost to certified and self-certified sickness absence. Reporting
sickness absence costs and performance against efficiency and effectiveness savings identified in
financial indicators would strengthen financial oversight of the sector.
_____________________________________________________________________Local Government Audit Service, VFM Unit
16

RecommendationsThis report has made a number of recommendations as set outbelow.
AcknowledgementThe VFM Unit would like to thank the following external bodies who were contacted during the
course of the study;
• Office of Local Authority Management.
• Northern Ireland Audit Office.
• Department of Public Expenditure and Reform.
The VFM Unit would also like to thank each of the following, for their assistance and co-
operation during the study:
• All 34 City and County Councils who participated in the study, in particular to those
local authorities visited and personnel consulted.
• The VFM Advisory Committee established for this study.
_____________________________________________________________________Local Government Audit Service, VFM Unit
17
• Recommendation: Full reporting of sickness absence costs and performance against
sectoral targets for efficiency and effectiveness savings nationally.
• Recommendation: Unpaid certified sickness absence to be quantified and reported
separately in the Service Indicators.
• Recommendation: The Common Assessment Framework (CAF) to be used to
benchmark performance and to aid continuous improvement in management of
sickness absence in the sector.
• Recommendation: A shared service arrangement for internal HR reports and external
compliance reports to be established.
• Recommendation: The local government sector to establish a Best Practice website for
managing sickness absence in the shared service.

A strong and coherent sector approach to the application of sickness absence policies and
procedures maximises integration and efficiency across the local government sector. The LGMA
issued sectoral policy ‘Attendance Management Policy and Procedures for XYZ Local Authority’
together with Good Practice Recommendations ‘Attendance Management Policy Good Practice
Recommendations’ as procedural guidance in 2006. The sectoral policy ‘Attendance
Management Policy and Procedure’ was updated in March 2011. Sectoral sick pay schemes
applicable to all clerical/ administrative, engineering, technical and related grades and all staff
employed as craft workers, general operatives and all related grades were issued in March 2011,
to be administrated in conjunction with the policy. Procedural guidance was updated in
November 2011.
Sectoral Policy and Sick Pay Schemes
Sectoral Attendance Management Policy and Procedure
Nineteen local authorities had adopted the sectorally agreed policy ‘Attendance Management
Policy and Procedure’, issued in March 2011 at 31 December 2011. Three more local authorities
had adopted it in 2012.
Figure 1: Sectoral ‘Attendance Management Policy and Procedure’
Sectoral policy allows for greater examination of management of sickness absence and facilitates
measurement of identified targets. The sectoral policy states that measurement of deliverable targets
is taking place across the sector with the level of attendance an important indicator in this regard. The
2. Human Resources Management: SectoralPolicy, Strategy, Guidelines
_____________________________________________________________________Local Government Audit Service, VFM Unit
18
Number of local authorities who adopted the updated national ‘Attendance ManagementPolicy and Procedure’ issued March 2011
Updated sectoral policy Operate 2006 Updated sectoral Operate 2006 sectoraladopted sectoral policy policy adopted in policy expected to
updated sectoral 2012 adopt updated sectoralpolicy not adopted sectoral policy by end of
2013

sectoral policy notes that comparison across the local authorities, the wider public sector and the private
sector is possible as a result of measurement of deliverable targets.
Implication: Comparison across local authorities, the public sector and the private sector is not
possible without consistent measurement of deliverable targets.
Performance indicator for sectoral policy and procedure: All local authorities to adopt the
sectoral policy ‘Attendance management policy and procedure’.
Sectoral Sick Pay Schemes
Local Authorities ‘National Attendance Management Policy and Procedure’, updated in March
2011 incorporates Sick Leave Pay Schemes agreed for all staff. The report survey enquired as to
whether the council adopted the nationally agreed sectoral policy ‘Attendance Management
Policy and Procedure’ issued in March 2011. It also enquired whether the council adopted the
sick pay schemes for clerical, administrative, engineering, technical and related grades and for
craft workers, general operatives and all related grades. Twenty local authorities outside of the
Dublin area had adopted the sectoral sick pay schemes. One local authority adopted them in
2012. One local authority adopted a modified version. Some local authorities advised that the
sick pay scheme was under review.
The four Dublin Local Authorities are required to adopt the Sick Leave Pay Scheme for clerical/
administrative, engineering, technical and related grades and did. They are not required to
adopt the sectoral sick leave scheme for craft workers, general operatives and all related grades
(out-door staff) as they apply a union-negotiated sick pay scheme in the Dublin area.
The Minister for Public Expenditure and Reform announced in July 201232, that “reformed sick
leave arrangements in the public service will result in increased productivity, reductions in
absenteeism and a significant reduction in the cost of sickness absence in the public service” are
being implemented, that “it is intended that cost savings will be achieved through a parallel
approach of revising the current paid sick leave arrangements and implementing more robust
systems to manage sick leave actively by line managers”.
Sectoral Strategy and Guidelines
Sectoral Human Resource (HR) Strategy Framework
A sectoral HR Strategy Framework was issued to local authorities in 2008. This was the baseline
document for local authorities to customise to produce a local HR strategy and implementation
project plan suited to their local organisational and HR issues. Twenty local authorities adopted
a locally agreed HR Strategy. Four more local authorities implement the sectoral HR strategy
_____________________________________________________________________Local Government Audit Service, VFM Unit
19
32 http://per.gov.ie/2012/07/19/reformed-sick-leave-arrangements-in-public-service-will-result-in-
increased-productivity-reductions-in-absenteeism-and-a-significant-reduction-in-the-cost-of-sick-leave-
in-the-public-service/

without local modification and another local authority adopted the LGMA sectoral strategy as of
1 January 2012.
In June 2011, the Government announced its decision to create a new single authority to replace
Limerick City and County Councils with effect from 2014. This was followed by the
announcement of the establishment of a new unified county council to replace South Tipperary
and North Tipperary County Councils. North and South Tipperary County Councils have both
prepared strategies. The councils are currently in the process of merging with the objective of
establishing a single local authority for County Tipperary following the 2014 local government
elections. As part of this process all strategies, policies and procedures will have to be aligned
and these are all currently being examined. One of the two merging local authorities noted that
it is intended to develop a unified HR Strategy and to have this in place in time for the
amalgamation of the two authorities. A new single local authority is to replace the existing
Waterford City and County Councils in 2014, following the recommendation of the Waterford
Local Government Committee, which completed its report in March 2012. One of the local
authorities amalgamating stated that a draft HR strategy has been prepared but not finalised or
circulated due to the changing environment including reduction in staff numbers and possible
merger.
One local authority not amalgamating stated that it was looking to develop its strategy in line
with the sectoral strategy, but had not yet adopted it. Nine local authorities stated that they have
not adopted a locally agreed HR strategy. Of these, three local authorities cited the upcoming
merger and indicated their intention to adopt. Of the remaining six, one stated that the Senior
Management Team had not formally adopted a local HR strategy as at 31 December 2011 or had
not adopted the sectoral HR strategy.
Figure 2: Sectoral ‘Human Resource Strategy Framework for Local Authorities’ 2008
_____________________________________________________________________Local Government Audit Service, VFM Unit
20
Number of local authorities who adopted a locally agreed HR Strategy
Locally Agreed HR Implementing Implementing HR Strategy Locally AgreedStrategy Adopted sectoral HR Strategy sectoral HR prepared intend HR Strategy not
not modified locally Strategy not to adopt at time adoptedmodified locally of merger
in 2012

Implication: There is risk that HR processes for management of sickness absence may not be
aligned to the current and future service delivery needs in local authorities who have not
adopted a locally agreed HR Strategy.
The LGMA has indicated that the HR Strategy Framework is currently being updated as part of
the 2013/14 work plan for the HR Strategy Steering Group.
Sectoral ‘Attendance Management Policy Good Practice Recommendations’ Guideline
The ‘Attendance Management Policy Good Practice Recommendations’ guidance issued in July
2006, was added to in November 2011 by separate guidance placing increased emphasis on the
role of line managers/supervisors monitoring and implementing sickness absence policy. Local
authorities amalgamating should ensure that they have adopted unified guidelines and to have
this in place in time for the amalgamation of their authorities.
Figure 3: ‘Attendance Management, Management Guideline Document’
Sectoral ‘Attendance Management Guidelines for Line Managers’
Involvement by line managers in management of sickness absence ensures the most effective
management of sickness absence. In local authorities, the importance of this role was recognised
by issue of a separate sectoral guideline for line managers in 2011 building upon the 2006 good
practice guidelines which emphasises their role in monitoring sickness absence, managing an
employee during sick leave, where needed developing a suitable return to work plan and conducting
an interview upon their return to work. The guideline places emphasis on accurate recording and
monitoring of sickness absence within their line management area to enable line managers monitor
levels and compare them over different time periods. The guidance notes that recording and monitoring
of sickness absence is helpful to line managers for identifying the highest causes of absence and for
planning in order to reduce sickness absence and improve attendance.
_____________________________________________________________________Local Government Audit Service, VFM Unit
21
Number of local authorities who adopted the ‘Attendance Management,Management Guideline Document’ or local equivalent Guideline
Guideline Adopted Local Guideline Guideline Not Guideline AdoptedAdopted Adopted in 2012

Figure 4: ‘Attendance Management Guidelines for Line Managers’
Communication of Sectoral Strategy, Policy and Guidelines to Staff
Sickness absence is a cost to the organisation. Line management and all staff must be aware of
and notified of strategy, policy and guidelines to be applied. LGMA sectoral guidelines to
management state that the local authority attendance management policy and procedure in
place should be issued to all employees at recruitment stage and when any amendments are made.
LGMA sectoral guidelines state that communicating the standards expected of employees in relation to
attendance at work will ensure that employees have clarity in relation to contractual obligations and
entitlements and will inform as to where the infringement parameters lie.
Figure 5: Communication of adopted Strategy, Policy and Guidelines to all staff
_____________________________________________________________________Local Government Audit Service, VFM Unit
22
Number of local authorities who adopted the ‘Attendance Management Guidelinesfor Line Managers’ or a local equivalent Guideline
Guideline Adopted Local Guideline Guideline Not Guideline AdoptedAdopted Adopted in 2012
All documents All documents No documents All documentsadopted formally adopted not adopted 2011 were adopted formallycommunicated in communicated communicated in communicated in
2011 formally to staff 2011 some formally 2012communicated in 2012
Number of local authorities who formally communicated all strategy, policy andguidelines to staff

Implication: Line management and staff in authorities where documentation is not formally
communicated will not be aware of sectoral strategy, policy and guidelines to be applied. As
such, management of sickness absence may not be effective.
Where the documentation was communicated formally a range of methods were used including:
Partnership forum; Unions; Email to office based staff; Post; Hard copies issued to depots for
non-office based staff; Intranet; Internal staff newsletter; Details attached to each payslip;
Information in Staff Handbook; Memo from SEO in Human Resources emailed to all indoor staff
and hard copy was sent to all outdoor staff; Information slides and training. Communication
methods for issuing documentation of the line manager role in relation to responsibility for
implementing the HR strategy were similar to the above but included awareness briefings.
One local authority stated that all documents would be formally communicated by the end of
2012. A second local authority indicated the same and stated that the delay was due to
engagement with the Unions as a change was required to outdoor staff sick leave entitlements to
bring the council in line with sectoral policy. In the interim, the council stated that it provided
HR Line Manager training.
Good Practice noted: In one local authority when a new policy is implemented a copy of the
policy and an acknowledgement slip is disseminated to all staff. All Department and Section
Heads are required to ensure that staff in their area, especially staff that do not have access to e-
mail or are on leave, have received the policy document and complete and sign the
acknowledgement slip and that same is returned to HR section. The acknowledgement slips are
retained on the policy file as proof that the staff member received and read the document.
Returned slips are then checked against staff lists. Reminders are sent to staff where the
acknowledgement slip not returned. Follow ups continue at regular intervals to ensure full
compliance with this practice.
Review and Evaluation of Sectoral Policy and Procedure
The 2006 ‘Attendance Management Policy Good Practice Recommendations’ makes
recommendation that local authorities review and evaluate the attendance management policy on an
annual basis. Such review may include comparison with previous years’ attendance rates that may inform
management of trends and whether or not existing policies and procedures are effective.
_____________________________________________________________________Local Government Audit Service, VFM Unit
23

Figure 6: Annual Review and evaluation of Sectoral Policy and Procedure
Nine of the local authorities who adopted the ‘Attendance Management Policy and Procedure’
do not review or evaluate it annually. Three local authorities adopted it in 2012. Of these one
reviewed and evaluated it and the second local authority stated that there is commitment to
review and evaluate it regularly.
One local authority who did not adopt LGMA policy but uses it, noted that the review of the
policy is carried out by management in the Human Resources Department who deal with
attendance management issues. The policy is considered in the context of relevant available
documentation and any changes made are brought to the attention of the trade union and
managers across the organisation prior to the implementation of the revised procedures.
The 2006 Attendance Management Policy Good Practice Recommendations states that aside from
the review and evaluation of statistical data, the annual review should include a review (by survey) of
local authority referral practices (e.g. a review of the effectiveness of General Practitioners, Occupational
Health specialists, counselling services etc. and review of implementation of the policy by line managers
and supervisors.)
Implication: The effectiveness of new policy interventions and implementation of policies and
procedures are not assessed. Management of sickness absences may not be aligned to the
current and future service delivery needs of local authorities.
UK Good Practice Noted: National Audit Office (NAO) Report: Managing Attendance in the
Department for Work and Pensions 2004 Report by the Comptroller and Auditor General
2004 reported that the Department (for Work and Pensions) evaluated the impact of its’
attendance policy. The Department undertook an evaluation of the impact of the attendance
policy in terms of whether the policy document was being used, whether it had been effective in
_____________________________________________________________________Local Government Audit Service, VFM Unit
24
Updated national Operate 2006 Updated national Operate 2006policy adopted national policy policy adopted by national policy
updated national end of 2012 expected to adoptpolicy not adopted by end of 2013.
Commitment to evaluate made.
Policy Adopted Review and Evaluate
reducing sickness absence and identification of good practices. This was done by means of
survey and focus groups. The report assessed the UK Department’s performance against widely
accepted good practices. The NAO was assisted in this by attendance management experts from
the Institute for Employment Studies and the Institute of Work Psychology. The review was
undertaken at a time when the Department itself was reviewing the success of its attendance
management policy. The initial evaluation identified three areas for action: a targeted re-launch
of the policy; more training and skill development of line managers and increased access to
support. These findings were used as an opportunity to redefine current policy and to re-
emphasise its messages to staff.
National service indicator requirement of report on attendance levels
Local authorities are required to measure their performance against the standard set of
indicators and to publish their results in their annual reports as instructed in the 2004 Service
Indicators report. A report on attendance levels is required to be contained in the council’s
annual report in line with national service indicator requirements. The 2004 Service Indicators
Report states this allows “elected members judge how their council was performing relative to other
similar councils and to provide a mechanism for management to monitor performance over time”.
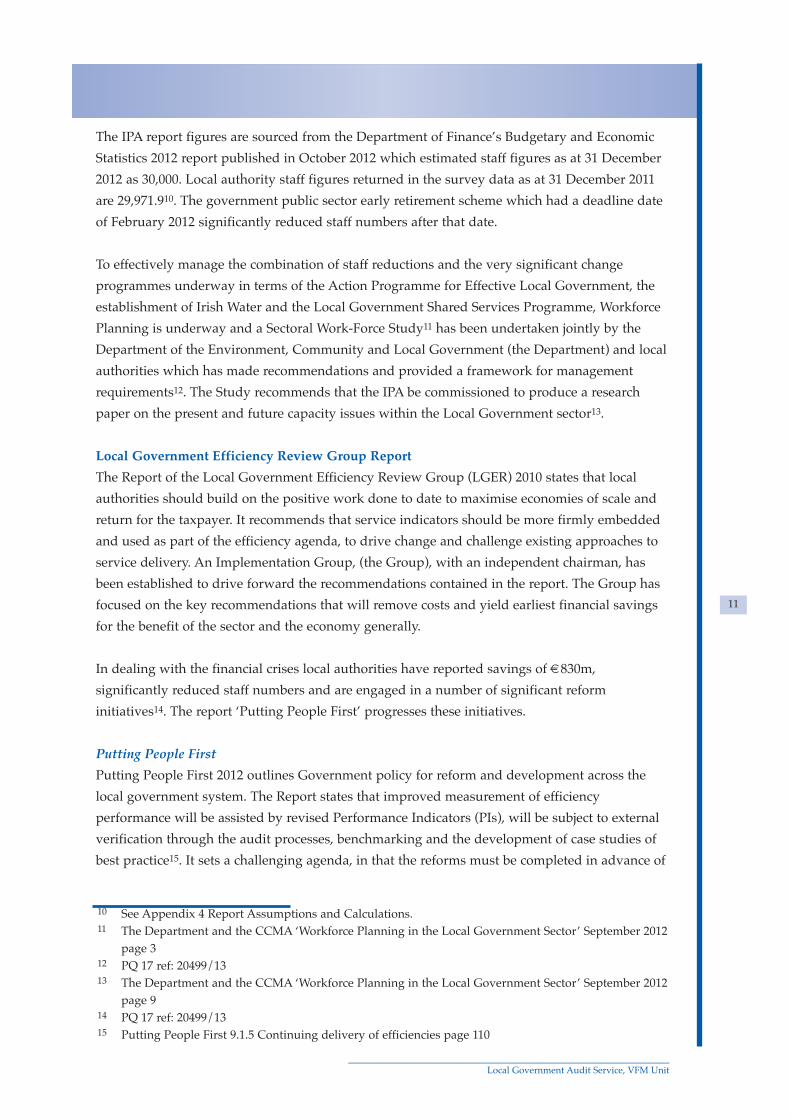
Figure 7: Reporting sickness absence percentages in the Council’s 2011 Annual Report
The authorities who did not include data in the Council 2011 Annual Report have declared that
they use the National Service Indicators report, make comparison with the national average.
Risk Management and Corporate Governance
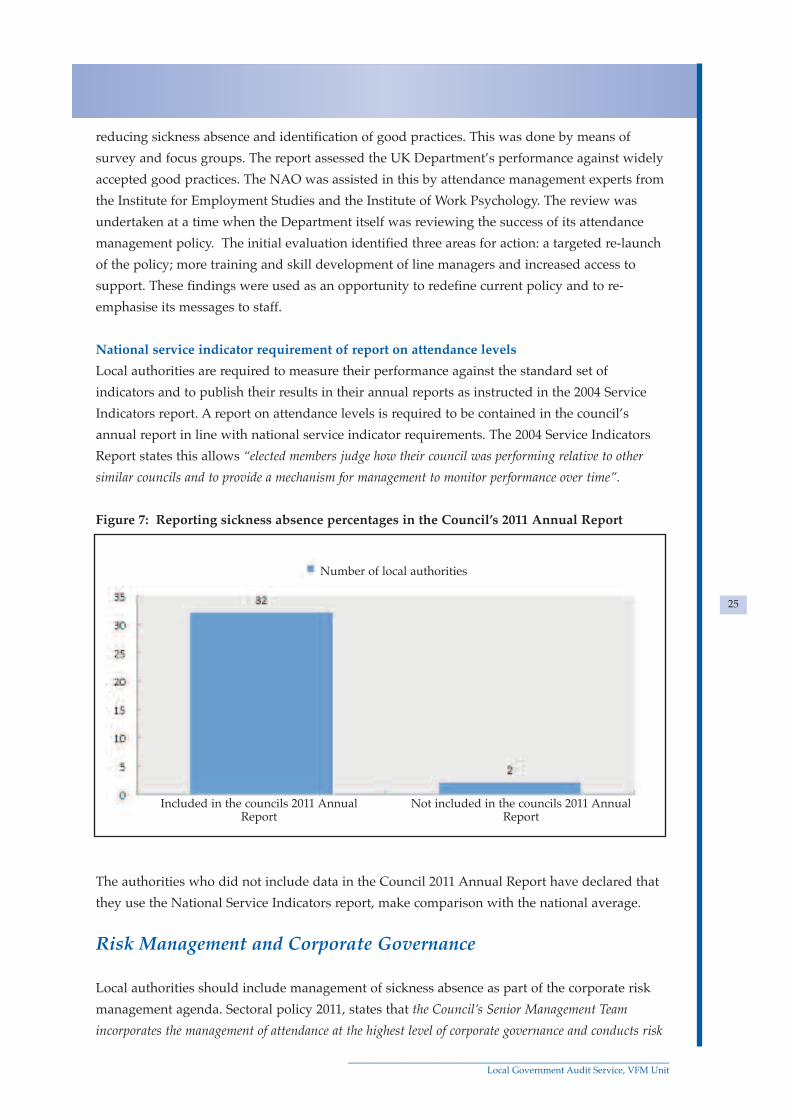
Local authorities should include management of sickness absence as part of the corporate risk
management agenda. Sectoral policy 2011, states that the Council’s Senior Management Team
incorporates the management of attendance at the highest level of corporate governance and conducts risk
_____________________________________________________________________Local Government Audit Service, VFM Unit
25
Included in the councils 2011 Annual Not included in the councils 2011 AnnualReport Report
Number of local authorities
assessments and implements associated control measures in relation to work- related absence which
includes sickness absence. Attendance management includes management of sickness absence.
Figure 8: Risk Assessment Reports and Corporate Governance
Senior management in 9 of the 10 local authorities where risk assessment reports are produced
as part of the corporate risk management agenda is presented with risk assessment reports.
Reports presented to senior management of seven local authorities focus on the prevention of
occupational and other absence. One local authority noted that risks costs were based on actual
case value costs beyond council control.
Implication: Management of sickness absence is not part of the corporate risk management
agenda, including risk identification, quantification and mitigation, the identified risks and the
cost of sickness absence may not be properly recognised.
Performance Indicator for Risk Quantification and Mitigation: All local authorities to quantify
identified risks in respect of management of sickness absence and implement control measures
as part of corporate risk management in accordance with sectoral policy.
Attendance Management Plan
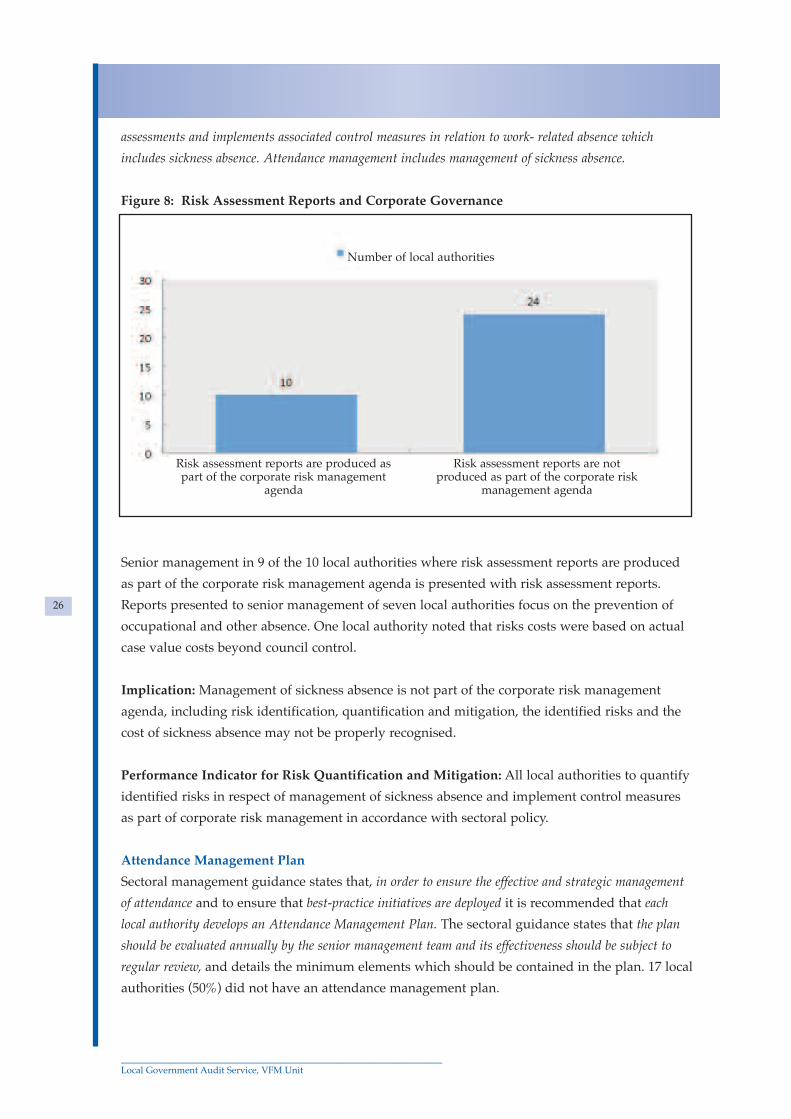
Sectoral management guidance states that, in order to ensure the effective and strategic management
of attendance and to ensure that best-practice initiatives are deployed it is recommended that each
local authority develops an Attendance Management Plan. The sectoral guidance states that the plan
should be evaluated annually by the senior management team and its effectiveness should be subject to
regular review, and details the minimum elements which should be contained in the plan. 17 local
authorities (50%) did not have an attendance management plan.
_____________________________________________________________________Local Government Audit Service, VFM Unit
26
Risk assessment reports are produced as Risk assessment reports are notpart of the corporate risk management produced as part of the corporate risk
agenda management agenda
Number of local authorities
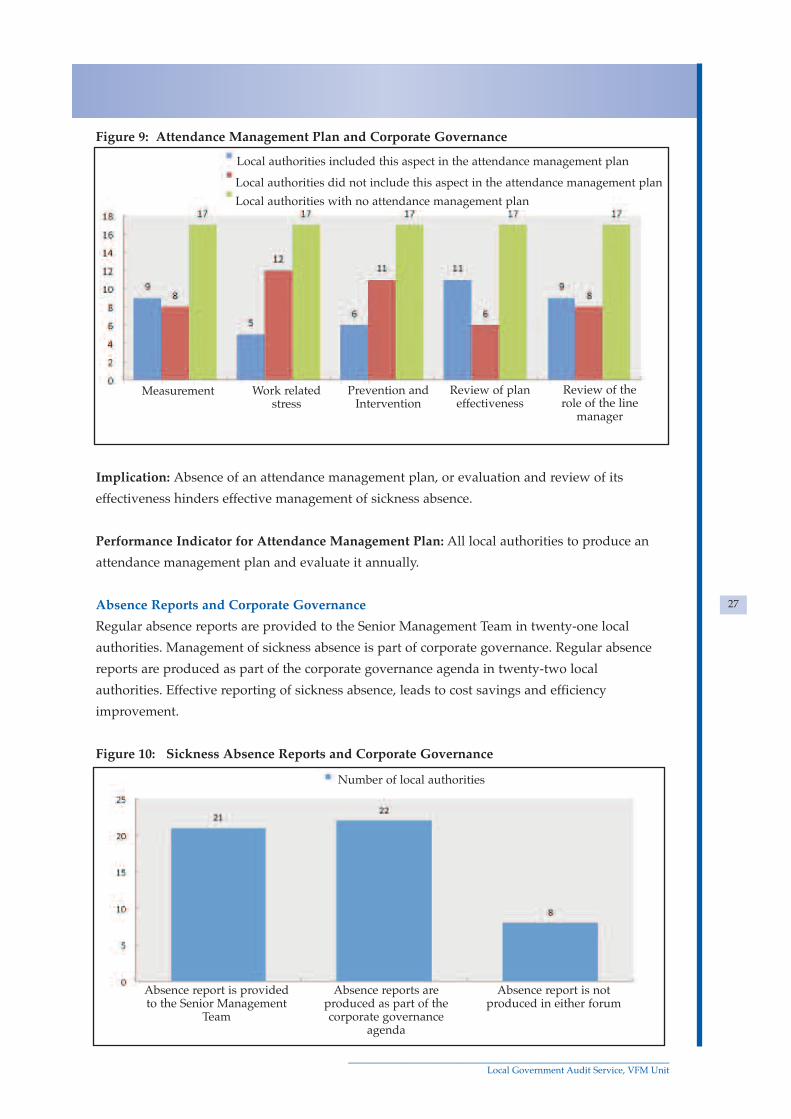
Figure 9: Attendance Management Plan and Corporate Governance
Implication: Absence of an attendance management plan, or evaluation and review of its
effectiveness hinders effective management of sickness absence.
Performance Indicator for Attendance Management Plan: All local authorities to produce an
attendance management plan and evaluate it annually.
Absence Reports and Corporate Governance
Regular absence reports are provided to the Senior Management Team in twenty-one local
authorities. Management of sickness absence is part of corporate governance. Regular absence
reports are produced as part of the corporate governance agenda in twenty-two local
authorities. Effective reporting of sickness absence, leads to cost savings and efficiency
improvement.
Figure 10: Sickness Absence Reports and Corporate Governance
_____________________________________________________________________Local Government Audit Service, VFM Unit
27
Local authorities included this aspect in the attendance management plan
Local authorities did not include this aspect in the attendance management plan
Local authorities with no attendance management plan
Measurement Work related Prevention and Review of plan Review of thestress Intervention effectiveness role of the line
manager
Number of local authorities
Absence report is provided Absence reports are Absence report is notto the Senior Management produced as part of the produced in either forum
Team corporate governanceagenda

Nine of the twenty-two local authorities, who produce regular absence reports, focus upon
occupational or other absence. One of the eight who do not produce absence reports indicated
that reports were produced for the senior management team and as part of the corporate
governance agenda from 2012.
Good Practice
Merton London Borough Council is a good example of this. The NAO report Progress in
improving government efficiency: lessons from case studies of efficiency initiatives. 2006
Case Study 7 - Merton Borough Council introduced a sickness management scheme to address
the issue of high levels of absences and associated financial cost. Producing timely and accurate
absentee information and reforming work practices has enabled the Council to manage sickness
absences effectively. Significant productive time improvements have been achieved because the
average number of days taken per employee has reduced from 14 to 8.
The key factor identified as contributing to this successful transition over a three year period
was recognition of the changing needs of employees, achieved by taking steps to minimise
absences by understanding the causes and take preventative measures, for example, to recognise
external demands, motivate employees to ensure they feel valued and promote good health.
Other factors included production and analysis of accurate and timely information to identify
areas of weaknesses requiring attention, and clear definition of the roles and responsibilities of
line managers on HR issues together with clear procedures for reviewing absences.
Return to Work Conversations and Return to Work Forms
Conducting Return to Work conversations and completing Return to Work forms is an effective
method of reducing sickness absence in the workplace. Line managers are required to undertake
a Return to Work Conversation and complete a Return to Work Form for every instance of
absence for employees under their supervision including sickness absence.
Figure 11: Return to Work conversations and Return to Work Forms
_____________________________________________________________________Local Government Audit Service, VFM Unit
28
Number of local authorities where Return to Work Forms were completedfor Return to Work Conversations carried out in 2011 and quantified
Return to Work Forms Return to Work Forms not Return to Work Formsquantified in 2011 quantified in 2011 quantified from 2012

Sectoral policy states that this requirement forms part of the duty of care that an employer has
towards employees and will assist the local authority in identifying underlying causes of illness33.
Sectoral policy states that Return to Work Conversation will be held with the relevant line manager
following each and every absence on sick leave or other unauthorised leave, that following the
conversation, a Return to Work Form will be completed, co-signed by the relevant line manager and the
employee and will be recorded in the Council’s systems. For the local authorities that held Return to
Work Conversations, 3,380 were recorded. Differences in interpretation of record-keeping for
Return to Work forms led to considerable variance in the stated number of return to work forms.
It is clear from the data that only a small number of local authorities document this process.
Twenty-five local authorities were unable to quantify the number of Return to Work Forms.
Sectoral policy states that Persistent incidents of frequent intermittent sick leave absences may be
investigated. Frequent and intermittent absences may be defined as short-term absences that are normally
sporadic and attributable to minor ailments, in many cases unconnected. Often the employee will only be
absent for a maximum of a week but more often for single days. Return to Work conversations and
forms are an important intervention in this regard.
Good practice noted: Sectoral attendance management policy 2006, re-enforced in 2011, states
that …All incidents of absenteeism (i.e. absence that is not pre-authorised) must be recorded on a ‘Return
to Work’ form and be signed by both, the employee and line manager / supervisor. The form should form
part of a Return to Work Conversation between the employee and the line manager / supervisor. This
applies to sickness absence. In a local authority the attendance clock is updated with a credit for
the hours lost for staff on the clock where self-certified sickness absence is claimed when the
Return to Work Form is completed and signed by the line manager.
Sick Leave Review Meetings
It is important to have a formal plan in place to help employees to get back to work after a
prolonged spell of sickness or injury-related absence. Sectoral ‘Attendance Management Policy
Good Practice Recommendations’ issued in 2006 states that on-going personal contact between the
local authority and the employee both written and verbal during the review and monitoring period of a
long-term absence will have a positive effect on the duration of the absence. On-going contact through
holding sick leave review meetings are an important intervention in this regard. Thirty-one
local authorities indicated that they intervene at an early stage with an individual on long-term
sick leave34.
_____________________________________________________________________Local Government Audit Service, VFM Unit
29
33 Attendance Management Policy and Procedure Section 3.434 See Figure 15 Intervention Measures to Promote Attendance and Well-Being
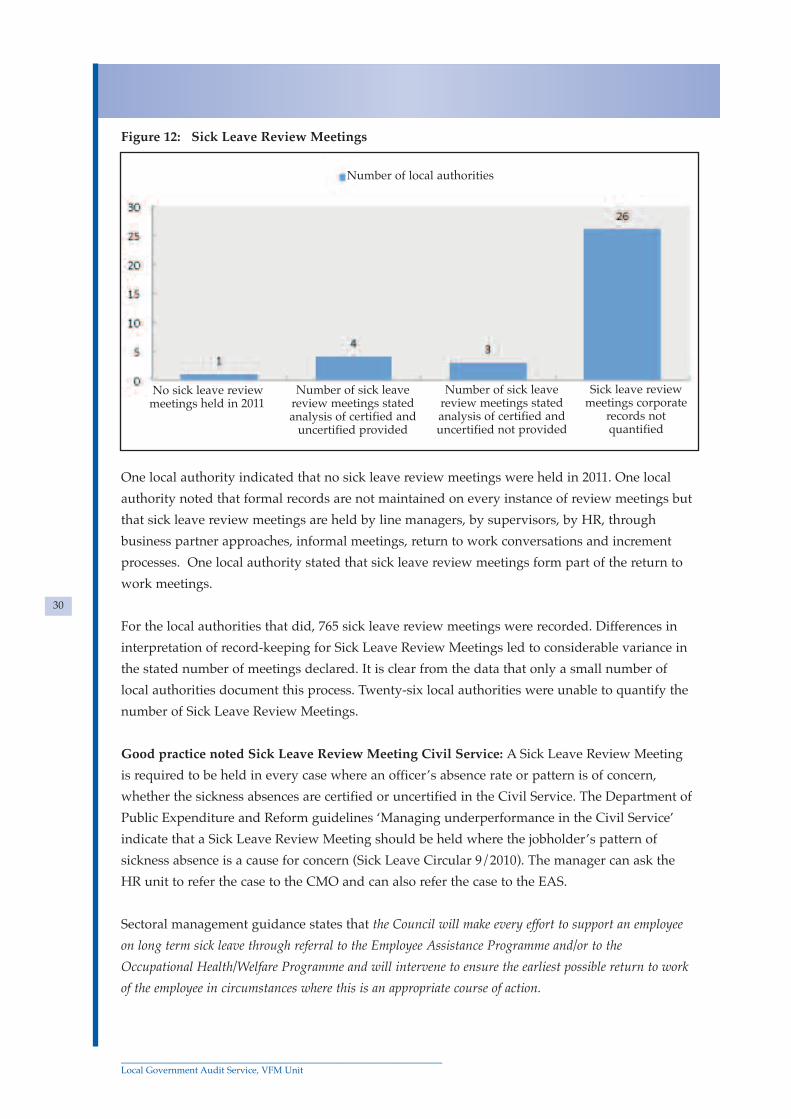
Figure 12: Sick Leave Review Meetings
One local authority indicated that no sick leave review meetings were held in 2011. One local
authority noted that formal records are not maintained on every instance of review meetings but
that sick leave review meetings are held by line managers, by supervisors, by HR, through
business partner approaches, informal meetings, return to work conversations and increment
processes. One local authority stated that sick leave review meetings form part of the return to
work meetings.
For the local authorities that did, 765 sick leave review meetings were recorded. Differences in
interpretation of record-keeping for Sick Leave Review Meetings led to considerable variance in
the stated number of meetings declared. It is clear from the data that only a small number of
local authorities document this process. Twenty-six local authorities were unable to quantify the
number of Sick Leave Review Meetings.
Good practice noted Sick Leave Review Meeting Civil Service: A Sick Leave Review Meeting
is required to be held in every case where an officer’s absence rate or pattern is of concern,
whether the sickness absences are certified or uncertified in the Civil Service. The Department of
Public Expenditure and Reform guidelines ‘Managing underperformance in the Civil Service’
indicate that a Sick Leave Review Meeting should be held where the jobholder’s pattern of
sickness absence is a cause for concern (Sick Leave Circular 9/2010). The manager can ask the
HR unit to refer the case to the CMO and can also refer the case to the EAS.
Sectoral management guidance states that the Council will make every effort to support an employee
on long term sick leave through referral to the Employee Assistance Programme and/or to the
Occupational Health/Welfare Programme and will intervene to ensure the earliest possible return to work
of the employee in circumstances where this is an appropriate course of action.
_____________________________________________________________________Local Government Audit Service, VFM Unit
30
Number of local authorities
No sick leave review Number of sick leave Number of sick leave Sick leave reviewmeetings held in 2011 review meetings stated review meetings stated meetings corporate
analysis of certified and analysis of certified and records not uncertified provided uncertified not provided quantified

Occupational Health Services
All employees of local authorities had access to independently referred doctors and to
vaccinations as required for work through Occupational Health Services.
Figure 13: Occupational Health Services
All local authorities made referral to an independent medical practitioner nominated by Human
Resources. As part of shared services review, the sector was of the view that it would be useful
to utilise a common provider or a panel of providers who meet with pre-determined criteria
whereby services could be provided on a national and/or regional basis to ensure consistency of
practice throughout the sector in relation to critical illness. A scoping exercise to ascertain
whether or not this would be a viable option for the sector is currently being progressed by the
sector. The lead local authority advised that there is currently no common practice for
occupational health referrals in the local government sector. Engagement with independent
medical referees throughout the sector is on an individual basis. The types of referrals that
occur include: General Practitioners (with no occupational health specialisation); General
Practitioners (with occupational health specialisation); Health centres; Insurance companies e.g.
Aviva, VHI, and specialist occupational Health providers.
Good Practice noted: A local authority supports employees through a voluntary programme of
health screening undertaken every two years when funding is secured through the workplace
partnership. The costs to the individual were subsidised by a partnership funded grant.
Another local authority who offered subsidised health screening stated that half of the local
authority employees availed of the screening. One local authority stated that it proposes to liaise
with two neighboring councils to seek tenders collectively and share the service to achieve best
value for money. Where employees of local authorities do not have access to the full range of
_____________________________________________________________________Local Government Audit Service, VFM Unit
31
Access to the Service
Independently referred doctor Subsidised Health Screening Vaccinations as required for work

Occupational Health Services, the local authorities should ensure provision of this service
through collaborative procurement ensuring access for all to range of services provided and
support for an employee on long term sick leave, through referral Occupational Health Services.
Employee Assistance Service
In 2011, not all employees of local authorities had access to the full range of services of an
Employee Assistance Service (EAS).
Departmental Circular 35/97 Employee Assistance Service states that the EAS and Staff Welfare
role are different noting that a Welfare Service primarily reacts to problems. An EAS plays a
proactive role, in addition to the more traditional reactive role.
Figure 14: Employee Assistance Programme and Staff Welfare Officer
Sectoral ‘Attendance Management Policy Good Practice Recommendations’ issued in 2006 states
that implementing an Employee Assistance Programme is a positive step towards ensuring that an
adequate range of services is provided to employees. The LGMA has stated that an Employee
Assistance Programme is an essential qualitative service that is addressed on an individual basis by
local authorities and reflects local circumstances.
Good Practice noted: Two local authorities tendered on a shared service basis for the provision
of an Employee Assistance Programme and achieved efficiency savings of approximately 50%
for provision of the service.
Good Practice noted: One local authority in addition to outsourcing their Employee Assistance
Service, support employees when funding is secured either through the workplace partnership,
health and safety or other funding source.
_____________________________________________________________________Local Government Audit Service, VFM Unit
32
Employee Assistance Programme
Employees have access Employees do not have access
Staff Welfare Officer

Shared Services Employee Assistance Service: The sector is advancing regionalised
procurement and rationalising the number of service providers for an EAS. This involves a
shared approach to procuring the EAS service using the procurement regions model and
leveraging from the associated economies of scale whilst aspiring to a common and consistent
outsourced service model. Regionalised procurement has commenced involving twenty three
interested authorities based on the Regional Procurement Structures. A pilot has commenced in
the Connaught-Ulster Region and following the pilot, regionalised procurement will commence
in the Munster-South Leinster and North Leinster procurement regions. The benefit of a shared
service, in addition to cost efficiencies, is consistency of service offered to all local authority
employees.
Intervention Measures to Promote Attendance and Well-Being
Promoting Well-Being
Attendance management policy, good practice recommendations states that clear and consistently
applied procedures play an important part in managing attendance. It notes that these mechanisms do
not easily address some of the underlying causes of sickness absence and that in some of these areas
prevention is better than cure. It states that analysis of the causes of absence will provide important
information in this regard and that effective strategies in this regard include health promotion activities.
The findings on causes of long-term, short-term, occupational and work related stress sickness
absence provide important information to aid introduction of suitable prevention measures and
pre-emptive action to promote well-being and reduce stress. Sectoral management guidance
states that preventative approaches to attendance at work have the primary role in improving health and
attendance at work. Local authorities provided a range of initiatives for staff to promote
attendance and well-being in addition to provision of OHS and EAS as identified below.
Figure 15: Intervention measures to Promote Attendance and Well-Being
_____________________________________________________________________Local Government Audit Service, VFM Unit
33
Number of local authorities providing the initiative
Health Stress Long term sick Employee Confidential OccupationalPromotion management leave early Assistance Counselling Health Services
Officer training intervention Programme and Support

Other Well-Being initiatives provided included, team development days, healthy option in the
canteen, healthy backs programme, regular health fairs and staff support service. All local
authorities offered the ‘Cycle to Work’ Scheme to staff.
Promoting employees’ well-being is essential to effective management of sickness absence and
to maintain levels of service. In that regard it is important that initiatives provided to promote
attendance and well-being are evaluated by the providers.
Sectoral Good Practice Guidelines 2006 state that annual review should include a review (by
survey) of local authority referral practices (e.g. a review of the effectiveness of General Practitioners,
Occupational Health specialists, counselling services etc. and review of implementation of the policy by
line managers and supervisors). One local authority who outsources the EAS receives an annual
report containing statistical information in respect of all new clients availing of the service to
evaluate the effectiveness of the service.
Well-Being Initiative Good Practice noted: One local authority is piloting a staff survey to
evaluate the effectiveness of different well-being initiatives provided. The Council provides a
staff support service. Staff views were sought on the operations of the service a number of years
ago as part of the review and evaluation process of initiatives provided. The Council piloted a
stress survey in a number of sections as part of their ‘Work Positive’ programme. The survey
findings were used to examine mechanisms and courses to manage work related stress.
The Role of the Line Manager
Clarity on Line Manager Responsibility
Ultimately it is the line managers/supervisors who are responsible for managing sickness
absence of their staff. Line managers should make employees aware of their obligations to render
regular and efficient service as part of their induction. In this regard, the significant role line
managers play monitoring and implementing sickness absence policy cannot be overstated. Use
of sectoral guidelines and clear definition of the role of the Line Manager in relation to HR is
essential in that regard.
The line manager guidance states that the line manager is responsible for maintaining a high level of
attendance in the workplace and for dealing with any shortfalls in a fair and consistent manner. It noted
that while the HR Department provides advice and support, it is ultimately the line managers’
responsibility to monitor and manage sickness absence amongst his/her staff. Line managers
should ensure that all sickness absence is recorded in line with sectoral and where appropriate,
local policy, strategy and guidance.
_____________________________________________________________________Local Government Audit Service, VFM Unit
34

Figure 16: Line Manager Responsibility for implementing HR Strategy on sickness absence
Line Manager Access to Sickness Absence Information
Sectoral management guidance states that all local authorities should seek to achieve improvement in
the percentage of days lost to sickness absence from year to year states that in this regard, the
information gleaned from individual employee performance in this area together with team performance,
programme area performance and upwards to organisational performance should indicate areas that
require pro-active initiatives in order to reduce the overall absence rate.
Sectoral management guidance notes that as of November 2011, work is underway at national level to
develop a suite of reports available on the CORE HR System currently being implemented in local
authorities. The guidance notes that further direction, advice and support in terms of standard
reporting will issue from the LGMA in due course. Effective monitoring and implementing sickness
absence policy requires access to sickness absence reports and information. Most local
authorities provide this access although not in the form of regular reports on sickness absence.
Figure 17: Line Managers issued with Sickness Absence Reports on a regular basis
_____________________________________________________________________Local Government Audit Service, VFM Unit
35
Number of local authorities where local agreement was reached and documented on the role of the linemanager in relation to HR
Strategy Adopted Strategy Adopted Strategy adopted Strategy prepared Strategy prepared
Local Agreement Local Agreement Not 2012 to adopt at time of to adopt at time
Documented Reached merger Local of merger LocalAgreement Documented Agreement not
Reached
Number of local authorities
Reports Issued Reports are not issued Online function beingintroduced. Dealt with on a
case by case basis

The local authorities who do not issue regular reports to line managers were asked if this
information was accessible by line managers on the current HR systems. Sickness absence
information was accessible by line managers on their current HR system in all but three local
authorities. One of the three local authorities indicated that reports will be available on
completion of CORE time/leave module.
Figure 18: Line Managers and sickness absence information
Implication: The line manager role in management of sickness absence through monitoring and
implementing sickness absence policy is hindered without access to sickness absence reports or
information.
Performance Indicator for accessibility of sickness absence information by Line Managers:
Reports to be issued or sickness absence information to be accessible by all line managers in
every local authority.
Line Manager Sickness Absence and Performance Management Development System
(PMDS)
Sectoral management guidelines state that it has been nationally agreed since 2006 that performance
issues in relation to attendance may be addressed through PMDS. Integrating attendance
management into corporate goals and objectives will assist in embedding a culture of maximum
attendance within a local authority. PMDS is a very effective tool for managing individual
performance including management of sickness absence. PMDS can be used to ensure that staff
are aware of the latest best practice.
Acknowledging good attendance: Sectoral guidance for line managers states that the line
manager should acknowledge good attendance records through PMDS evaluation in the PMDS review
stage. Sectoral guidance for line managers states that it is recognised that from time to time events
occur in the lives of employees that render it impossible to attain a 100% attendance record. Sectoral
_____________________________________________________________________Local Government Audit Service, VFM Unit
36
Number of local authorities
Regular reports are Dealt with on a Reports are available Reports are not Reports are notissued to line case by case basis. to line managers issued but issued and
managers Online function through CORE at any information is information is notbeing introdued stage accessible by line accessible by line
managers managers
guidance to management also states that, it is important also to recognise that an individual who
usually has an excellent record may have been unfortunate to suffer a particular illness or injury in a
particular reporting period resulting in a defined period of absence and should not be judged badly as a
result. The guidance states that the most effective method of identifying such absence-type is through
the Bradford Score system.
Identifying the number of spells of sickness absence helps identify sickness absence problems
and can be used to target interventions for long-term sickness absence. The number of staff with
no recorded sickness absence can be identified through recording details of staff with
acknowledged good attendance records under PMDS. Identifying the number of staff who did
not have any sickness absence in a given year is an important statistic to help assess the
effectiveness of intervention measures to promote attendance and well-being where the
measures have been used by staff recording no sickness absence, but is also an important staff
motivator.
Managing underperformance: LGMA Policy states that the Council’s Sick Pay Scheme is for the
benefit of all employees and that the Council has set an absence level which, when reached, requires line
managers / supervisors to institute an informal review of attendance records. It states that once this level
has been reached the line manager / supervisors will then speak with the employee concerned. The
purpose of the exercise is to discuss fully the absence, ascertain the causes and determine the appropriate
action depending on the circumstances of the case e.g. counselling, referral to the authority’s
doctor/independent medical advisor, set review period, apply change in job etc. Where required, the
employee will be informed that an improvement in his/her absenteeism rate is expected and a review date
will be specified. This conversation will be followed up in writing with potential consequences of
continued poor attendance outlined clearly to the employee. Time limits and review periods will be clearly
explained so that the opportunity for improvement is given. Review periods will vary on an individual
basis but will usually be in the region of 3 months. If there is no underlying medical cause for absences
and there has been no significant improvement in the level of attendance, a full review of all the relevant
facts will be carried out.
The Department of Public Expenditure and Reform has guidelines for management of
underperformance in the Civil Service35 and note in the context of sickness absence, that “some
jobholders may have a combination of certified and uncertified sick leave or just high levels of
uncertified sick leave”. The guidelines note that “good practice requires monitoring of
uncertified sickness absence by managers and HR Units”. “Situations where jobholders
regularly take uncertified sickness absence when their annual leave allocation has been
exhausted may also need to be addressed. Similarly, jobholders who regularly have uncertified
sickness absence on a Monday and/or Friday may have issues that need to be addressed”.
Sectoral Attendance Management Policy and Procedures issued in 2006 states that if there is no
underlying medical cause for absences and there has been no significant improvement in the level of
_____________________________________________________________________Local Government Audit Service, VFM Unit
37
35 Department of Public Expenditure and Reform ‘Guidelines for Managing underperformance in the
Civil Service’ May 2011.

attendance, a full review of all the relevant facts will be carried out. The Department of Public
Expenditure and Reform guidelines ‘Managing underperformance in the Civil Service’ include
the following provision that, where a staff member has 56 or more days of sick leave in any 4
year period (certified and/or uncertified) that has not been discounted (one off or non-recurring
illnesses are not taken into account when calculating the number of days lost to sickness absence
by an officer) they are not allowed to apply for promotion. Local authorities could consider
including this as part of their guidelines.
Under the Public Service Agreement agreed with the representative trade unions, the sector is
committed to modifying the PMDS process in line with the recommendations of the National
(Local Authority) PMDS Review, implementing the Local Authority Competency Framework
and linking PMDS to other HR policies. Significant work is on-going in relation to this and local
authorities are working towards implementing the revised model.
Training provided for line managers
Training provided for line managers and for all staff is a particularly good method of formal
communication as is the commitment to on-going training for all staff levels. Thirteen local
authorities indicated that formal training had been given as part of the communication process.
Training provided included: Information sessions for line managers; Specific training provided
to line managers; IPA Line Manager Training Programme on an on-going basis; Training days;
Staff meetings; Workshops, FETAC Supervisory Training; IPA Supervisory Training Programme
on HR Responsibilities for Department Heads and Line Managers. The LGMA has stated that
training for line managers in the initial model of PMDS, which provided some training in staff
management as well as PMDS, would have been completed.
Good Practice Noted: A local authority undertook a comprehensive training and information
programme when it introduced new attendance management guidelines and procedures. Line
managers and staff were copied with the documents and a summary covering letter. This
followed a training programme where line managers and staff across the Council were briefed
on the guidelines and procedures. Line managers also participated in a supervisory training
course at FETAC level. This covered many areas of supervisory management but one module
focussed on their specific requirements as line managers in a Council.
Training Course Delivering Key HR Practices through Senior Management the Line Manager
role:
In the Civil Service it is mandatory for all staff to attend training in delivery of key HR practices.
This includes specific training on the line manager role including HR responsibilities. HR
training for Line Managers includes PMDS, attendance management and sick leave.
Performance Indicator for Line Manager Training: Line managers and staff of local authorities
to be provided with training in sickness absence policy, strategy and procedure in all local
authorities.
_____________________________________________________________________Local Government Audit Service, VFM Unit
38

Sickness absence is a significant cost to local authorities in terms of work days lost and related
costs. Managing the cost of sickness absence is part of the corporate governance agenda. LGMA
policy in 2006 noted that persistent absence can have a significant adverse impact on financial
resources, on staffing resources, on service delivery and employee morale. The estimated cost of
absence is calculated using assumptions set out in Appendix 4. Local authority interpretation of
sectoral guidance on costs calculation resulted in significantly differing average daily costs for
individual local authorities. Costs were re-calculated using one average daily rate of €221.88
based on the average daily rate of three local authorities calculated using 2011 payroll data.
Town Council data for days and payroll costs was included where applicable. The support for
this calculation is set out in Appendix 4 Part C. Total days sickness absence in local authorities
cost approximately €64.64m in 2011. Direct payroll costs have been used to calculate the
efficiency and productivity savings.
Local authorities report on sickness absence through National Service Indicators. Reporting of
national indicator data is currently confined to the percentage of working days lost to sickness
absences for both certified and self-certified sick leave. There is opportunity to build on this to
incorporate targets, costs, efficiency savings and other matters as part of local and national
reporting. This is in line with recommendations in the Report of the Local Government Efficiency
Review Group which notes that Service Indicators are a guide to differences in efficiency and
effectiveness between local authorities at a given point in time. While they do not cover all aspects of local
authority performance they are a starting point indicating where further questions can be raised and a
signal to how resources might be better allocated. They are an indication of best practice and a potential
management tool. The report then states that Service Indicators would be improved through the
substitution of a number of the existing indicators with additional key financial indicators that would be
reported on and monitored each year.
3. Estimated Cost of Sickness Absence
_____________________________________________________________________Local Government Audit Service, VFM Unit
39

Targets and Efficiency Savings
Sectoral target for reduction in sickness absence
There is a sector target of 4.4% by the end of 2012 and a longer term target of 3.5% for reduction
in sickness absence in local authorities.
Figure 19: Sectoral Target for reduction in sickness absence set at 31 December 2011
Estimated Efficiency Savings
Calculating estimated costs and comparing with performance against the agreed sector target
allows calculation of estimated efficiency saving. Estimated efficiency savings of approximately
€21.10m were identified for the sector. There is a sector target of 4.4% to be achieved by the end
of 2012 and a longer term target of 3.5% for reduction in sickness absence. Achieving the sectoral
target of 4.4% for reduction in sickness absence by 2012 would result in approximate payroll
savings of €10.13m for the sector. Achieving the long-term sectoral target of 3.5% for reduction
in sickness absence would result in further estimated payroll efficiency savings of approximately
€10.97m for the sector. The data supporting these calculations are set out in Appendix 4 Report
Assumptions and Calculations.
Adopting the sectoral target for reduction in sickness absence by 2012
The LGMA ‘Attendance Management, Management Guideline Document’ states the average rate
of sickness absence for the sector for the years 2004–2010 is 4.75% which equates to 10.78 days per
employee and that this data has enabled the Attendance Management Committee to determine a suitable
benchmark for the sector. The Committee recommended that local authorities seek to reduce
absenteeism to 4.4%, or under 10 days per employee by 2012 noting that this would represent a
reduction of 7.5%. The Committee stated that it is further envisaged that a sectoral average of 3.5%
should be the longer-term target; that this target of 4.4% may have already been met or be achievable for
some local authorities in the shorter term, however, all local authorities should seek to achieve
improvement in attendance from year to year. Achievement of this target was not reported on locally
in many local authorities.
_____________________________________________________________________Local Government Audit Service, VFM Unit
40
Number of local authorities with a target to reduce sickness absence
Specific Target Set Target to reduce sickness No Target Setabsence from the local authorityprevious year average rate set

Figure 20: Sectoral Target for reduction in sickness absence at 31 December 2011
In four instances the local authorities stated that reduction in sickness absence was an objective
but no target figure was quantified. Where quantified, the target for reduction of sickness
absence ranged from the sectoral target to 5.5%. Identification of a corporate target and
individual business unit targets aids management of sickness absence. The sector target for
reduction in sickness absence should be applied by all.
Implication: Achievement of the identified €21.10m estimated efficiency savings for the local
authorities is not possible without setting the sectoral target and measuring achievement of
targets.
Good Practice Noted: One local authority stated that it includes the national sector target and
longer term target as specific targets in the Human Resources Team Development Plan.
Performance Indicator for Sector Target: Adoption of sectoral target by all local authorities.
Setting a target for reduction in sickness absence by 31 December 2012
The sectoral management guideline also states that the information gleaned from individual
employee performance in this area together with team performance, programme area performance and
upwards to organisational performance should indicate areas that require pro-active initiatives in order to
reduce the overall absence rate.
Seventeen local authorities still had not set the sectoral target or the longer-term national
target to reduce sickness absence by 31 December 2012. No local authority set individual
departmental targets for reduction in sickness absence.
_____________________________________________________________________Local Government Audit Service, VFM Unit
41
Number of local authorities with a target to reduce sickness absence
Sectoral Target of 4.4% Specific target between Target to reduce No target setor 3.5% set 4.5% and 5.5% set sickness absence from
the local authorityprevious year average
rate set

Figure 21: Sectoral Target for reduction in sickness absence at 31 December 2012
A sector average of 3.5% is set as the longer-term target. All local authorities were requested to
seek to achieve improvement in sickness absence from year to year. The sickness absence target
set should be the sector longer-term target or if appropriate a more challenging target.
Figure 22: Setting and Documenting Sickness Absence Sectoral Target at 31 December 2012
The report of the Independent Assessment Panel (IAP) on Service Indicators in 2011 states that
“with some notable exceptions, the service indicators do not appear to be compiled or assessed
relative to objectives or targets set down in the periodic corporate or annual
_____________________________________________________________________Local Government Audit Service, VFM Unit
42
Number of local authorities with a target to reduce sickness absence
Sectoral Target of 4.4% Specific target between Target to reduce No Target Setor 3.5% set 4.5% and 5.5% set sickness absence from
the local authorityprevious year average
rate set
Sectoral Target of 4.4% Specific target Target to reduce sickness No Targetor 3.5% between 4.5% absence from the local
5.5% authority previous yearaverage rate
Number of local authorities with a target to reduce sickness absence set
Number of local authorities with a target to reduce sickness absence documented in abusiness plan

business/operational plans”36. The report also states that “the absence of targets against which
to assess the outturn means there is no indication of the extent to which improvements in
performance and outputs/outcomes are being pursued or achieved”37.
Figure 23: National Average and Sectoral longer-term target
The report of the IAP on Service Indicators in 2011 considers it essential to the thrust and
usefulness of Service Indicators that they be intrinsically linked to individual authority’s goals
and related objectives, that Service Indicators be firmly embedded in management systems and
used to monitor and improve performance and aid decision-making in relation to policy
outcomes, budgets and expenditure matters. Local authorities are urged to put in place the
necessary management processes to link more closely the service indicators with the setting and
achievement of efficiency targets and medium/long-term strategic goals38.
No time-frame has been set in sectoral guidance for achievement of the longer-term 3.5% target.
In this regard, an integrated approach towards working to achieve this target and agreeing a
deadline date involving local authorities, the Department of Social Protection and the
representative bodies in the medical practitioner area would be beneficial. Medical certificates
are accepted by the Department of Social Protection for processing of claims for Benefit for
employees on Class A PRSI.
Performance Indicator for Efficiency Savings in respect of performance against the agreed
sector target: Full reporting of performance progress towards achieving efficiency savings
nationally.
_____________________________________________________________________Local Government Audit Service, VFM Unit
43
Percentage of Working Days Lost to Sickness Absence
Setoral target for Longer-Term National Average Days Sickness AbsenceReduction in Days Sickness Absence in 2011
to 3.5%
36 LGMA ‘Service Indicators in Local Authorities 2011’ page 153. 37 LGMA ‘Service Indicators in Local Authorities 2011’ page 15338 LGMA ‘Service Indicators in Local Authorities 2011’ pages 153-154

Effectiveness Savings Productivity Gains
LGMA guidance states that there are a variety of costs associated with absence for local authorities
including productivity costs and poor quality service delivery.
Using annual lost productivity measures, the differential between the performance of an
authority if it had been the authority with the lowest recorded sickness absence and its current
performance allows for the calculation of potential productivity savings. Annual lost
productivity represents the cost of sickness absence had all councils met the minimum
absenteeism rate. Setting targets relative to the best performing local authority is a measure of
what a local authority is capable of achieving. This target is relative as it changes each year
based on the current set of results.
Average cost of sickness absence per Full Time Equivalent (FTE), Comparing sickness absence
payroll estimated costs with the number of FTEs who incurred sickness absence during the year
allows calculation of the average cost of sickness absence. The average cost of sickness absence
could not be calculated as the sector was unable to quantify the number of instances of sickness
absence per FTE.
Working Days Lost to Sickness AbsenceIn 2011, 353,176 working days were lost as a result of sickness absence. This is an average
sickness absenteeism rate of 11.78 days for each employee in 2011. The data supporting this
calculation is set out in Appendix 1 Table 2.
Figure 24: Working Days Lost to Sickness Absence sector targets average rate and nothern
ireland39
_____________________________________________________________________Local Government Audit Service, VFM Unit
44
Working Days National Target Longer Term Average rate of Northern
lost to sickness by 2012 in Days Sector Target in absenteeism for Ireland Councils
absence per Days the sector 2004- Days 2011
employee in 2010
2011
Working days lost to sickness absence per employee
39 The Exercise by local government auditors of their functions In the year to 31 March 2012 (2012)
Report by the Chief Local Government Auditor Northern Ireland Audit Office page 11 Northern
Ireland Council’s Days 2010-2011
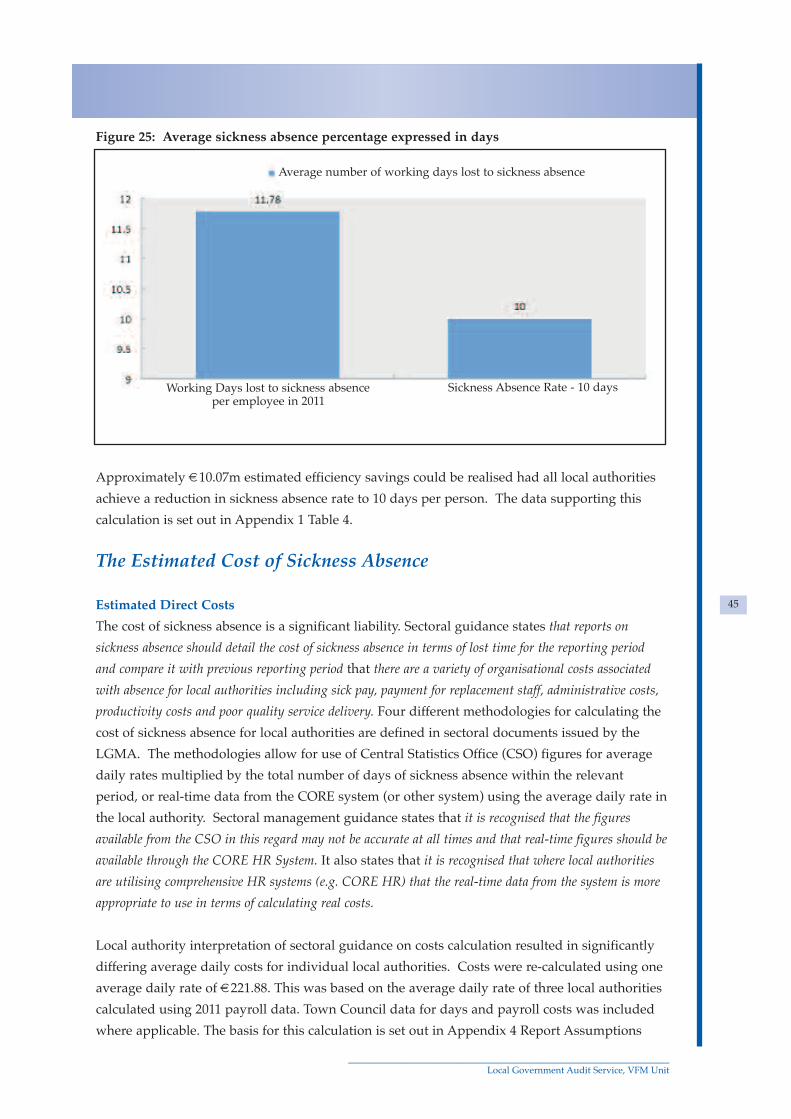
Figure 25: Average sickness absence percentage expressed in days
Approximately €10.07m estimated efficiency savings could be realised had all local authorities
achieve a reduction in sickness absence rate to 10 days per person. The data supporting this
calculation is set out in Appendix 1 Table 4.
The Estimated Cost of Sickness Absence
Estimated Direct Costs
The cost of sickness absence is a significant liability. Sectoral guidance states that reports on
sickness absence should detail the cost of sickness absence in terms of lost time for the reporting period
and compare it with previous reporting period that there are a variety of organisational costs associated
with absence for local authorities including sick pay, payment for replacement staff, administrative costs,
productivity costs and poor quality service delivery. Four different methodologies for calculating the
cost of sickness absence for local authorities are defined in sectoral documents issued by the
LGMA. The methodologies allow for use of Central Statistics Office (CSO) figures for average
daily rates multiplied by the total number of days of sickness absence within the relevant
period, or real-time data from the CORE system (or other system) using the average daily rate in
the local authority. Sectoral management guidance states that it is recognised that the figures
available from the CSO in this regard may not be accurate at all times and that real-time figures should be
available through the CORE HR System. It also states that it is recognised that where local authorities
are utilising comprehensive HR systems (e.g. CORE HR) that the real-time data from the system is more
appropriate to use in terms of calculating real costs.
Local authority interpretation of sectoral guidance on costs calculation resulted in significantly
differing average daily costs for individual local authorities. Costs were re-calculated using one
average daily rate of €221.88. This was based on the average daily rate of three local authorities
calculated using 2011 payroll data. Town Council data for days and payroll costs was included
where applicable. The basis for this calculation is set out in Appendix 4 Report Assumptions
_____________________________________________________________________Local Government Audit Service, VFM Unit
45
Working Days lost to sickness absence Sickness Absence Rate - 10 daysper employee in 2011
Average number of working days lost to sickness absence

and Calculations, C. The estimated cost of paid sickness absence is calculated as €64.64m being
the number of days of paid sickness absence multiplied by the average daily rate calculated
using direct accrued payroll cost excluding payroll expenditure allowances which would not be
invoked if out sick e.g. the ‘eating on site’ allowance and including social welfare recouped. The
table supporting this calculation is set out in Appendix 1 -Table 3.
Figure 26: Calculation of the Average Daily Rate
Average Daily Rate€
County Council Southern Region 212.08
County Council Dublin Local Authority 227.29
County Council Western Region 226.28
665.65Average Daily Rate to be used 221.88
Sickness absence where payment of Salary or Wage was reduced or discontinued
Working days lost are split into paid sickness absence and unpaid sickness absence. Sick leave
schemes also provide for reduced payment of salary or wage.
There is evidence from the survey of different practices in different local authorities regarding
whether payment of salary for indoor staff should be discontinued or not. One local authority
stated that payment of salary is not discontinued, that employees remain on pension rate of pay.
Fourteen local authorities indicated that they discontinued payment of salary. Discontinuance of
salary is based on Article 21 of S.I. 161/1493 - Local Government (Officers) Regulations 1943
which provides for 183 days at full pay in any 12 month period followed by a similar period at
half pay, subject to no more than 365 days paid sick leave whether at full or half pay in any 4
year period. Reforms to sick leave arrangements are proposed. Subject to the necessary
legislation being enacted, the proposal on certified sick leave and the other matters should take
effect from 1st January 201440.
In the sectoral Sick Pay Scheme payment of sick leave benefit is at the discretion of the Manager
and the scheme states that in certain circumstances, payment may be made at the pension rate
of pay which would translate to the amount of income that an individual would receive should
he/she retire on ill-health grounds
_____________________________________________________________________Local Government Audit Service, VFM Unit
46
40 “. http://per.gov.ie/2012/07/19/reformed-sick-leave-arrangements-in-public-service-will-result-in-
increased-productivity-reductions-in-absenteeism-and-a-significant-reduction-in-the-cost-of-sick-leave-
in-the-public-service/
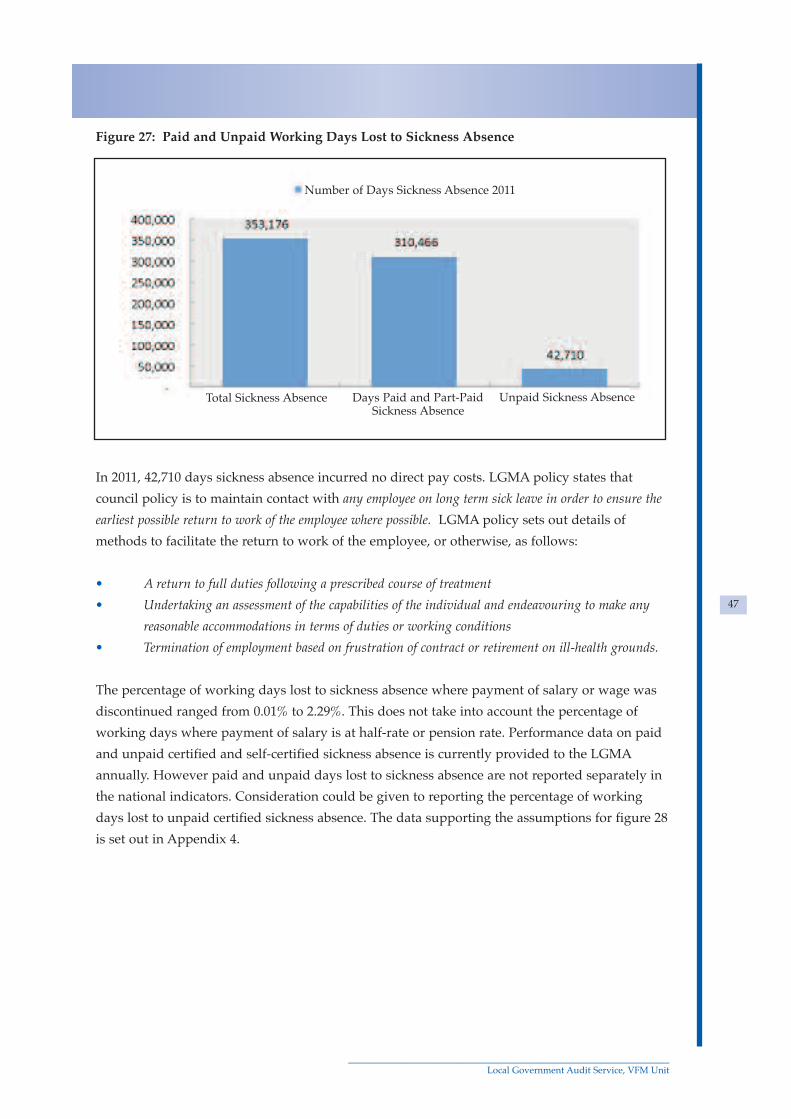
Figure 27: Paid and Unpaid Working Days Lost to Sickness Absence
In 2011, 42,710 days sickness absence incurred no direct pay costs. LGMA policy states that
council policy is to maintain contact with any employee on long term sick leave in order to ensure the
earliest possible return to work of the employee where possible. LGMA policy sets out details of
methods to facilitate the return to work of the employee, or otherwise, as follows:
• A return to full duties following a prescribed course of treatment
• Undertaking an assessment of the capabilities of the individual and endeavouring to make any
reasonable accommodations in terms of duties or working conditions
• Termination of employment based on frustration of contract or retirement on ill-health grounds.
The percentage of working days lost to sickness absence where payment of salary or wage was
discontinued ranged from 0.01% to 2.29%. This does not take into account the percentage of
working days where payment of salary is at half-rate or pension rate. Performance data on paid
and unpaid certified and self-certified sickness absence is currently provided to the LGMA
annually. However paid and unpaid days lost to sickness absence are not reported separately in
the national indicators. Consideration could be given to reporting the percentage of working
days lost to unpaid certified sickness absence. The data supporting the assumptions for figure 28
is set out in Appendix 4.
_____________________________________________________________________Local Government Audit Service, VFM Unit
47
Total Sickness Absence Days Paid and Part-Paid Unpaid Sickness AbsenceSickness Absence
Number of Days Sickness Absence 2011

Figure 28: Recommended New Metric
Social Welfare Estimated Costs and sickness absence
The sectoral sick pay scheme for clerical/ administrative, engineering, technical and related
grades, states that Individuals on Class A1 PRSI may be entitled to claim Disability Benefit from
the Department of Social Protection. Sick leave benefit will be paid at the employee’s normal
salary, less the full amount of Social Welfare Benefit. Absence of a documented policy in this
area could result of loss of funds payable to the local authority.
Costs of sickness absence are offset by social welfare income recoupable. In 2011, an estimated
€4.05m was due to be recouped by 32 local authorities who quantified details in the survey. Two
other local authorities stated that €205k was recouped in 2011. In total an estimated €4.25m was
recouped or recoupable in 2011. The offset of the income benefit paid by the social welfare
illness benefit payment has been taken into account in calculation of the estimated cost of
sickness absence.
Figure 29: Recoupment of Social Welfare
_____________________________________________________________________Local Government Audit Service, VFM Unit
48
*Basis of calculation:
Number of Days * 100
WTE*227 (days for the full year)
*Whole Time Equivalents
42,115 * 100 (Appendix 4 survey data)
29,971.9 * 227 (days for the full year)
Sickness Absence 2011 Survey Data
Total % of working days lost to certified sickness absence:
Paid Certified 03.81%
Unpaid Certified (*) 00.62%
Total Certified 04.43%
Self-Certified paid and unpaid 00.76%
05.19%
Social welfare due to be Social Welfare due to be Nothing due as council recouped quantified recouped not quantified but pays sick pay net of
figure for acutal recouped Social Welfare2011 quantified entitlement
Number of Local Authorities with social welfare due to be recouped in 2011

One local authority stated that they did not have a formally documented social welfare
recoupment policy in place, but that the recoupment of illness benefit from employees who
receive full pay while on sick leave is taking place. This local authority has stated that a
documented procedure for Social Welfare Recoupment is set out in the Local Authority's Draft
Time and Attendance Policy and Procedure which was implemented in mid-2013.
Implication: Non-application of the sectoral sick pay policy in this area could result in loss of
funds payable to the local authority.
Performance indicator for sectoral policy on social welfare costs: Full adoption of the national
social welfare recoupment policy and identification of all income due to the local authority.
Indirect Costs
Organisational costs associated with sickness absence for local authorities can include payment
for replacement staff, administrative costs and productivity costs. There are other unmeasured
indirect costs, which local authorities continue to pay in respect of these employees. Local
Authorities should calculate indirect costs of sickness absence annually. These could include:
• Internal replacement worker: Temporary Cover; Overtime; ‘Acting up’ allowance; Daily
employment costs
• HR department time: collating/reporting data; administration; line manager training;
trainer employment cost
• Health promotion: EAPs; subsidised facilities; OH services.
The LGMA has stated that quantifying the indirect cost of sickness absence will be examined by
the Attendance Management Group.
_____________________________________________________________________Local Government Audit Service, VFM Unit
49
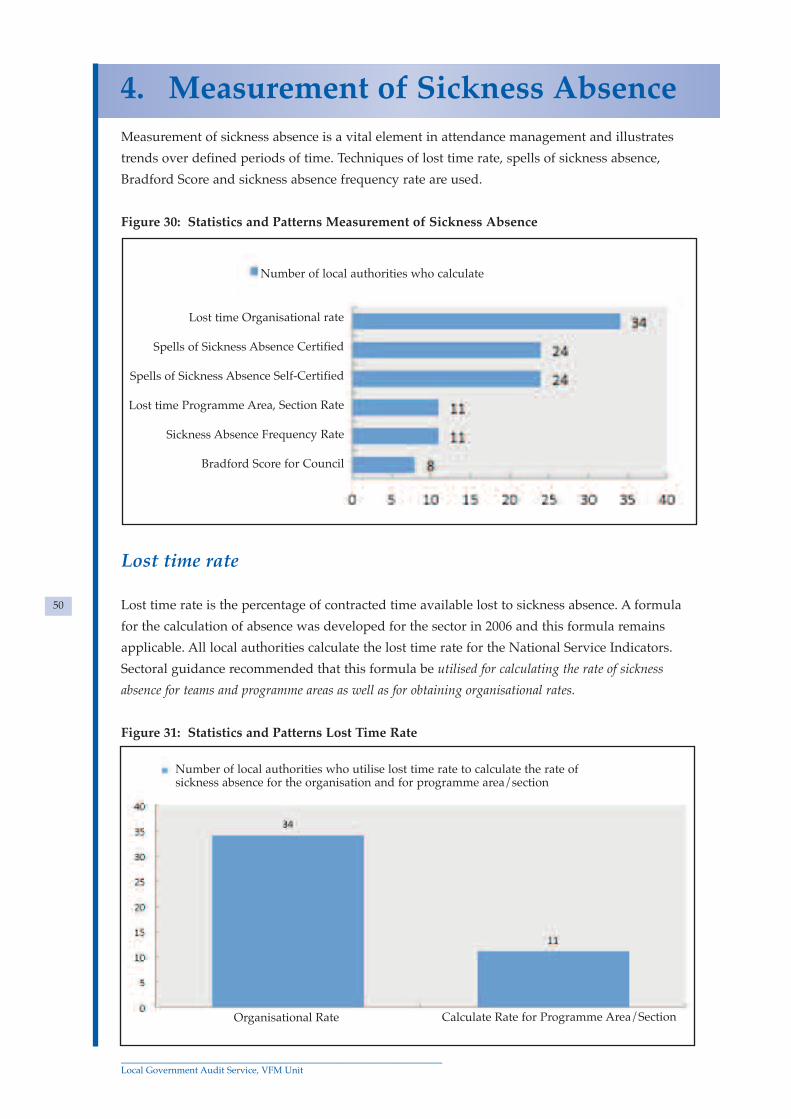
Measurement of sickness absence is a vital element in attendance management and illustrates
trends over defined periods of time. Techniques of lost time rate, spells of sickness absence,
Bradford Score and sickness absence frequency rate are used.
Figure 30: Statistics and Patterns Measurement of Sickness Absence
Lost time rate
Lost time rate is the percentage of contracted time available lost to sickness absence. A formula
for the calculation of absence was developed for the sector in 2006 and this formula remains
applicable. All local authorities calculate the lost time rate for the National Service Indicators.
Sectoral guidance recommended that this formula be utilised for calculating the rate of sickness
absence for teams and programme areas as well as for obtaining organisational rates.
Figure 31: Statistics and Patterns Lost Time Rate
4. Measurement of Sickness Absence
_____________________________________________________________________Local Government Audit Service, VFM Unit
50
Lost time Organisational rate
Spells of Sickness Absence Certified
Spells of Sickness Absence Self-Certified
Lost time Programme Area, Section Rate
Sickness Absence Frequency Rate
Bradford Score for Council
Number of local authorities who calculate
Organisational Rate Calculate Rate for Programme Area/Section
Number of local authorities who utilise lost time rate to calculate the rate ofsickness absence for the organisation and for programme area/section
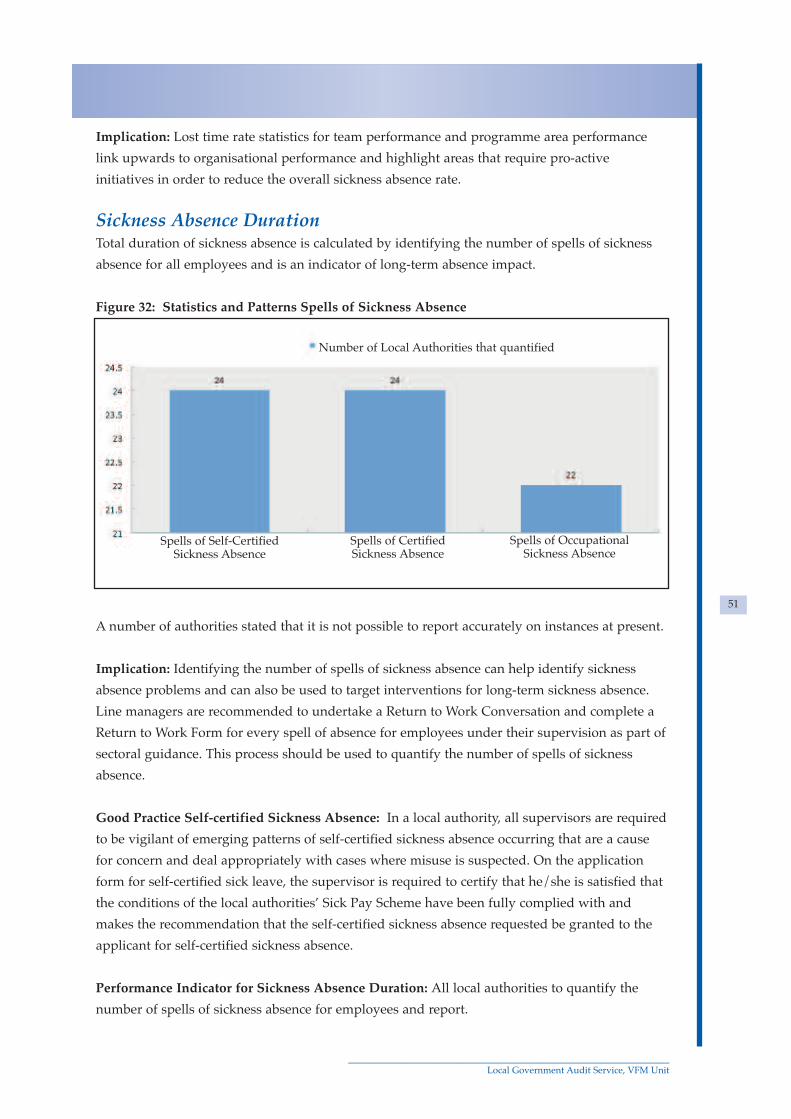
Implication: Lost time rate statistics for team performance and programme area performance
link upwards to organisational performance and highlight areas that require pro-active
initiatives in order to reduce the overall sickness absence rate.
Sickness Absence Duration Total duration of sickness absence is calculated by identifying the number of spells of sickness
absence for all employees and is an indicator of long-term absence impact.
Figure 32: Statistics and Patterns Spells of Sickness Absence
A number of authorities stated that it is not possible to report accurately on instances at present.
Implication: Identifying the number of spells of sickness absence can help identify sickness
absence problems and can also be used to target interventions for long-term sickness absence.
Line managers are recommended to undertake a Return to Work Conversation and complete a
Return to Work Form for every spell of absence for employees under their supervision as part of
sectoral guidance. This process should be used to quantify the number of spells of sickness
absence.
Good Practice Self-certified Sickness Absence: In a local authority, all supervisors are required
to be vigilant of emerging patterns of self-certified sickness absence occurring that are a cause
for concern and deal appropriately with cases where misuse is suspected. On the application
form for self-certified sick leave, the supervisor is required to certify that he/she is satisfied that
the conditions of the local authorities’ Sick Pay Scheme have been fully complied with and
makes the recommendation that the self-certified sickness absence requested be granted to the
applicant for self-certified sickness absence.
Performance Indicator for Sickness Absence Duration: All local authorities to quantify the
number of spells of sickness absence for employees and report.
_____________________________________________________________________Local Government Audit Service, VFM Unit
51
Spells of Self-Certified Spells of Certified Spells of OccupationalSickness Absence Sickness Absence Sickness Absence
Number of Local Authorities that quantified
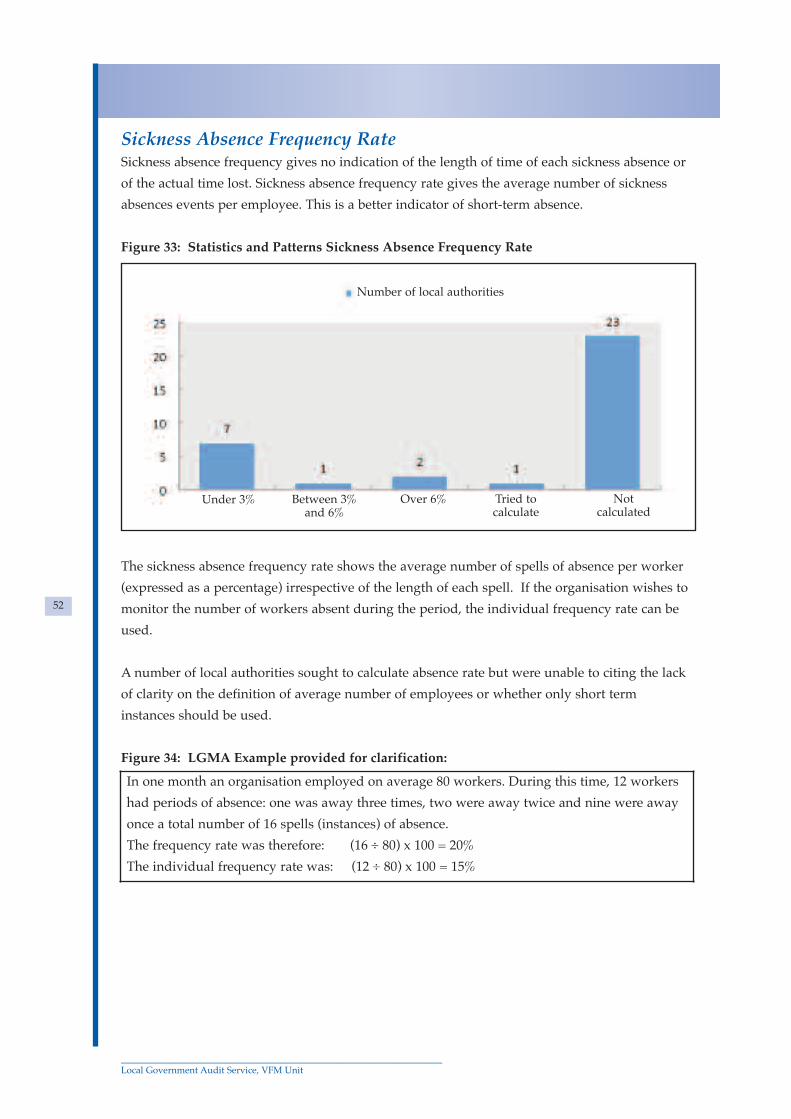
Sickness Absence Frequency RateSickness absence frequency gives no indication of the length of time of each sickness absence or
of the actual time lost. Sickness absence frequency rate gives the average number of sickness
absences events per employee. This is a better indicator of short-term absence.
Figure 33: Statistics and Patterns Sickness Absence Frequency Rate
The sickness absence frequency rate shows the average number of spells of absence per worker
(expressed as a percentage) irrespective of the length of each spell. If the organisation wishes to
monitor the number of workers absent during the period, the individual frequency rate can be
used.
A number of local authorities sought to calculate absence rate but were unable to citing the lack
of clarity on the definition of average number of employees or whether only short term
instances should be used.
Figure 34: LGMA Example provided for clarification:
_____________________________________________________________________Local Government Audit Service, VFM Unit
52
Under 3% Between 3% Over 6% Tried to Notand 6% calculate calculated
Number of local authorities
In one month an organisation employed on average 80 workers. During this time, 12 workers
had periods of absence: one was away three times, two were away twice and nine were away
once a total number of 16 spells (instances) of absence.
The frequency rate was therefore: (16 ÷ 80) x 100 = 20%
The individual frequency rate was: (12 ÷ 80) x 100 = 15%

Irregularity of Attendance
Sectoral management guidance issued by the LGMA states that The Bradford Factor measures an
irregularity of attendance of employees by combining measures of absence frequency and duration.
Bradford scores indicate whether the composition of an individual’s sickness absence record comprises a
few, or many, spells of short or long duration. The scores can be used to monitor trends in absence, to
provide trigger points and for comparison with absence rates.
Short, frequent and unplanned absences are more disruptive than longer absences. The system was
developed by the Bradford University School of Management as a way of highlighting the
disproportionate level of disruption on an organisation's performance which can be caused by short-term
absence compared to single incidences of prolonged absence. It was originally designed for use as part of
the overall investigation and management of absenteeism. In contrast, if used as part of a very limited
approach to address absence or by setting unrealistically low trigger scores, there are limitations to its
usage. It is recommended that Bradford scores be utilised as part of the local authority’s Attendance
Management Plan.
The Bradford Factor is calculated as follows:B = S2 x D where:
• B is the Bradford Factor score
• S is the total number of spells (instances) of absence of an individual over a set period
• D is the total number of days of absence of that individual over the same set period
The ‘set period' is typically set as a rolling 52 week period.
For example:
• 1 instance of absence with a duration of ten days (1 x 1 x 10) = 10 points
• 3 instances of absence; one of one, one of three and one of six days (3 x 3 x 10) = 90 points
• 5 instances of absence; each of two days (5 x 5 x 10) = 250 points
• 10 instances of absence; each of one day (10 x 10 x 10) = 1000 points
A high absence rate and a low Bradford Score clearly indicate that absence is due to a small number of
employees with long absences. In contrast, a low absence rate with a high Bradford Score show that there
is a small number of employees with frequent short absences.
Sectoral management guidance issued by the LGMA in the section on ‘Outline of Annual Report
to Senior Management Team’ states that statistics should provide the senior management team with
information on the level of absence (number of days lost) through both certified and uncertified sick leave
for example by organisation, programme area, department, section/unit. It states that the incidence of
frequent intermittent absence should be included in all statistical reporting. Such absence can be
calculated through the use of Bradford Scores.
_____________________________________________________________________Local Government Audit Service, VFM Unit
53

Figure 35: Statistics and Patterns Bradford Score
Implication: The Bradford Score is used to monitor trends in sickness absence and can be used
as a measure of ‘trigger points’ for intervention. Sectoral guidance states that a high absence rate
and a low Bradford Score indicate that sickness absence is due to a small number of employees
with long absences and that a low absence rate with a high Bradford Score shows that there are
a small number of employees with frequent short absences.
Sectoral guidance recommends that Bradford scores be utilised as part of the local authority’s
Attendance Management Plan. It was noted by those that calculated the Bradford Score that the
measurement was primarily used at individual level for comparative purposes.
_____________________________________________________________________Local Government Audit Service, VFM Unit
54
Local authorities who calculated the council Bradford Score
Local authorities who stated it can be calculated individually
Local authorities who do not calculate the Bradford Score

Sickness Absence
Sectoral policy issued in 2006 states that measurement of attendance patterns allows local authorities
to monitor the implications of non-attendance at work. The policy also states that the ability to measure
absence rates across the authority, across particular departments and for individuals means that local
authorities can identify whether or not attendance patterns are causing problems, and states that
recording of absences allows management to track and monitor rates and patterns of absence to facilitate
identification of problematic issues. Sectoral management guidelines note that statistics should
provide the senior management team with information on the level of absence (number of days
lost) through both certified and self-certified sickness absence including by organisation, by
programme area, by department and by section/unit. The incidence of frequent intermittent
absence should be included in all statistical reporting. Such absence can be calculated through
the use of Bradford Scores.
Days lost to certified and self-certified sickness absenceThe total days lost due to certified and self-certified sickness absence was 353,176 for all local
authorities. 301,108 days (85.2%) of sickness absence in 2011 was certified by a doctor or medical
practitioner.
Figure 36: Days lost to certified and self-certified sickness absence in 2011
Good Practice noted: In one local authority sickness absence reports identify sickness absence
by unit/programme area, stating type of sickness absence certified or self-certified, the cause of
illness, the date, the number of days, the number of spells of sickness absence in the year, the
senior manager, the employee category and whether it is paid or unpaid sickness absence.
Good Practice: In a local authority, the number of paid sickness absence days for certified and
self-certified and the number of unpaid days of sickness absence days for certified and self-
certified are clearly identified in monitoring reports.
5. Sickness Absence and Related Causes
_____________________________________________________________________Local Government Audit Service, VFM Unit
55
Certified Sickness Absence Self-Certified Sickness Absence
Number of working days
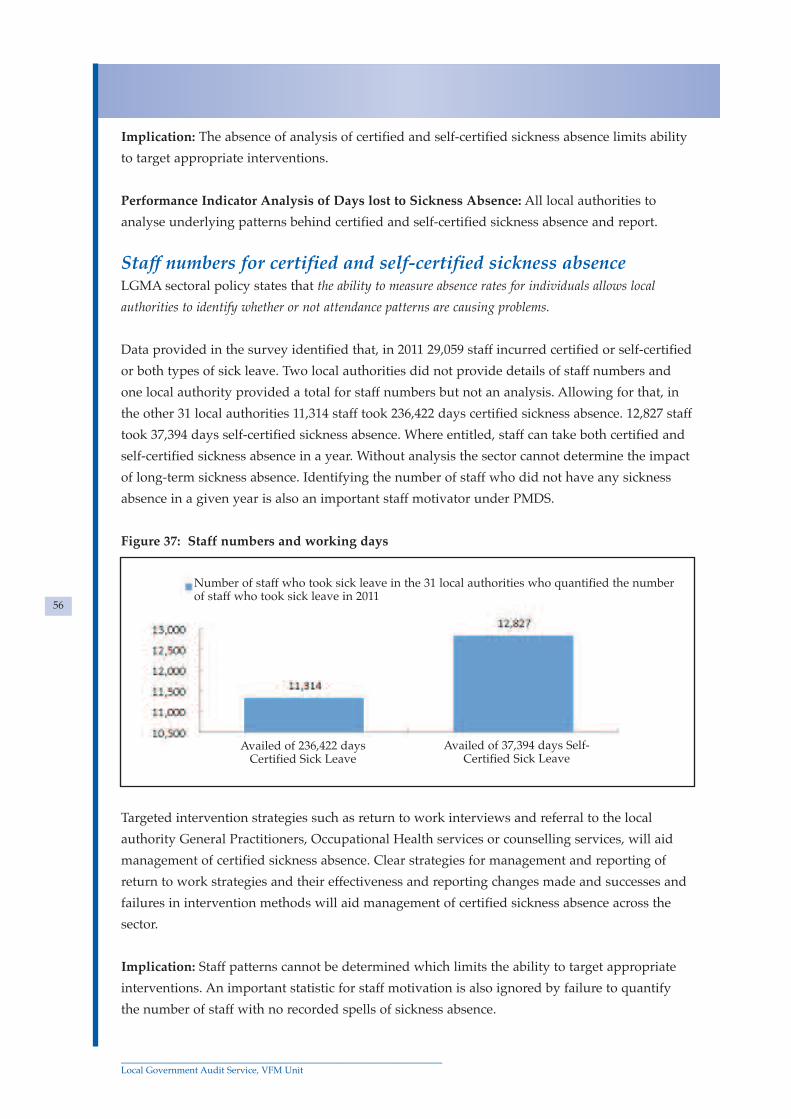
Implication: The absence of analysis of certified and self-certified sickness absence limits ability
to target appropriate interventions.
Performance Indicator Analysis of Days lost to Sickness Absence: All local authorities to
analyse underlying patterns behind certified and self-certified sickness absence and report.
Staff numbers for certified and self-certified sickness absenceLGMA sectoral policy states that the ability to measure absence rates for individuals allows local
authorities to identify whether or not attendance patterns are causing problems.
Data provided in the survey identified that, in 2011 29,059 staff incurred certified or self-certified
or both types of sick leave. Two local authorities did not provide details of staff numbers and
one local authority provided a total for staff numbers but not an analysis. Allowing for that, in
the other 31 local authorities 11,314 staff took 236,422 days certified sickness absence. 12,827 staff
took 37,394 days self-certified sickness absence. Where entitled, staff can take both certified and
self-certified sickness absence in a year. Without analysis the sector cannot determine the impact
of long-term sickness absence. Identifying the number of staff who did not have any sickness
absence in a given year is also an important staff motivator under PMDS.
Figure 37: Staff numbers and working days
Targeted intervention strategies such as return to work interviews and referral to the local
authority General Practitioners, Occupational Health services or counselling services, will aid
management of certified sickness absence. Clear strategies for management and reporting of
return to work strategies and their effectiveness and reporting changes made and successes and
failures in intervention methods will aid management of certified sickness absence across the
sector.
Implication: Staff patterns cannot be determined which limits the ability to target appropriate
interventions. An important statistic for staff motivation is also ignored by failure to quantify
the number of staff with no recorded spells of sickness absence.
_____________________________________________________________________Local Government Audit Service, VFM Unit
56
Availed of 236,422 days Availed of 37,394 days Self-Certified Sick Leave Certified Sick Leave
Number of staff who took sick leave in the 31 local authorities who quantified the numberof staff who took sick leave in 2011
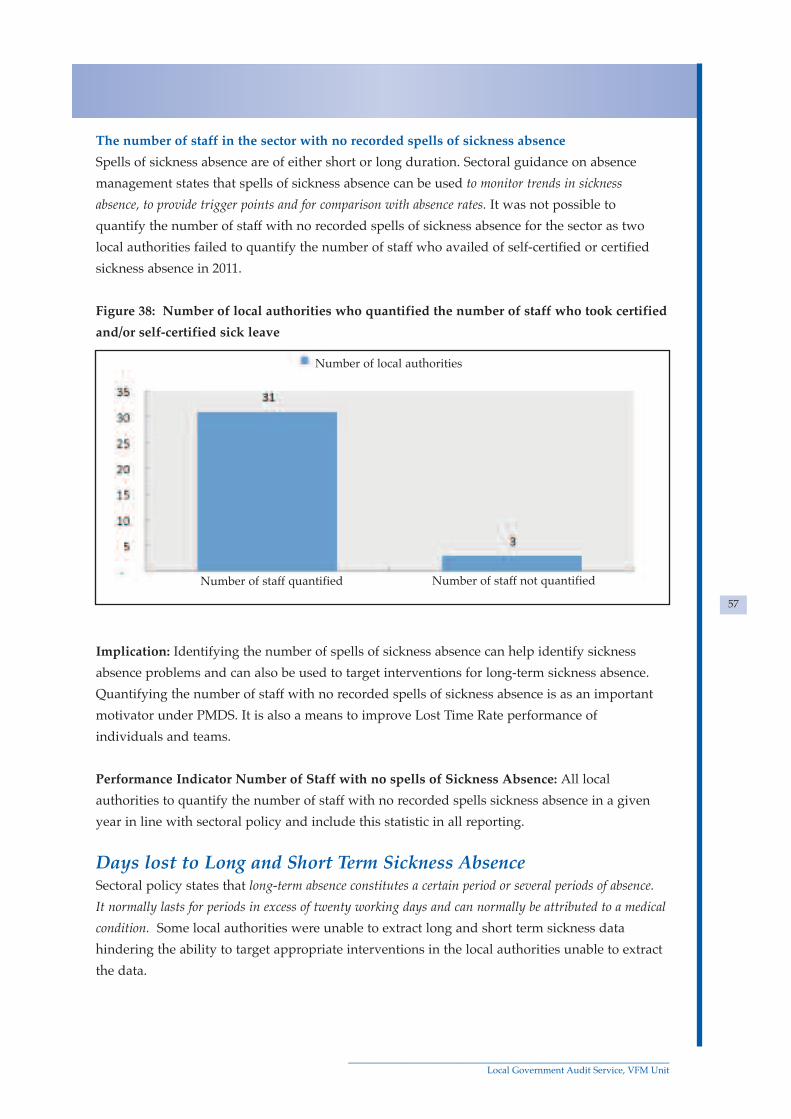
The number of staff in the sector with no recorded spells of sickness absence
Spells of sickness absence are of either short or long duration. Sectoral guidance on absence
management states that spells of sickness absence can be used to monitor trends in sickness
absence, to provide trigger points and for comparison with absence rates. It was not possible to
quantify the number of staff with no recorded spells of sickness absence for the sector as two
local authorities failed to quantify the number of staff who availed of self-certified or certified
sickness absence in 2011.
Figure 38: Number of local authorities who quantified the number of staff who took certified
and/or self-certified sick leave
Implication: Identifying the number of spells of sickness absence can help identify sickness
absence problems and can also be used to target interventions for long-term sickness absence.
Quantifying the number of staff with no recorded spells of sickness absence is as an important
motivator under PMDS. It is also a means to improve Lost Time Rate performance of
individuals and teams.
Performance Indicator Number of Staff with no spells of Sickness Absence: All local
authorities to quantify the number of staff with no recorded spells sickness absence in a given
year in line with sectoral policy and include this statistic in all reporting.
Days lost to Long and Short Term Sickness Absence Sectoral policy states that long-term absence constitutes a certain period or several periods of absence.
It normally lasts for periods in excess of twenty working days and can normally be attributed to a medical
condition. Some local authorities were unable to extract long and short term sickness data
hindering the ability to target appropriate interventions in the local authorities unable to extract
the data.
_____________________________________________________________________Local Government Audit Service, VFM Unit
57
Number of staff quantified Number of staff not quantified
Number of local authorities

Figure 39: Number of local authorities who quantified the number of days Long and Short
Term Sickness Absence
Figure 40: Days long and short term sickness absence
Implication: LGMA sectoral policy sets out processes for managing long term sickness absence
including contact after 20 days, referral to an independent medical practitioner to enable
assessment of three courses of action, ability to return to full duties following prescribed course
of treatment, alternative duties temporary or long-term, or termination of employment for a
variety of reasons. The absence of analysis of days’ sickness absence due to long-term or short-
term sickness hinders ability to target appropriate interventions in the local authorities unable to
extract the data.
_____________________________________________________________________Local Government Audit Service, VFM Unit
58
Days Quantified Days not Quantified
Number of local authorities
Long Term Sickness Absence Short Term Sickness Absence
Number of days for the 28 local authorities able to extract the data

Number of staff who took long and short-certified sickness absence27 local authorities extracted data for the number of staff who took long or short-term sick leave
in 2011.
Figure 41: Long and Short Term Sickness Absence
Implication: The absence of analysis of staff who took sick leave due to long-term or short-term
sickness limits the sectors ability to target appropriate interventions.
Performance Indicator Long-Term, Short-Term Sickness Absence: All local authorities to
analyse the number of staff who incurred sickness absence due to long-term or short-term
sickness and report.
Sickness absence days as a result of Occupational InjuryOccupational injury days form part days lost to long or short term sickness absence. An
additional focus on Occupational Health was included in the VFM Study at the suggestion of
the LGMA, as the frontline and physical nature of many local authority jobs, presents particular
challenges for managing attendance. Many services provided by local authorities are at the
frontline and include fire services, water drainage services, housing maintenance, roads
maintenance, homeless, welfare services, environmental services, planning, civil defence,
recreation and leisure services. Dublin City Council provides fire and emergency services for the
entire Dublin region.
_____________________________________________________________________Local Government Audit Service, VFM Unit
59
Staff Numbers Quantified Staff Numbers not Quantified
Number of local authorities

Figure 42: Occupational Injury reportable occurrences and non-reportable days
Figure 43: Non-reportable Occupational Injury Sickness Absence Days Quantified
Two local authorities did not record the number of non-reportable working days lost due to
occupational injury. One local authority noted that they had not been recording this figure
however that on the ground the linkages were taking place between the Health and Safety Team
and the Employee Welfare Officer. The authority noted that, the Health and Safety team notifies
the HR department of any reported accidents at work. The HR department ensures that this
information is recorded against the related absence on the Core System and that this then forms
part of the quarterly report to the Senior Management Team. The local authority is carrying out
_____________________________________________________________________Local Government Audit Service, VFM Unit
60
Number of occurrences over 3 days Working days lost to occupational injurynotified to the Health and Safety through non-fatal injuries and illness in
Authority in 2011 2011 with no requirement to notify theHealth and Safety Authority
Occurrences over 3 days notified to the Health and Safety Authority recorded in the localauthorities with reportable occurrences
Not recorded in No working days lost due Working days lost due to2011 to occupational injury in occupational injury in this
this category in 2011 category in 2011
Number of local authorities with working days lost where there is no legal requirement toreport to the Health and Safety Authority Ireland
Days occupational injury sickness absence recorded in 32 local authorities

a review of all 2012 accidents at work forms and is retrospectively recoding any sickness
absence that is directly related to an accident at work. The local authority expanded the Return
to Work form to capture ‘Accident at Work’ information.
The second local authority noted that it currently records all certified or self-certified sickness
absence on Core HR. It noted that all incidents are recorded as per the Medical Condition set
out on the medical certificate and do not identify in a separate field if the absence relates to an
Occupational Injury. The local authority noted that the HR Department will be working with the
Health and Safety Officer to develop an appropriate way of recording an employee’s absence as
a result of an occupational injury on Core HR, in order to afford the opportunity to report on
such absences.
A number of local authorities referred to their comprehensive Safety Management System in
respect of goal injury reduction. One local authority stated that its intention to have its Safety
Management System accredited externally within the next five years.
Good Practice: One local authority includes goal definition in terms of attainable injury
reduction as an objective in its overall health and safety strategy and has an objective in relation
to minimising work place accidents, incidents and near misses. This is audited internally under
OHSAS 18001 and every six months externally audited by the British Standards Institution (BSI)
and reviewed on a regular basis and has targets set against it.
Good practice noted: In a local authority, incident rate is compared with the overall national
figure as reported by the HSA.
Health and Safety goal definition in terms of attainable injuryreductionIn accordance with the Safety, Health and Welfare at Work Act, 2005 an employee who is injured
at work or has a near-miss is required to report the incident to the relevant line manager at the
earliest opportunity. Reporting to the Health and Safety Authority for certain occurrences is
mandatory. The total number of occurrences of non-fatal injuries and illness for absences over 3
days notified to the Health and Safety Authority in 2011 was 465.
The total number of occurrences of non-fatal injuries and illness for absences over 3 days
notified to the Health and Safety Authority in 2011 ranged from 1 to 173. The number of
working days lost to sickness absence recorded in local authorities due to non-reportable
occupational injury in 2011 not legally obliged to report to the Health and Safety Authority was
14,770 days. The European Commission Communication and Action Plan Brussels, COM (2006)
328 ‘Final Actions for a Safer Europe’ makes accident prevention a priority for the current and
future Public Health Action Programmes. The Communication states that tackling the injury issue
requires sustained co-operation between the national, regional and local authorities of the Member States,
their public health and research communities and notes that characteristics of the national policies
are that they will be in line with the Community vision and that they will contain specific goals that are
_____________________________________________________________________Local Government Audit Service, VFM Unit
61

also to be defined in terms of attainable injury reductions, and will rely on a solid commitment by
governmental and non-governmental organisations in the country.
One of the key steps in meeting this goal is the utilisation of the local authority safety
management system which is currently being developed by the LGMA. This System’s key
objective is to make the working environment safer for everybody through identification and
mitigation of tasks with significant risk. The 2010 annual report of the Local Government
Management Services Board (LGMSB), states that an Audit Project Working Group (APWG) was
established in June 2010 by the Steering Committee to develop a Local Authority Safety
Management System Audit Tool. The annual report noted that the audit tool will complement
LGMSB now part of the LGMA, publication ‘How to Develop and Implement a Safety and Health
Management System – A Guidance Document for the Local Government Sector’ (2007) and will
facilitate the audit of the local authority’s safety management system. The annual report noted
that the purpose of the audit tool is to support local authorities in the demonstration of
continued improvement and good governance in safety, health, and welfare by providing
proactive performance measurement and evidence of compliance with required legislation,
training, best practice standards, and codes of practice. In addition to the development of the
audit tool, a number of support tools were identified including the development of a suite of
core safety, health, and welfare policies and procedures. The report noted that the adoption of
the guidance tools, and the application of the audit tool, will support local authorities in the
demonstration of good governance in the management of safety, health, and welfare.
Causes of Short and Long Term Sickness Absence
Local authorities do not have one agreed database to analyse the reasons for long and short
term sickness absence. Using an agreed schedule of reasons for sickness absence analysis is
important for identifying the main causes within the sector and enables comparison of causes
across the wider public sector. In both instances identification of causes aids effective targeted
interventions. The LGMA has indicated that consideration will be given to using an agreed
schedule of reasons for sickness absence analysis by the National Standards Committee (NSC) of
the LGMA. An agreed schedule of reasons for sickness absence analysis should be documented
and used across the sector.
_____________________________________________________________________Local Government Audit Service, VFM Unit
62

Figure 44: Causes of long-term and short-term sickness absence
Data provided by the remaining local authorities indicated that the top causes of short-term
illness cited as the first cause were Flu, Colds; Respiratory Tract Infection; Consultant or Medical
Appointment; No cause specified; Stomach Upset: Viral Illness; Migraine and Pain.
Figure 45: Short-Term Sickness Absence first cause of sickness absence
The top five causes of short-term sickness absence identified were: Flu/Colds; Respiratory Tract
Infection: Stomach Upset; Consultant or Medical Appointment; Back problems; Other Known
Cause; Viral Illness; Migraine; Kidney Infections; No cause specified; Pregnancy related; Stress;
and Pain. Two local authorities who provided details of causes identified fewer than 5 top
causes.
_____________________________________________________________________Local Government Audit Service, VFM Unit
63
Causes of sickness absence provided Causes of sickness absence not provided
Number of local authorities
Number of local authorities who cited this as the first cause
Pain
Migrane
Viral illness
Stomach upset
No cause specified
Consultant or Medical Appointment
Respiratory Tract Infection
Flu/Colds
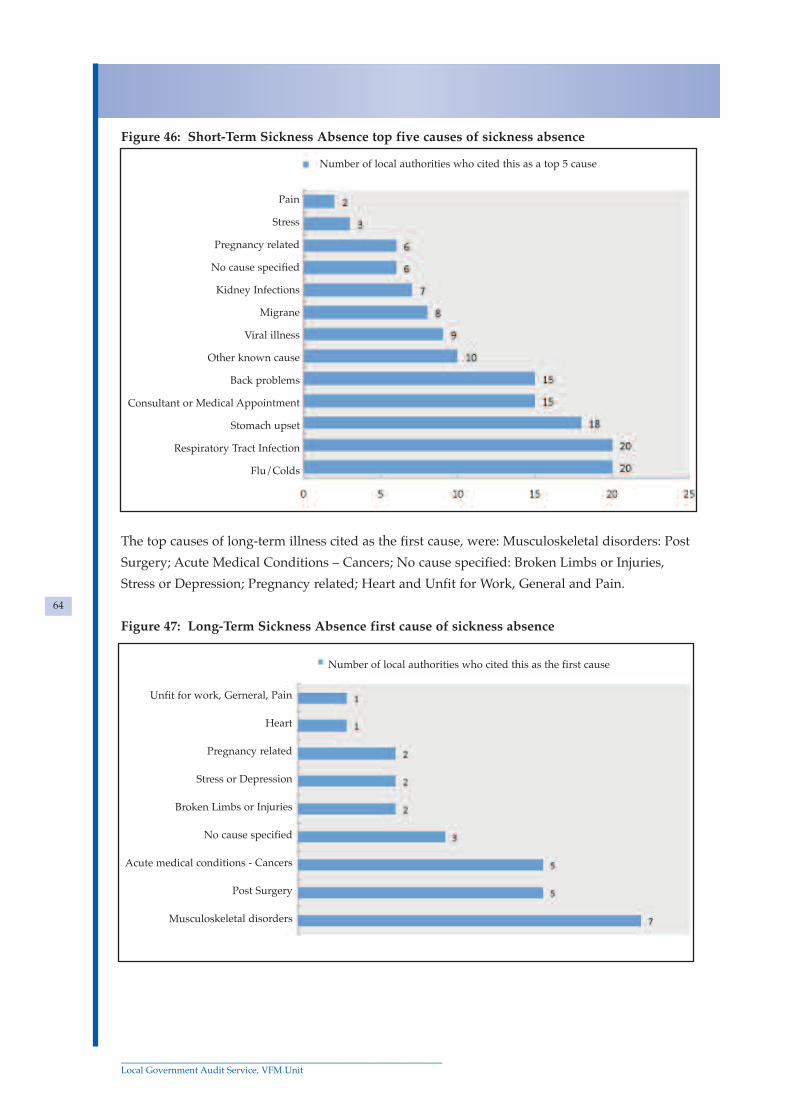
Figure 46: Short-Term Sickness Absence top five causes of sickness absence
The top causes of long-term illness cited as the first cause, were: Musculoskeletal disorders: Post
Surgery; Acute Medical Conditions – Cancers; No cause specified: Broken Limbs or Injuries,
Stress or Depression; Pregnancy related; Heart and Unfit for Work, General and Pain.
Figure 47: Long-Term Sickness Absence first cause of sickness absence
_____________________________________________________________________Local Government Audit Service, VFM Unit
64
Number of local authorities who cited this as a top 5 cause
Pain
Stress
Pregnancy related
No cause specified
Kidney Infections
Migrane
Viral illness
Other known cause
Back problems
Consultant or Medical Appointment
Stomach upset
Respiratory Tract Infection
Flu/Colds
Number of local authorities who cited this as the first cause
Unfit for work, Gerneral, Pain
Heart
Pregnancy related
Stress or Depression
Broken Limbs or Injuries
No cause specified
Acute medical conditions - Cancers
Post Surgery
Musculoskeletal disorders

The top five causes of long-term illness were: Musculoskeletal Disorders: Acute Medical
Conditions – Cancers; Stress or Depression: Pregnancy related: Post Surgery; Broken Limbs or
Injuries; No cause specified; Other known; Gynaecological; Heart; Chest infection; Hospital
Appointments and Unfit for work, General, Pain. Three local authorities who provided details
of causes identified fewer than 5 top causes.
Figure 48: Long-Term Sickness Absence top five causes of sickness absence
Good Practice noted: Long Term Absence was examined comprehensively by a local authority
in 2010 and each case was addressed with appropriate interventions. A report provided
summary details of the National Rate for Sickness Absence for the Council’s Local Authorities,
the average rate for sickness absence of Council Local Authorities for the 3 quarters to the time
of production of the report, the National Target for the Local Government Sector, the cost of
long-term sickness absence in 2009 and 2010, the number of employees, the number of days, the
actions taken by reason, the future actions committed to by reason.
Sectoral policy states that a person at an appropriate level in the Council will exercise a welfare role and
contact the employee. This may be the line manager / supervisor and/or the HR Department. A Welfare
Officer or an Employee Assistance Programme may be appropriate to use for this purpose. Under the
current local authority sector plan, the sector is committed to implementing the Local Authority
Competency Framework and linking PMDS to other HR policies.
_____________________________________________________________________Local Government Audit Service, VFM Unit
65
Number of local authorities who cited this as a top 5 cause
Unfit for work, General, Pain
Hospital Appointments
Chest infection
Heart
Gynaecological
No cause specified
Other known
Broken Limbs or injuries
Post Surgery
Pregnancy related
Stress or Depression
Acute medical conditions - Cancers
Musculoskeletal disorders

Good Practice: British Occupational Health Research Foundation (BOHRF) Managing
Rehabilitation: A competency framework for managers to support return to work: The
research report builds a competency framework for line managers to support an effective return
to work. The implications for line managers, for organisations and for policy makers are
considered. A behaviour-based Competency Framework for Managers to Support Return to
Work is reproduced. Guidance is available in a separate short document ‘Manager -support for
return to work following long-term sickness absence: Guidance’ and is available on British
Occupational Health Research Foundation BOHRF and Chartered Institute of Personnel and
Development (CIPD) websites. Local Authorities could consider including this competency as
part of the PMDS competency framework.
Occupational Injury sickness absence
Figure 49: Long and Short Term Occupational Injury Sickness Absence
Implication: The lack of data on occupational injury sickness absence in the local authorities
where causes were not provided limits effectiveness of interventions.
The causes of occupational injury cited as the first cause were: Body area injury to Limbs; Falls,
Slips, Sprains; Manual Handling; Machinery Accident, Equipment Failure, Back Injury, Other
Injury; Head, Neck Injury; Accident no detail specified and Post Traumatic Stress. One local
authority provided two joint top first causes giving a total of twenty eight first causes in twenty
seven local authorities.
_____________________________________________________________________Local Government Audit Service, VFM Unit
66
Occupational injury Occupational injury No occupational injury insickness absence causes sickness absence causes 2011
not provided provided
Number of local authorities

Figure 50: Long and Short Term Occupational Injury Sickness Absence
The most common causes of occupational sickness absence were Body Area Injury to Limbs;
Machinery Accident, Equipment Failure; Falls, Slips, Sprains; Other Injury; Back Injury; Manual
Handling; Head, Neck Injury; Accident No Detail Specified and Post Traumatic Stress. 9 local
authorities who provided details of causes identified fewer than 5 top causes.
Figure 51: Long and Short Term Occupational Injury Sickness Absence
The sectoral Sick Pay Schemes state that payment of salary or wage during certified sick leave
may not be made unless the medical certificate supporting the illness states the nature of the
illness. The signature of a medical practitioner is required. Self-certified sickness absence is
governed by Circular LG (P) 07/12 Self-Certified Paid Sick Leave Arrangements.
_____________________________________________________________________Local Government Audit Service, VFM Unit
67
Number of local authorities who cited this as the first cause
Post Traumatic Stress
Accident No detail specified
Head, Neck Injury
Other Injury
Back Injury
Hip Leg Knee Foot Injury
Machinery Accident, Equipment Failure
Manual Handling
Falls Slips Sprains
Arm Hand Elbow Rib Injury
Number of local authorities who cited this as a top 5 cause
Post Traumatic Stress
Accident No detail specified
Head, Neck Injury
Manual Handling
Back Injury
Other Injury
Hip Leg Knee Foot injury
Falls Slips Sprains
Machinery Accident, Equipment Failure
Arm Hand Elbow Rib Injury

Work-Related StressIn the 2005 European Working Conditions Survey (EWCS) work-related stress was found to be
the third most common work-related health problem across the EU, with some 22% of workers
reporting that their health was affected by stress41 and states that the most common stress
outcomes are mental and physical ill-health, sick leave, high staff turnover and occupational
accidents. This also means that the costs of work-related stress appear to be high42. The
European Working Conditions Observatory 2008 Joint Report on Implementation of Work Related
Stress Agreement states that work-related stress can be caused by different factors such as
working conditions, health, safety, well-being, environment, poor communication and work
organisation43. The 2007 Labour Relations Commission Guide ‘Work Related Stress’ implements
into an Irish context the European Social Partnership agreement on Stress. Under the agreement
the responsibility for determining the appropriate measures to manage work related stress rests
with the employer. Details in respect of the number of days of sickness absence due to work-
related stress were sought as part of the survey.
A total of 4,536 days were declared as days for sickness absence due to work-related stress in the
24 local authorities that provided the figures. One local authority provided details of the number
of staff who submitted work-related stress certificates but did not provide details of the number
of days’ sickness absence. Three local authorities recorded no days’ sickness absence due to
work-related stress. One noted that a policy to record had been introduced in March 2012.
Good Practice: A local authority Attendance Management Plan identifies a number of triggers
for points of intervention above the provision of the Sick Leave Scheme. The additional triggers
for intervention include a pattern of absence on Mondays and/or Fridays, a high Bradford
Factor and certified leave exceeding 20 working days. Potential actions are also listed including
consideration of engagement with staff support co-ordinators, referral to occupational health
specialist, family friendly policies and health and safety examination. Specific reference is made
to intervention for illness related to stress, mental illness or occupational injury.
The Role of the HR Function in Sickness Absence Management
HR processes for management of sickness absence must be aligned to the current and future
service delivery needs of local authorities. The role of HR in management of sickness absence
includes being advisors in relation to sickness absence procedures; working with line managers
to deal with problem sickness absence or long-term sickness absence; working with line
managers supported by occupational health professionals in planning a return to work for staff
on long-term sickness absence.
_____________________________________________________________________Local Government Audit Service, VFM Unit
68
41 http://www.eurofound.europa.eu/ewco/health/ 42 http://www.eurofound.europa.eu/ewco/2009/02/EU0902019I.htm 43 http://www.eurofound.europa.eu/ewco/2009/02/EU0902019I.htm

There is scope to expand the HR role to review sickness absence rates at least once a year to
pinpoint key features. Comparison could be made with previous year costs and sickness
absence rates. This indicates whether or not existing policies and procedures are effective. Going
forward, efficiency savings of approximately €21.10m could be made if sectoral targets are
adopted and achieved. If local authorities achieve a reduction in sickness absence to 10 days per
employee efficiency savings of approximately €10.07m would be achieved. There is scope for
HR to review progress made achieving these targets and savings annually and report.
Figure 52: HR role in sickness absence management
There is also a role for HR monitoring trends overall of long and short term sickness absence
and work-related stress.
_____________________________________________________________________Local Government Audit Service, VFM Unit
69
Republic Of Northern Republic of Republic Of Republic Of
Ireland Local Ireland Councils Ireland Local Ireland Sector Ireland Longer
Authorities 2011 Authorities Target to be Term Sector
2011 Average Rate achieved by Target2004-2010 2012
Average number of days lost peremployee
Average number of days lost per employee Sector Target forReduction

Benchmarking with Performance Indicators
Processes and performance metrics are compared with best practices within the sector or with
other sections and internationally with the UK using benchmarks and performance indicators.
Figure 53: Benchmarking using Performance Indicators
Benchmarking in relation to National Indicators
Reporting of local authority indicator data on sickness absence is currently confined to the
percentage of working days lost to sickness absence for both certified and self-certified sick
leave.
Figure 54: Benchmarking Nationally using Service Indicators
6. Benchmarking and Performance
_____________________________________________________________________Local Government Audit Service, VFM Unit
70
Number of local authorities who Benchmark Sickness Absence using Indicators
Public Sector UK Indicators
Private Sector Indicators
Other Irish Public Sector Indicators
Local Authority National Service Indicators
Benchmark performance using Local Do not use Local Authority ServiceAuthority Service Indicators Indicators
Number of local authorities who benchmark performance using National ServiceIndicators

Implication: Performance improvement may not be consistent within the sector. The Report of
the Local Government Efficiency Review Group notes that Service indicators are a guide to differences in
efficiency and effectiveness between local authorities at a given point in time. In line with the
recommendations of the report, here is opportunity to build on benchmarking using
performance indicators for targets, productivity savings and efficiency savings as part of
national reporting. The authorities who declared that they do not use Local Authority Service
indicators to benchmark included sickness absence data in the Council 2011 Annual report.
Performance Indicator: Full benchmarking by local authorities using current and all new Local
Authority National Service Indicators for sickness absence.
Benchmarking nationally with the Other Irish Public SectorIndicatorsLGMA policy states that measurement of deliverable targets is taking place across the sector with the
level of attendance an important indicator in this regard and that comparison across the local authority
sector, the wider public sector and the private sector is now possible as a result of this measurement.
Figure 55: Benchmarking Nationally using Other Irish Public Sector Indicators
_____________________________________________________________________Local Government Audit Service, VFM Unit
71
Benchmark Performance using other Irish Do not use other Irish Public SectorPublic Sector Indicators Indicators
Number of local authorities who benchmark performance using ServiceIndicators from other parts of the public service in Ireland

Benchmarking internationally with the public service indicators
Figure 56: Benchmarking Internationally using UK Public Sector Indicators
Implication: Performance metrics are not being compared with best performance internationally
by all local authorities. Performance improvement may not be consistent within the sector. There
is scope to make greater use of international benchmarking.
Benchmark: Northern Ireland Statistics and Research Agency (NISRA) Report Sickness
absence in the Northern Ireland Civil Service 2010/2011: The twelfth annual report by NISRA
provides an analysis of sickness absence for staff in the Northern Ireland Civil Service during
the 2010/2011 financial year. The report contains analysis of trends to help departments evaluate
the effectiveness of the range of initiatives, which were introduced to aid in reducing
absenteeism. The report includes a section on ministerial targets and provides analysis of
performance against the overall target and individual departmental performance.
Benchmark: Northern Ireland Audit Office Absenteeism in Northern Ireland Councils 2009-
10 Report by the Chief Local Government Auditor: Reports on performance, compares sickness
absence across all councils and considers the level of absenteeism for the sector as a whole when
compared with other employment sectors. It comments on improvement/ deterioration of
sickness absence rates across all councils. An improved sickness absence rate is accompanied by
quantification of productivity efficiency savings. A deteriorating sickness absence rate is
quantified financially in terms of productivity losses. The report identifies lost productivity by
cause of absence. In 2009-2010 lost productivity was quantified as £16.4m and it was reported
that the cause of absence which resulted in the highest amount of lost productivity in councils in
Northern Ireland was stress, depression, mental health and fatigue. The report quantifies
productivity gains by reference to the best performing rate in other local authorities and in 2009-
2010, quantified a gain of £6.2m had all councils matched the lowest average annual
absenteeism rates.
_____________________________________________________________________Local Government Audit Service, VFM Unit
72
UK Indicators Public Sector Sources Private Sector Indicators
Number of local authorities who use service indicators to benchmark performance
Number of local authorities who do not use service indicators to benchmarkperformance
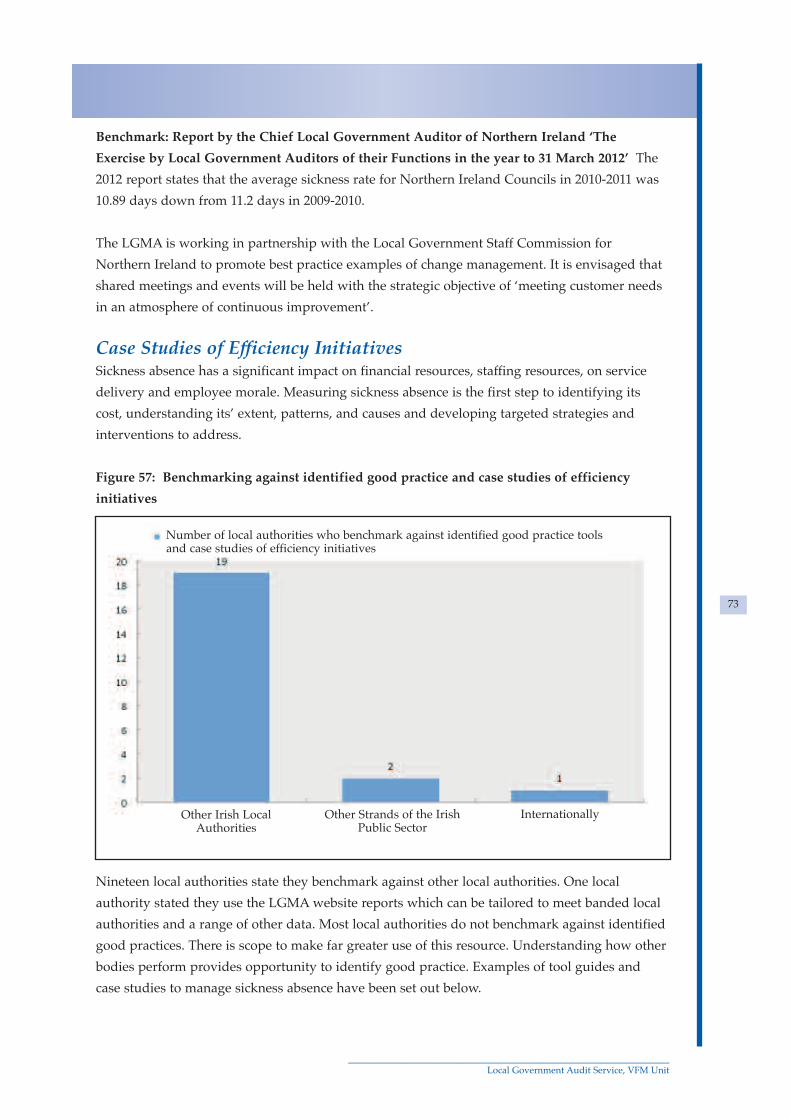
Benchmark: Report by the Chief Local Government Auditor of Northern Ireland ‘The
Exercise by Local Government Auditors of their Functions in the year to 31 March 2012’ The
2012 report states that the average sickness rate for Northern Ireland Councils in 2010-2011 was
10.89 days down from 11.2 days in 2009-2010.
The LGMA is working in partnership with the Local Government Staff Commission for
Northern Ireland to promote best practice examples of change management. It is envisaged that
shared meetings and events will be held with the strategic objective of ‘meeting customer needs
in an atmosphere of continuous improvement’.
Case Studies of Efficiency InitiativesSickness absence has a significant impact on financial resources, staffing resources, on service
delivery and employee morale. Measuring sickness absence is the first step to identifying its
cost, understanding its’ extent, patterns, and causes and developing targeted strategies and
interventions to address.
Figure 57: Benchmarking against identified good practice and case studies of efficiency
initiatives
Nineteen local authorities state they benchmark against other local authorities. One local
authority stated they use the LGMA website reports which can be tailored to meet banded local
authorities and a range of other data. Most local authorities do not benchmark against identified
good practices. There is scope to make far greater use of this resource. Understanding how other
bodies perform provides opportunity to identify good practice. Examples of tool guides and
case studies to manage sickness absence have been set out below.
_____________________________________________________________________Local Government Audit Service, VFM Unit
73
Other Irish Local Other Strands of the Irish InternationallyAuthorities Public Sector
Number of local authorities who benchmark against identified good practice toolsand case studies of efficiency initiatives

The European Institute of Public Administration Network Human Resources Working Group
(HRWG): EUPAN is an informal network of the Directors General responsible for Public
Administration in the Member States of the European Union, the European Commission and
observer countries. Its vision is to support the implementation of the Lisbon Strategy by placing
the citizen at the centre of public management and by working in various areas including
human resources. The HRWG is an interest group for discussing and sharing experiences on all
issues related to the HRM policies of central government administrations and some general
strategic matters concerning government reform and change. The HRWG has representatives of
all Member States, the European Commission and The European Institute of Public
Administration. There is scope to access this and similar networks to examine their case studies
and reports.
In addition to the HRWG, EUPAN has other working groups, committed to support efficiency
and customer orientation in European public service, the E-Government Working Group and
Innovative Public Services Group (IPSG) which has a sub-group, Common Assessment
Framework Expert Group (CAFEG). The IPSG mission is to contribute to improving the quality
and efficiency of the European public services, by developing tools and sharing good practices
between Member States. The main goal is to introduce quality management and the customer
orientation in public administrations. The CAF is a tool introducing quality management in the
public sector. This is a free resource. The overall vision of the CAF Network and the CAF
Resource Centre can be described as “The further dissemination of the CAF within Europe,
maximising collaboration at national and European level in order to contribute to the proper
functioning of public sector organisations and the quality of the service delivery to the citizens44.
Key performance results relate to whatever the organisation has determined as essential, measurable
achievements for the success of the organisation in the short and longer term. They represent the capacity
policies and processes to reach goals and objectives as defined in the institution’s mission, vision and
strategic plan and can be divided into External results: outputs and outcomes to goals focusing on the
link with/between the mission and vision (Criterion 1) strategy and planning (Criterion 2), processes
(Criterion 5) and the achieved results for the external stakeholders and Internal results: level of efficiency,
focusing on the link with people (Criterion 3), partnerships and resources (Criterion 4) and processes
(Criterion 5), and the achieved results in building up the organisation towards excellence45.
The case studies on the CAF database in the European Institute of Public Administration (EIPA)
facilitate the exchange of experience or benchlearning with other public organisations. The case
study of the Pirkanmaa Employment and Economic Development Centre in Finland where the
CAF model identified that one of the most important and most needed improvement actions
was how to develop their social capital, the knowledge of how to meet the needs of the future
organisation more effectively in the light of substantial changes to its structure in the coming
_____________________________________________________________________Local Government Audit Service, VFM Unit
74
44 The EUPAN-HANDBOOK 2007 page 2945 EIPA ‘CAF 2013 Improving Public Sector Organisations through Self-Assessment’ page 50

years and where sick leave has declined by 19% from 10.37 to 8.4 days per person per year and
longer periods of absence or sick leave have declined is an example of this46.
Good Practice: CAF as a tool for reporting on educational quality and a backdrop for drawing
up political objectives: In Nord‐Trøndelag County Council, Norway, the CAF assessment
results from the sector, both average and individual for the different schools, are used as the
main evidence for setting targets and objectives. These targets and objectives are set both for
long and short term, and are meant as solutions for the areas of improvement for the
educational sector as a whole, but also for the individual organisations. The annual
measurement of quality in the entire sector, the handling and target‐setting of the areas of
improvement, and following up the results, has led to measurable development in this period47.
The LGMA has stated that the Attendance Management Committee will use CAF in conjunction
with other models, also taking cognisance of possible other models in the greater public sector
and potential inter-sector comparisons.
Wales Audit Office (WAO) Good Practice Exchange: This is a resource to help organisations
become more effective in delivering better services. Having access to practical examples of what
others have done is very useful and the good practice exchange site has an extensive range of
good practice checklists and case studies on sickness absence management in the public sector.
The site notes that around 23% of the people at work in Wales are employed in public services. In terms
of the benefits of improving sickness absences rates in public services in Wales the Site identified
that “the benefit of reducing the average number of days lost each year in the Welsh public sector by only
one, is the equivalent of a cash injection of £27 million to the public services in Wales. This can be
achieved purely through obtaining a day's work from staff who are already being paid”48.
The good practice checklists are very detailed and view sickness absence management from the
perspectives of: the Board, Scrutiny Committee; the Chief Executive; Senior Managers; Human
Resources; Occupational Health; Line Managers, Team Leaders, Supervisors.
Good practice case studies are available to download from the site. Part of the Good Practice
Exchange provides guidance for public services when setting up an occupational health service.
_____________________________________________________________________Local Government Audit Service, VFM Unit
75
Recommendation: The Common Assessment Framework (CAF) to be used to benchmark
performance and to aid continuous improvement in management of sickness absence in the
sector.
46 CAF Works betters service for the citizens by using CAF. Austrian Federal Chancellery Directorate
General III – Civil Service and Administrative Reform 47 http://www.eipa.eu/files/File/CAF/event/1020602/S5_3_NO_Svendsen.pdf48 http://www.wao.gov.uk/goodpractice/1491.asp

It sets out the business benefits, some useful links to other relevant sources of information and
examples of good practice.
UK NAO 2004 Report: Managing Attendance in the Department for Work and Pensions
Report by the Comptroller and Auditor General 2004
The report assessed the Department for Work and Pensions’ performance against widely
accepted good practices. The NAO was assisted in this by attendance management experts from
the Institute for Employment Studies and the Institute of Work Psychology. The review was
undertaken at a time when the Department itself was reviewing the success of its attendance
management policy. The report considers performance against national targets, and examines
the effect of human resource policies in particular the emphasis on the role of line managers. A
number of good practice recommendations were made on the role of line managers including:
• Strengthening monitoring of line management actions.
• Provision of support for line managers.
• Developing effective attendance management training.
• Clarifying the role of occupational health and other welfare support and ensure
performance targets are met.
• Processes to ensure consistency of approach to managing attendance.
• Supports offered to staff to improve their attendance including well-being initiatives to
assist in identifying and tackling stress.
• Communication of policy and policy changes to all staff.
• Evaluation of the impact of the attendance policy.
UK NAO Current Thinking on Managing Attendance short guide for HR Professionals:
Produced by NAO with the Institute for Employment Studies and the Institute of Work
Psychology, the guide considers a range of issues including awareness programmes,
participation in national initiatives and lifestyle change interventions including stress
management. The guide, referred to the fact that ‘it is very common now to find that responsibility
for managing absence is pushed down to the line manager. However, evidence consistently points to more
effective absence management arising in situations where HR and or senior management carry the
responsibility. This is particularly the case where disciplinary action is taken because of poor attendance’.
The guide also considered the following
• Measuring absence
• Managing absence
• Tackling the causes of absence
• Organisational absence strategy/culture
• Absence management procedures
• Awareness programmes including; Written advice, Participation in national initiatives,
Health screening, Health education, Risk analysis and audit and Policy development
and dissemination
_____________________________________________________________________Local Government Audit Service, VFM Unit
76

• Lifestyle change interventions including; Smoking cessation, Stress management,
Addiction support, Work-related upper limb disorders e.g. Repetitive Strain Injury,
Advice, support and counselling, Manual handling and Weight loss programmes.
Good Practice: Chartered Institute of Personnel and Development (CIPD) Absence
Management Resources: CIPD have a number of resources available to aid management of
sickness absence including the ‘Absence Management tool’ a resource to help managers gather
reliable and useful data on absence levels, to analyse this data in order to identify trends or
issues, and to interpret these findings so that appropriate solutions and responses can be
developed.
Efficiency Initiative Shared Services for Transactional Functions
Civil Service Human Resource Shared Services Centre
A government decision was taken to proceed with implementation of a HR Shared Service
Centre (HRSSC) managed and operated by the Civil Service. A schedule for the transfer of HR
services to the HRSSC has been agreed for the 40 government departments/offices over a two
year period commencing September 2012. The HRSSC will manage the high volume
transactional elements of HR allowing local HR units to focus on more strategic HR capabilities.
“It is estimated that once fully operational the annual cost of HR services will be reduced by
26%”49. There is scope for local authorities to consider setting up a similar shared service option
within each of the new Regions under ‘Putting People First’.
Provision of a shared service to manage elements of HR including internal HR reports and
external compliance reports will allow local HR units to focus on more strategic HR capabilities.
In the Civil Service the common centrally managed Human Resource Management System
(HRMS) for administration of HR services was a significant advantage in establishing a
HRSSC50. Successful introduction of CORE, the shared HR and Payroll system within the local
authority sector gives scope for local authorities to consider setting up a similar shared service
option. Shared services bring benefits in addition to cost savings.
Local authorities have tackled spending cuts head on and have reported significant efficiency
savings. The sector continues to respond to the challenges facing the sector today including
fundamental restructuring, reducing spending and provision of continued customer-focused
services. Effective management of sickness absence aids this through productivity savings by
doing things better and through payroll efficiency saving by meeting sectoral targets set. A
shared service for HR reporting functions would assist HR in responding to the requirements
_____________________________________________________________________Local Government Audit Service, VFM Unit
77
49 http://per.gov.ie/2012/05/22/government-announces-plans-for-a-civil-service-wide-human-
resources-shared-service-centre-hrssc/ 50 http://debates.oireachtas.ie/dail/2012/06/13/00044.asp; page 44
contained in ‘Putting People First’ and to focus on more efficient and cost-effective ways of
delivering public services.
The sector is considering a number of areas suitable for shared services and business cases have
been prepared for HR Superannuation and an Employee Assistance Service.
_____________________________________________________________________Local Government Audit Service, VFM Unit
78
Recommendation: A shared service arrangement for internal HR reports and external
compliance reports to be established.
Recommendation: The local government sector to establish a Best Practice website for
managing sickness absence.
A Sectoral Approach to Management of Sickness Absence
The Need for Robust Reporting
Sickness absence levels as reported in the National Service Indicators since 2004 have increased
annually. Statistics on the percentage sickness absence and the estimated cost of sickness
absence in the local authority sector highlighted the need to evaluate the application of LGMA
sectoral policy and processes for the management and reporting of sickness absence in the
sector. This report quantifies the financial impact and scale of sickness absence, the causes of
sickness absence, arrangements in place to manage, monitor and control absence including well-
being interventions as a strong and coherent sector approach to the application of sickness
absence policies and procedures across the local government sector.
Sectoral Strategy Policy and Guidance
Sectoral guidance indicates that the local authority should ensure that robust reporting and
recording systems are in place. Excellence in recording and reporting is dependent on accurate
information being provided to line managers and onwards to relevant personnel responsible for
the management and implementation of the systems. It is important to ensure that all
managers, supervisors and employees are clear on their respective roles in this regard.
Management of sickness absence in the local government sector would benefit from better
reporting of performance locally and nationally, in terms of application of sectoral strategy
policy and guidance as there is scope for improvement in adoption and application of sickness
absence policy and procedure. Further productivity savings can be achieved by doing things
better and more consistently across the sector. With some exceptions, local authorities could
improve their planning to manage sickness absence, risk management and evaluation of
sickness absence. There is however very good work being done in some local authorities,
examples of the good practices noted have been reported in this study as have good practices
noted within the sector, benchmarking with the wider public service, and the private sector both
national and internationally.
Reporting Sickness Absence Nationally
Local authorities report on sickness absence through the service indicators. There is opportunity
to build on this in terms of reporting nationally on achievement of targets, efficiency savings
and productivity savings. In this way, service indicator data will be used as a basis for driving
change and challenging existing approaches to service delivery51.
Reporting/Presenting sickness absence to senior management
Sickness absence reports must be short and clearly presented to allow senior management
identify problem areas promptly and accurately. A short summary report of the issues
accompanied by graphs, pie charts, bar charts facilitates this. The summary report can be further
7. Managing Sickness Absence
_____________________________________________________________________Local Government Audit Service, VFM Unit
79
51 Report of the Local Government Efficiency Review Group March 2010 Section 3.5.4

sub-divided into groups for review e.g. by section, grade, type of contract, location. Combining
data as outlined below with specific data on costs, days, numbers and patterns gives a clear
picture of the cost to the council of sickness absence in many ways, also of the underlying
causes of sickness absences for individual sub-groups. This allows timely and targeted
intervention.
This report is based on a number of assumptions and calculations underpinned by the data
collected from the local authorities as set out in Appendix 4.
_____________________________________________________________________Local Government Audit Service, VFM Unit
80
Effective management of sickness absence is aided by:
Management Return to Work Forms: Nine local authorities were able to quantify the number
of Return to Work Forms for Return to Work Conversations held in 2011.
Management Sick Leave Review Meetings: Twenty-six local authorities could not quantify the
total number of instances of sickness absence resulting in a review meeting.
Line Manager Role: Line manager responsibility for implementing the HR strategy for
sickness absence was agreed and documented in 18 local authorities.
Staff Numbers: Thirty-one local authorities quantified staff numbers and the number of
working days each staff member took for certified and self-certified sick leave.
Long and Short-Term Sickness Absence: Twenty-eight local authorities quantified the number
of long and short-term sickness absence days facilitating the ability to target appropriate
intervention.
Long and Short-Term Sickness Absence: Twenty-seven local authorities quantified staff
numbers for long and short-term sickness absence.
Causes of Short Term Sickness Absence: The top causes of short-term illness cited as the first
cause, were Flu, Colds; Respiratory Tract Infection; Consultant or Medical Appointment; No
cause specified; Stomach Upset: Viral Illness; Migraine and Pain.
Causes of Long Term Sickness Absence: The top causes of long-term illness cited as the first
cause, were: Musculoskeletal disorders: Post Surgery; Acute Medical Conditions – Cancers; No
cause specified; Broken Limbs or Injuries; Stress or Depression; Pregnancy related; Heart and
Unfit for Work, General and Pain.
Causes of Occupational Injury Sickness Absence: The top causes of occupational sickness
absence cited as the first cause, were Arm, Hand, Elbow, Rib injury; Falls, Slips, Sprains;
Manual Handling; Machinery Accident, Equipment Failure; Hip, Leg, Knee, Foot injury; Back
Injury; Other Injury; Head, Neck Injury; Accident no detail specified and Post Traumatic Stress.
National HR Payroll and Superannuation System
The Local Government Efficiency Review Group Report 2010 recommended that a uniform
human resource and payroll system be implemented for local authorities (8.9.1). A HR Payroll
and Superannuation System (CoreHR) has been rolled out to 27 local authorities as part of a
national project. The Interim Report to the Minister for the Environment, Community and Local
Government and the LGERIG produced by CCMA in March 2012 committed in principle to a
migration plan for the remaining local authorities over time. The Further Report to the Minister for
the Environment, Community and Local Government published by the Local Government Efficiency
Review Implementation Group in April 2013, Appendix A states that the Payroll and
Superannuation HR shared service is currently at design stage, with the Core software being an
integral part of the Design stage.
The LGMA has stated that, it is intended to capture two main categories of benefits,
Organisational benefits (i.e. those contributing to the bottom line or to improved service to the
public or staff), these can be broken down further into benefits which can be readily identified
or quantified and for which monetary savings can be established readily and Functional
benefits (i.e. the contribution made by the system in achieving strategic HR and/or Payroll
objectives). These would tend to be benefits which accrue over a longer timeframe and will be
measured over a 3-5 year period post project. The LGMA has noted that a standardised set of
calculation methodologies will be achievable within the first 1-2 years of operational use of the
system.
Consideration by the Local Government Auditor of local authorityperformance
Development of a strong and coherent sector approach to the development of policies and
procedures is essential to maximise integration and efficiency across the local government
sector52. Implementing the recommendations in respect of LGMA policy already in place and
monitoring achievement with the identified performance indicators will assist in achieving this
objective. There is a role for external audit to report on the management of sickness absence.
_____________________________________________________________________Local Government Audit Service, VFM Unit
81
Work-Related Stress: Twenty-four local authorities provided details of the number of days of
sickness absence due to work-related stress in 2011.
Benchmarking: Greater use of benchmarking within the sector, with the wider Irish and
International Public Service and with the Private Sector will aid evaluation of the efficiency and
effectiveness of sickness absence strategy.
Case Studies of Efficiency Initiatives: to be applied as part of review and evaluation of the
effectiveness of sickness absence policy and application of procedure.
52 Local Government Efficiency Review Implementation Group Report to the Minister for the
Environment Community and Local Government March 2012 Section 1.4.1

The report of the LGER Group recommended that local authority performance against national
VFM studies, capital spot checks, efficiency reviews or VFM follow-up reports should be
considered by the local government auditors53. Sickness absence information could be included
in the Local Government Auditors’ annual statutory audit reports on the city and county
councils.
Summary of Recommendations
There is scope for improvement in adoption and application of sickness absence strategy, policy
and procedure. Twenty-five local authorities had adopted a locally agreed HR strategy or apply
the sectoral strategy without modification. There is a risk that HR processes for management of
sickness absence may not be aligned to meet the current and future service delivery needs
where local authorities have not adopted a strategy. Twenty-two local authorities had adopted
the updated ‘Attendance Management Policy and Procedure’. Thirty local authorities apply the
‘Attendance Management, Management Guideline Document’ or have a local equivalent
guideline and twenty-nine local authorities had adopted the ‘Management Guidelines for Line
Managers’ or have a local equivalent guideline. With some exceptions local authorities could
improve their planning to manage sickness absence, risk management and evaluation of
sickness absence.
There is very good work being done on the management of sickness absence in some local
authorities. This study gives examples of best practices currently applied in local authorities and
across the wider public sector. The good practices identified are reflected in the benchmarks for
improvement. This includes consideration of shared services for HR reporting for the local
government sector. Continuously improving the service delivery to the citizens with better efficiency is
the challenge for each and every public organisation54. The CAF model is a management tool for
developing excellent public services in and outside Europe.
This report has made a number of recommendations as set out below:
_____________________________________________________________________Local Government Audit Service, VFM Unit
82
• Recommendation: Full reporting of sickness absence costs and performance against
sectoral targets for efficiency and effectiveness savings nationally.
• Recommendation: Unpaid certified sickness absence to be quantified and reported
separately in the Service Indicators.
• Recommendation: The Common Assessment Framework (CAF) to be used to
benchmark performance and to aid continuous improvement in management of
sickness absence in the sector.
• Recommendation: A shared service arrangement for internal HR reports and external
compliance reports to be established.
• Recommendation: The local government sector to establish a Best Practice website for
managing sickness absence in the shared service.
53 Report of the Local Government Efficiency Review Group March 2010 Recommendation 2654 Growing towards excellence in the European Public Sector (a Decade of European Collaboration with
CAF) Patrick Staes and Nick Thijs page 5 EIPA
Recommendations made in this study are compatible with evolving public sector in line with
the Government commitment in this area. Introduction of a shared service for HR Transactional
Functions for the local government sector will allow HR locally to focus upon organisational
development and the continuous improvement needed to meet the challenges and meet the
needs of the future organisation more effectively in the light of substantial changes to local
government structure in the coming years and to focus on effective management of sickness
absence and delivery of the identified efficiency and productivity savings as a sector.
The management of sickness absence in local authorities is a key issue for the sector as
highlighted from the data collated and analysis in this report.
_____________________________________________________________________Local Government Audit Service, VFM Unit
83

Table 1 Full Time Equivalent and Total Working Days
Table 2 Total days’ sickness absence in 2011
Table 3 Net Cost and Efficiency Savings
Table 4 Net cost and efficiency savings at 10 days absence
Appendix 1:
_____________________________________________________________________Local Government Audit Service, VFM Unit
84

Table 1: Full Time Equivalent and Total Working Days
_____________________________________________________________________Local Government Audit Service, VFM Unit
85
Carlow 285.4 64,788.07
Cavan 416.3 94,500.10
Clare 785.0 178,195.00
Cork City 1,336.0 303,272.00
Cork County 2,184.1 495,792.97
Donegal 959.0 217,693.00
Dublin City 6,072.4 1,378,423.45
Dun Laoghaire Rathdown 1,063.6 241,437.20
Fingal 1,392.0 315,984.00
Galway City 471.0 106,917.00
Galway County 811.6 184,235.47
Kerry 1,152.3 261,581.18
Kildare 885.9 201,099.30
Kilkenny 556.6 126,345.93
Laois 367.9 83,508.76
Leitrim 281.1 63,816.51
Limerick City 474.1 107,629.78
Limerick County 629.4 142,880.61
Longford 313.0 71,051.00
Louth 699.3 158,750.18
Mayo 1,067.5 242,322.50
Meath 656.0 148,912.00
Monaghan 413.8 93,941.68
Offaly 399.0 90,573.00
Roscommon 525.1 119,190.89
Sligo 488.7 110,943.98
South Dublin 1,279.6 290,469.20
Tipperary North 481.1 109,216.51
Tipperary South 632.3 143,523.02
Waterford City 367.0 83,309.00
Waterford County 476.0 108,052.00
Westmeath 482.8 109,593.33
Wexford 819.3 185,981.10
Wicklow 747.5 169,682.50
29,971.9 6,803,612.22Source of Data FTE to 1 decimal place. FTE to two decimal places.
Survey Data provided by local Survey Data provided by
authorities. local authorities. Total
possible working days
figure of 227 provided by
the LGMA.
City/County Council FTE 31 December 2011 Total working days
Staff FTE*227

Table 2: Total days sickness absence in 2011
_____________________________________________________________________Local Government Audit Service, VFM Unit
86
Carlow 285.4 147.0 3,410.5 3,558 12.46 5.49
Cavan 416.3 235.5 4,018.5 4,254 10.22 4.50
Clare 785.0 269.0 7,619.0 7,888 10.05 4.43
Cork City 1,336.0 407.0 15,375.0 15,782 11.81 5.20
Cork County 2,184.1 3,181.0 23,372.0 26,553 12.16 5.36
Donegal 959.0 1,438.0 7,277.0 8,715 9.09 4.00
Dublin City 6,072.4 11,611.0 54,930.0 66,541 10.96 4.83
Dun Laoghire/ 1,063.6 92 12,195.0 12,287 11.55 5.09
Rathdown
Fingal 1,392.0 437.0 17,782.0 18,219 13.09 5.77
Galway City 471.0 791.0 5,411.0 6,202 13.17 5.80
Galway County 811.6 1,092.0 8,819.0 9,911 12.21 5.38
Kerry 1,152.3 1,903.0 12,816.0 14,719 12.77 5.63
Kildare 885.9 421.0 10,968.8 11,390 12.86 5.66
Kilkenny 556.6 952.0 4,561.0 5,513 9.90 4.36
Laois 367.9 425.0 3,425.4 3,850 10.47 4.61
Leitrim 281.1 439.0 3,169.0 3,608 12.83 5.65
Limerick City 474.1 1,208.5 6,859.5 8,068 17.02 7.50
Limerick County 629.4 969.0 6,478.6 7,448 11.83 5.21
Longford 313.0 150.0 3,889.0 4,039 12.90 5.68
Louth 699.3 2,442.5 8,009.4 10,452 14.95 6.58
Mayo 1,067.5 2,044.0 10,731.0 12,775 11.97 5.27
Meath 656.0 1,390.0 5,875.0 7,265 11.07 4.88
Monaghan 413.8 265.0 4,134.0 4,399 10.63 4.68
Offaly 399.0 240.0 5,162.5 5,403 13.54 5.96
Roscommon 525.1 403.0 6,192.0 6,595 12.56 5.53
Sligo 488.7 - 6,120.5 6,121 12.52 5.52
South Dublin 1,279.6 2,373.5 14,087.5 16,461 12.86 5.67
Tipperary North 481.1 717.0 4,021.5 4,739 9.85 4.34
Tipperary South 632.3 558.0 6,266.0 6,824 10.79 4.75
Waterford City 367.0 1,914.0 2,355.0 4,269 11.63 5.12
Waterford County 476.0 1,651.0 5,654.5 7,306 15.35 6.76
Westmeath 482.8 611.0 4,757.0 5,368 11.12 4.90
Wexford 819.3 7.0 9,511.5 9,519 11.62 5.12
Wicklow 747.5 1,926.0 5,212.5 7,139 9.55 4.21
29,971.9 42,710 310,466.1 353,176 11.78 5.19
Source of Data: Survey data provided by local authorities
City/County FTE 31 Days Days Paid Total Days Working Working
Council December Unpaid Sickness Sickness days lost days lost
2011 Sickness Absence Absence to sickness to sickness
Absence absence per
employee
Staff Days Days Days Days %
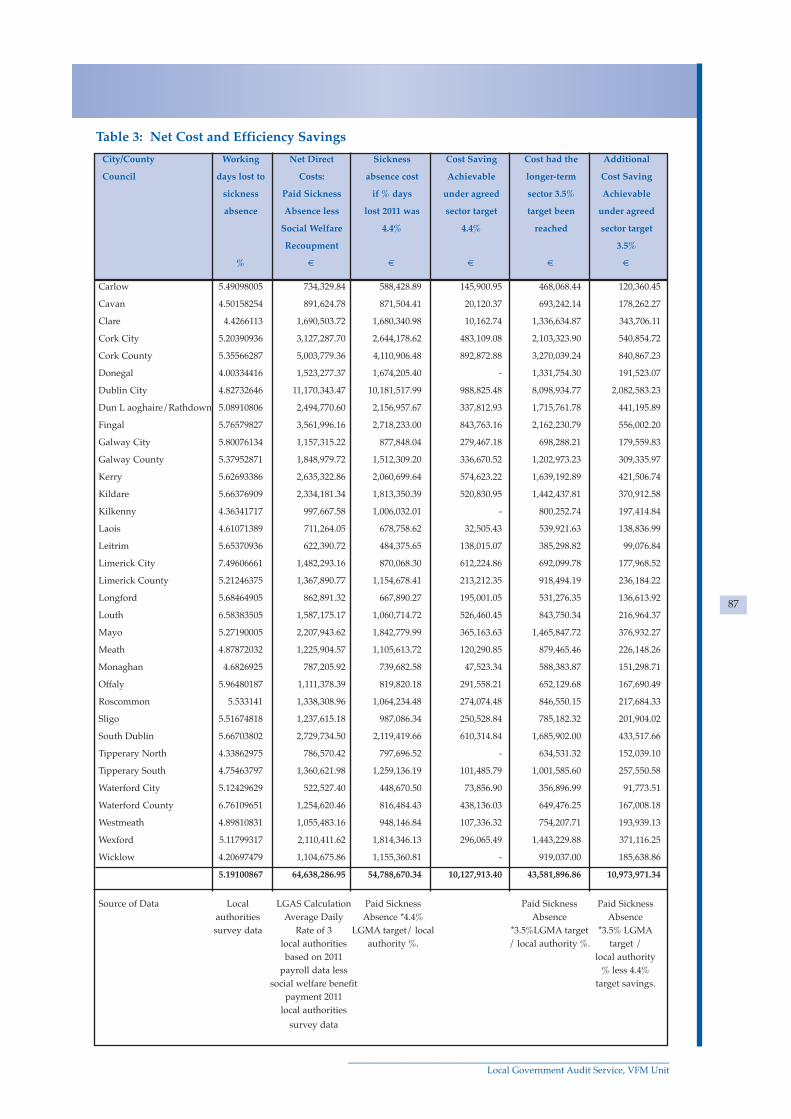
Table 3: Net Cost and Efficiency Savings
_____________________________________________________________________Local Government Audit Service, VFM Unit
87
Carlow 5.49098005 734,329.84 588,428.89 145,900.95 468,068.44 120,360.45
Cavan 4.50158254 891,624.78 871,504.41 20,120.37 693,242.14 178,262.27
Clare 4.4266113 1,690,503.72 1,680,340.98 10,162.74 1,336,634.87 343,706.11
Cork City 5.20390936 3,127,287.70 2,644,178.62 483,109.08 2,103,323.90 540,854.72
Cork County 5.35566287 5,003,779.36 4,110,906.48 892,872.88 3,270,039.24 840,867.23
Donegal 4.00334416 1,523,277.37 1,674,205.40 - 1,331,754.30 191,523.07
Dublin City 4.82732646 11,170,343.47 10,181,517.99 988,825.48 8,098,934.77 2,082,583.23
Dun L aoghaire/Rathdown 5.08910806 2,494,770.60 2,156,957.67 337,812.93 1,715,761.78 441,195.89
Fingal 5.76579827 3,561,996.16 2,718,233.00 843,763.16 2,162,230.79 556,002.20
Galway City 5.80076134 1,157,315.22 877,848.04 279,467.18 698,288.21 179,559.83
Galway County 5.37952871 1,848,979.72 1,512,309.20 336,670.52 1,202,973.23 309,335.97
Kerry 5.62693386 2,635,322.86 2,060,699.64 574,623.22 1,639,192.89 421,506.74
Kildare 5.66376909 2,334,181.34 1,813,350.39 520,830.95 1,442,437.81 370,912.58
Kilkenny 4.36341717 997,667.58 1,006,032.01 - 800,252.74 197,414.84
Laois 4.61071389 711,264.05 678,758.62 32,505.43 539,921.63 138,836.99
Leitrim 5.65370936 622,390.72 484,375.65 138,015.07 385,298.82 99,076.84
Limerick City 7.49606661 1,482,293.16 870,068.30 612,224.86 692,099.78 177,968.52
Limerick County 5.21246375 1,367,890.77 1,154,678.41 213,212.35 918,494.19 236,184.22
Longford 5.68464905 862,891.32 667,890.27 195,001.05 531,276.35 136,613.92
Louth 6.58383505 1,587,175.17 1,060,714.72 526,460.45 843,750.34 216,964.37
Mayo 5.27190005 2,207,943.62 1,842,779.99 365,163.63 1,465,847.72 376,932.27
Meath 4.87872032 1,225,904.57 1,105,613.72 120,290.85 879,465.46 226,148.26
Monaghan 4.6826925 787,205.92 739,682.58 47,523.34 588,383.87 151,298.71
Offaly 5.96480187 1,111,378.39 819,820.18 291,558.21 652,129.68 167,690.49
Roscommon 5.533141 1,338,308.96 1,064,234.48 274,074.48 846,550.15 217,684.33
Sligo 5.51674818 1,237,615.18 987,086.34 250,528.84 785,182.32 201,904.02
South Dublin 5.66703802 2,729,734.50 2,119,419.66 610,314.84 1,685,902.00 433,517.66
Tipperary North 4.33862975 786,570.42 797,696.52 - 634,531.32 152,039.10
Tipperary South 4.75463797 1,360,621.98 1,259,136.19 101,485.79 1,001,585.60 257,550.58
Waterford City 5.12429629 522,527.40 448,670.50 73,856.90 356,896.99 91,773.51
Waterford County 6.76109651 1,254,620.46 816,484.43 438,136.03 649,476.25 167,008.18
Westmeath 4.89810831 1,055,483.16 948,146.84 107,336.32 754,207.71 193,939.13
Wexford 5.11799317 2,110,411.62 1,814,346.13 296,065.49 1,443,229.88 371,116.25
Wicklow 4.20697479 1,104,675.86 1,155,360.81 - 919,037.00 185,638.86
5.19100867 64,638,286.95 54,788,670.34 10,127,913.40 43,581,896.86 10,973,971.34
Source of Data Local LGAS Calculation Paid Sickness Paid Sickness Paid Sickness
authorities Average Daily Absence *4.4% Absence Absence
survey data Rate of 3 LGMA target/ local *3.5%LGMA target *3.5% LGMA
local authorities authority %. / local authority %. target /
based on 2011 local authority
payroll data less % less 4.4%
social welfare benefit target savings.
payment 2011
local authorities
survey data
City/County Working Net Direct Sickness Cost Saving Cost had the Additional
Council days lost to Costs: absence cost Achievable longer-term Cost Saving
sickness Paid Sickness if % days under agreed sector 3.5% Achievable
absence Absence less lost 2011 was sector target target been under agreed
Social Welfare 4.4% 4.4% reached sector target
Recoupment 3.5%
% € € € € €

Table 4: Net Cost and Efficiency Savings at 10 days absence
_____________________________________________________________________Local Government Audit Service, VFM Unit
88
Carlow 12.46452472 734,329.84 10 589,135.85 145,193.99
Cavan 10.21859236 891,624.78 10 872,551.47 19,073.31
Clare 10.04840764 1,690,503.72 10 1,682,359.81 8,143.91
Cork City 11.81287425 3,127,287.70 10 2,647,355.45 479,932.25
Cork County 12.15735471 5,003,779.36 10 4,115,845.49 887,933.87
Donegal 9.087591241 1,523,277.37 10 1,676,216.86 -
Dublin City 10.95803108 11,170,343.47 10 10,193,750.50 976,592.97
Dun Laoghaire/ 11.55227529 2,494,770.60 10 2,159,549.13 335,221.47
Rathdown
Fingal 13.08836207 3,561,996.16 10 2,721,498.80 840,497.36
Galway City 13.16772824 1,157,315.22 10 878,902.72 278,412.50
Galway County 12.21153017 1,848,979.72 10 1,514,126.15 334,853.57
Kerry 12.77313987 2,635,322.86 10 2,063,175.45 572,147.41
Kildare 12.85675584 2,334,181.34 10 1,815,529.03 518,652.32
Kilkenny 9.90495697 997,667.58 10 1,007,240.70 -
Laois 10.46632054 711,264.05 10 679,574.11 31,689.94
Leitrim 12.83392025 622,390.72 10 484,957.60 137,433.12
Limerick City 17.01607120 1,482,293.16 10 871,113.63 611,179.53
Limerick County 11.83229271 1,367,890.77 10 1,156,065.69 211,825.07
Longford 12.90415335 862,891.32 10 668,692.70 194,198.62
Louth 14.94530557 1,587,175.17 10 1,061,989.10 525,186.06
Mayo 11.96721311 2,207,943.62 10 1,844,993.98 362,949.64
Meath 11.07469512 1,225,904.57 10 1,106,942.05 118,962.52
Monaghan 10.62971197 787,205.92 10 740,571.26 46,634.66
Offaly 13.54010025 1,111,378.39 10 820,805.14 290,573.25
Roscommon 12.56023006 1,338,308.96 10 1,065,513.09 272,795.87
Sligo 12.52301837 1,237,615.18 10 988,272.27 249,342.91
South Dublin 12.86417631 2,729,734.50 10 2,121,966.02 607,768.48
Tipperary North 9.848689543 786,570.42 10 798,654.90 -
Tipperary South 10.79302818 1,360,621.98 10 1,260,648.96 99,973.02
Waterford City 11.63215259 522,527.40 10 449,209.55 73,317.85
Waterford County 15.34768908 1,254,620.46 10 817,465.39 437,155.07
Westmeath 11.11870586 1,055,483.16 10 949,285.98 106,197.18
Wexford 11.6178445 2,110,411.62 10 1,816,525.97 293,885.65
Wicklow 9.549832776 1,104,675.86 10 1,156,748.90 -
11.78358967 64,638,286.95 10 54,854,496.73 10,067,723.36
Data Source: 2011 Sickness Absence days and FTE using Survey Stats.
City/County Days sickness Net Direct Costs: Cost if days Cost Saving
Council absence 2011 Paid Sickness sickness absence Achievable if
divided by FTE Absence reduced to reduction to
10 days per FTE 10 days per
FTE is achieved
Days € Days € €

Performance Indicators A users’ guide - Department of Finance
Preface
This is a short factual guide to Performance Indicators. It suggests what to do before selecting
indicators and explains the meaning of commonly-used terms.
Performance indicators are a means to an end. They are a key component of the reporting
structures to meet governance, accountability and management requirements. The ultimate end
is achieving Government’s policy objectives (outcomes) through the delivery of efficiently and
economically produced public services (outputs). Indicators help to measure how efficiently
Departments provide their services and how those services are impacting on society. This
information helps broaden the basis for decision-making and assists management and outside
observers reach sound conclusions about performance.
Definitions:
Strategic indicators - are we doing what needs to be done? These are high-level indicators about
performance on policy objectives. They are usually few in number.
Effectiveness indicators - are we doing what we set out to do? They relate inputs and outputs
to outcomes. They are used for external reports and for high-level internal management reports,
including qualitative and quantitative data.
Quality measures - to what extent are the expectations of customers and stakeholders being
met? They include among other things measures of reliability, accuracy, and courtesy.
Efficiency indicators - how efficiently do we use resources to produce our outputs? These
indicators are mainly for internal use, to help guide resource allocation decisions by managers.
They are predominantly quantitative, with a heavy emphasis on financial data, productivity and
timeliness.
Activity indicators - how busy are we? These indicators provide information about throughput
across a desk or management reports. They can be used also to compare workloads between
similar offices or units.
Appendix 2:
_____________________________________________________________________Local Government Audit Service, VFM Unit
89

Performance Indicators:
A Progress Report will issue after the National Report to measure and report levels of
compliance by local authorities with these Performance Indicators:
Strategic Indicators: 1. Sectoral policy and procedure: All local authorities to adopt the sectoral policy
document ‘Attendance management policy and procedure’.
Efficiency and Effectiveness Indicators: 1. Sectoral policy sector target: Adoption of sectoral target by all local authorities.
2. Efficiency Savings in respect of performance against the agreed sector target: Full
reporting of performance progress towards achieving efficiency savings nationally.
3. Performance Indicator: Full benchmarking by local authorities using current and all
new Local Authority National Service Indicators for sickness absence.
4. Attendance Management Plan: All local authorities to produce an attendance
management plan and evaluate it annually.
5. Sectoral policy on social welfare costs: Full adoption of the sectoral social welfare
recoupment policy and identification of all income due to the local authority.
Activity Indicators: 1. Accessibility of sickness absence information by Line Managers: Reports to be issued
or sickness absence information to be accessible by all line managers in every local
authority.
2. Line Manager Training: Line managers and staff of local authorities to be provided
with training in sickness absence policy, strategy and procedure in all local authorities.
3. Long Term and Short-Term Sickness Absence: All local authorities to analyse the
number of staff who incurred sickness absence due to long-term or short-term sickness
and report.
4. Risk Quantification and Mitigation: All local authorities to quantify identified risks in
respect of management of sickness absence and implement control measures as part of
corporate risk management in accordance with sectoral policy.
5. Performance Indicator Analysis of Days lost to Sickness Absence: All local authorities
to analyse underlying patterns behind certified and self-certified sickness absence and
report.
Quality Measures:1. Sickness Absence Duration: All local authorities to quantify the number of spells of
sickness absence for employees and report.
2. Number of Staff with no spells of Sickness Absence: All local authorities to quantify
the number of staff with no recorded spells sickness absence in a given year in line with
sectoral policy and include this statistic in all reporting.
Appendix 3:
_____________________________________________________________________Local Government Audit Service, VFM Unit
90

REPORT ASSUMPTIONS AND CALCULATIONS
Report assumptions
VFM report No. 28 Management of Sickness Absence in Local Authorities, was prepared on the
basis of information, documentation and explanations obtained from the public bodies referred
to in the report. The report was sent to all 34 city and county councils, to the LGMA, the
Department of the Environment Community and Local Government (the Department), and to
the Advisory Group for this study. Relevant sections were sent to agencies and to all external
bodies referred to in the report. Where appropriate, the comments received were incorporated
into the final version of the report. Much of the data used in the report is based on survey data
obtained from the 34 city and county councils.
The IPA report “Public Sector Trends 2012”55 states “Numbers employed in the public sector
continue to fall”. It notes that “As a percentage of total employment, public service numbers are
not excessive by European standards”. And states that “As the population continues to increase
(placing increasing demands on public services) and as numbers are reduced further to meet
fiscal and economic targets, the challenge of maintaining services and the skills and capacity
needed to provide those services increases”. The report comments that “This focuses particular
attention on the need for process improvement to enhance efficiencies.” It states that “The local
authority and justice sectors have been particularly hit by staffing reductions. Capacity
development in these areas is of pressing concern”.
Below is the schedule of assumptions underpinning survey data analysis and calculation of
estimated costs of sickness absence, estimated efficiency and estimated effectiveness savings.
A. Calculation of Estimated Costs of paid sickness absence €64.64m
Days paid sickness absence* average daily rate set off by income benefit paid by the
social welfare illness benefit payment:
Cost 310,466*€221.88 = €68.89m See B and C
Set-Off €4.25m based on survey data provided by local authorities See E
Estimated cost of paid sickness absence: €64.64m
B. Calculation of the number of days of paid sickness absence 310,466
Survey data: Days paid and unpaid sickness absence: 353,176. Days paid sickness
absence: 310,466. Days unpaid sickness absence: 42,710. Part-paid and pension rate of
pay days are charged at the estimated average daily rate.
C. Calculation of the average daily rate €221.88
Differing interpretation of sectoral guidance on cost calculation resulted in significantly
differing average daily costs for individual local authorities. Costs were re-calculated
resulting in an average daily rate of €221.88. This was based on the average daily rate of
Appendix 4:
_____________________________________________________________________Local Government Audit Service, VFM Unit
91
55 IPA ‘Public Sector Trends 2012’ Nov 2011

three local authorities using 2011 payroll data. Retained fire fighter costs were excluded.
The total days worked per year was defined as “FTE at 31 December 2011 as per survey
data * 227 = Number of days worked”. Average daily rate = Payroll costs as
defined/Number of days worked.
The Average Daily Rate for the Report comprised the Average Daily Rate of three
different local authorities was then averaged.
Average Daily Rate
€
County Council Southern Region 212.08
County Council Dublin Local Authority 227.29
County Council Western Region 226.28
665.65
Average Daily Rate to be used 221.88
LGMA guidance: The “Attendance management, management guideline document”
issued in November 2011 states that “for those local authorities that are utilising CORE HR
or similar is also appropriate to use real-time data from the system using the average daily rate in
the local authority”. It states “further guidance will issue from the Board in this regard”.
Guidance was not prepared at the time of survey.
D. Available Working Days 227 (applicable in 2011)
The estimated direct cost of sickness absence is based on 227 available working days.
The definition for the total number of working days per WTE is set out in LGMA
‘Attendance Management, Management Guideline Document’ and is defined as the total
number of days in a calendar year (365) less Saturdays and Sundays, less Annual Leave, less
Public Holidays less any other days the Council is closed for business. The LGMA guidance
notes that this figure has been computed as 227 days.
E. Social Welfare Illness Benefit Payment Recoupable €4.25m
Survey data: In 2011, €4.043m was due to be recouped by 32 local authorities who
quantified details. Two other local authorities stated that €205k was recouped in 2011.
In total €4.25m was recouped or recoupable in 2011.
F. FTE at 31 December 2011. - 29,971.9
Survey data: Local authorities were asked to provide details of all staff for which the HR
section has responsibility. County councils were asked to confirm whether this included
county council staff only or staff of all local authorities within the county area. Three
local authorities included retained fire-fighter staff in the FTE figure (89 FTE in total).
There have been challenges obtaining confirmation of FTE figures. There are four
different sets of data for the one date 31 December 2011. FTE data is provided to the
_____________________________________________________________________Local Government Audit Service, VFM Unit
92

Department, to the LGMA and to DPER and was provided as part of this survey. There
are differences between the FTE staff figures in the survey and the other sources of FTE
data. The overall differences are minor and are attributed to differing interpretation of
the definition of FTE and to timing differences in submitting the reported number of
FTE employees.
G. Calculation of Estimated Efficiency savings €10.13m for the 4.4% target and a further
€10.97m for the 3.5% longer-term target
The 4.4% and 3.5% targets are sector targets set out in sectoral management guidance
issued in November 2011.
Estimated efficiency savings are calculated using the overall % for sickness absence of
5.19% and total estimated sickness absence costs (Ref: A).The estimated efficiency
savings, if the 4.4% target is achieved, is calculated as the difference between the total %
and the 4.4% target. The same method was used to calculate the estimated efficiency
savings for the 3.5% longer-term target.
Estimated efficiency savings 4.4% target: €10.13m
Costs of Sickness Absence excluding unpaid days less the Cost had the 4.4% target been
achieved: Costs of Sickness Absence excluding costs for unpaid days*4.4% /sickness
absence rate for the local authority.
€64.64m - [€64.64m * 4.4%/ 5.19%] = €9.84m
€64.64m - €54.80m = €9.84m
The difference of €0.29m between this overall calculation and the quoted figure of
€10.13m is because four local authorities have achieved the 4.4% target.
Estimated efficiency savings 3.5% target: additional €10.97m
Costs of Sickness Absence excluding unpaid days less the Cost had the 3.5% target been
achieved: Costs of Sickness Absence excluding costs for unpaid days*3.5% /sickness
absence rate for the local authority. This is reduced by the estimated savings attributed
to reaching the 4.4% target above.
€64.64m - [€64.64m* 3.5%/ 5.19%] - €10.13m [4.4% savings] = €10.92m
€64.64m - €43.59m = €21.05m - €10.13m = €10.92m
The difference of €0.05m between this overall calculation and the quoted figure of
€10.97m is rounding and the reasons stated for the above 4.4%.
LGMA guidance on sector targets: The ‘Attendance management, management
guideline document’ issued November 2011, states “Empirical evidence gathered from
industry (CIPD, IBEC), public sector (Comptroller and Auditor General) and the local
government sector (Service Indicator Reports) has been utilised by the Attendance Management
Committee to determine tolerable absence rates for the sector” and that “benchmarking absence
is a useful tool towards the effective management of attendance”; that “following publication of
_____________________________________________________________________Local Government Audit Service, VFM Unit
93

the Service Indicator Report for 2009, details of trends in absenteeism were available for the years
2004–2010 inclusive” and that “this data has enabled the Attendance Management Committee
to determine a suitable benchmark for the sector”.
Estimated efficiency savings 10 Days target: €10.07m
Costs of Sickness Absence excluding unpaid days less the Cost had reduction in
sickness absence to 10 days been achieved: Costs of Sickness Absence excluding costs
for unpaid days*10 days /days sickness absence for the local authority.
€64.64m - [€64.64m * 10/11.78358967] = €9.79m
€64.64m - €54.85m = €9.79m
The difference of €0.28m between this overall calculation and the quoted figure of
€10.07m is because four local authorities have achieved the 10 days benchmark.
H. Unpaid Sickness Absence
A number of local authorities identified days certified unpaid and self-certified unpaid
sickness absence. It has been assumed that unpaid self-certified sickness absence days
do not relate to long-term sickness absence. To calculate the recommended metric, the
percentage of working days lost to unpaid certified sickness absence, days unpaid
sickness absence has been split as follows:
Certified days: 42,115
Self-Certified days: 595
Total days: 42,710
I. Percentage of working days lost to certified sickness absence where payment of
salary or wage was discontinued 0.62%
This calculation is expressed as a percentage of working days and is calculated as: Days
Unpaid Sickness Absence expressed as a % divided by total possible working days
(FTE*227)
42,115*100/29,971.9*227 = 42,115*100/6,803,612 = 0.62%
J. Sickness Absence Frequency Rate
Sickness absence frequency rate is defined in the sectoral guidance as:
Number of absences x100%
Average number of employees
_____________________________________________________________________Local Government Audit Service, VFM Unit
94

BIBLIOGRAPHY
Government
1. Government Reform Programme http://per.gov.ie/wp-
content/uploads/ProgrammeforGovernmentFinal.pdf
2. Public Service Agreement 2010-2014 (Croke Park Agreement) http://per.gov.ie/wp-
content/uploads/Public_Service_Agreement_2010_-_20141.pdf Labour Relations
Commission Haddington Road Agreement
http://www.lrc.ie/docs/The_Haddington_Road_Agreement/809.htm Various Action
Plans http://implementationbody.gov.ie/action-plans/
3. Government Public Service Agreement Action Plans Local Authority Sector March 2012
and November 2012 http://implementationbody.gov.ie/developments-by-local-
government-sector/
4. OECD Towards an Integrated Public Service
Department of the Environment, Community and Local Government (the Department)
1. Putting People First Action Programme for Effective Local Government October 2012
2. A Guide to: Putting People First Action Programme for Effective Local Government
Guide October 2012
3. Comprehensive Review of Expenditure September 2011
4. Office Notice 19/2010 Management of Sick Leave in the Department
5. Guidance Document on Management of Sick Leave 29 November 2010
6. Further Report to the Minister for the Environment, Community and Local Government
April 2013
7. Report of the Local Government Efficiency Review Group July 2010
8. Circular LG (P) 07/12 Self Certified Paid Sick Leave Arrangements
Office of the Comptroller and Auditor General
1. Sickness Absence in the Civil Service April 2009
Department of Finance
1. Public Service Agreement 2010-2014
2. Circular 09/2010 Management of Sick Leave
3. Circular 32/05: Re-use of Public Sector Information (PSI)
Department of Public Expenditure and Reform (DPER)
1. Human Resource Management in the Civil Service
2. The Public Spending Code
3. Public Service Reform November 2011
4. Third Report of the Organisational Review Programme
5. A Workforce Planning Framework for the Civil Service and Non-Commercial State
Bodies
Appendix 5:
_____________________________________________________________________Local Government Audit Service, VFM Unit
95

6. Guidelines for Managing Underperformance in the Civil Service May 2011
7. Circular 16/2012 Self Certified Paid Sick Leave Arrangements
Local Government Management Agency LGMA
1. Service Indicators in Local Authorities 2004-2011
2. Attendance Management Policy and Procedures for XYZ Local Authorities July 2006
3. Attendance Management Policy Good Practice Recommendations July 2006
4. Human Resource Strategy Framework for Local Authorities 2008
5. Attendance Management Policy and Procedure March 2011
6. Sick Leave Scheme (In-Door Staff)
7. Sick Leave - Sick Pay Scheme (Out-door Staff)
8. Attendance Management –Management Guideline Document November 2011
9. Attendance Management Guidelines for Line Managers November 2011
10. CCMA Report to the Minister for the Environment Community and Local Government
March 2013
11. CCMA Interim Report to the Minister for the Environment, Community and Local
Government and the LGER IG March 2012
EU Directives and Regulations
1. European Autonomous Framework Agreement on Work-Related Stress October 2004
under art 154-155 of the Treaty on the Functioning of the European Union (TFEU)
2. Council Regulation (EC) No 1338/2008 of the 16 December 2008 of the European
Parliament and of the Council on community statistics on public health and health and
safety at work.
3. EU Commission Regulation (EU) No 349/2011 of the 11 April 2011 Implementing
Regulation (EC) No 1388/2008 of the European Parliament and of the Council on
Community Statistics on Public Health and health and Safety at Work, as regards
Statistics on accidents at work.
4. EU Regulation (EC) No 1388/2008 of the European Parliament and of the Council of 16
December 2008 on Community Statistics on Public Health and health and Safety at
Work, as regards Statistics on accidents at work.
5. EU Council Regulation (EC, Euratom) No 723/2004 of the 22 March 2004 amending the
staff regulations of officials of the European Communities and the Conditions of
Employment of other servants of the European Communities.
6. Directive 2003/98/EC of the European Parliament and of the Council of 17 November
2003 on the re-use of public sector information
European Institute of Public Administration (EIPA) and Institute of Public Administration
(IPA)
1. EIPA The impact of demographic change and its challenges for the workforce in the
European public sectors 2012
2. EIPA CAF resource centre newsletter November 2012 on CAF 2013
3. IPA Research Paper No8 Public Sector Trends 2012
_____________________________________________________________________Local Government Audit Service, VFM Unit
96

EU Other
1. The EUPAN-HANDBOOK 2007
2. European Commission ‘Excellence in Public Administration for competitiveness in EU
member states’, Summary report and Background Report. 2011-2012
3. European Commission ‘Excellence in Public Administration for competitiveness in EU
member states’, Background report. 2011-2012
4. EuroStat the statistical agency of the European Union – various
http://epp.eurostat.ec.europa.eu/portal/page/portal/eurostat/home
5. EU European Commission Excellence in Public Administration for competitiveness in
EU Member States 2012
6. White Paper Together for Health: A Strategic Approach for the EU 2008-2013 Com
(2007) 630 Final
7. European Association of Craft, Small and Medium-sized enterprises UEAMP 2008
Implementation of the European Autonomous Framework Agreement on Work-Related
stress
8. Report on the implementation of the European social partners’ Framework Agreement
on Work-related Stress 2011
9. Benchlearning – Good examples as a lever for development. Bengt Karloff, Kurt
Lundgern and Marie Edenfelt Froment.
10. Directorate General Employment, Social Affairs and Inclusion Management Plan 2012
11. Communication from the Commission to the European Parliament and the Council on
Actions for a Safer Europe. Com (2006) 328 Final.
12. EU European Community Action Programme on Public Health
13. EU European Commission. Compendium of the Public Internal Control Systems in EU
Member States 2010
14. Communication from the Commission to the European Parliament, the Council, the
European Economic and Social Committee and the Committee of the Regions.
Improving quality and productivity at work: Community strategy 2007-2012 on health
and safety at work. Com (2007) 62 Final
15. EU Communication from the Commission to the Council, the European Parliament and
the European Economic and Social Committee and the Committee of the Regions. Local
Authorities: Actors for Development. Comm (2008) 626 Final.
16. EU Public Employment in the European Union Member States 2010 State Secretariat for
the Public Service, Directorate-General of the Public Service
17. EU Free Movement of Workers in the Public Sector Commission Staff Working Paper of
14 December 2010 SEC(2010) 1609 Final.
Common Assessment Framework (CAF)
1. Growing towards excellence in the European Public Sector A decade of European
collaboration with CAF Patrik Staes and Nick Thijs (ed.)
2. CAF works – betters service for the citizens by using CAF. Austrian Federal Chancellery
Directorate General III – Civil Service and Administrative Reform
3. CAF 2013 Improving Public Organisations through Self-Assessment EIPA
_____________________________________________________________________Local Government Audit Service, VFM Unit
97

4. CAF Five Years of CAF 2006: From Adolescence to Maturity – What Next? A study on
the use, support and the future of the Common Assessment Framework EIPA
5. Other Benchlearning Good Examples as a lever for development Bengt Karlof, Kurt
Lundgen and Marie Edenfelt Froment
6. European Institute of Public Administration CAF Resource Centre Newsletter 2012 CAF
2013 is born
7. CAF User Guide for the CAF Self-Assessment eTool November 2010
Northern Ireland Audit Office (NIAO)
1. Belfast City Council Annual Audit Letter 2011-2012 NIAO.
2. Absenteeism in Northern Ireland Councils 2009-2010
3. Absenteeism in Northern Ireland Councils 2008-2009
4. The Exercise by Local Government Auditors of their Functions in the year to 31 March
2012 - Report by the Chief Local Government Auditor
National Audit Office (NAO)
1. Managing Attendance in the Department of Transport and its Agencies 2007
2. Public Audit Forum ‘Corporate Services Performance Indicators’ May 2011
3. Current Thinking on Managing Attendance - A short guide for HR professionals.
Institute of Work Psychology.
4. Progress in improving government efficiency: lessons from the case study of efficiency
initiatives February 2006
5. Managing Attendance in the Department for Work and Pensions December 2004
Northern Ireland Statistics and Research Agency (NISRA)
1. Northern Ireland Statistics and Research Agency Department of Finance and Personnel
‘Sickness Absence in Northern Ireland Civil Service’ 2010/2011
2. NISRA Sickness Absence in the Northern Ireland Civil Service 2011-2012.
Audit Commission, Audit Scotland, Wales Audit Office, Miscellaneous UK Public Bodies
1. Audit Commission PMMI UK Target Setting – A practical guide
2. Audit Commission Wigan Metropolitan Borough Council Sickness Absence
Management March 2002
3. Audit Commission Managing Sickness Absence in the NHS Health Briefing February
2011
4. Dundee City Council Case Study An Integrated Staff Support Service 2004
5. Dundee City Council 2011 Report to the Policy and Resources Committee 2011
6. Haringey Council Employment Profile April 2008-March 2009
7. Wales Audit Office ‘A guide to managing sickness absences’.
8. The Local Government Staff Commission for Northern Ireland Annual Report and
Accounts April 2010 to March 2011
9. Employers Charter 2012 Department for Business Innovation and Skills
_____________________________________________________________________Local Government Audit Service, VFM Unit
98

Health Eurofound, Health and Safety Authority Ireland (HSAI)
1. HSAI Strategy in the area of Occupational Health
2. HSAI Summary of Workplace Injury, Illness and Fatality Statistics 2009-2010
3. HSAI Strategy Statement 2010-2012 and 2007-2009
4. Circular 17/1998:- Safety, Health and Welfare (General Application) Regulations 1993
and Safety, Health and Welfare at Work (Miscellaneous Welfare Provisions) Regulations
1995: requirements in relation to the work environment
5. Guide to the Health and Safety at Work (General Application) Regulations 2007 2 of
Part 2 Use of Work Equipment
6. Goldsmiths University of London British Occupational Health Research Foundation
Research Report Managing Rehabilitation: A competency framework for managers to
support return to work
7. BOHRF 2012 Systematic Review of the effectiveness and cost effectiveness of employee
assistance programmes.
8. BOHRF Managing Attendance at Work. An Evidence based review. Dr Anne Spurgeon,
Institute of Occupational Health, The University of Birmingham 2002
9. Preventing Absenteeism at the Workplace 2000
10. Joint Report on Implementation of Work Related Stress Agreement 2008
11. Absence from Work 2010
Health Service Executive (HSE)
1. April 2010 Circular 007/2010 Absence Data Management
2. December 2011 Performance Report
Implementation Body
1. Local Authority Productivity Achievements & Summary Progress Reports.
2. Local Government Efficiency Review Implementation Group Report to the Minister for
the Environment Community and Local Government 2012
Other
1. CHARTERED INSTITUTE OF PERSONNEL AND DEVELOPMENT. (2006) Absence
management [online]. Practical tool, London, CIPD. Available at:
http://www.cipd.co.uk/hr-resources/practical-tools/absence-management.aspx
2. CHARTERED INSTITUTE OF PERSONNEL AND DEVELOPMENT. (2010) Manager
support for return to work following long-term sickness absence [online]. Guide,
London, CIPD. Available at: http://www.cipd.co.uk/hr-resources/guides/manager-
support-return-work-following-long-term-sickness-absence.aspx
3. CHARTERED INSTITUTE OF PERSONNEL AND DEVELOPMENT. (2011) Absence
management survey [online]. Survey report, London, CIPD. Available at:
http://www.cipd.co.uk/hr-resources/survey-reports/absence-management-2011.aspx
4. CIPD – Various Guidance and Case Studies
5. DIT March 2011 Sickness Absence Management Policy and Procedures
6. Employers Organisation UK – The People Implications of the Efficiency Agenda.
_____________________________________________________________________Local Government Audit Service, VFM Unit
99

7. Health at Work and Independent review of sickness absence Dame Carol Black and
David Frost CBE November 2011
8. Health and Safety Executive Trust UK A pilot study into improving sickness absence
recording in National Health Service Acute Trusts Prepared by Plymouth NHS Trust
and Sandwell and West Birmingham NHS Trust 2007
9. Trade Union Commissions report on public and private sector absence rates 29 March
2010 The Truth About Sickness Absence
Useful Websites on best practices, Example Case Studies and Other Links
1. EuroStat the statistical agency of the European Union
http://epp.eurostat.ec.europa.eu/portal/page/portal/eurostat/home
2. European Institute of Public Administration http://www.eipa.eu
3. European Commission http://ec.europa.eu/index_en.htm
4. Public Internal Financial Control http://www.pifc.eu/
5. European Commission Benchlearning Community
http://epractice.eu/community/benchlearning
6. Eurofound http://www.eurofound.europa.eu/
7. Eurofound European Industrial Relations Observatory
http://www.eurofound.europa.eu/eiro/structure.htm
8. Eurofound European Working Conditions Observatory European Working Conditions
Survey (EWCS),
9. Eurofound European Monitoring Centre on Change
http://www.eurofound.europa.eu/emcc/
10. Local Government Management Agency Service Indicators Reports
http://www.lgmsb.ie/en/publication-category/service-indicator-reports-2004-2010
11. Department of Public Expenditure and Reform http://per.gov.ie/
12. Health and Safety Authority of Ireland http://www.hsa.ie/eng/
13. Implementation Body http://implementationbody.gov.ie/wp-
content/uploads/2012/06/Local-Authority-Summary-Porgress-Reports.pdf
14. Institute of Public Administration http://www.ipa.ie
15. Comptroller and Auditor General Report 2009
http://www.audgen.gov.ie/viewdoc.asp?DocID=1182&CatID=5&StartDate=1+January
+2013
16. The Audit Commission http://www.audit-commission.gov.uk/
17. Northern Ireland Audit Office http://www.niauditoffice.gov.uk/
18. Wales Audit Office Good Practice Exchange
http://www.wao.gov.uk/goodpractice/goodpracticeexchange.asp
19. Scottish Local Government Improvement Service
http://www.improvementservice.org.uk/
20. National Audit Office UK http://www.nao.org.uk/
21. The Chartered Institute of Personnel and Development http://www.cipd.co.uk/
22. NISRA http://www.nisra.gov.uk/
23. Re-use of Public Sector Information http://psi.gov.ie/
_____________________________________________________________________Local Government Audit Service, VFM Unit
100
Survey
LOCAL GOVERNMENT AUDIT SERVICE
Survey on the Management of Sickness Absences in
Local Authorities
Prepared by the Value for Money Unit of the LocalGovernment Audit Service
Appendix 6:
_____________________________________________________________________Local Government Audit Service, VFM Unit
101
Environment, Community and Local GovernmentComhshaol, Pobal agus Rialtas Áitiúil

_____________________________________________________________________Local Government Audit Service, VFM Unit
102

_____________________________________________________________________Local Government Audit Service, VFM Unit
103
1.1 Completion Details
Please provide the following details to facilitate any necessary follow up or clarification.
Completed by: Approved by:
__________________________ ________________________
Grade: Director of ServiceDivision:
Telephone: Telephone:
Email Address: Email Address:
Final Review:
____________________City/County Manager
1.2 Checklist of Enclosures with the completed survey
Report/Sample Report Yes No Not applicable
Human Resource Strategy A.3
Regular Absence Report A.7
Occupational Absence Report A.7
Attendance Management Plan A.12
Social Welfare Recoupment Policy B.12
Benchmarking Exercises Reports E.4
Please provide a sample copy of any otherregular report produced in the local authorityfor Senior Management Team monitoringsickness absences.
Dublin Local Authorities only. Sick LeaveScheme for Craft Workers, General Operativesand all related Grades. B.14

PurposeThis survey forms part of an examination on the Management of Sickness Absences in Local
Authorities. The purpose of the survey is to determine the arrangements that local authorities
have in place to identify, manage, monitor and control sickness absences including the measures
and initiatives adopted to promote well being and attendance. The survey covers the period
2011.
Objective 1: This National Study is designed to obtain an overview from local authorities on
Policies, Procedures, Targets and Systems, in place for the management and recording of
sickness absences.
Objective 2: The National Study will ascertain and make recommendations on how to
demonstrate to improve productivity and reduce absences. This will be done by examining and
considering best practice currently available in the EU, Public Sector UK, in the Private Sector,
and in Public Sector Ireland. The study will outline good practice examples and guidance
documents available and make recommendations on how to improve productivity and reduce
absences.
Objective 3: The National Study will consider how current Performance Indicators (PIs)
developed for Human Resource (HR) Management are being monitored and will make
appropriate recommendations for further PIs and new reporting methodologies including
annual reporting in Local Government Auditor reports, as deemed appropriate.
Objective 4: The National Study will consider other methods being applied by local authorities
to reduce current sickness absences costs and maximise attendance management as part of HR
Management.
Objective 5: The National Study will identify how effectively the requirements of the Human
Resource Strategy Framework for local authorities are being implemented by local authorities to
further develop the performance framework for the local authority system.
Objective 6: The National Study will identify how effectively the Attendance Management
Policy and Procedures document for local authorities circulated in March 2011 is being
implemented by local authorities.
Objective 7: The National Study will identify how local authorities contribute to provision of
accurate health statistics on injury and sickness at work for Euro Stat under Regulation
1338/2008 and 349/2011 through the reporting requirements to the Health and Safety Authority.
_____________________________________________________________________Local Government Audit Service, VFM Unit
104
1.3 Objective of and information on completing the survey

The objective of this section is to gather organizational information in relation to the council
overall strategy, policy and procedures for sickness absences management in the council and to
gather statistics for Occupational Health and Safety.
A.1 Name of council: _________________________________________________________
A.2 Number of Full Time equivalent staff (FTE) at 31 December for 2011: ___________
Please provide details for all council staff for which the HR section has
responsibility. (For County Councils, please state if this includes county staff only or
if this includes staff of all local authorities within the county area).
_____________________________________________________________________Local Government Audit Service, VFM Unit
105
Section A–Management and Measurement of SicknessAbsences, Strategy, Policy, Procedures and Guidelines and HRManagement System
Organisational Details
Strategy Policy and Guidelines
A.3 As at 31 December 2011 has Senior Management of the council
Yes No
• Adopted the nationally agreed LGMA/LGMSB AttendanceManagement Policy and Procedure Document issued inMarch, 2011?
• Adopted a locally agreed HR Strategy?
• Has the council adopted a different strategy to manageHuman Resources e.g. ISO Accreditation.
• Adopted the nationally agreed LGMA/LGMSBAgreements on Indoor and Outdoor Sick Leave issued inMarch 2011?
• Adopted the LGMA/LGMSB Attendance ManagementGuideline Document issued in November, 2011
• Adopted a local Attendance Management GuidelineDocument?
• Adopted the LGMA/LGMSB Guidelines for Line Managersissued in November, 2011?
• Adopted local Guidelines for Line Managers?
• Have the above documents all been formallycommunicated to all staff?
If yes, please outline briefly the approach adopted for communication of all documents e.g.issued by post, by email, available on the Intranet, workshops, training days etc.
Please provide a copy of the current strategy

The Attendance Management Policy and Procedure document was circulated in March, 2011
and is the agreed one for the sector. The Attendance Management Procedure which in
included with the policy document, aims to provide a consistent approach to managing
attendance in the workplace. These documents incorporate risk management as outlined
below.
_____________________________________________________________________Local Government Audit Service, VFM Unit
106
Strategy Policy and Guidelines
A.4 Responsibility for implementing the Human Resource Strategy
Yes No
• Has local agreement been reached and documented on therole of the line manager in relation to HR, i.e. what can beefficiently and effectively controlled by line managementrather than HR
• Has the document been formally communicated to all staff?
Please outline briefly the approach adopted for communication e.g. issued by post, by email,available on the Intranet, workshops, training days etc.
A.5 Current Reporting Yes No
• Is a report on Attendance Levels contained in the councilAnnual Report for 2011 in line with current serviceindicator requirements?
LGMA/LGMSB Attendance Management Policy and ProcedureDocument
Attendance Management Policy and Procedure document: The Council’s Senior ManagementTeam incorporates the management of attendance at the highest level of corporate governanceand conducts risk assessments and implements associated control measures in relation towork-related absence.
Attendance Management, Management Guideline Document: The local authority shouldtreat poor attendance as a cost to the organisation and therefore include attendancemanagement as part of the corporate governance and corporate risk management agenda.
Measurement and analysis and the recommended prevention and intervention methods shouldbe developed and reviewed on an ongoing basis.
A.6 Attendance Management – Risk Management Yes No
• Does the council produce risk assessment reports as part of
the corporate risk management agenda?
• Are regular risk assessment reports provided to the Senior
Management Team?
• Do the risk assessment reports focus on the prevention of
occupational/other absence?
• Do the risk assessment reports quantify the costs of the
identified risk?
• Is a risk assessment report available for 31/12/2011?
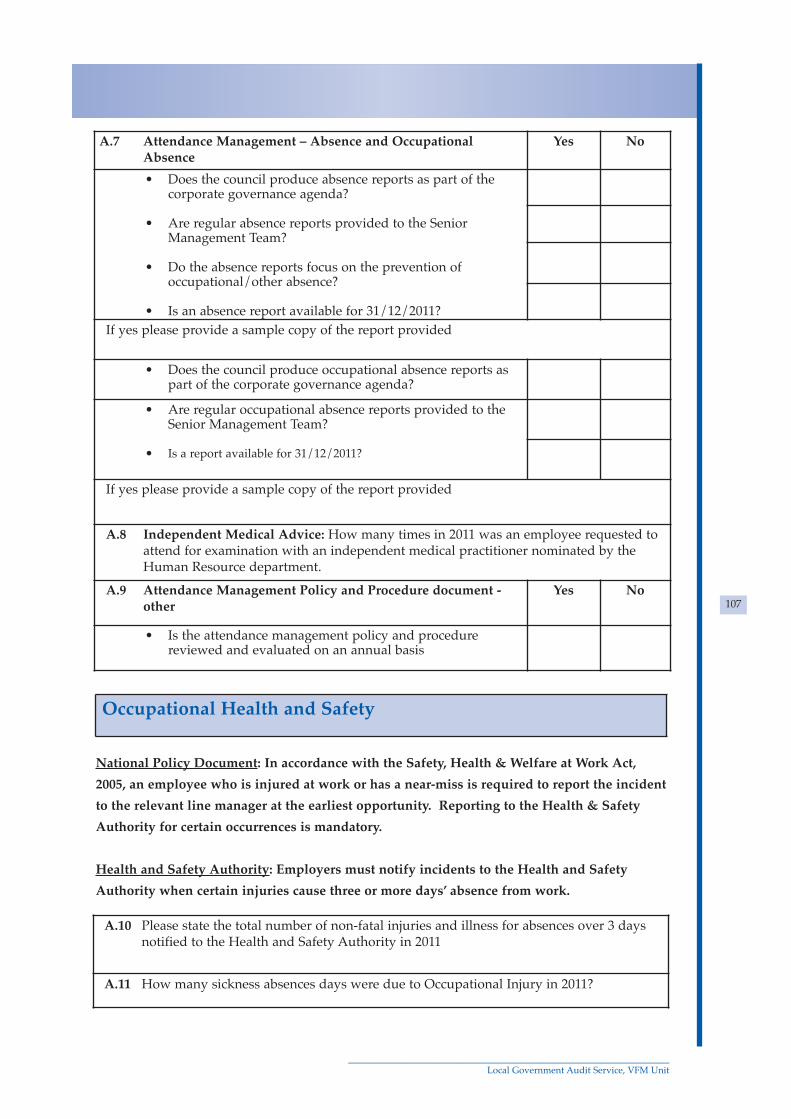
National Policy Document: In accordance with the Safety, Health & Welfare at Work Act,
2005, an employee who is injured at work or has a near-miss is required to report the incident
to the relevant line manager at the earliest opportunity. Reporting to the Health & Safety
Authority for certain occurrences is mandatory.
Health and Safety Authority: Employers must notify incidents to the Health and Safety
Authority when certain injuries cause three or more days’ absence from work.
_____________________________________________________________________Local Government Audit Service, VFM Unit
107
A.7 Attendance Management – Absence and Occupational Absence
Yes No
• Does the council produce absence reports as part of thecorporate governance agenda?
• Are regular absence reports provided to the SeniorManagement Team?
• Do the absence reports focus on the prevention ofoccupational/other absence?
• Is an absence report available for 31/12/2011?
If yes please provide a sample copy of the report provided
• Does the council produce occupational absence reports aspart of the corporate governance agenda?
• Are regular occupational absence reports provided to theSenior Management Team?
• Is a report available for 31/12/2011?
If yes please provide a sample copy of the report provided
A.8 Independent Medical Advice: How many times in 2011 was an employee requested toattend for examination with an independent medical practitioner nominated by theHuman Resource department.
A.9 Attendance Management Policy and Procedure document -other
Yes No
• Is the attendance management policy and procedurereviewed and evaluated on an annual basis
Occupational Health and Safety
A.10 Please state the total number of non-fatal injuries and illness for absences over 3 daysnotified to the Health and Safety Authority in 2011
A.11 How many sickness absences days were due to Occupational Injury in 2011?

_____________________________________________________________________Local Government Audit Service, VFM Unit
108
LGMA/LGMSB Management Guideline Document
A.12 Attendance Management Plan Yes No
• Does the council have an attendance management plan?
A.13 Does the attendance management plan include reportingquarterly/regularly to the Senior Management Team on thefollowing:
• Measurement
• Work related stress
• Prevention and intervention measures
• Ongoing review and evaluation: Does the council use the
regular reports to review the effectiveness of the attendance
management policy?
• Ongoing review and evaluation: Does the council have a
process to review the role of the line manager in relation to
absences?
• Ongoing review and evaluation: Which of the following
does the council use to monitor sickness absences
improvement?
a. Comptroller and Auditor General Report 2009
b. National Service Indicators
c. Service Indicators from other parts of the public service
in Ireland
d. Service Indicators from other parts of the public service
UK
e. Private sector indicators – please state
Please provide a copy of the attendance management plan
A.14 Reports to line managers on sickness absences Yes No
• Are regular reports on sickness absences issued to line
managers?
• If not, is this information accessible by line managers on the
current HR systems?
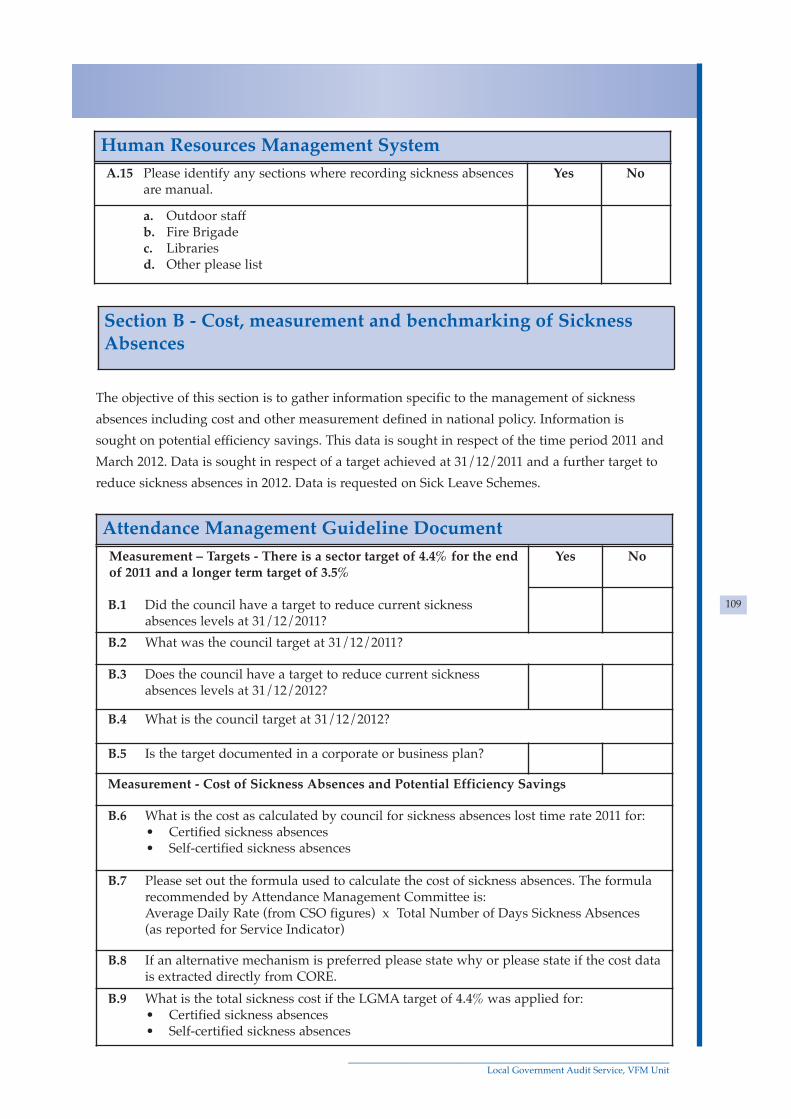
The objective of this section is to gather information specific to the management of sickness
absences including cost and other measurement defined in national policy. Information is
sought on potential efficiency savings. This data is sought in respect of the time period 2011 and
March 2012. Data is sought in respect of a target achieved at 31/12/2011 and a further target to
reduce sickness absences in 2012. Data is requested on Sick Leave Schemes.
_____________________________________________________________________Local Government Audit Service, VFM Unit
109
A.15 Please identify any sections where recording sickness absencesare manual.
Yes No
a. Outdoor staffb. Fire Brigadec. Librariesd. Other please list
Human Resources Management System
Section B - Cost, measurement and benchmarking of SicknessAbsences
Attendance Management Guideline Document
Measurement – Targets - There is a sector target of 4.4% for the endof 2011 and a longer term target of 3.5%
B.1 Did the council have a target to reduce current sicknessabsences levels at 31/12/2011?
Yes No
B.2 What was the council target at 31/12/2011?
B.3 Does the council have a target to reduce current sicknessabsences levels at 31/12/2012?
B.4 What is the council target at 31/12/2012?
B.5 Is the target documented in a corporate or business plan?
Measurement - Cost of Sickness Absences and Potential Efficiency Savings
B.6 What is the cost as calculated by council for sickness absences lost time rate 2011 for:• Certified sickness absences • Self-certified sickness absences
B.7 Please set out the formula used to calculate the cost of sickness absences. The formularecommended by Attendance Management Committee is:Average Daily Rate (from CSO figures) x Total Number of Days Sickness Absences(as reported for Service Indicator)
B.8 If an alternative mechanism is preferred please state why or please state if the cost datais extracted directly from CORE.
B.9 What is the total sickness cost if the LGMA target of 4.4% was applied for:• Certified sickness absences• Self-certified sickness absences
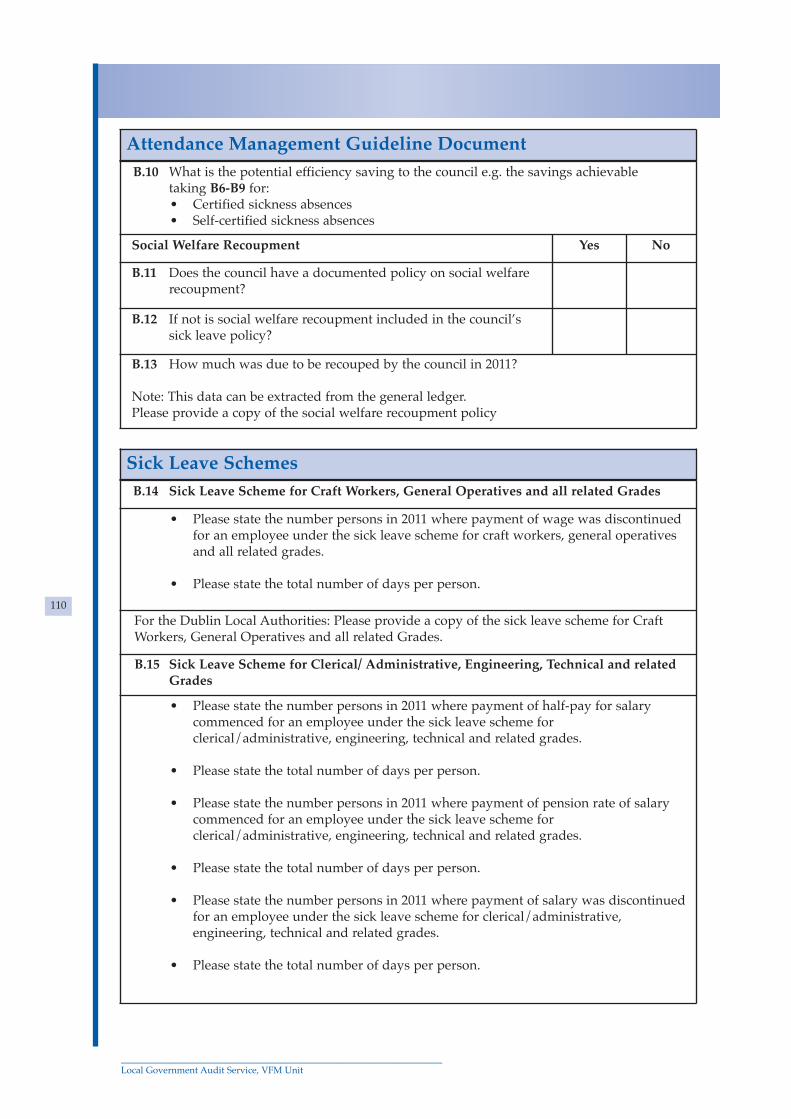
_____________________________________________________________________Local Government Audit Service, VFM Unit
110
Attendance Management Guideline Document
B.10 What is the potential efficiency saving to the council e.g. the savings achievable taking B6-B9 for:• Certified sickness absences• Self-certified sickness absences
Social Welfare Recoupment Yes No
B.11 Does the council have a documented policy on social welfarerecoupment?
B.12 If not is social welfare recoupment included in the council’ssick leave policy?
B.13 How much was due to be recouped by the council in 2011?
Note: This data can be extracted from the general ledger.Please provide a copy of the social welfare recoupment policy
Sick Leave Schemes
B.14 Sick Leave Scheme for Craft Workers, General Operatives and all related Grades
• Please state the number persons in 2011 where payment of wage was discontinuedfor an employee under the sick leave scheme for craft workers, general operativesand all related grades.
• Please state the total number of days per person.
For the Dublin Local Authorities: Please provide a copy of the sick leave scheme for CraftWorkers, General Operatives and all related Grades.
B.15 Sick Leave Scheme for Clerical/ Administrative, Engineering, Technical and related Grades
• Please state the number persons in 2011 where payment of half-pay for salarycommenced for an employee under the sick leave scheme forclerical/administrative, engineering, technical and related grades.
• Please state the total number of days per person.
• Please state the number persons in 2011 where payment of pension rate of salarycommenced for an employee under the sick leave scheme forclerical/administrative, engineering, technical and related grades.
• Please state the total number of days per person.
• Please state the number persons in 2011 where payment of salary was discontinuedfor an employee under the sick leave scheme for clerical/administrative,engineering, technical and related grades.
• Please state the total number of days per person.

The objective of this section is to obtain data which analyses sickness absences
by category, age and gender and staff numbers. Data to identify the number of
instances of sickness absences is also sought. This data is sought in respect of
the time period 2011.
Category: Where requested, please provide an analysis of sickness absences for the year ended
31/12/2011 by employee grade as per CORE definitions and the Department return
submissions.
Age: Where requested, please provide an analysis of sickness absences for the year ended
31/12/2011 by employee age as per CORE definitions.
Age 16-25 Age 36-45 Age 56-65
Age 26-35 Age 46-55 Age 65+
Long Term absences constitutes a certain period or several periods of absence.
It normally lasts for periods in excess of twenty working days and can usually
be attributed to a medical condition.
Short-term absences are generally considered to be absences of up to 20 days. A
medical certificate from the employee’s General Practitioner is required to cover
absences of three days or more.
_____________________________________________________________________Local Government Audit Service, VFM Unit
111
Attendance Management Guideline Document
Measurement - Irregularity of Attendance
• B.16 Please state the council Bradford Score at 31/12/2011.
• B.17 Please state the council Bradford Score at 31 March 2012.
• B.18 If the council calculated irregularity of attendance but does not use the BradfordScore please state the mechanism used.
• B.19 Please state the reasons for using this alternative mechanism.
• B.20 Please state the council score under the alternative mechanism at 31/12/2011
• B.21 Please state the council score under the alternative mechanism at 31 March 2012
Measurement - Absence Frequency
• B.22 Please state the council absence frequency rate as at 31/12/2011
Section C – Analysis of days lost to Sickness Absences andInstances of Sickness Absences

_____________________________________________________________________Local Government Audit Service, VFM Unit
112
C1 Days lost to Sickness Absences and Staff NumbersWhat is the total number of days lost in 2011 due to:• Self-certified sickness absences• Certified sickness absences
Please provide an analysis by Grade Category, Age and GenderPlease state the steps used to extract the data e.g. two CORE reports extracted into Exceland V Lookup.
What is the total number of staff who took sick leave in 2011 due to:• Self-certified sickness absences• Certified sickness absences
Please provide an analysis by Grade Category, Age and GenderPlease state the steps used to extract the data e.g. two CORE reports extracted into Exceland V Lookup.
What is the total number of days lost in 2011 due to:• Occupational Injury
Please provide an analysis by Grade Category, Age and Gender and state the number ofstaff.Data is extracted directly from CORE.
C2 Long-Term and Short Term Sickness Absences and Staff Numbers
What is the total number of days lost in 2011 due to:• Long-Term sickness absences• Short-Term sickness absences
Please provide an analysis by Grade Category, Age and GenderPlease state the steps used to extract the data e.g. two CORE reports extracted into Exceland V Lookup.
What is the total number of staff who took sick leave in 2011 due to:• Long-Term sickness absences• Short-Term sickness absences
Please provide an analysis by Grade Category, Age and GenderPlease state the steps used to extract the data e.g. two CORE reports extracted into Exceland V Lookup.
C3 Instances of Sickness Absences
What is the total number of instances of sick leave in 2011 due to:• Self-certified sickness absences• Certified sickness absences• Occupational Injury
• Please state the total number of instances of sickness absences per employee
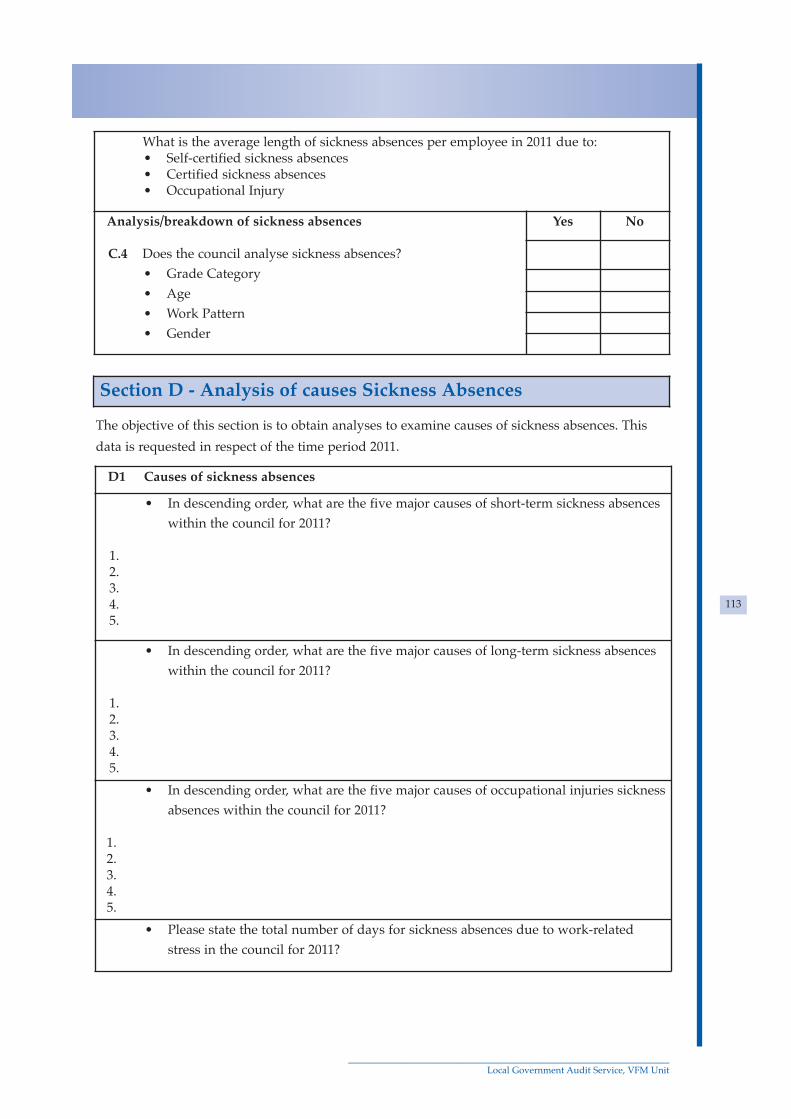
The objective of this section is to obtain analyses to examine causes of sickness absences. This
data is requested in respect of the time period 2011.
_____________________________________________________________________Local Government Audit Service, VFM Unit
113
What is the average length of sickness absences per employee in 2011 due to:• Self-certified sickness absences• Certified sickness absences• Occupational Injury
Analysis/breakdown of sickness absences
C.4 Does the council analyse sickness absences?
• Grade Category
• Age
• Work Pattern
• Gender
Yes No
Section D - Analysis of causes Sickness Absences
D1 Causes of sickness absences
• In descending order, what are the five major causes of short-term sickness absences
within the council for 2011?
1. 2. 3. 4. 5.
• In descending order, what are the five major causes of long-term sickness absences
within the council for 2011?
1. 2. 3. 4. 5.
• In descending order, what are the five major causes of occupational injuries sickness
absences within the council for 2011?
1. 2. 3. 4. 5.
• Please state the total number of days for sickness absences due to work-related
stress in the council for 2011?

The objective of this section is to obtain information in relation to the intervention
measures and initiatives in place to manage sickness absences and to promote well-
being, information on benchmarking and information on working with European
Strategy in respect of Health Statistics and Safety objectives and goal definition for
attainable injury reductions.
_____________________________________________________________________Local Government Audit Service, VFM Unit
114
Section E – Intervention Measures and Initiatives to AddressSickness Absences and to Promote Attendance and Well Being,Benchmarking, EU Strategy in respect of health and SafetyStatistics and goal definition for attainable injury reductions
E.1 Are the following interventions in managing sickness absencesprovided by the city/county for staff?
Yes No
• Employee assistance programme
• Occupational Health Services - Staff Welfare Officer- Health Screening- Vaccinations- Other please state
• Stress management training and stress management
workshops
• Intervention at an early stage to engage with an individual
on long term sick leave
• Health Promotion Officer
• Healthy Backs Programme
• Confidential Counselling and Support Service – self-referral
or work referral
• Team development days
• Regular Health Fairs
• Healthy Working Lives groups for all staff
• Cycle to Work Scheme
• Healthy Canteen Options
• Sick Leave Review meetings
• Return to Work Interviews
• Other – please state
Interventions in managing Sickness Absences and to PromoteAttendance and Well Being
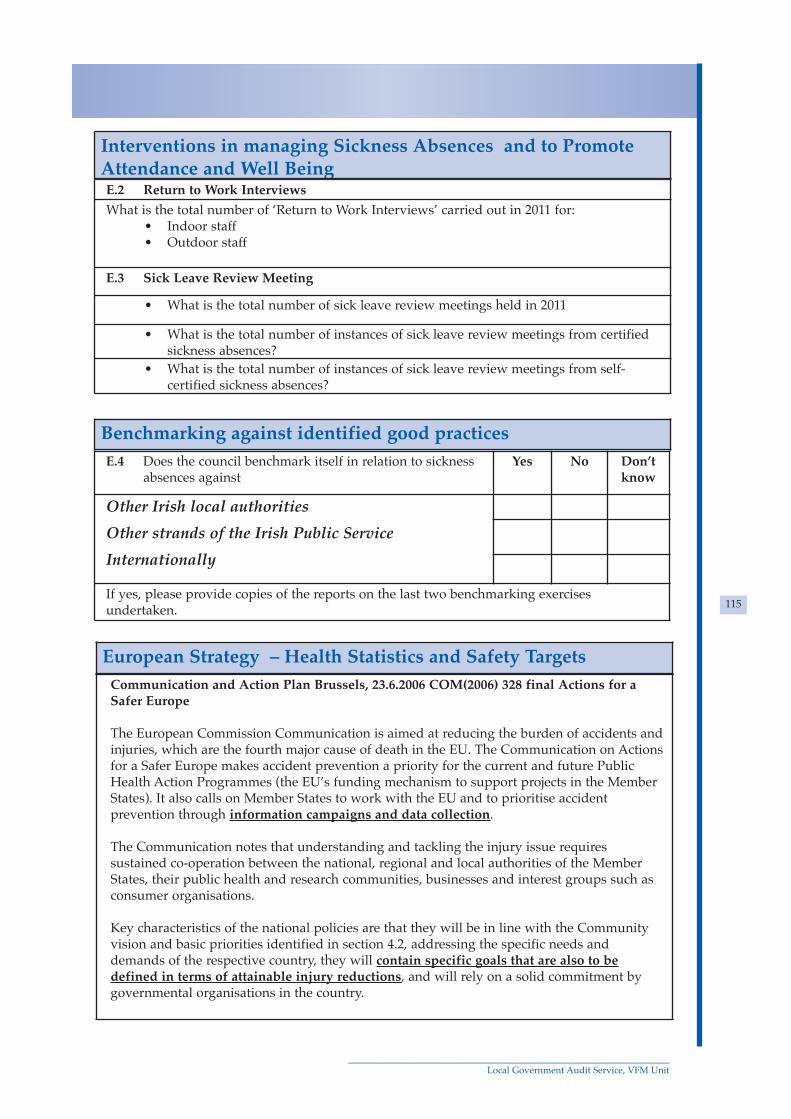
_____________________________________________________________________Local Government Audit Service, VFM Unit
115
E.2 Return to Work Interviews
What is the total number of ‘Return to Work Interviews’ carried out in 2011 for:• Indoor staff• Outdoor staff
E.3 Sick Leave Review Meeting
• What is the total number of sick leave review meetings held in 2011
• What is the total number of instances of sick leave review meetings from certifiedsickness absences?
• What is the total number of instances of sick leave review meetings from self-certified sickness absences?
Interventions in managing Sickness Absences and to PromoteAttendance and Well Being
E.4 Does the council benchmark itself in relation to sicknessabsences against
Yes No Don’tknow
Other Irish local authorities
Other strands of the Irish Public Service
Internationally
If yes, please provide copies of the reports on the last two benchmarking exercisesundertaken.
Benchmarking against identified good practices
Communication and Action Plan Brussels, 23.6.2006 COM(2006) 328 final Actions for aSafer Europe
The European Commission Communication is aimed at reducing the burden of accidents andinjuries, which are the fourth major cause of death in the EU. The Communication on Actionsfor a Safer Europe makes accident prevention a priority for the current and future PublicHealth Action Programmes (the EU’s funding mechanism to support projects in the MemberStates). It also calls on Member States to work with the EU and to prioritise accidentprevention through information campaigns and data collection.
The Communication notes that understanding and tackling the injury issue requiressustained co-operation between the national, regional and local authorities of the MemberStates, their public health and research communities, businesses and interest groups such asconsumer organisations.
Key characteristics of the national policies are that they will be in line with the Communityvision and basic priorities identified in section 4.2, addressing the specific needs anddemands of the respective country, they will contain specific goals that are also to bedefined in terms of attainable injury reductions, and will rely on a solid commitment bygovernmental organisations in the country.
European Strategy – Health Statistics and Safety Targets

Thank you for completing this survey.
Appendix to the Survey
Useful Websites
Example Case Studies
_____________________________________________________________________Local Government Audit Service, VFM Unit
116
E.5 How does the council facilitate meeting EC objectives in this regard?
Please set out details of any other observations you wish tomake on sickness absences in Local Authorities
European Strategy – Health Statistics and Safety Targets
• European Commissionhttp://ec.europa.eu/index_en.htm
• The Chartered Institute of Personnel and Developmenthttp://www.cipd.co.uk/
• Wales Audit Office Good Practice Exchangehttp://www.wao.gov.uk/goodpractice/goodpracticeexchange.asp
• Local Government Employers in the UK http://www.lge.gov.uk/lge/core/page.do?pageld=118956
• Improvement and Development Agency for Local Government (IDEA)http://www.idea.gov.uk/idk/core/page.do?pageld=1
• National Audit Office UKhttp://www.nao.org.uk/
Useful Websites on best practices, Example Case Studies andOther Links
European Agency for Safety and Health at Workhttp://osha.europa.eu/en/front-pageExample Case Study: Dundee City Council: An integrated staff support service.http://osha.europa.eu/data/case-studies/dundee-city-council-an-integrated-staff-support-service/Dundee-City-Council.pdf
The European Foundation study ‘Preventing Absences at the Workplace’ 1997http://www.eurofound.europa.eu/ The research paper sets out costs of absences across Europe, details of strategies to reduceworkplace absences, models of good practice and is accompanied by a document PreventingAbsences at the Workplace – Portfolio of Good Practicehttp://www.eurofound.europa.eu/pubdocs/1997/15/en/1/ef9715en.pdf

Other Links
Comptroller and Auditor General Report 2009 http://www.audgen.gov.ie/documents/vfmreports/69_Managing_Sickness_Absences.pdf
National Service Indicators
http://www.lgmsb.ie/en/publication-category/service-indicator-reports-2004-2010
_____________________________________________________________________Local Government Audit Service, VFM Unit
117