local distribution companies 25% of the customer bill
TRANSCRIPT

HORIZON UTILITIES CORPORATION and horizon UTILITIES Looking beyond… & Design are registered trade-marks in Canada of Horizon Holdings Inc. and are used under license by Horizon Utilities Corporation.
September 20, 2013
Local Distribution Companies
– 25% of the Customer Bill
EUCI’s The Future of Electricity Prices in Ontario
and Key Canadian Markets
Neil Freeman, Vice President, Business Development

2
Horizon Utilities – who we are
• Serving 239,000
customers in Hamilton &
St. Catharines
• $565 million in assets –
one of Ontario’s largest
local utilities
• Municipally-owned 100%
and generating full
shareholder returns
• Pioneer of province-wide
conservation programs
• Industry leader in
sustainable development
• High customer satisfaction
• Extensive community
involvement

3
Horizon – bottom-line performer & industry leader
• First CEA member designated Sustainable Electricity CompanyTM
– 2013
• Both EDA Environmental Award & CEA Environmental Award – 2013
• Hamilton-Niagara’s Top Employers – 2012 and 2013
• Sustainable Hamilton Award of Merit – 2013
• CEA Sustainability Company of the Year – 2011 and 2012
• ISO 14001 Environmental Management System accreditation – 2011
• ISO 26000 Social Responsibility – first utility in Canada – 2011
• Global Reporting Initiative A+ sustainable development – 2010, 2011, 2012
• Ontario Energy Association Company of the Year – 2009
• OPG-EDA Performance Excellence Award – 2006

4
Ontario LDCs – gas and electric compared
NB: Graph does not include Hydro One Networks. Source: 2011 OEB yearbook
• 75 electric LDCs for 4.8 million customers
• 2 gas LDCs 3.4 million customers – Enbridge 2
million and Union 1.4 million + 3 small gas LDCs
• Smallest electric LDC is 1,200 customers and
largest is 1.2 million – 1,000X scale difference
• Only 8 > 100,000 customers
• Median 15,500 – 38 smaller, 38 larger
• Average 49,000 without Hydro One
• LDC numbers, scale differences and fragmentation are unique to Ontario
• LDC structure contributes to higher costs for customers

5
MEA (now EDA) submission to
Macdonald Committee 1996
ODSP Report 2012
Distribution’s “Total Bill” share 1996 & 2012
• Distribution costs have increased from 15% to 22% of the total bill
since industry restructuring in the 1990s
• Increase is actually from 15% to 25% when taxes are not included
NB: EDA refers to Electricity Distributors Association and ODSP refers to the Ontario Distribution Sector Review Panel.

6
Residential rate comparison – 800 kWh
Source: 2013 OEB rate orders
$30 to $40 = 33%
spread, excluding
outliers

7
Small commercial rate comparison – 13,000 kWh
Source: 2013 OEB rate orders
$279 to $435 = 56%
spread, excluding
outliers

8
Light industrial rate comparison – 350 kW
Source: 2013 OEB rate orders
$2,230 to $3,365 =
50% spread,
excluding outliers

9
Manufacturing rate comparison – 3,500 kW
Source: 2013 OEB rate orders
$20,000 to $33,500
= 68% spread,
excluding outliers

10
Cost allocations across rate classes – 19 LDC
Horizon and 18 LDC neighbours
Source: Data based on Most current OEB Cost of Service rate filings for each LDC.

11
All LDCs – revenue, OM&A and NI per customer
Source: 2011 OEB Yearbook. NB: Data does not include Hydro One.
• Wide differences on controllable cost and revenue among LDCs
• Wide differences not translated into higher net income

12
All LDCs by customer scale – revenue, OM&A and NI
Source: 2011 OEB Yearbook. NB: does not include Hydro One.
• On balance, larger LDCs are more profitable, operating with much
lower costs, and a tighter band of revenue on a per customer basis

13
Sector OM&A, O&M, Administration cost breakdown
Source: 2009-11 OEB Yearbooks. NB: Data does not include Hydro One.
• Admin costs (green) are what
differentiates LDC the most
• O&M (red) is relatively flat
across LDCs by comparison

14
Administration costs are largest part of OM&A
• Admin. is 59% of total municipal LDC OM&A costs – $575M of $976M
Administration is 52% of total sector OM&A – $790M of $1.51B
Source: 2012 OEB Yearbook.
% Administration per customer
% Operations & Maintenance per customer

15
Administration growing faster than O&M
Source: 2002-12 OEB RRR filings and Yearbooks.

16
O&M cost composition – all LDCs are not the same
• Tx connected LDCs generally have more assets per customer
– Particularly distribution feeders, stations
– Result is more O&M and capital work per customer
• Dx connected LDCs generally have fewer assets per customer
– Feeders and stations, in many cases, belong to the host LDC
Dx Connected (embedded) LDC Tx Connected LDC

17
LDC O&M and Gross Fixed Assets
Source: 2011 OEB Yearbook. NB: Data does not include Hydro One.
• Larger LDCs have more assets per customer
• Smaller LDCs should have lower O&M

18
• “Ontario’s electricity distribution sector is at an historic turning point”
Ontario Distribution Sector Panel – findings
• $16.6 billion of renewal investment
required from LDCs over next 20 years
• Another $4 billion to grow and serve
new customers
• $1.7 billion in cost savings in first 10
years with LDC consolidation
• $1.3 billion in avoided infrastructure
investment after first 10 years with LDC
consolidation
• Panel recommended consolidation to 8
to 12 regional utilities, but ran into
trouble on implementation
19
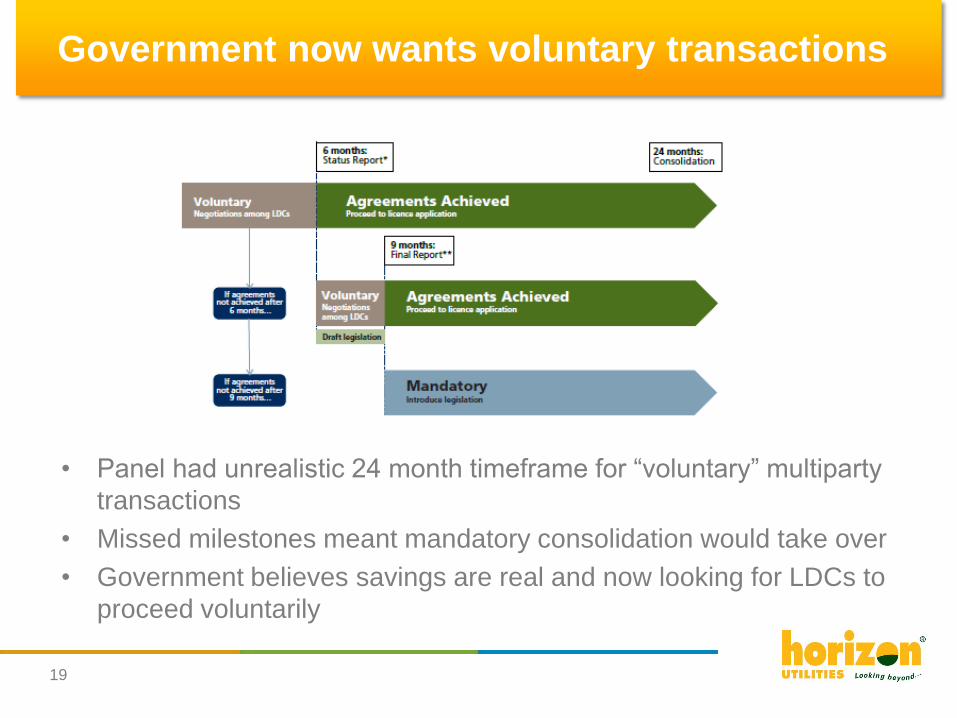
Government now wants voluntary transactions
• Panel had unrealistic 24 month timeframe for “voluntary” multiparty
transactions
• Missed milestones meant mandatory consolidation would take over
• Government believes savings are real and now looking for LDCs to
proceed voluntarily

20
• Horizon’s mergers have allowed it to outperform the LDC sector
Horizon’s mergers and OM&A story
Source: 1997 Ontario Hydro MUD Bank and 2002-2012 OEB RRR filings and Yearbooks.
OM&A per customer per year

21
Hydro Ottawa, PowerStream, Veridian mergers and OM&A
Source: 1997 Ontario Hydro MUD Bank and 2012 OEB Yearbook
• Other large LDC mergers have also outperformed the sector
OM&A per customer per year

22
OM&A comparison – large LDC mergers – 2002-12
NB: Figures are OM&A per customer per year. Source: 2002-12 OEB RRR filings and Yearbook.
NB: Metric is Operation, Maintenance and Administration per customer per year

23
Admin cost comparison – large LDC mergers – 2003-12
NB: Figures are Administration per customer per year. Source: 2003-12 OEB RRR filings and Yearbook.
NB: Metric is Administration Cost per customer per year

24
Distribution revenue comparison – 2003-12
Source: 2003-12 OEB RRR filings and Yearbook.
NB: Metric is Distribution Revenue per customer per year

25
• Hydro One acquired LDC customers pay approx. $25 more per month when
2013 residential rates are compared with 1998 for all 305 MEUs
Municipalities now with Hydro One pay more
1998 – all rates for 305
MEUs prior to industry
restructuring
2013 – all Hydro One
acquisitions at Urban
Density rates
2013 – all LDCs not
sold to Hydro One at
new LDC’s rates
2013 – all Hydro One
acquisitions at
Medium Density rates
Residential Rate Comparison at 1000 kWh
Source: 2013 OEB rate orders.

26
Hydro One urban density – Owen Sound vs. Collingwood
• Owen Sound and Collingwood are
comparable communities
• Owen Sound (GBE) sold to Hydro
One in 2000
• Collingwood (COLLUS) stayed on
its own, later selling 50% to
PowerStream in 2012
• Monthly total bills in Owen Sound
and Collingwood were comparable
in 1998
• Owen Sound residential customers
now pay $24 more per month and
$288 more per year than customers
in Collingwood
• Owen Sound, with more than 3,000
customers, gets Hydro One’s
“Urban Density” (UR) rate
Source: Ontario Hydro MUD Bank and OEB Rate Calculator. NB: Residential rate comparison at 1000 kWh.
2013 rates calculated in June 2013.
Residential rate comparison at 1000 kWh

27
Hydro One medium density – Meaford and Thornbury
• Meaford and Thornbury are
comparable small communities
• Both had similar monthly bills in 1997,
with Meaford being lower
• Meaford sold to Hydro One in 2000
• Thornbury sold to Collingwood
(COLLUS) in 2000 (with COLLUS
selling 50% to PowerStream in 2012)
• Meaford residential customers of
Hydro One now pay $41 more per
month and $492 more per year than
Thornbury customers pay to
COLLUS
• Meaford, with less than 3,000
customers, gets Hydro One “Medium
Density” (R1) rate
Source: Ontario Hydro MUD Bank and OEB Rate Calculator. NB: Residential rate comparison at 1000 kWh.
2013 rates calculated in June 2013.
Residential rate comparison at 1000 kWh

28
Is benchmarking a driver of consolidation?

29
• OEB current and proposed benchmarking levels playing field for scale
– No regulatory advantage for scale
– 5 of 10 of “best performing” LDCs have less than 10,000 customers
• Framework has not been an effective driver for LDC consolidation
OEB benchmarking rankings – 2012
Source: OEB, “Third Generation Incentive Regulation Stretch Factor Updates for 2013” (November 27, 2012).

30
• OEB benchmarking has handicapped LDCs for scale – assumes
they have no options, like mergers or outsourcing, to get scale
• OEB econometric model holds that every additional unit of LDC
scale incurs a 0.95% increase in controllable costs (OM&A)
• Effect is that larger LDCs are expected to have lower costs and this
handicap is built into the benchmarking
3rd GIRM econometric benchmarking adjusts for scale
Source: PEG Report, “Benchmarking the Costs of Ontario Power Distributors” (March, 2008)
“Our research suggests that incremental (albeit modest) scale
economies can still be realized from output growth by most distributors
in Ontario. For example, at sample mean values of our three output
variables, the sum of the estimated output elasticities is 0.95. Thus, a
1% increase in output is estimated to raise OM&A expenses by
0.95%.”
Pacific Economics Group (PEG) Report , March 2008, pg. 54
(emphasis added)

31
OEB 3rd GIRM also had peer groups based on scale
Source: OEB, Reporting and Record-keeping Requirements (RRR), 2005-2007.
• Benchmarking based on total OM&A, but O&M cost is largely flat across the groups
• Administration is the distinguishing feature of LDC peer groups, but it does not relate
to geography or undergrounding – the key peer group criteria

32
4th GIRM – merger disincentives
Source: PEG Report, “Empirical Research in Support of Incentive Rate Setting in Ontario” (May, 2013).
• OEB’s new econometric benchmarking framework – peer grouping
has been abandoned – acts as a disincentive for mergers
• Benchmarking model, by leveling playing field for scale, prejudges
merger savings as attained
• Result is that merger cost savings are not translated into improved
benchmarking scores for new utility – new LDC can only stay even
by attaining the cost savings the model expects
• Benchmarking model ranks merged LDC with expected
performance and thereby creates a far more challenging
benchmark for newly merged distributor
• Even if a merger results in lower unit costs, new distributor can
actually be penalized and have a worse benchmarking score than
the two distributors prior to the merger

33
• Regional energy planning, if it takes hold, could be instrumental to
developing a competitive electricity market in Ontario
• Regional LDC consortiums for planning infrastructure could be
beginning of contracting power regionally
Regional planning and electricity markets in Ontario
ODSP’s 8 Regions – Increases marketplace for
transactions – ODSP
recommended eight
LDCs
– Lessens / removes need
for Province or a
provincial agency to act
as a counterparty
– Lessens problem of there
being a single / dominant
counterparty