local climate and energy program model design guide ... · the central new york climate change...
TRANSCRIPT
Local Climate and Energy Program Model Design Guide: Enhancing Value and Creating Lasting Programs
U.S. Environmental Protection Agency | April 2015 | www.epa.gov/climateshowcase
This guide was developed by the U.S. Environmental Protection Agency’s Climate Showcase
Communities Program,1 which provided grant funding, technical support, and peer-to-peer
information-sharing opportunities to 50 communities around the United States to develop and
implement replicable models for local programs to reduce greenhouse gas emissions. This guide
draws on the experience and examples of Climate Showcase Communities as they developed
innovative models for programs that could be financially viable over the long term and replicated
in other communities. Although each local program and its context are unique, we hope the
concepts described in this guide—and the examples from Climate Showcase Communities—will
be useful to a broad range of local programs, from those just being developed to mature programs
looking to refine their current program models.
1 www.epa.gov/statelocalclimate/local/showcase/index.html

Local Climate and Energy Program Model Design Guide Contents i
Contents Introduction .................................................................................................................................... 1
Program Models: The Foundation of Program Viability ............................................................ 2
Evaluating and Evolving Your Program Model ........................................................................... 7
Focus Area: Value Creation and Program Revenues .................................................................... 11
Turning Value into Revenue ..................................................................................................... 13
Value Map ................................................................................................................................. 14
Resources: Value Creation and Program Revenues ................................................................. 15
Focus Area: Creating Effective Partnerships ................................................................................. 16
Partnerships and Financial Viability .......................................................................................... 17
Partner Map .............................................................................................................................. 19
Resources: Creating Effective Partnerships .............................................................................. 21
Focus Area: Services...................................................................................................................... 22
Services and Financial Viability ................................................................................................. 23
Services Map ............................................................................................................................. 24
Resources: Services ................................................................................................................... 27
Conclusion ..................................................................................................................................... 28
Appendix A: Program Model Template ........................................................................................ 29
Appendix B: Value Map Worksheet .............................................................................................. 30
Appendix C: Partner Map Worksheet ........................................................................................... 31
Appendix D: Services Map Worksheet.......................................................................................... 32
Appendix E: Potential Audience Segments ................................................................................... 33
Appendix F: Performance Indicators ............................................................................................ 34

ii Local Climate and Energy Program Model Design Guide
This page is intentionally left blank.
Local Climate and Energy Program Model Design Guide Introduction 1
Introduction Around the country, many local governments
and their partners are taking up the challenge
of implementing programs that help local
residents and businesses reduce greenhouse
gas emissions and energy use, create jobs,
and save money. Although climate change
has global impacts, local programs play a
key role in reducing the carbon footprint of
residents and businesses, and building
stronger, healthier communities. Some
existing programs were created by an initial
investment of public funds (including, but not limited to, economic stimulus funds from the
American Recovery and Reinvestment Act) to get new programs off the ground, and test and
refine program designs that can be replicated in other communities. As these programs near the
end of initial start-up funding—and as other communities embark on new programs—local
governments and their partners are evaluating how they will raise revenue and deliver services
over the long term—in short, how they will become financially viable.
Whether a program is adapting to changing circumstances or just starting out, it is useful to think
about a design that will keep the program financially solvent and viable over the long term. This
guide was developed for local climate and clean energy (i.e., energy efficiency, renewable
energy, and combined heat and power) program implementers to help create or transition to
program designs that are viable over the long term by considering how programs create and
deliver value for target audiences and partners, how they raise revenue, and how they can operate
cost effectively. This guide also has universal applications for basic principles of program design,
but is based on experiences with climate and energy programs.
This guide emphasizes strategies for:
This guide was developed for local climate
and clean energy program implementers to
help create or transition to program designs
that are viable over the long term by
considering how programs create and
deliver value for target audiences and
partners, how they raise revenue, and how
they can operate cost effectively.
Creating value and turning it into adequate program revenues,
Developing effective partnerships that leverage each partner’s strengths to enhance value and
strengthen the bottom line, and
Delivering a set of services that meet your audiences’ needs and align with your
organization’s strengths and resources.
Specifically, the guide:
Presents a model framework that can be adapted to fit your program design and guide a
structured consideration of alternative options;
2 Introduction Local Climate and Energy Program Model Design Guide
Takes an in-depth look at three focus
areas of viable program models:
Value creation for program
audiences and program revenues,
Creating effective partnerships,
and
Program services;
Provides worksheets and techniques for
analyzing and refining your program
model; and
Describes lessons, case examples, and
resources derived from the experience of
more than 50 local climate and clean
energy programs around the country.
Although there is no single, prescriptive solution for creating programs that are viable over the
long term, this guide provides a structured approach for you to develop an approach for realizing
these three strategies by thinking creatively about your program model.
Local climate and energy programs can
increase environmental sustainability and
add value to local communities in many
ways, including:
Reducing greenhouse gas emissions,
Improving air quality and public health,
Creating green jobs and building skills,
Increasing home values,
Creating stronger communities, and
Decreasing energy bills for building
owners and tenants.
Program Models: The Foundation of Program Viability
A program model describes how a program creates, delivers, and captures value in pursuit of an
overarching goal, such as creating a vibrant local economy with an ever-decreasing carbon and
energy footprint. Specific Climate Showcase Communities (CSC) program examples illustrate
how they have created value in their communities:
The Sustainable Transportation for a Sustainable Future program in Salt Lake City, Utah,
improves citizens’ quality of life by using social media to provide participants with a clear
and concise list of choices they can make to reduce their environmental impact and save
money. Through the program’s Clear the Air Challenge, an online interface tracks the results
of participating residents’ choices and shares the results with their neighbors. Since the
Challenge’s inception in 2009, participants have avoided driving more than 5.2 million
single-occupant vehicle-miles. To find out more about this program, see its profile
(www.epa.gov/statelocalclimate/local/showcase/sustainable-transportation.html) and the
Clear the Air Challenge website (cleartheairchallenge.org).
Local Climate and Energy Program Model Design Guide Introduction 3
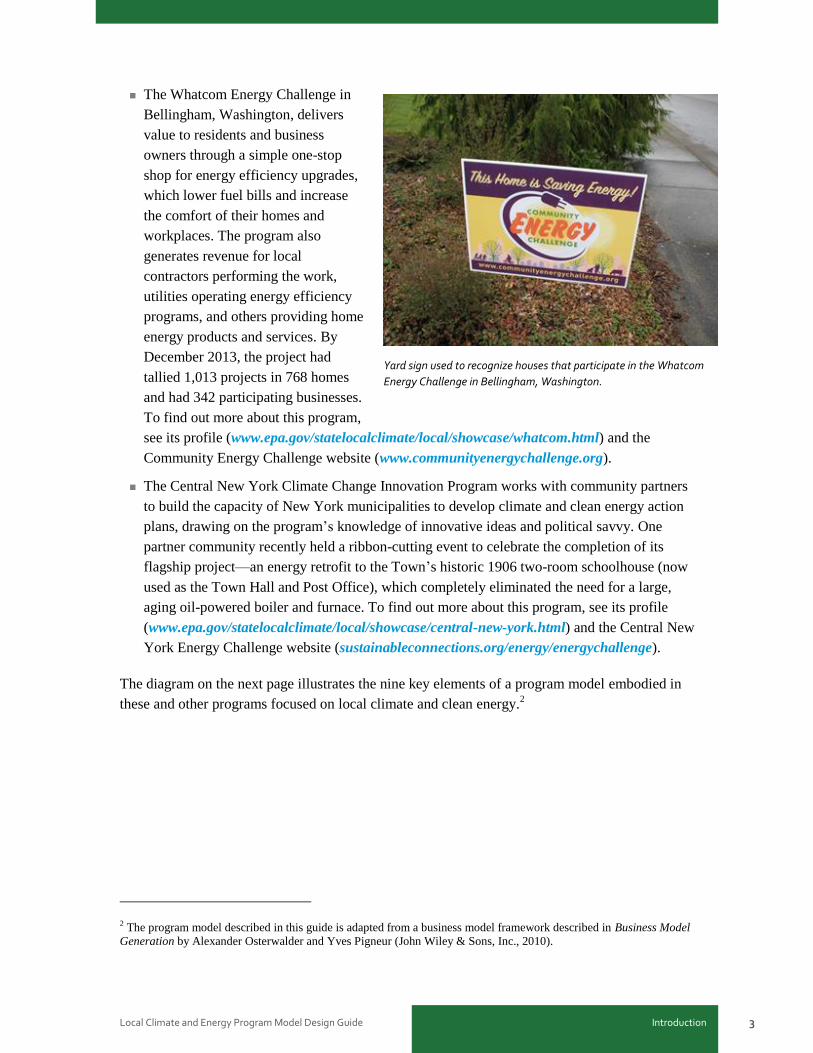
The Whatcom Energy Challenge in
Bellingham, Washington, delivers
value to residents and business
owners through a simple one-stop
shop for energy efficiency upgrades,
which lower fuel bills and increase
the comfort of their homes and
workplaces. The program also
generates revenue for local
contractors performing the work,
utilities operating energy efficiency
programs, and others providing home
energy products and services. By
December 2013, the project had
tallied 1,013 projects in 768 homes
and had 342 participating businesses.
To find out more about this program,
see its profile (www.epa.gov/statelocalclimate/local/showcase/whatcom.html) and the
Community Energy Challenge website (www.communityenergychallenge.org).
The Central New York Climate Change Innovation Program works with community partners
to build the capacity of New York municipalities to develop climate and clean energy action
plans, drawing on the program’s knowledge of innovative ideas and political savvy. One
partner community recently held a ribbon-cutting event to celebrate the completion of its
flagship project—an energy retrofit to the Town’s historic 1906 two-room schoolhouse (now
used as the Town Hall and Post Office), which completely eliminated the need for a large,
aging oil-powered boiler and furnace. To find out more about this program, see its profile
(www.epa.gov/statelocalclimate/local/showcase/central-new-york.html) and the Central New
York Energy Challenge website (sustainableconnections.org/energy/energychallenge).
The diagram on the next page illustrates the nine key elements of a program model embodied in
these and other programs focused on local climate and clean energy.2
Yard sign used to recognize houses that participate in the Whatcom
Energy Challenge in Bellingham, Washington.
2 The program model described in this guide is adapted from a business model framework described in Business Model
Generation by Alexander Osterwalder and Yves Pigneur (John Wiley & Sons, Inc., 2010).
4 Introduction Local Climate and Energy Program Model Design Guide
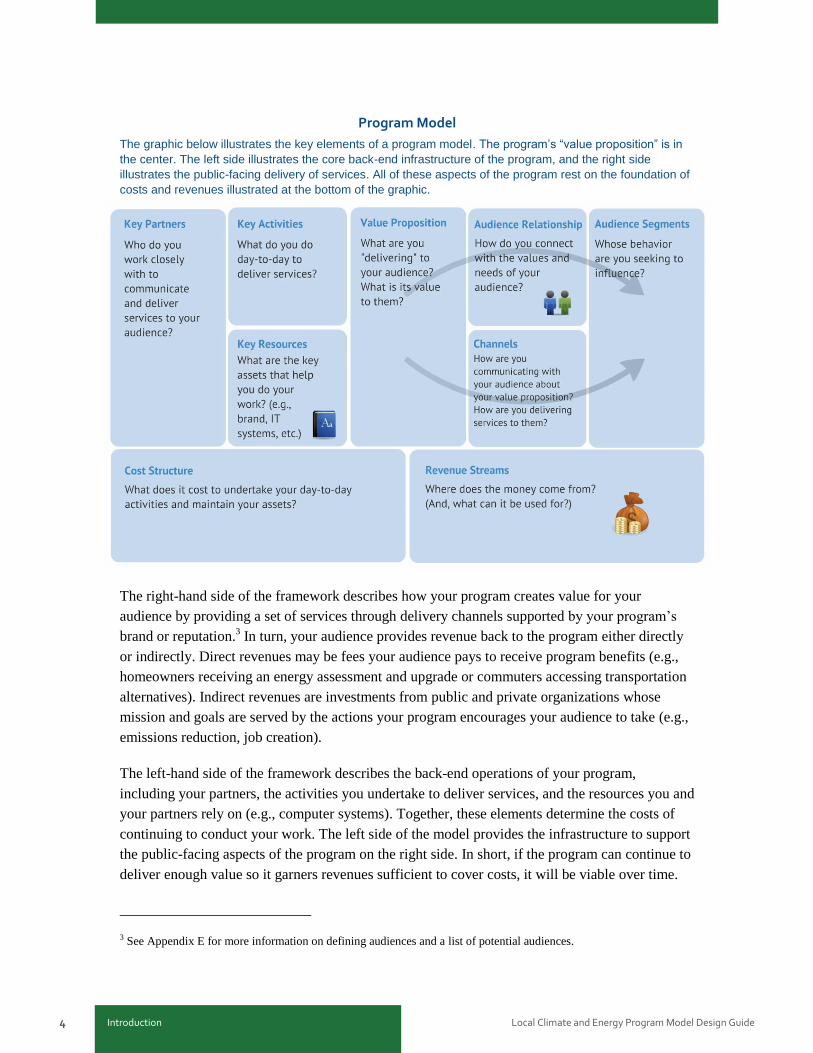
Program Model
The graphic below illustrates the key elements of a program model. The program’s “value proposition” is in
the center. The left side illustrates the core back-end infrastructure of the program, and the right side
illustrates the public-facing delivery of services. All of these aspects of the program rest on the foundation of
costs and revenues illustrated at the bottom of the graphic.
The right-hand side of the framework describes how your program creates value for your
audience by providing a set of services through delivery channels supported by your program’s
brand or reputation.3 In turn, your audience provides revenue back to the program either directly
or indirectly. Direct revenues may be fees your audience pays to receive program benefits (e.g.,
homeowners receiving an energy assessment and upgrade or commuters accessing transportation
alternatives). Indirect revenues are investments from public and private organizations whose
mission and goals are served by the actions your program encourages your audience to take (e.g.,
emissions reduction, job creation).
The left-hand side of the framework describes the back-end operations of your program,
including your partners, the activities you undertake to deliver services, and the resources you and
your partners rely on (e.g., computer systems). Together, these elements determine the costs of
continuing to conduct your work. The left side of the model provides the infrastructure to support
the public-facing aspects of the program on the right side. In short, if the program can continue to
deliver enough value so it garners revenues sufficient to cover costs, it will be viable over time.
3 See Appendix E for more information on defining audiences and a list of potential audiences.
Local Climate and Energy Program Model Design Guide Introduction 5
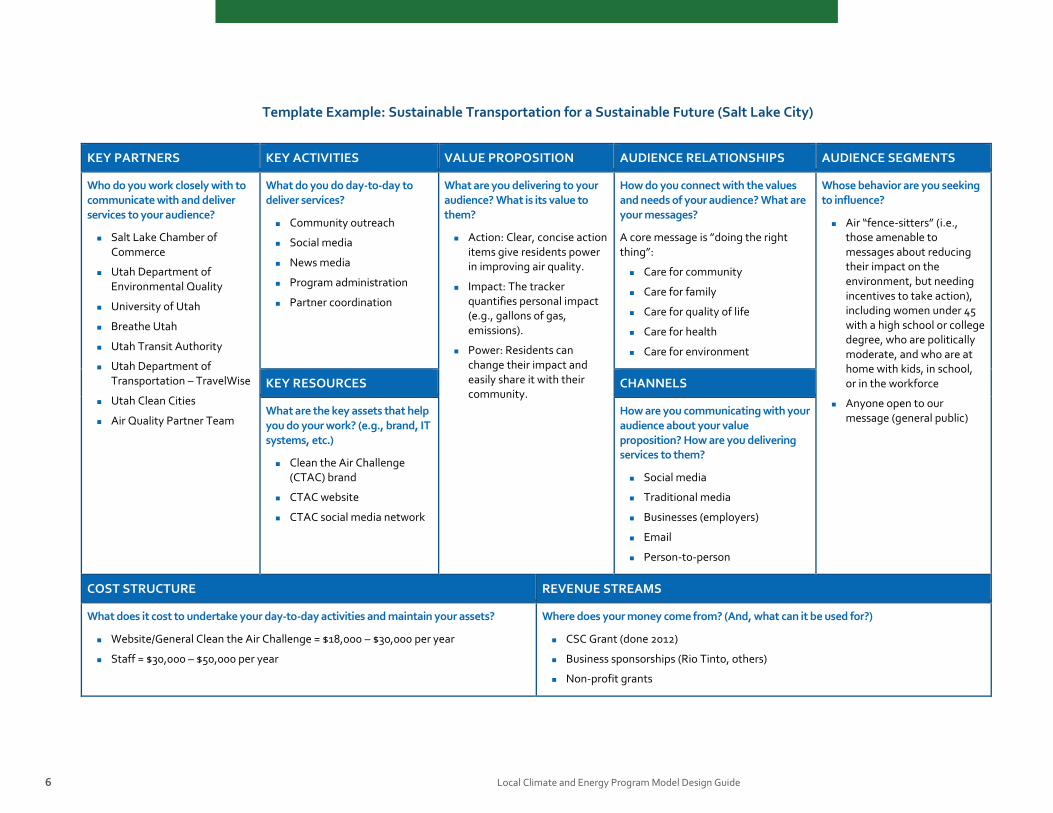
The framework can be used to map key elements of programs. The template example on page 6
illustrates how the Sustainable Transportation for a Sustainable Future program in Salt Lake City,
Utah, mapped its Clear the Air Challenge program using the program design template. The
program focused on a market segment of “fence-sitters” who were amenable to messages about
reducing their impact on the environment, but needed incentives to take action. The program’s
core value proposition was providing this audience (and any others that may be interested) with a
focused set of activities to undertake and tools to make it easy to track and gain recognition for
undertaking them. It reached its audience through traditional and innovative channels with a
message focused on “doing the right thing.” The city worked with several stakeholder partners
with aligned missions that could provide resources to the program and help it reach its target
audience. Given its intensive focus on outreach and behavior change, the program focused its
core investments on outreach activities and the development of its brand, website, and social
media network. As illustrated in the template, program revenues initially came from federal and
non-profit grants, as well as local business sponsorship. Over time, the Salt Lake City Chamber of
Commerce—a key partner from the outset—adopted the program and provided it with a new
source of funding.
Appendix A includes a template for you to develop a model for your program.
6 Introduction Local Climate and Energy Program Model Design Guide
Template Example: Sustainable Transportation for a Sustainable Future (Salt Lake City)
KEY PARTNERS KEY ACTIVITIES VALUE PROPOSITION AUDIENCE RELATIONSHIPS AUDIENCE SEGMENTS
Who do you work closely with to communicate with and deliver services to your audience?
Salt Lake Chamber of Commerce
Utah Department of Environmental Quality
University of Utah
Breathe Utah
Utah Transit Authority
Utah Department of Transportation – TravelWise
Utah Clean Cities
Air Quality Partner Team
What do you do day-to-day to deliver services?
Community outreach
Social media
News media
Program administration
Partner coordination
What are you delivering to your audience? What is its value to them?
Action: Clear, concise action items give residents power in improving air quality.
Impact: The tracker quantifies personal impact (e.g., gallons of gas, emissions).
Power: Residents can change their impact and easily share it with their community.
How do you connect with the values and needs of your audience? What are your messages?
A core message is ”doing the right thing”:
Care for community
Care for family
Care for quality of life
Care for health
Care for environment
Whose behavior are you seeking to influence?
Air “fence-sitters” (i.e., those amenable to messages about reducing their impact on the environment, but needing incentives to take action), including women under 45 with a high school or college degree, who are politically moderate, and who are at home with kids, in school, or in the workforce
Anyone open to our message (general public)
KEY RESOURCES CHANNELS
What are the key assets that help you do your work? (e.g., brand, IT systems, etc.)
Clean the Air Challenge (CTAC) brand
CTAC website
CTAC social media network
How are you communicating with your audience about your value proposition? How are you delivering services to them?
Social media
Traditional media
Businesses (employers)
Person-to-person
COST STRUCTURE REVENUE STREAMS
What does it cost to undertake your day-to-day activities and maintain your assets?
Website/General Clean the Air Challenge = $18,000 – $30,000 per year
Staff = $30,000 – $50,000 per year
Where does your money come from? (And, what can it be used for?)
CSC Grant (done 2012)
Business sponsorships (Rio Tinto, others)
Non-profit grants
Local Climate and Energy Program Model De Introduction 7
Evaluating and Evolving Your Program Model
The program model template can help you
evaluate your current program model and
suggest opportunities for refining it.
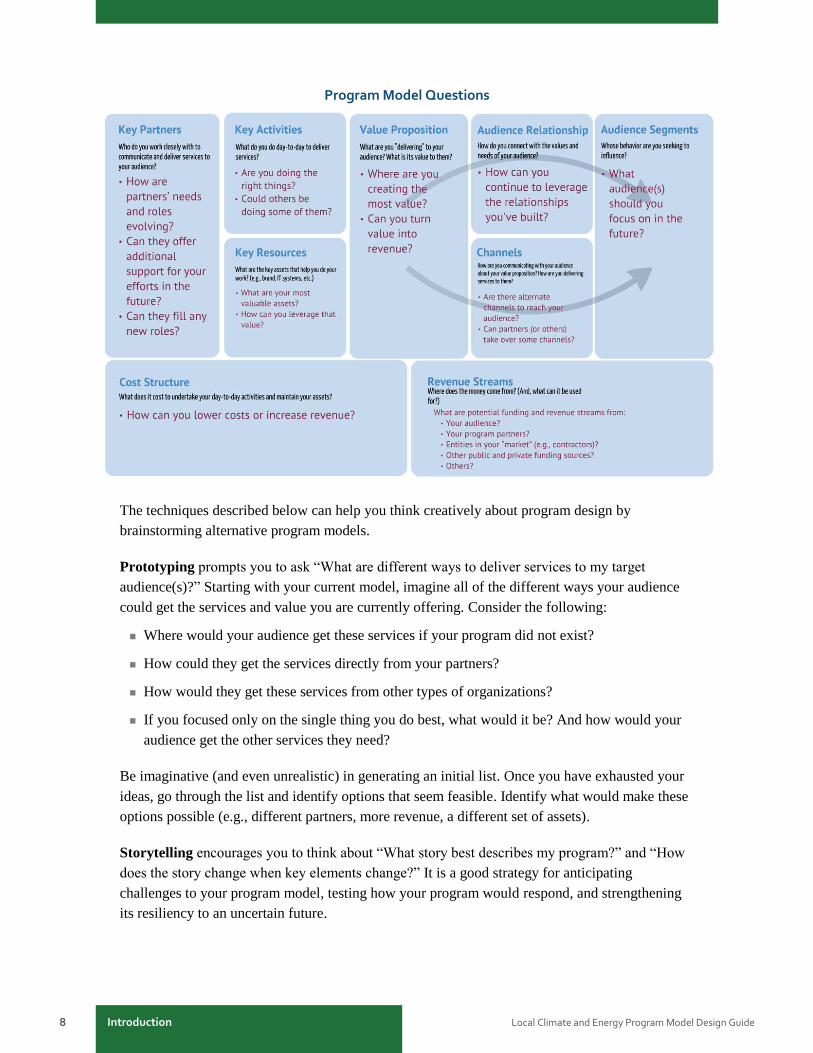
Questions in red in the diagram on page 8
illustrate the types of questions you can ask
to refine your model. For example:
Where are you creating the most value?
Can you turn value into revenue?
Are you providing cost-effective services
that deliver the most value to your
audience?
Could others provide some of these
services?
Use the program model template in
Appendix A to think about these questions
for your program and how you might adjust
aspects of your program model to add value
for your audience in different ways. Later
sections of this document will walk you
through this process for specific aspects of your program related to revenues, partnerships, and
services.
For ongoing programs, you can use the program model to reflect back on program design and
operational decisions and lessons learned. For example, you could modify the questions in the
diagram to provide a retrospective assessment of your program. Instead of beginning with “What
audience(s) should you focus on in the future?,” you could ask “What audiences have I focused
on in the past who delivered the most value for my program in terms of its goals thus far?” and
then use lessons from how you engaged those audiences to define future strategies. The box
above provides more information on assessing progress to date using previously established
performance measures. Reflecting on successes and lessons learned puts you in a position to look
forward. You can also use the program model template to assess how the operating context for
your program may be changing and how you should adapt.
Identifying Lessons Learned and Measuring Program Performance
For existing local climate and energy
programs, a key strategy for refining program
models is to reflect on what has worked well
(and not so well) in the past. Measuring
performance and identifying lessons learned
from implementation to date will help you
evaluate strategies and tactics, and help
guide refinements to your program model.
One way programs can evaluate program
effectiveness and progress is through
performance indicators. Performance
indicators measure progress toward
program goals and objectives. For more
information on performance indicators and
how they can be integrated into program
design, see Appendix F.
8 Introduction Local Climate and Energy Program Model Design Guide
Program Model Questions
The techniques described below can help you think creatively about program design by
brainstorming alternative program models.
Prototyping prompts you to ask “What are different ways to deliver services to my target
audience(s)?” Starting with your current model, imagine all of the different ways your audience
could get the services and value you are currently offering. Consider the following:
Where would your audience get these services if your program did not exist?
How could they get the services directly from your partners?
How would they get these services from other types of organizations?
If you focused only on the single thing you do best, what would it be? And how would your
audience get the other services they need?
Be imaginative (and even unrealistic) in generating an initial list. Once you have exhausted your
ideas, go through the list and identify options that seem feasible. Identify what would make these
options possible (e.g., different partners, more revenue, a different set of assets).
Storytelling encourages you to think about “What story best describes my program?” and “How
does the story change when key elements change?” It is a good strategy for anticipating
challenges to your program model, testing how your program would respond, and strengthening
its resiliency to an uncertain future.
Local Climate and Energy Program Model De Introduction 9
Starting with your current program model, write down a few sentences describing your current
program story from the perspective of a program employee or customer. Now, change a
significant element of the story to reflect a possible future event that creates a challenge for the
program.
For example, the story for an energy efficiency program customer might go something like this:
My house was always cold in the winter and my heating bills were really high. I saw a yard sign
on my neighbor’s lawn announcing a program that helps you figure out how to save energy in
your home. I called, and they connected me to a great contractor who went through my house top
to bottom. She showed me a list of things I could do to save energy and save money. Now, my
house is warmer and I can see the savings from my heating bill are already paying for the work.
Now, retell the end of the story if the narrative would have included twists such as this:
… I called, and they connected me to a contractor who missed two appointments, did not
explain things well, and left a big mess.
… He showed me a list of things I could do to save energy and save money, but there is no
way I could pay that much—even if I ended up saving money over the long term.
How would your program need to change to make sure the story—even with these twists—still
resulted in a story you would like to tell? In the case of the unreliable contractor, you may realize
you need a customer call center to quickly resolve problems and/or a contractor evaluation and
rating system to help your program and customers identify top-performing contractors and
discontinue relationships with low performers. In the case of the customer balking at upfront
costs, you may realize your program needs to help connect customers with available financial
rebates from local utilities—or develop an energy efficiency financing program that provides
customers with funds for initial investments that can be paid off over time through energy
savings.
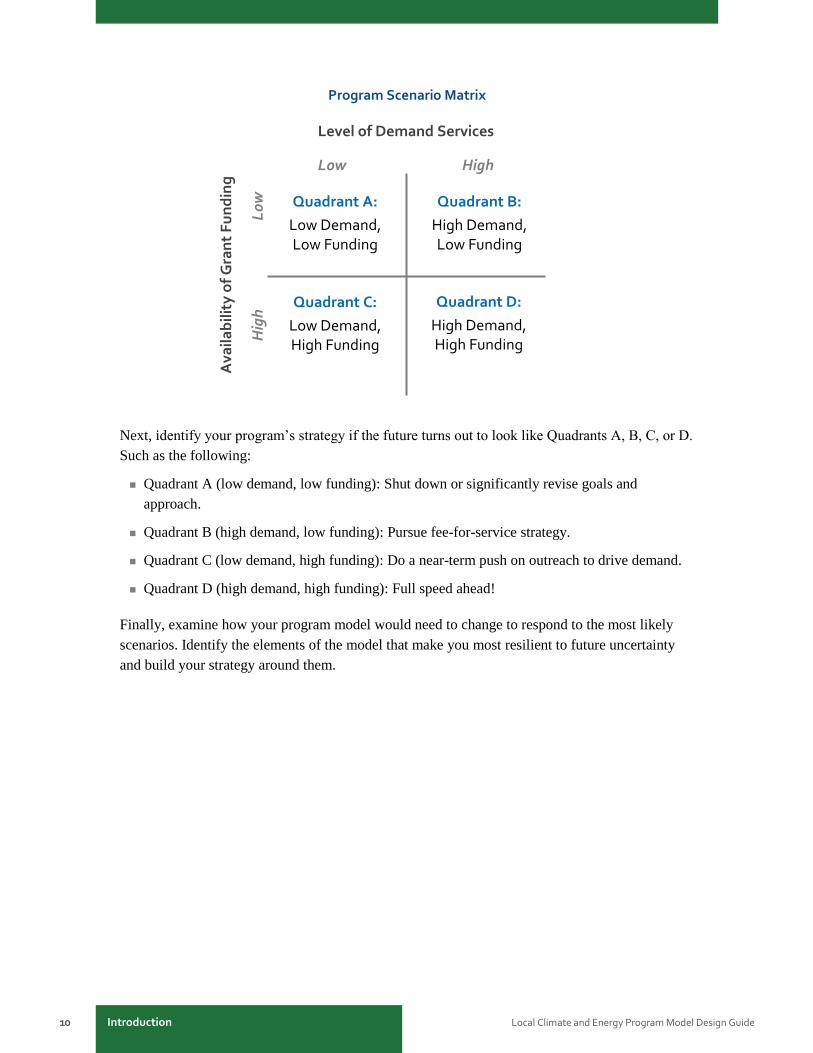
Scenarios allow you to answer the question, “How can my program prepare for the unknown?”
Starting with your current program model, identify two things about the future that are very
important to how your program operates, but are currently uncertain. For example, (1) there is
uncertainty about whether demand for services will increase rapidly or slowly, and (2) there is
uncertainty regarding the likelihood that grant funding will be available in the future. Place them
on a two-by-two axis, such as this one:
10 Introduction Local Climate and Energy Program Model Design Guide
Program Scenario Matrix
Level of Demand Services
Low High
Hig
h
Lo
w
Ava
ila
bil
ity
of
Gra
nt
Fu
nd
ing
Quadrant D:
High Demand, High Funding
Quadrant C:
Low Demand, High Funding
Quadrant A:
Low Demand, Low Funding
Quadrant B:
High Demand, Low Funding
Next, identify your program’s strategy if the future turns out to look like Quadrants A, B, C, or D.
Such as the following:
Quadrant A (low demand, low funding): Shut down or significantly revise goals and
approach.
Quadrant B (high demand, low funding): Pursue fee-for-service strategy.
Quadrant C (low demand, high funding): Do a near-term push on outreach to drive demand.
Quadrant D (high demand, high funding): Full speed ahead!
Finally, examine how your program model would need to change to respond to the most likely
scenarios. Identify the elements of the model that make you most resilient to future uncertainty
and build your strategy around them.
Local Climate and Energy Program Model De Focus Area: Value Creation and Program Revenues 11
Focus Area: Value Creation and Program Revenues At a workshop attended by nearly 50 climate
and clean energy programs around the
country, organizers polled participants about
their programs’ long-term financial viability.
The vast majority recognized that some
aspects of their programs would need to
change significantly as they transitioned from
initial federal grant funding to a program
model that was viable over the long term. In
an informal poll, most reported they “worried
a lot” about their future program design and
relatively few said they had “figured it out.”
What were they most worried about? Nearly
everyone in the room said they were worried
about where the money will come from.
Without adequate revenues, a program cannot
exist for long. The key to program revenue is
value creation. The more value you can
create for your target audiences through your
services—and the more effective your
delivery channels and partnerships are at
building your audience—the more options
you have for tapping revenue sources that
benefit from the value you create.
The Clinton Climate Initiative’s Home
Energy Affordability Loan (HEAL) program—which is transforming the market for residential
energy efficiency by working with companies to offer home efficiency upgrades as an employee
benefit—describes the concept of turning values into revenues in terms of “value pools.” These
pools are the reservoirs of value that a program builds for different types of audiences and
partners. Value pools for the HEAL program are illustrated on the next page.
Program profile:
www.epa.gov/statelocalclimate/local/show
case/littlerock.html
Program website:
www.clintonfoundation.org/clinton-
presidential-center/about/heal
Clinton Climate Initiative Home Energy Affordability Loan (HEAL) Program
The Clinton Climate Initiative’s HEAL
program works with companies to provide
their employees with incentives for
upgrading the energy efficiency of their
homes as an employee benefit. Several
communities around the country have
adopted the HEAL model as part of their
energy efficiency strategies.
12 Focus Area: Value Creation and Program Revenues Local Climate and Energy Program Model Design Guide
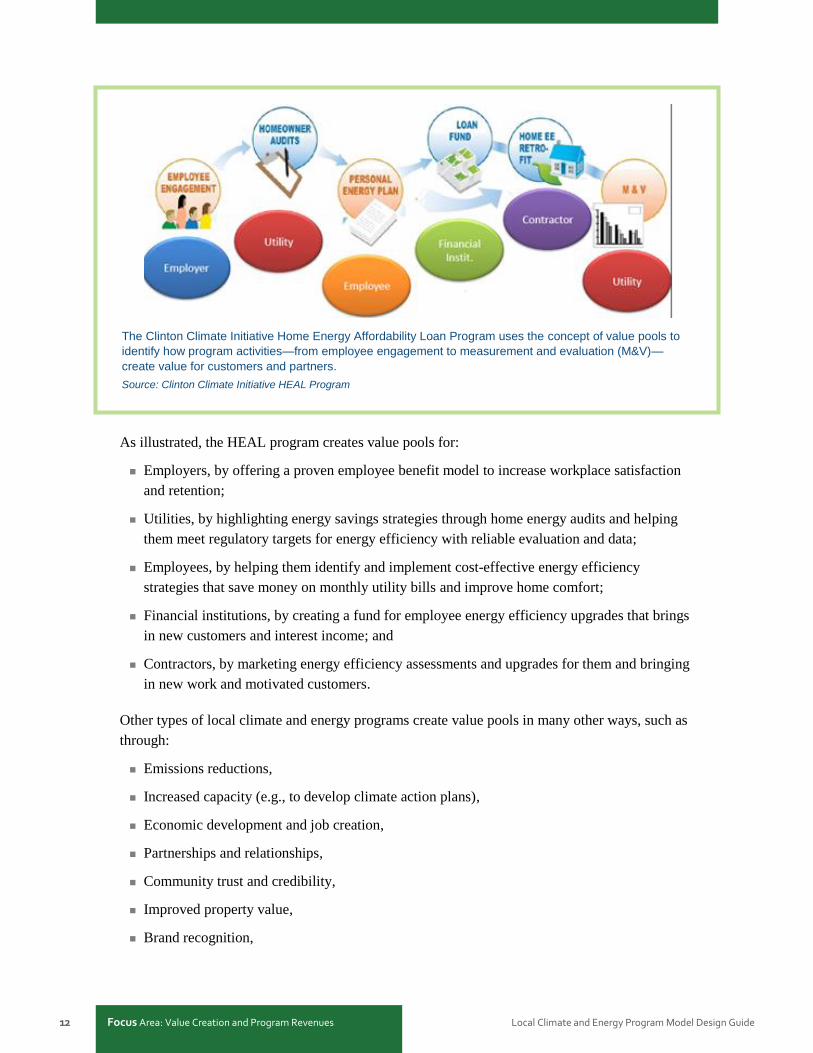
The Clinton Climate Initiative Home Energy Affordability Loan Program uses the concept of value pools to
identify how program activities—from employee engagement to measurement and evaluation (M&V)—
create value for customers and partners.
Source: Clinton Climate Initiative HEAL Program
As illustrated, the HEAL program creates value pools for:
Employers, by offering a proven employee benefit model to increase workplace satisfaction
and retention;
Utilities, by highlighting energy savings strategies through home energy audits and helping
them meet regulatory targets for energy efficiency with reliable evaluation and data;
Employees, by helping them identify and implement cost-effective energy efficiency
strategies that save money on monthly utility bills and improve home comfort;
Financial institutions, by creating a fund for employee energy efficiency upgrades that brings
in new customers and interest income; and
Contractors, by marketing energy efficiency assessments and upgrades for them and bringing
in new work and motivated customers.
Other types of local climate and energy programs create value pools in many other ways, such as
through:
Emissions reductions,
Increased capacity (e.g., to develop climate action plans),
Economic development and job creation,
Partnerships and relationships,
Community trust and credibility,
Improved property value,
Brand recognition,
Local Climate and Energy Program Model De Focus Area: Value Creation and Program Revenues 13
Data and information systems, and
Replicable program designs.
Turning Value into Revenue
Once you have identified value pools, think
about how you can turn value into revenue.
Entities that derive value from your program
may be willing to pay fees for those services,
such as the following:
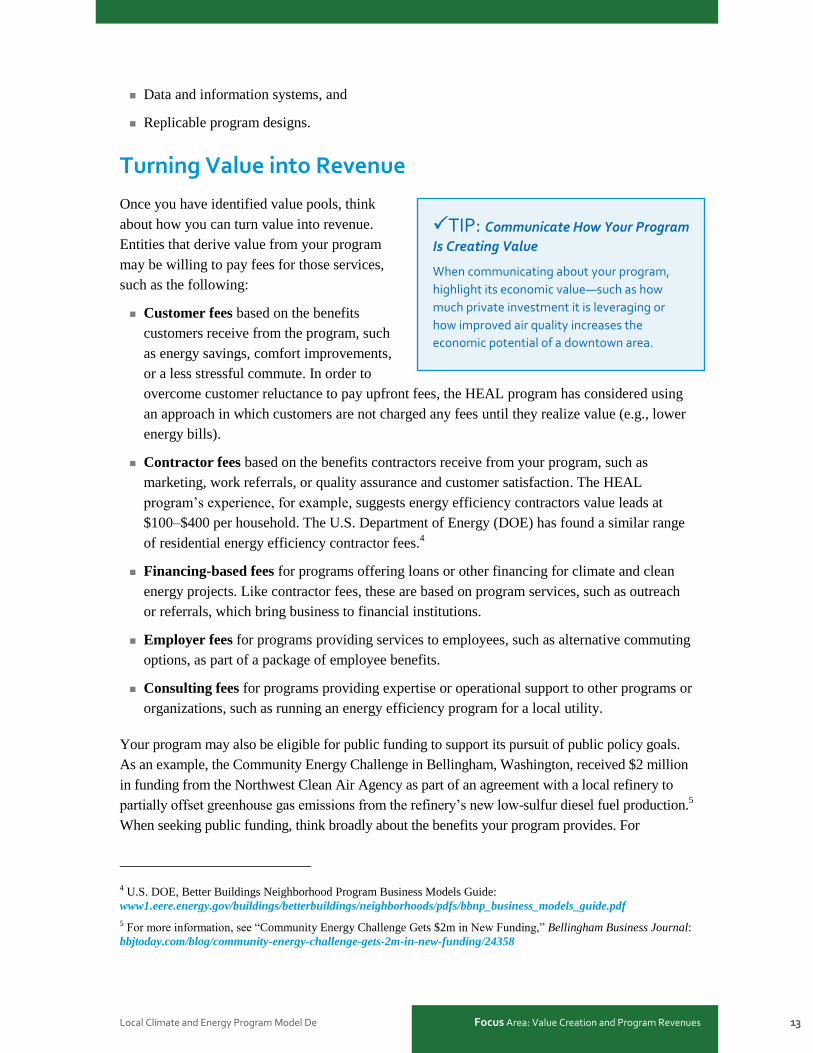
TIP: Communicate How Your Program
Is Creating Value
When communicating about your program,
highlight its economic value—such as how
much private investment it is leveraging or
how improved air quality increases the
economic potential of a downtown area.
Customer fees based on the benefits
customers receive from the program, such
as energy savings, comfort improvements,
or a less stressful commute. In order to
overcome customer reluctance to pay upfront fees, the HEAL program has considered using
an approach in which customers are not charged any fees until they realize value (e.g., lower
energy bills).
Contractor fees based on the benefits contractors receive from your program, such as
marketing, work referrals, or quality assurance and customer satisfaction. The HEAL
program’s experience, for example, suggests energy efficiency contractors value leads at
$100–$400 per household. The U.S. Department of Energy (DOE) has found a similar range
of residential energy efficiency contractor fees.4
Financing-based fees for programs offering loans or other financing for climate and clean
energy projects. Like contractor fees, these are based on program services, such as outreach
or referrals, which bring business to financial institutions.
Employer fees for programs providing services to employees, such as alternative commuting
options, as part of a package of employee benefits.
Consulting fees for programs providing expertise or operational support to other programs or
organizations, such as running an energy efficiency program for a local utility.
Your program may also be eligible for public funding to support its pursuit of public policy goals.
As an example, the Community Energy Challenge in Bellingham, Washington, received $2 million
in funding from the Northwest Clean Air Agency as part of an agreement with a local refinery to
partially offset greenhouse gas emissions from the refinery’s new low-sulfur diesel fuel production.5
When seeking public funding, think broadly about the benefits your program provides. For
4 U.S. DOE, Better Buildings Neighborhood Program Business Models Guide:
www1.eere.energy.gov/buildings/betterbuildings/neighborhoods/pdfs/bbnp_business_models_guide.pdf
5 For more information, see “Community Energy Challenge Gets $2m in New Funding,” Bellingham Business Journal:
bbjtoday.com/blog/community-energy-challenge-gets-2m-in-new-funding/24358
14 Focus Area: Value Creation and Program Revenues Local Climate and Energy Program Model Design Guide
example, climate and energy programs may
also be able to seek funding from economic
development agencies if they also create jobs,
or health agencies if they reduce health
hazards.
To fully fund programs, you may need to
seek out and assemble many revenue sources.
For example, the Whatcom County Energy
Challenge calculated the cost of providing its
services for home energy upgrades and then
analyzed how it could generate sufficient
revenue for such a project by assembling
revenue from customer fees, referral fees
from contractors, carbon mitigation, utility
payments, and state economic development
funding.
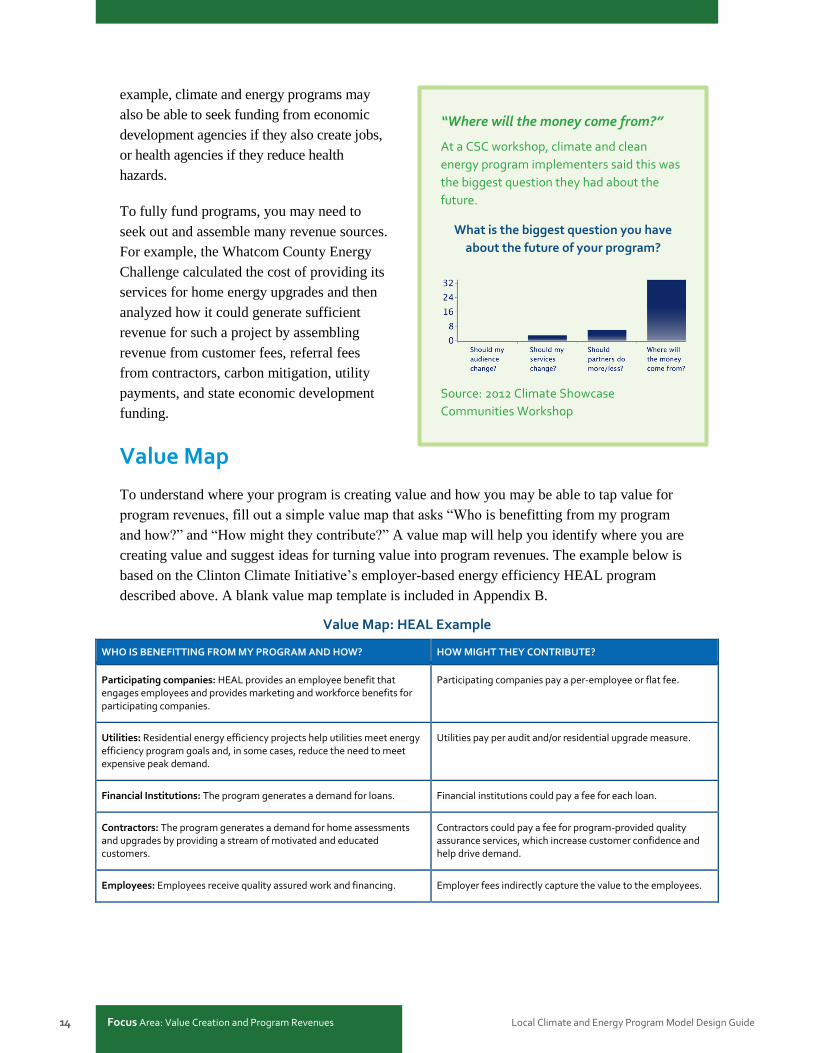
“Where will the money come from?”
At a CSC workshop, climate and clean
energy program implementers said this was
the biggest question they had about the
future.
What is the biggest question you have
about the future of your program?
Source: 2012 Climate Showcase
Communities Workshop
Value Map
To understand where your program is creating value and how you may be able to tap value for
program revenues, fill out a simple value map that asks “Who is benefitting from my program
and how?” and “How might they contribute?” A value map will help you identify where you are
creating value and suggest ideas for turning value into program revenues. The example below is
based on the Clinton Climate Initiative’s employer-based energy efficiency HEAL program
described above. A blank value map template is included in Appendix B.
Value Map: HEAL Example
WHO IS BENEFITTING FROM MY PROGRAM AND HOW? HOW MIGHT THEY CONTRIBUTE?
Participating companies: HEAL provides an employee benefit that engages employees and provides marketing and workforce benefits for participating companies.
Participating companies pay a per-employee or flat fee.
Utilities: Residential energy efficiency projects help utilities meet energy efficiency program goals and, in some cases, reduce the need to meet expensive peak demand.
Utilities pay per audit and/or residential upgrade measure.
Financial Institutions: The program generates a demand for loans. Financial institutions could pay a fee for each loan.
Contractors: The program generates a demand for home assessments and upgrades by providing a stream of motivated and educated customers.
Contractors could pay a fee for program-provided quality assurance services, which increase customer confidence and help drive demand.
Employees: Employees receive quality assured work and financing. Employer fees indirectly capture the value to the employees.
Local Climate and Energy Program Model De Focus Area: Value Creation and Program Revenues 15
Resources: Value Creation and Program Revenues
U.S. EPA’s Clean Energy Financing Programs Website provides state and local governments
with information about different types of clean energy financing strategies, such as rebates,
revolving loans, on-bill repayment, energy efficiency mortgages, and others:
epa.gov/statelocalclimate/state/activities/financing.html
U.S. EPA’s “Financing Clean Energy Programs” Webinar Series described how to design
and implement funding programs, line up partners, locate available sources of funding, and
make clean energy investments more affordable for clean energy program audiences:
epa.gov/statelocalclimate/web-podcasts/local-webcasts.html
U.S. EPA’s Financing Program Decision Tool suggests which types of clean energy
financing may be most appropriate for state and local governments based on their target
markets and available resources: epa.gov/statelocalclimate/state/activities/tool.html
U.S. DOE’s Better Buildings Neighborhood Program Business Models Guide provides
information about revenue strategies and other aspects of program models for energy
efficiency programs:
www1.eere.energy.gov/buildings/betterbuildings/neighborhoods/pdfs/bbnp_business_model
s_guide.pdf
U.S. DOE’s Financing Solutions Center provides information on a range of financing options
and program designs for energy efficiency programs:
www1.eere.energy.gov/wip/solutioncenter/financing.html
16 Focus Area: Creating Effective Partnerships Local Climate and Energy Program Model Design Guide
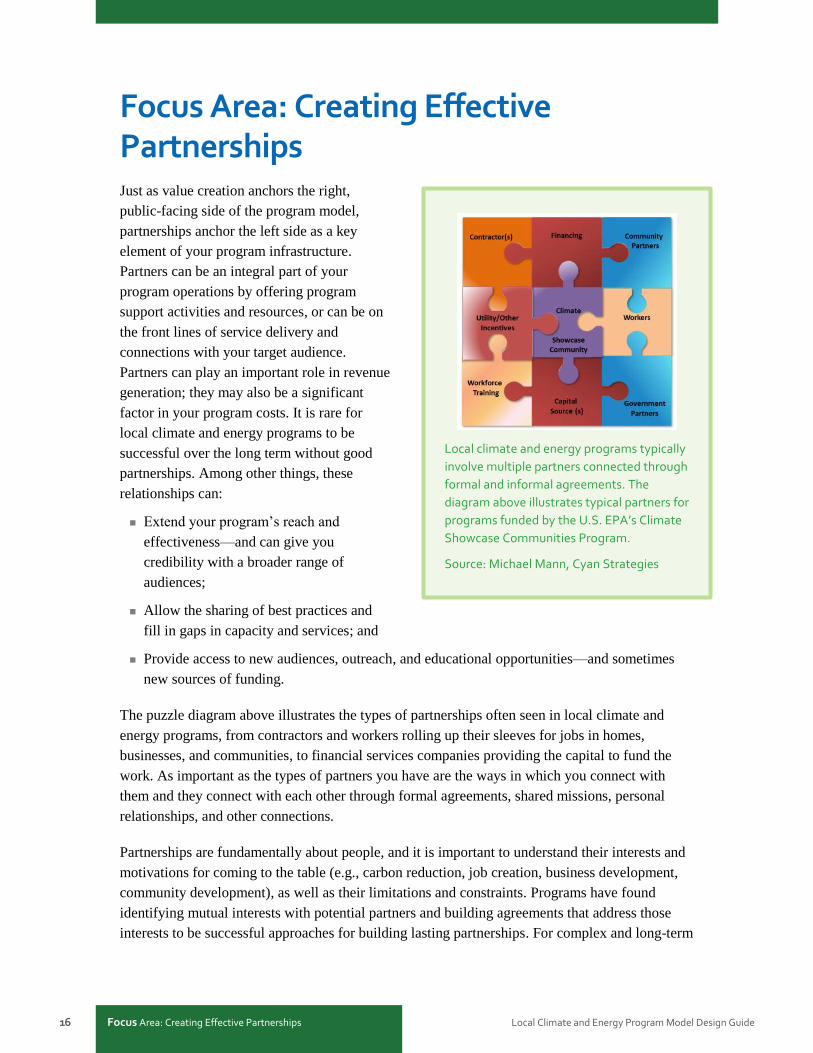
Focus Area: Creating Effective Partnerships Just as value creation anchors the right,
public-facing side of the program model,
partnerships anchor the left side as a key
element of your program infrastructure.
Partners can be an integral part of your
program operations by offering program
support activities and resources, or can be on
the front lines of service delivery and
connections with your target audience.
Partners can play an important role in revenue
generation; they may also be a significant
factor in your program costs. It is rare for
local climate and energy programs to be
successful over the long term without good
partnerships. Among other things, these
relationships can:
Extend your program’s reach and
effectiveness—and can give you
credibility with a broader range of
audiences;
Allow the sharing of best practices and
fill in gaps in capacity and services; and
Provide access to new audiences, outreach, and educational opportunities—and sometimes
new sources of funding.
The puzzle diagram above illustrates the types of partnerships often seen in local climate and
energy programs, from contractors and workers rolling up their sleeves for jobs in homes,
businesses, and communities, to financial services companies providing the capital to fund the
work. As important as the types of partners you have are the ways in which you connect with
them and they connect with each other through formal agreements, shared missions, personal
relationships, and other connections.
Partnerships are fundamentally about people, and it is important to understand their interests and
motivations for coming to the table (e.g., carbon reduction, job creation, business development,
community development), as well as their limitations and constraints. Programs have found
identifying mutual interests with potential partners and building agreements that address those
interests to be successful approaches for building lasting partnerships. For complex and long-term
Local climate and energy programs typically
involve multiple partners connected through
formal and informal agreements. The
diagram above illustrates typical partners for
programs funded by the U.S. EPA’s Climate
Showcase Communities Program.
Source: Michael Mann, Cyan Strategies
Local Climate and Energy Program Model De Focus Area: Creating Effective Partnerships 17
partnerships, it is often important to codify the
roles and responsibilities in written agreements.
It is important to be aware of common missions
that may align organizations in a partnership,
but that also create overlaps. Partnerships
should focus on each individual partner’s
strengths and how they can be complementary.
Partnerships and Financial Viability
Partners can play a key role in your program’s
financial viability by:
Taking on a larger role in program
implementation and funding,
Providing revenue directly or through their
revenue sources, and
Providing political clout or other leverage
for program funding.
For example, the Salt Lake City Clear the Air
Challenge implemented its program with more
than 25 organizations on its Air Quality
Partners Team. As the program matured and the
implementing agency sought opportunities to
pursue other efforts, it transitioned its Clear the
Air Challenge program to one of its key
implementation partners—the Salt Lake City
Chamber of Commerce. The chamber of commerce now administers the program. Because of its
relationships with businesses—including those that operate beyond Salt Lake City—the chamber
of commerce has been able to sustain and expand the program.
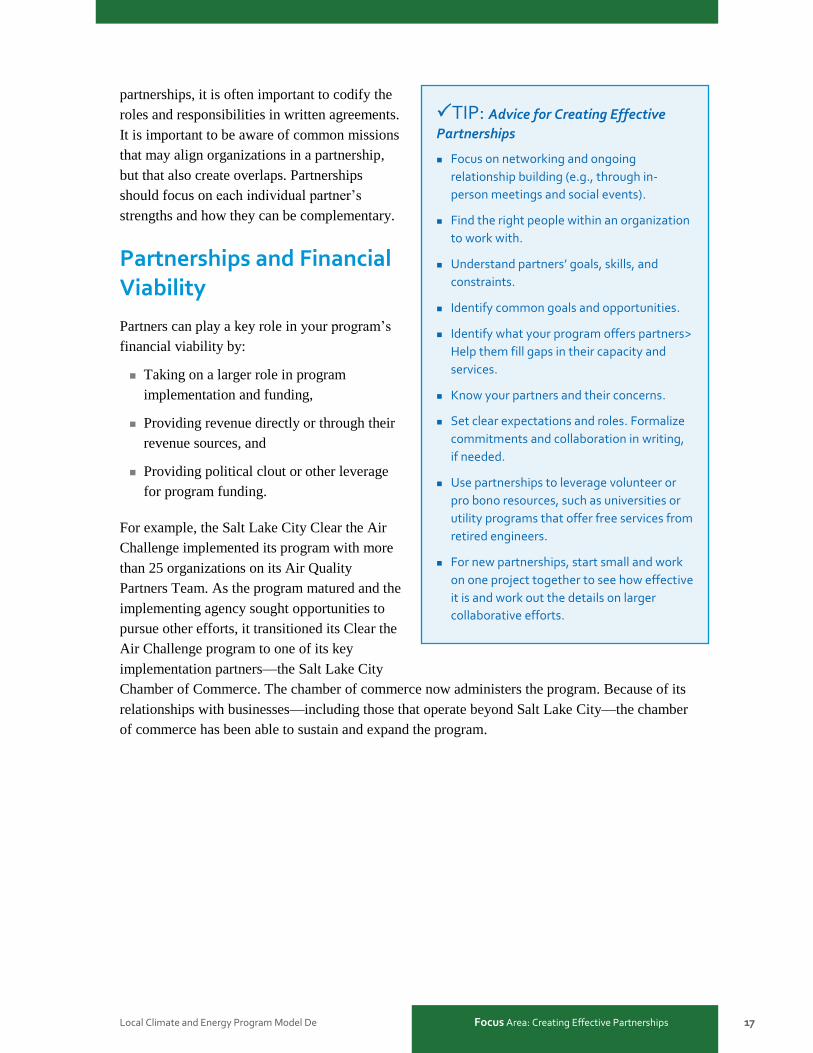
TIP: Advice for Creating Effective
Partnerships
Focus on networking and ongoing
relationship building (e.g., through in-
person meetings and social events).
Find the right people within an organization
to work with.
Understand partners’ goals, skills, and
constraints.
Identify common goals and opportunities.
Identify what your program offers partners>
Help them fill gaps in their capacity and
services.
Know your partners and their concerns.
Set clear expectations and roles. Formalize
commitments and collaboration in writing,
if needed.
Use partnerships to leverage volunteer or
pro bono resources, such as universities or
utility programs that offer free services from
retired engineers.
For new partnerships, start small and work
on one project together to see how effective
it is and work out the details on larger
collaborative efforts.
18 Focus Area: Creating Effective Partnerships Local Climate and Energy Program Model Design Guide
As you develop or refine your program model,
con
sider asking the following:
How are partners’ needs and roles
evolving? Do changes create opportunities
for partners to take on new roles and
responsibilities?
Can existing partners offer additional
support for your efforts in the future?
Can they fill any new roles?
Should you seek new partners?
Are you doing the right things? Could
partners be doing some of them?
Decisions about whether a program needs new
partners (or should retain current ones) can
prompt hard questions about program design,
such as what services to continue providing, how, and at what cost. Some partnerships may no
longer be considered cost effective or necessary to achieve revised program goals.
The City and County of Denver found it
needed to ask some tough questions about
partners as their revenue strategy shifted from
public grant funds to other sources of
revenue. Program managers were forced to
ask whether they could afford to keep
providing certain types of services—and, if
these services were to be discontinued,
whether they would need to retain the
partners who were providing them. Project
leads shared the following tips for interacting
with partners in similar circumstances:
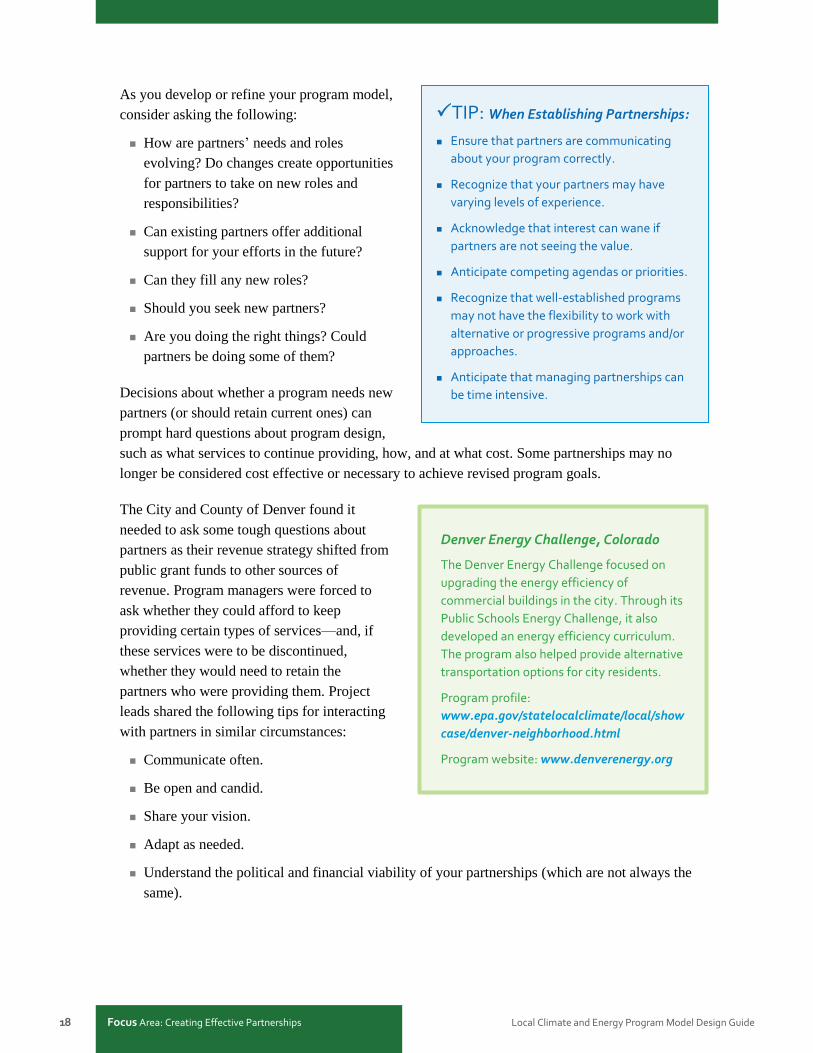
TIP: When Establishing Partnerships:
Ensure that partners are communicating
about your program correctly.
Recognize that your partners may have
varying levels of experience.
Acknowledge that interest can wane if
partners are not seeing the value.
Anticipate competing agendas or priorities.
Recognize that well-established programs
may not have the flexibility to work with
alternative or progressive programs and/or
approaches.
Anticipate that managing partnerships can
be time intensive.
Denver Energy Challenge, Colorado
The Denver Energy Challenge focused on
upgrading the energy efficiency of
commercial buildings in the city. Through its
Public Schools Energy Challenge, it also
developed an energy efficiency curriculum.
The program also helped provide alternative
transportation options for city residents.
Program profile:
www.epa.gov/statelocalclimate/local/show
case/denver-neighborhood.html
Program website: www.denverenergy.org Communicate often.
Be open and candid.
Share your vision.
Adapt as needed.
Understand the political and financial viability of your partnerships (which are not always the
same).
Local Climate and Energy Program Model De Focus Area: Creating Effective Partnerships 19
A transition to new revenue models and sources can catalyze a new approach to partnerships.
Grant-funded programs are often able to attract partners by offering them money. As grant
funding declines, programs may need to attract partners who bring their own financial resources,
political clout, or strategic leverage. These new partners have their own goals and values, which
may influence program design.
It is never too early to think about the future role of partners. Plan for the end from the beginning
so you understand how your program can potentially transition program components to other
organizations that will carry them forward. In some cases, other organizations may carry on the
legacy you began.
Partner Map
To help generate ideas about how partners may play a role in your program (or where their role
should change or be complemented by new partners), you can fill out a partner map. One Climate
Showcase Communities program that provides energy efficiency upgrade services assessed its
partners according to a partner map to help it evaluate whether to maintain current partnerships.
The map reflected the following questions:
Who are existing or potential partners?
What is their current role in the program?
What unique opportunities does this partnership represent that are not currently available
elsewhere?
In what areas does the partner excel compared to other partners who could provide these
services?
20 Focus Area: Creating Effective Partnerships Local Climate and Energy Program Model Design Guide
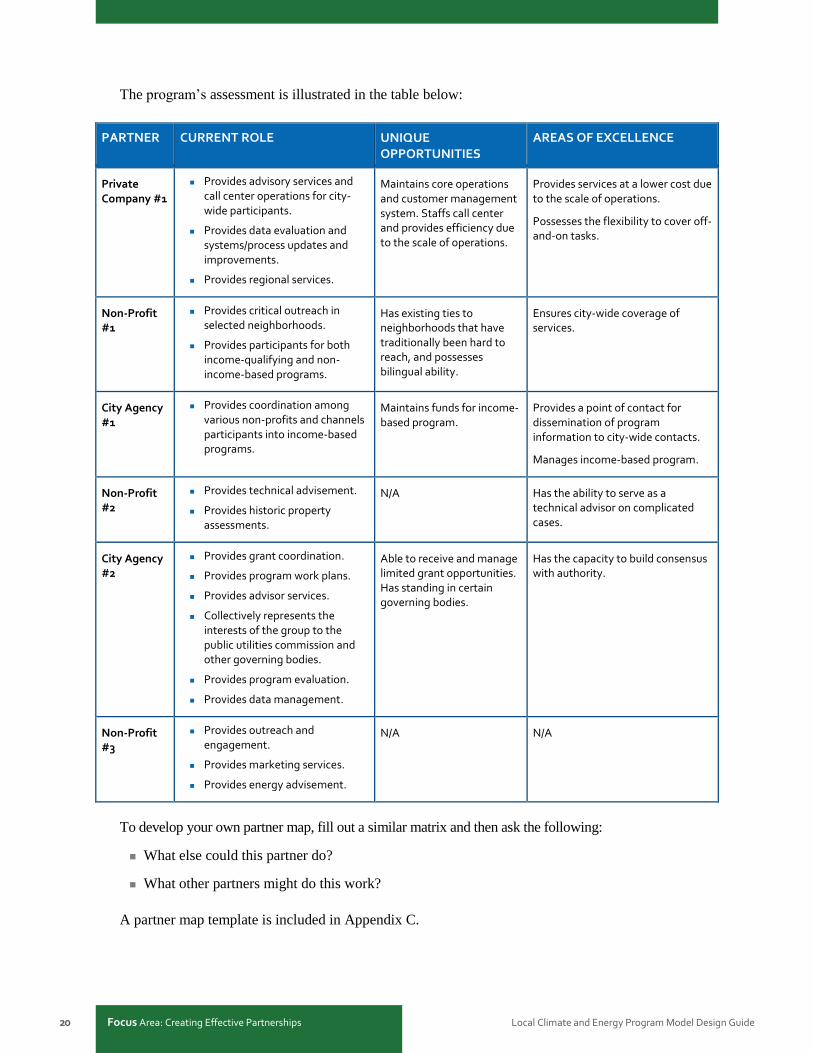
The program’s assessment is illustrated in the table below:
PARTNER CURRENT ROLE UNIQUE OPPORTUNITIES
AREAS OF EXCELLENCE
Private Company #1
Provides advisory services and call center operations for city-wide participants.
Provides data evaluation and systems/process updates and improvements.
Provides regional services.
Maintains core operations and customer management system. Staffs call center and provides efficiency due to the scale of operations.
Provides services at a lower cost due to the scale of operations.
Possesses the flexibility to cover off-and-on tasks.
Non-Profit #1
Provides critical outreach in selected neighborhoods.
Provides participants for both income-qualifying and non-income-based programs.
Has existing ties to neighborhoods that have traditionally been hard to reach, and possesses bilingual ability.
Ensures city-wide coverage of services.
City Agency #1
Provides coordination among various non-profits and channels participants into income-based programs.
Maintains funds for income-based program.
Provides a point of contact for dissemination of program information to city-wide contacts.
Manages income-based program.
Non-Profit #2
Provides technical advisement.
Provides historic property assessments.
N/A Has the ability to serve as a technical advisor on complicated cases.
City Agency #2
Provides grant coordination.
Provides program work plans.
Provides advisor services.
Collectively represents the interests of the group to the public utilities commission and other governing bodies.
Provides program evaluation.
Provides data management.
Able to receive and manage limited grant opportunities. Has standing in certain governing bodies.
Has the capacity to build consensus with authority.
Non-Profit #3
Provides outreach and engagement.
Provides marketing services.
Provides energy advisement.
N/A N/A
To develop your own partner map, fill out a similar matrix and then ask the following:
What else could this partner do?
What other partners might do this work?
A partner map template is included in Appendix C.
Local Climate and Energy Program Model De Focus Area: Creating Effective Partnerships 21
Resources: Creating Effective Partnerships
U.S. EPA’s Local Climate Action Framework, Reach Out and Communicate page provides
information on strategies for engaging the community:
www.epa.gov/statelocalclimate/local/implementation/communicate.html
Climate Showcase Communities Effective Practices Tip Sheets provide succinct advice from
local climate and clean energy program leaders on several types of partnerships:
www.epa.gov/statelocalclimate/local/showcase/csc-learn.html#tipsheets
The following tip sheets in particular provide advice on partnerships:
Working with Institutional Partners (e.g., other state, local, and regional jurisdictions;
public utility commissions; complementary programs)
Working with Contractors
Working with Students
Working with Volunteers
Working with Utilities
Working with Corporations
Identifying and Working with Experts
Working Across Ideological Differences
22 Focus Area: Services Local Climate and Energy Program Model Design Guide
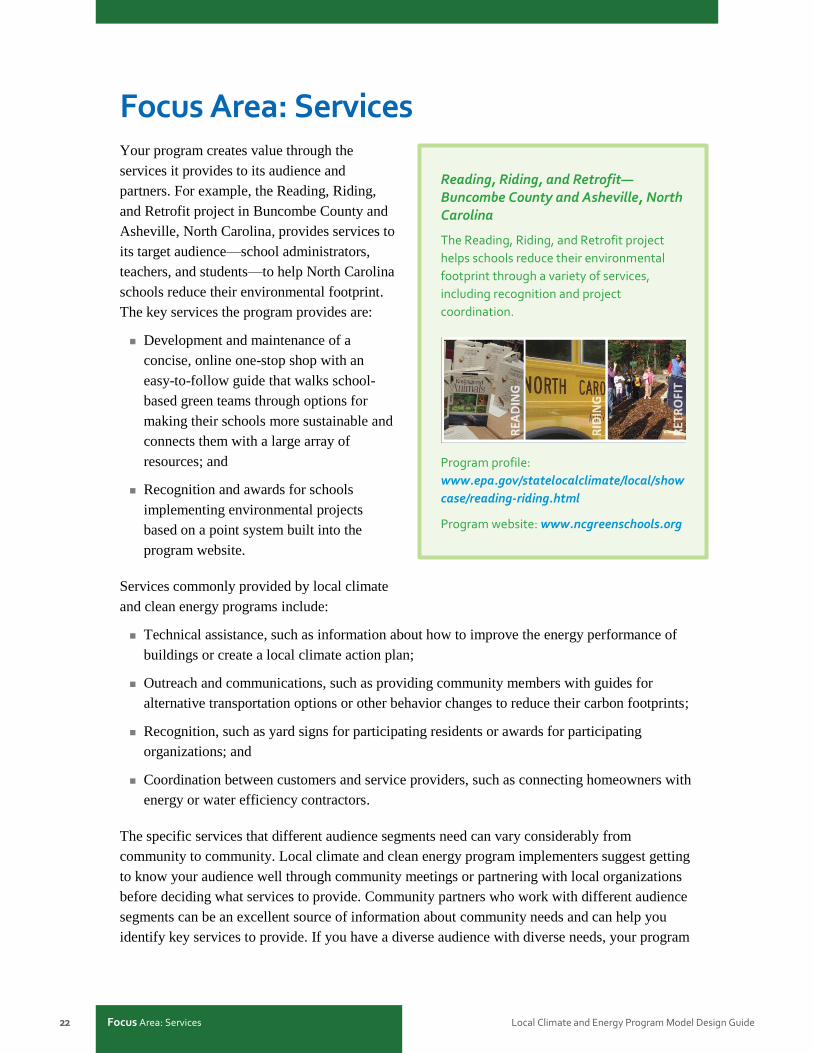
Focus Area: Services Your program creates value through the
services it provides to its audience and
partners. For example, the Reading, Riding,
and Retrofit project in Buncombe County and
Asheville, North Carolina, provides services to
its target audience—school administrators,
teachers, and students—to help North Carolina
schools reduce their environmental footprint.
The key services the program provides are:
Development and maintenance of a
concise, online one-stop shop with an
easy-to-follow guide that walks school-
based green teams through options for
making their schools more sustainable and
connects them with a large array of
resources; and
Recognition and awards for schools
implementing environmental projects
based on a point system built into the
program website.
Services commonly provided by local climate
and clean energy programs include:
Reading, Riding, and Retrofit—Buncombe County and Asheville, North Carolina
The Reading, Riding, and Retrofit project
helps schools reduce their environmental
footprint through a variety of services,
including recognition and project
coordination.
Program profile:
www.epa.gov/statelocalclimate/local/show
case/reading-riding.html
Program website: www.ncgreenschools.org
Technical assistance, such as information about how to improve the energy performance of
buildings or create a local climate action plan;
Outreach and communications, such as providing community members with guides for
alternative transportation options or other behavior changes to reduce their carbon footprints;
Recognition, such as yard signs for participating residents or awards for participating
organizations; and
Coordination between customers and service providers, such as connecting homeowners with
energy or water efficiency contractors.
The specific services that different audience segments need can vary considerably from
community to community. Local climate and clean energy program implementers suggest getting
to know your audience well through community meetings or partnering with local organizations
before deciding what services to provide. Community partners who work with different audience
segments can be an excellent source of information about community needs and can help you
identify key services to provide. If you have a diverse audience with diverse needs, your program
Local Climate and Energy Program Model De Focus Area: Services 23
may want to consider an approach that allows you to customize services for different audience
segments. Over time, it is important to listen to your audience and your partners to gauge what
services are most valuable and how to deliver them most effectively and efficiently. It is often
cost effective to combine service delivery with events or activities organized by others and/or in
which your target audience already participates.
Services and Financial Viability
Because services are your primary way of
creating value and, in many cases, the primary
contributor to your program costs, offering the
right services is critical to long-term program
viability. Your program can be successful if it
provides services that create enough value to
generate revenue to cover your costs. It is
important to discern what services your
audience needs and if yours is the right program
to provide them. In some instances, partner
organizations may be better positioned to
provide certain services. For example, outreach
may be critical to your program’s goal of
changing residents’ behavior, but you may want
to do outreach through a community partner
who has marketing expertise and/or
relationships with your target audience. This
may then let you focus on what you do best.
Some key questions to ask about services are
the following:
What does your audience need that it is not
getting elsewhere? (And, how are its needs
changing over time?)
What services can meet these needs?
What services can you provide at the
highest value and the lowest cost?
Can partners provide (some of) these
services? (And, how can we support them?)
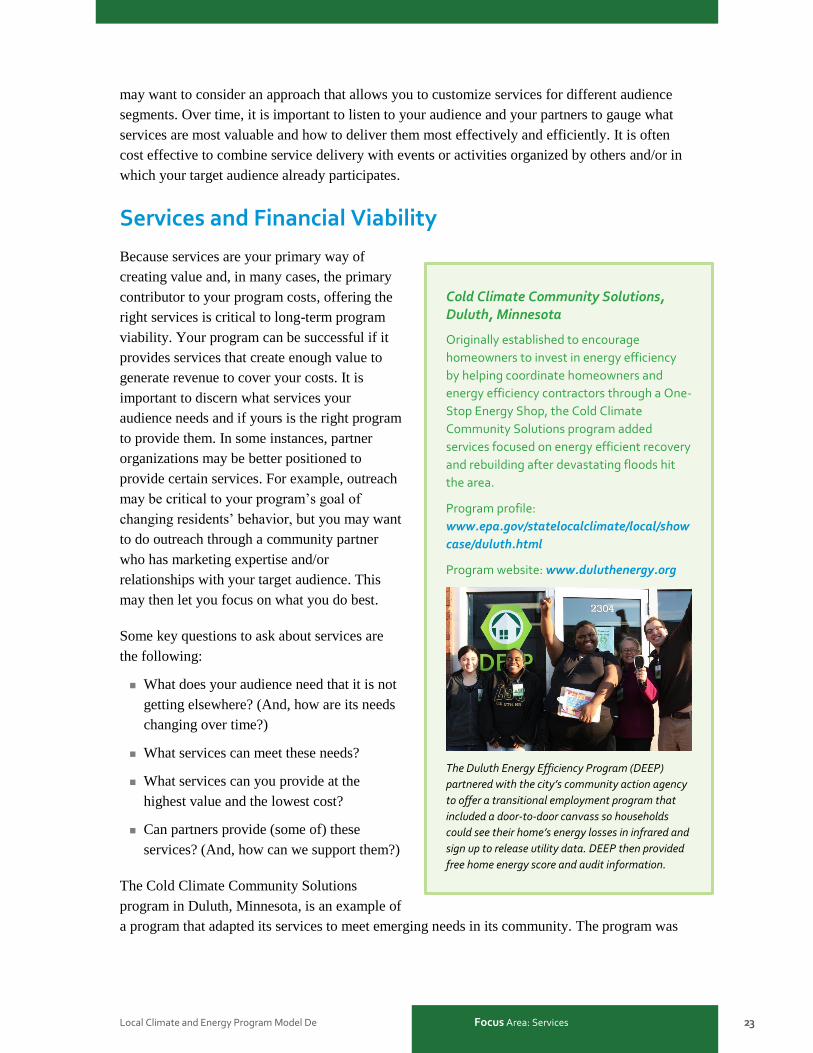
The Cold Climate Community Solutions
program in Duluth, Minnesota, is an example of
a program that adapted its services to meet emerging needs in its community. The program was
Cold Climate Community Solutions, Duluth, Minnesota
Originally established to encourage
homeowners to invest in energy efficiency
by helping coordinate homeowners and
energy efficiency contractors through a One-
Stop Energy Shop, the Cold Climate
Community Solutions program added
services focused on energy efficient recovery
and rebuilding after devastating floods hit
the area.
Program profile:
www.epa.gov/statelocalclimate/local/show
case/duluth.html
Program website: www.duluthenergy.org
The Duluth Energy Efficiency Program (DEEP)
partnered with the city’s community action agency
to offer a transitional employment program that
included a door-to-door canvass so households
could see their home’s energy losses in infrared and
sign up to release utility data. DEEP then provided
free home energy score and audit information.
24 Focus Area: Services Local Climate and Energy Program Model Design Guide
originally established to encourage homeowners to invest in energy efficiency by helping
coordinate homeowners and energy efficiency contractors through a One-Stop Energy Shop, as
well as through a media campaign and education effort. In June 2012, devastating floods hit the
community. Recognizing that many homeowners and businesses would need to rebuild or make
repairs, the program focused on ensuring that new buildings were built to use energy efficiently.
Leveraging the resources the program had created over time—including relationships with more
than 30 local contractors—the program added services focused on energy efficient recovery and
rebuilding.
Services Map
Existing programs should periodically review their services to ensure they are meeting
community needs and that these services are still the best use of program resources. To help
generate ideas about how audiences receive services and who should provide them, fill out a
simple services map that asks the following:
What does your audience need?
What services can meet these needs?
Who should provide these services and why?
As needs and/or your program’s funding or other circumstances change, it is important to revisit
these questions.
The service maps on page 26 illustrate how services—and who provided them—changed as the
City of Durham and Durham County, North Carolina, revised its program model from providing
direct energy efficiency assessment and upgrade services to homeowners in specific
neighborhoods to a broader strategy for raising awareness about energy efficiency and
sustainability across the entire city. As shown in the service map for Phase 1 of the program
(called the Neighborhood Energy Retrofit Program), the city and county, along with their
partners, focused on intensive door-to-door outreach in selected neighborhoods and helped train
and coordinate private contractors to do the work. After upgrading several homes but falling short
of the program’s goals, managers decided to expand the program city wide and focus on broader
outreach.
Local Climate and Energy Program Model De Focus Area: Services 25
Funds from the U.S. Environmental Protection
Agency and DOE for coordinating and
incentivizing home energy upgrades were
being exhausted after the program successfully
upgraded hundreds of homes around the city.
Reconstituting as the Home Energy Savings
Program, managers shifted to focus primarily
on broad outreach to the entire city, including
providing outreach in Spanish, relying more on
neighborhood associations and “local
champions” for outreach, and launching an
online social marketing campaign in
collaboration with other city departments (as
illustrated in the Phase 2 service map on the
next page). While contractors continued to
provide energy assessment and upgrade
services to homeowners, the city and county
discontinued its role in coordinating and
incentivizing this work. Through this
transition, the program’s services changed and
the program involved new partners to provide them.
Reducing Greenhouse Gas Emissions Through Neighborhood-Based Home Energy Efficiency Upgrades and Capacity Development, City of Durham and Durham County, North Carolina
This program in Durham, North Carolina,
was originally designed as a neighborhood-
based home energy efficiency upgrade
program focused on door-to-door outreach
in specific neighborhoods. Over time, its
program model and services evolved to
focus on broader energy outreach
throughout the city and online social
marketing.
Program profile:
www.epa.gov/statelocalclimate/local/show
case/neighborhood-home-efficiency.html
26 Focus Area: Services Local Climate and Energy Program Model Design Guide
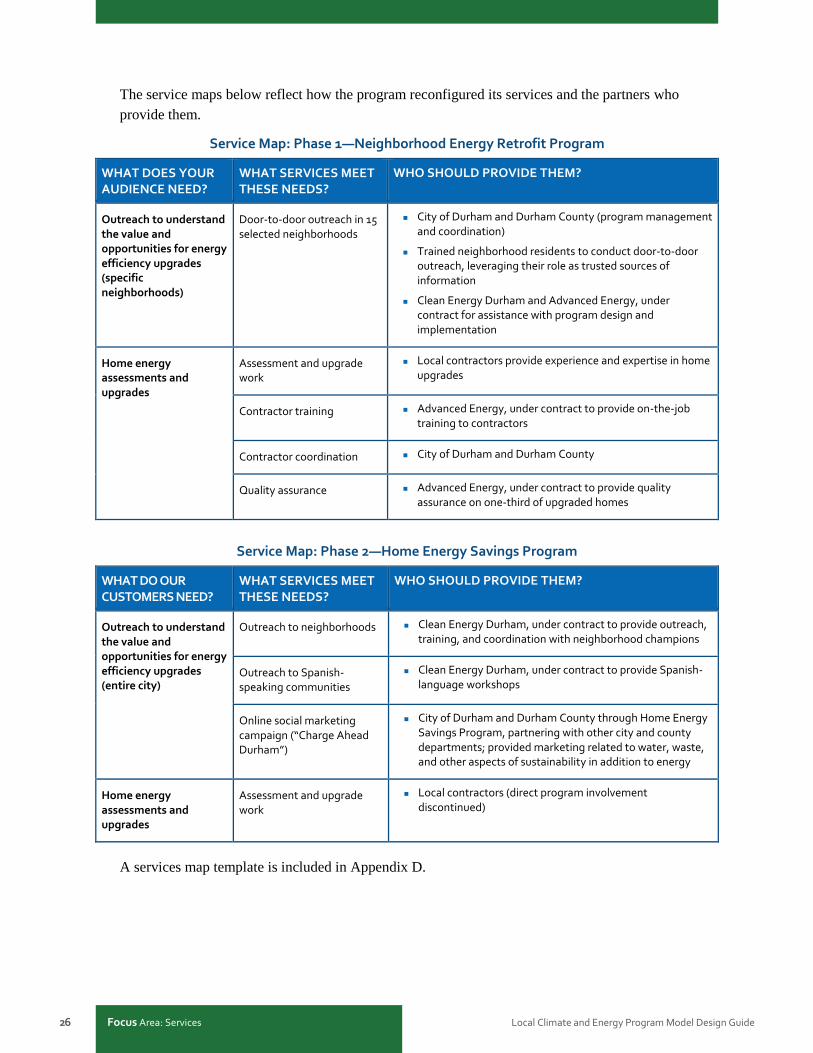
The service maps below reflect how the program reconfigured its services and the partners who
provide them.
Service Map: Phase 1—Neighborhood Energy Retrofit Program
WHAT DOES YOUR AUDIENCE NEED?
WHAT SERVICES MEET THESE NEEDS?
WHO SHOULD PROVIDE THEM?
Outreach to understand the value and opportunities for energy efficiency upgrades (specific neighborhoods)
Door-to-door outreach in 15 selected neighborhoods
City of Durham and Durham County (program management and coordination)
Trained neighborhood residents to conduct door-to-door outreach, leveraging their role as trusted sources of information
Clean Energy Durham and Advanced Energy, under contract for assistance with program design and implementation
Home energy assessments and upgrades
Assessment and upgrade work
Local contractors provide experience and expertise in home upgrades
Contractor training Advanced Energy, under contract to provide on-the-job training to contractors
Contractor coordination City of Durham and Durham County
Quality assurance Advanced Energy, under contract to provide quality assurance on one-third of upgraded homes
Service Map: Phase 2—Home Energy Savings Program
WHAT DO OUR CUSTOMERS NEED?
WHAT SERVICES MEET THESE NEEDS?
WHO SHOULD PROVIDE THEM?
Outreach to understand the value and opportunities for energy efficiency upgrades (entire city)
Outreach to neighborhoods
Clean Energy Durham, under contract to provide outreach, training, and coordination with neighborhood champions
Outreach to Spanish-speaking communities
Clean Energy Durham, under contract to provide Spanish-language workshops
Online social marketing campaign (“Charge Ahead Durham”)
City of Durham and Durham County through Home Energy Savings Program, partnering with other city and county departments; provided marketing related to water, waste, and other aspects of sustainability in addition to energy
Home energy assessments and upgrades
Assessment and upgrade work
Local contractors (direct program involvement discontinued)
A services map template is included in Appendix D.
Local Climate and Energy Program Model De Focus Area: Services 27
Resources: Services
U.S. EPA’s Local Government Climate and Energy Strategy Series describes strategies and
services local governments can use to achieve economic, environmental, social, and human
health benefits. It covers energy efficiency, transportation, community planning and design,
solid waste and materials management, and renewable energy:
www.epa.gov/statelocalclimate/resources/strategy-guides.html
Climate Showcase Communities Effective Practices Tip Sheets
(www.epa.gov/statelocalclimate/local/showcase/csc-learn.html#tipsheets) provide succinct
advice from local climate and clean energy program leaders on several types of program
strategies and services, including the following:
Action Checklists
Green Teams
Incentive Techniques
Award/Certificate Programs
U.S. DOE’s Residential Energy Program Design Guide provides comprehensive information
about residential energy efficiency program services and design:
www1.eere.energy.gov/wip/solutioncenter/pdfs/residential_retrofit_program_design_guide.
28 Conclusion Local Climate and Energy Program Model Design Guide
Conclusion In the past several years, local governments and their partners have driven a flurry of innovation
in local climate and energy program design. New programs should consider how they can remain
viable over the long term and continue to add value that attracts program investments and other
revenues. Existing programs also often need to revisit program models as circumstances change.
Key strategies are to:
Create value and turn it into adequate program revenues;
Establish effective partnerships that leverage partners’ strengths (and your own) to enhance
value and strengthen the bottom line; and
Deliver a set of services that meet audience needs and align with your organization’s
strengths.
Perhaps the best advice is to listen to local climate and energy program implementers. The same
people identified at the beginning of this guide as reporting that their biggest question was
“Where will the money come from?” offered advice to their peers that reflected, in their own
words, the importance of creating effective partnerships, being ready to adjust services, and
creating value:
“You can gain new contacts, knowledge, and networks through working on a project with new
partners.”
“Don’t be afraid to tweak the program if you see that it’s not working!”
“If an audience is interested in food, don’t sell them on water!”
Local Climate and Energy Program Model De Conclusion 29
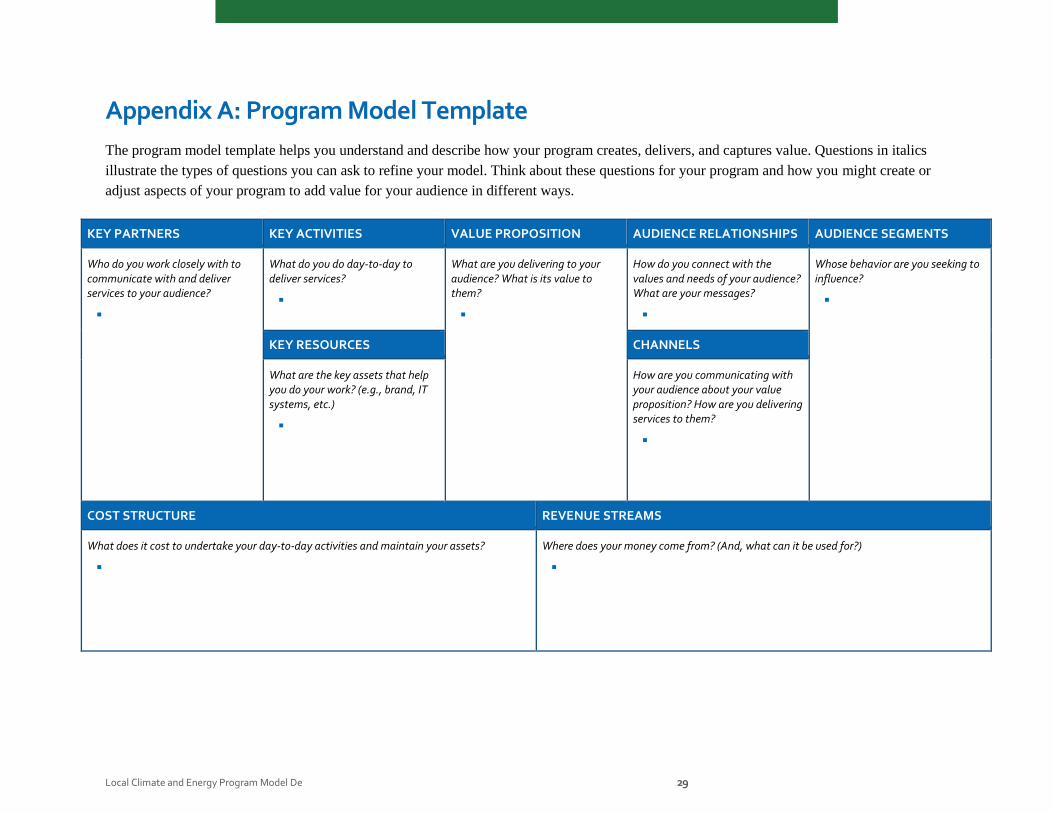
Appendix A: Program Model Template
The program model template helps you understand and describe how your program creates, delivers, and captures value. Questions in italics
illustrate the types of questions you can ask to refine your model. Think about these questions for your program and how you might create or
adjust aspects of your program to add value for your audience in different ways.
KEY PARTNERS KEY ACTIVITIES VALUE PROPOSITION AUDIENCE RELATIONSHIPS AUDIENCE SEGMENTS
Who do you work closely with to communicate with and deliver services to your audience?
What do you do day-to-day to deliver services?
What are you delivering to your audience? What is its value to them?
How do you connect with the values and needs of your audience? What are your messages?
Whose behavior are you seeking to influence?
KEY RESOURCES CHANNELS
What are the key assets that help you do your work? (e.g., brand, IT systems, etc.)
How are you communicating with your audience about your value proposition? How are you delivering services to them?
COST STRUCTURE REVENUE STREAMS
What does it cost to undertake your day-to-day activities and maintain your assets?
Where does your money come from? (And, what can it be used for?)
30 Conclusion Local Climate and Energy Program Model Design Guide
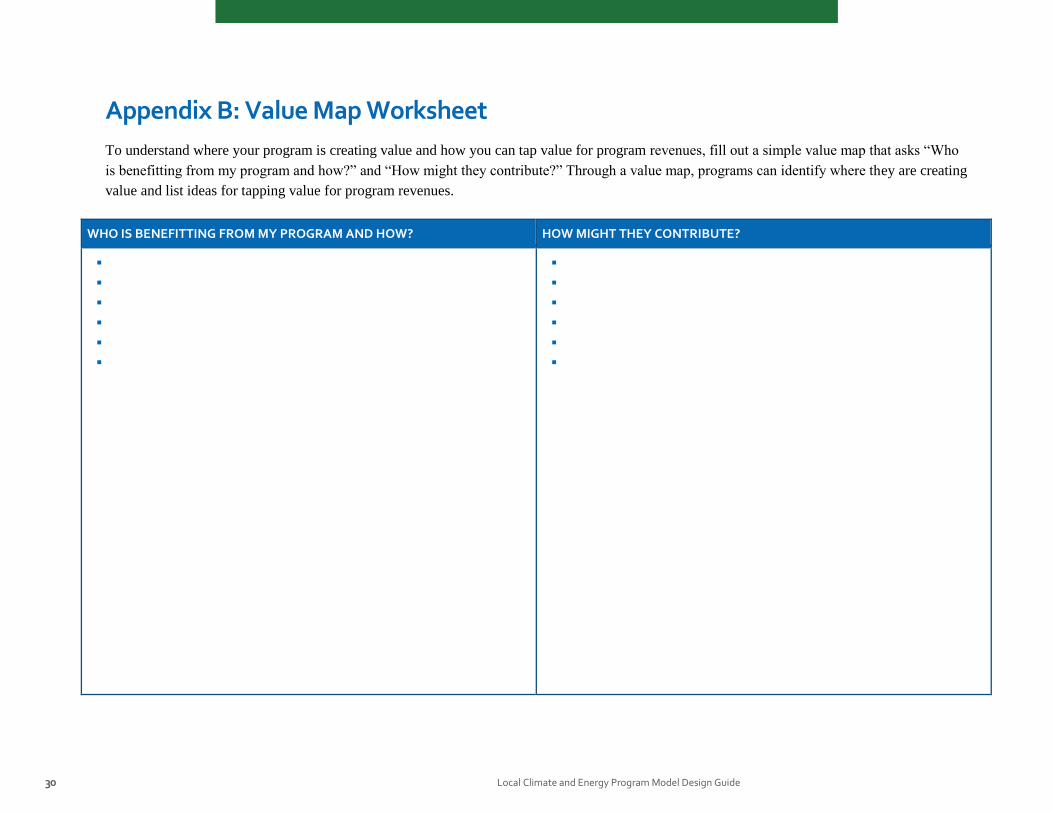
Appendix B: Value Map Worksheet
To understand where your program is creating value and how you can tap value for program revenues, fill out a simple value map that asks “Who
is benefitting from my program and how?” and “How might they contribute?” Through a value map, programs can identify where they are creating
value and list ideas for tapping value for program revenues.
WHO IS BENEFITTING FROM MY PROGRAM AND HOW? HOW MIGHT THEY CONTRIBUTE?
Local Climate and Energy Program Model De Conclusion 31
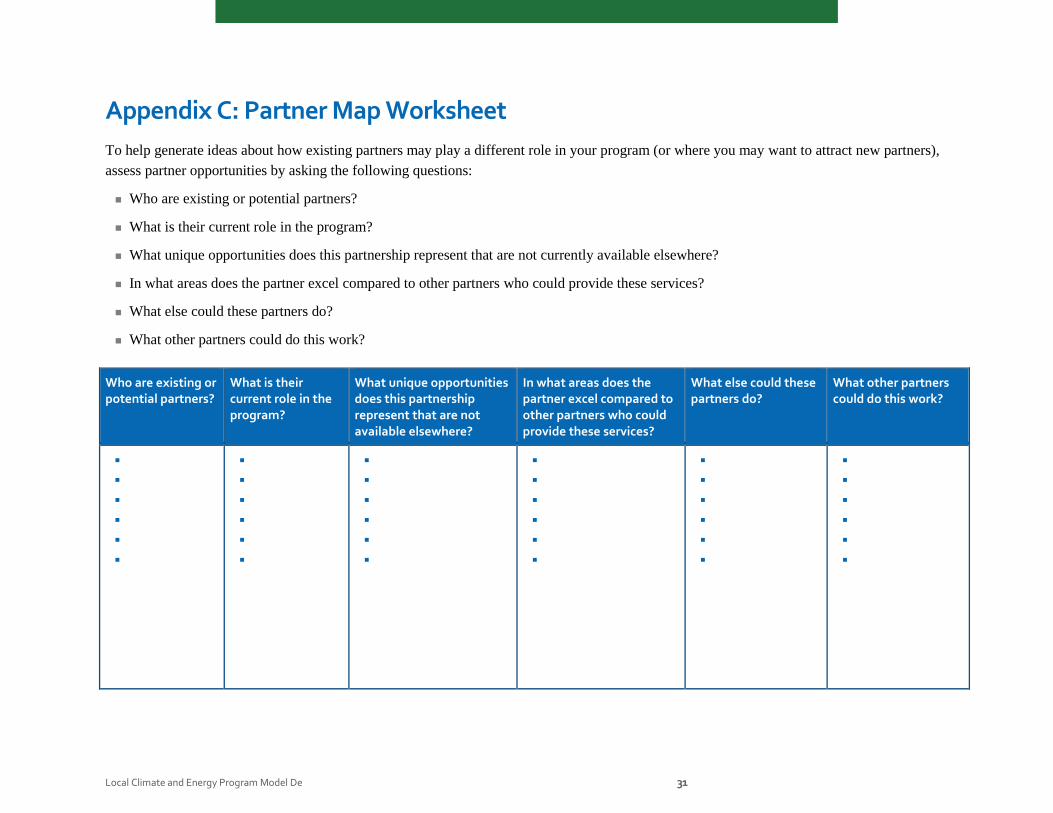
Appendix C: Partner Map Worksheet
To help generate ideas about how existing partners may play a different role in your program (or where you may want to attract new partners),
assess partner opportunities by asking the following questions:
Who are existing or potential partners?
What is their current role in the program?
What unique opportunities does this partnership represent that are not currently available elsewhere?
In what areas does the partner excel compared to other partners who could provide these services?
What else could these partners do?
What other partners could do this work?
Who are existing or potential partners?
What is their current role in the program?
What unique opportunities does this partnership represent that are not available elsewhere?
In what areas does the partner excel compared to other partners who could provide these services?
What else could these partners do?
What other partners could do this work?
32 Conclusion Local Climate and Energy Program Model Design Guide
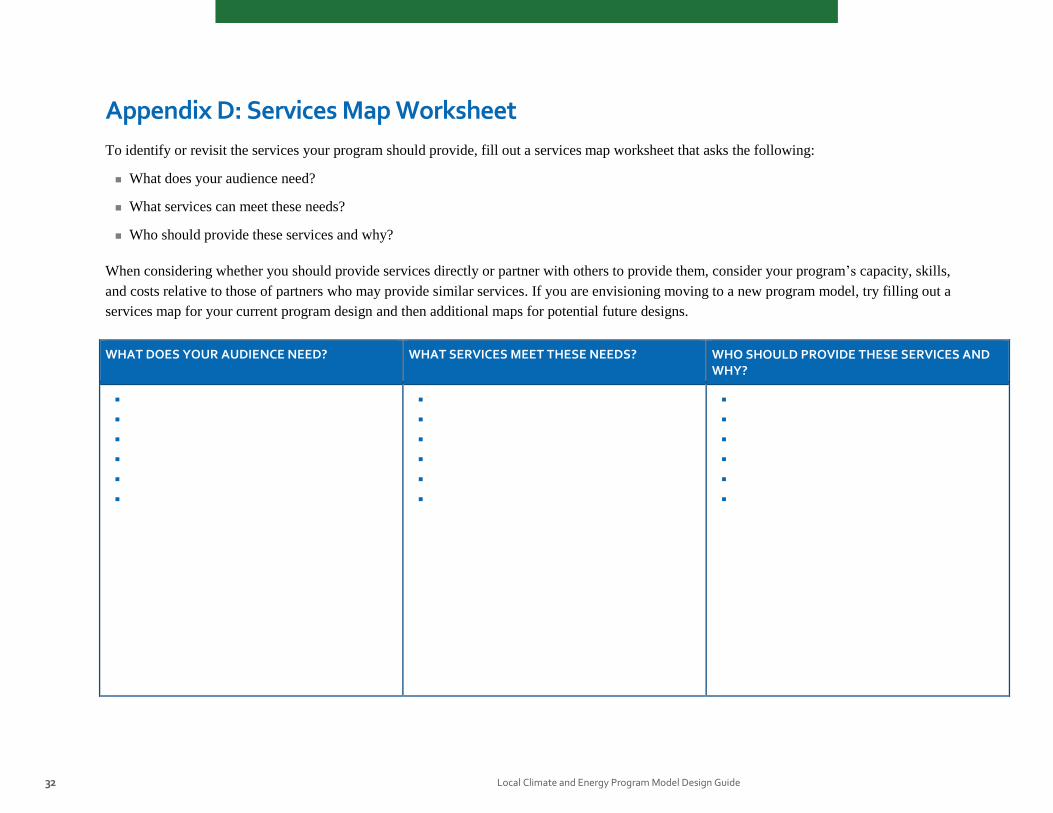
Appendix D: Services Map Worksheet
To identify or revisit the services your program should provide, fill out a services map worksheet that asks the following:
What does your audience need?
What services can meet these needs?
Who should provide these services and why?
When considering whether you should provide services directly or partner with others to provide them, consider your program’s capacity, skills,
and costs relative to those of partners who may provide similar services. If you are envisioning moving to a new program model, try filling out a
services map for your current program design and then additional maps for potential future designs.
WHAT DOES YOUR AUDIENCE NEED? WHAT SERVICES MEET THESE NEEDS? WHO SHOULD PROVIDE THESE SERVICES AND WHY?
Local Climate and Energy Program Model Design Guide Appendix E 33
Appendix E: Potential Audience Segments
To identify your target audience, ask “Who does the program need to reach or engage to accomplish your
program and communication objectives?” Keep in mind that you may have more than one target audience
based on your objectives.
Consider the following groups to help you identify your audiences:
Administrators of complementary or similar programs
Other jurisdictions or local entities
Community-based organizations
Faith-based organizations
Contractors
Potential program funders
Students
Renters
Landlords
Utilities
Volunteers
Local political leaders and decision makers
Business owners
Experts
Residents
Neighborhood associations or block groups
Homeowners associations (e.g., condo boards)
Universities
Non-profits
Green teams or sustainability groups
Community “gatekeepers” or leaders
Others
34 Appencix F Local Climate and Energy Program Model Design Guide
Appendix F: Performance Indicators
Performance indicators measure progress toward program goals and objectives. Both quantitative and
qualitative indicators are valuable to track. As you brainstorm, assess, and select indicators, think about
the narrative you are hoping to tell. Think about what metrics and data could strengthen the story and
make it more compelling for the intended audience.
Brainstorm
Start with a brainstorming session to develop a comprehensive and creative list of potential indicators.
Before you brainstorm, review the project goals—all tracking and reporting activities should be directly
related to project goals. At the same time, remember that this is a brainstorming session: Be inclusive!
Assess
Now that you have a broad list of indicators, it is time to determine which indicators are valuable and
feasible for measuring the success of your project. There are three essential qualities for selecting a good
set of indicators. Each indicator must be (1) relevant, (2) measurable, and (3) accessible.
Relevant: Is the indicator useful in determining if the project goals are being met? Is it programmatically
important? Is it relevant to the audience(s) you will be sharing your results with? If the indicator does not
contribute to understanding the success of meeting project goals, it is not a good allocation of resources.
Measurable: Is it possible to track progress? If the indicator is qualitative, is it possible to rank the
evaluation (e.g., high/medium/low or excellent/good/satisfactory/needs improvement) so improvements
can be tracked? Does it provide an accurate measure of a task? Can it be defined in clear terms? Will it be
consistently measured the same way by different observers?
Accessible: Is the project team able to obtain the necessary data for this indicator at intervals that are
appropriate for the project goals? Barriers to accessibility may include data privacy, inadequate resources
to collect the data (e.g., staff time, technology), or aggregation of data at too high of a level for it to be
useful.
Select
Once a set of viable (relevant, measurable, and accessible) performance indicators are identified, the
project team should select the list of indicators that fit the project best. Consider the story you want to be
able to tell with your indicators; select a set of indicators that narrate a story of success or precisely guide
the implementing body to adjust the program to optimize future success. Your final list of indicators
should be sufficient and succinct. Too few indicators will provide the project team with limited
information. Too many indicators will be burdensome and deter regular tracking and reporting.

EPA-‐430-‐F-‐15-‐001 April 2015
www/epa.gov/climateshowcase/