local and regional co2 emissions estimates for 2003
TRANSCRIPT

LA and Regional CO2 2003 – Issue 1
Netcen/ED48209Ext9/Issue1
Local and Regional CO2 Emissions Estimates for 2003
A report produced for Defra
Justin Goodwin
Katie King
Neil Passant
James Sturman
Yvonne Li
August 2005

LA and Regional CO2 2003 – Issue 1
Netcen/ED48209Ext9/Issue1
Local and Regional CO2 Emissions Estimates for 2003
A report produced for Defra
Justin Goodwin
Katie King
Neil Passant
James Sturman
Yvonne Li
August 2005

LA and Regional CO2 2003 – Issue 1
AEA Technology i
Title Local and Regional CO2 Emissions Estimates for 2003 Customer ESI, Defra
Customer reference
Confidentiality, copyright and reproduction
This document has been prepared by AEA Technology plc in connection with a contract to supply goods and/or services and is submitted only on the basis of strict confidentiality. The contents must not be disclosed to third parties other than in accordance with the terms of the contract.
File reference ED 48209901
Report number AEAT/ENV/R/2036
Report status Unrestricted
Netcen
AEA Technology Environment Building 551 Harwell Business Centre Didcot Oxon. OX11 0QJ
Telephone 0870 1906511 Facsimile 0870 1906607 AEA Technology is the trading name of AEA Technology plc AEA Technology is certificated to ISO9001
Name Signature Date
Authors Katie King
Neil Passant
Reviewed by Chris Dore
Approved by Geoff Dollard

LA and Regional CO2 2003 – Issue 1
AEA Technology ii

LA and Regional CO2 2003 – Issue 1
AEA Technology iii
Contents
1 Introduction 4
1.1 Aim 4
1.2 Methodololgy 4
1.3 Structure Of This Report 5
2 Summary of CO2 inventory for the UK 5
2.1 Simplified Sector Split For Local Co2 Estimates 9
3 Datasets and methodology 11
3.1 Electricity Consumption 12
3.2 Gas Consumption 13
3.3 Other Domestic Fuel Use 16
3.4 Road Transport 17
3.5 Diesel Rail Transport 17
3.6 Other Industrial And Commercial Fuel Use 18
3.7 Aggregation Of Emissions To Local Authority Level 21
4 Results 22
4.1 Reconciliation With NAEI Totals And Da Inventory 30
5 Recommendations for improvements 33
6 References 38
Annex 1 Site Specific Fuel Use Estimates 39
LA and Regional CO2 2003 – Issue 1
AEA Technology 4
1 Introduction
This report describes work undertaken by Netcen to provide Defra with Local
Authority (NUTS4) and Government Office Regions (NUTS1) level carbon dioxide
emissions estimates for 2003. The work is an extension of the National
Atmospheric Emissions Inventory (NAEI) contract (RMP/2106) with Defra Air and
Environmental Quality and Global Atmosphere Divisions.
1.1 Aim
The aim of this project is to provide nationally consistent carbon dioxide emission
estimates at local authority and regional level. The data represent the primary
emissions from the consumption of fuel or other process activities that emit CO2
plus the emissions relevant to the production of consumed electricity. The data
are intended to provide a starting point for further thought on quantifying
emissions at a local and regional level. The estimates presented stretch the
bounds of what is reasonable to assume in an attempt to provide a number for
each Local Authority and Region and sector and should be considered indicative.
Elements of the data (such as the domestic gas and electricity estimates and the
estimates for road transport) are of reasonable certainty as they are based on
Local readings, sales data and traffic counts. Other components of the estimates
(including solid and liquid fuels combustion, land use estimates) are much more
uncertain as they are based on less well linked spatial data (including population,
satellite images and fuel surveys) and incorporate many assumptions. Despite
these limitations the data can be used as a starting point for regional and local
authority climate change indicators in the Government’s Sustainable Development
indicator set and the Audit Commission’s updated set of Quality of Life indicators
respectively. It is hoped that these data as they are presented can stimulate
discussion and interest in Local Carbon accounting as a step towards reducing
emissions of carbon. Where better local data is available from local governments
these data can be used to improve the estimates over time.
1.2 Methodology
This work has been made possible following the publication of new local gas,
electricity and road transport fuel consumption estimates by DTI (DTI 2004a, DTI
2005b). Together these sectors represent 80% of energy use in the UK.
Estimates of the distribution of CO2 emissions from other fuel use and industrial
processes are available from mapping work currently undertaken within the NAEI
contract.
The DTI electricity consumption data has enabled Netcen to map for the first time
carbon dioxide emissions from electricity generation to the point of consumption.
This is a key difference to the data previously published by the NAEI where
emissions have traditionally been attributed to the location of emission (e.g. at
the power station locations). For this report the “Emissions” from electricity
consumption have been estimated using an average UK factor in terms of kt CO2
per GWh. This average allocates equal shares of coal, gas, oil and renewable
powered generation to the electricity consumers and is derived from the UK
inventory for 2003.

LA and Regional CO2 2003 – Issue 1
AEA Technology 5
The local CO2 estimates presented in this report are split into three categories:
domestic (including electricity use), industrial and commercial (not including
power stations) and road transport. Within each sector there is then further
disaggregation by fuel and/or source type which requires further assumptions
about the fuel mix and demand. Natural (e.g. soils) and land use change
emissions are also included in the LA data. This additional level of detail is given
primarily in order to show how the overall estimates are constructed, rather than
because the categories shown are necessarily of robust quality or of particular
significance. The remainder of the UK emissions such as off shore emissions from
oil and gas extraction, fishing and coastal shipping, are reported as unallocated
because these could not be spatially disaggregated to LA level.
This reporting structure is different from that used for reporting the UK total CO2
emissions for Defra commitments under the UN Framework Convention on
Climate Change (in the National Communication Format). The simplified
structure has been adopted because of the aggregated nature of the data
available from the DTI.
1.3 Structure of this report
Official estimates of total UK emissions of CO2 for 2003 are summarised in
Section 2 of this report. The UK National Communication Format sector totals
are also compared with the emissions presented in this report. Section 3
describes the data and calculation methods used to derive the emission estimates
at Local Authority and Government Office Region level for this project. The
results are summarised in Section 4 and provided in detail in a spreadsheet
which accompanies this report (LocalRegionalCO2_2003V4.xls). Section 5 of this
report provides recommendations for improvements to this analysis.
2 Summary of CO2 inventory for the UK
An overview of the UK inventory for CO2 in 2003 is presented here (NAEI UK
Emissions Inventory 2003). This provides a context for the data presented in this
report.
The major emissions of carbon dioxide arise from the combustion of fossil fuels in
power generation, and the transport, domestic and industrial sectors (Figure 1).
The emission depends on the fuel mix and the level of fuel consumption. Details
of UK fuel consumption are given annually in the Department of Trade and
Industry's Digest of United Kingdom Energy Statistics (DTI, 2004). The fuel
consumption data used to calculate the pollutant emission totals in the NAEI are
given in Table 1; fuels which are used as feedstock in non-combustion activities
are omitted (principally natural gas used for the production of ammonia,
methanol and acetic acid and some use of LPG and OPG in petrochemical plants).
Emissions from such processes are calculated and allocated to the point of
emission.

LA and Regional CO2 2003 – Issue 1
AEA Technology 6
Figure 1 Time Series of CO2 Emissions from Key Sectors (Mtonnes CO2)
0
100
200
300
400
500
600
700
800
1970 19721974 1976 1978 1980 1982 1984 1986 1988 19901992 1994 1996 1998 2000 2002
CO
2 e
mis
sio
ns
(M
t)
Public Power Domestic Combustion Industrial CombustionRoad Transport Other Fuel Combustion Non-Fuel Combustion

LA and Regional CO2 2003 – Issue 1
AEA Technology 7
Table 1 UK Fuel Consumption, 2003 Fuel Consumer 2003
Coal Major Power Prod Mtonnes 52
Coal Industry Mtonnes 3
Coal Domestic Mtonnes 1
Coal Others Mtonnes 1
Other Solid Fuels All Consumers Mtonnes 2
Motor Spirit Road Transport Mtonnes 20
Gas Oil Road Transport Mtonnes 18
Gas Oil Industry Mtonnes 4
Gas Oil Others Mtonnes 3
Fuel Oil Major Power Prod Mtonnes 1
Fuel Oil Refineries Mtonnes 2
Fuel Oil Industry Mtonnes 1
Fuel Oil Others Mtonnes 0
Orimulsion Major Power Prod Mtonnes 0
Burning Oil Domestic Mtonnes 3
Burning Oil Others Mtonnes 1
Aviation Turb. Fuel Air Transport Mtonnes 11
Other Pet. Products All Consumers Mtonnes 1
Petroleum Gases Refineries Mtherms 1136
Petroleum Gases Others Mtherms 813
Natural Gas Major Power Prod Mtherms 9713
Natural Gas Industry Mtherms 10518
Natural Gas Domestic Mtherms 13171
Natural Gas Others Mtherms 4238
Other Gases All Consumers Mtherms 901
Source: Netcen, using the Digest of United Kingdom Energy Statistics published
by the DTI
Figure 2 illustrates the CO2 emissions mapped across the UK on a 1km x 1km
grid. Dispersed fuel combustion sources are clearly visible in urban centres and
across the road network. Emissions from power stations have not been assigned
to the electricity consumers and occur in relatively few grid squares and
therefore their impact is less visible on this map.

LA and Regional CO2 2003 – Issue 1
AEA Technology 8
Figure 2 Spatially Disaggregated UK Emissions of CO2

LA and Regional CO2 2003 – Issue 1
AEA Technology 9
2.1 Simplified sector split for Local CO2 estimates
A simplified sector split has been devised for this work on Local CO2 emissions.
This simplification has been necessary because of the aggregated nature of the
data from DTI, i.e. for both electricity and gas all industry and commercial
consumption are aggregated. The new DTI data does however provide a high
spatial resolution of consumption which has not previously been available.
The NAEI sectors included in the four Local CO2 reporting categories are
summarised in Table 2 below.
Table 2 NAEI emissions sectors in Local CO2 reporting categories
Local CO2
category
Detailed emission sources included in each category
Industrial and
commercial
Industry, commercial, agriculture and public sector fuel combustion
Industry, commercial, agriculture and public sector electricity use
Industrial process emissions
Management of airports and ports (support vehicles, stationary
heating and power)
Industrial and agricultural off-road machinery
Industry autogeneration of electricity
Electricity use and stationary combustion in the rail sector
Diesel rail transport
Waste incineration
Emissions from Agricultural soils
Deforestation
Domestic Domestic fuel combustion
Domestic electricity use
Domestic house and garden machinery
Road
Transport
Road transport fuel use and burning of lubricants
Land Use
Change
Natural CO2 emissions from soils
Other land use change emissions (peat extraction)
Unallocated
outside LA
boundary
emissions
Domestic Aviation Offshore gas and oil
Shipping (including coastal shipping and fishing)
(n.b. International aviation and shipping are outside scope of the UK
inventory)
Unallocated
inside LA
boundary
emissions
Some gas and electricity consumers which cannot be allocated for
confidentiality reasons or because of problems with geo-referencing
The unallocated emissions are for sectors that cannot be disaggregated to LA
level because the emission occur outside the Local Authority area i.e. aviation,
shipping and offshore oil and gas or can not be allocated for confidentiality
reasons (e.g. Large users of gas and electricity) or errors (e.g. old or non existent
postcode references that can not be geo-referenced) in the data sets.
The emission totals in the NAEI CO2 inventory in the National Communication
Format can be compared with the emissions totals in the Local CO2 reporting
categories. This comparison is shown in Figure 3.

LA and Regional CO2 2003 – Issue 1
AEA Technology 10
Figure 3 Summary of UK CO2 inventory for 2003
Further comment is provided on this comparison in section 4.1 after the
methodology for this work has been explained.
-50000 0 50000 100000 150000 200000 250000
Agriculture
Business
Energy Supply
Industrial Process
Land Use Change:
Emission
Land Use Change:
Removal
Public
Residential
Transport
Waste Management
Na
tio
na
l C
om
mu
nic
ati
on
Fo
rma
t C
ate
go
ry
Kilotonnes CO2
Industry and Commercial
Domestic
Road Transport
Land Use Change
Unallocated
Local CO2 Categories

LA and Regional CO2 2003 – Issue 1
AEA Technology 11
3 Datasets and methodology
The Local estimates of CO2 emissions presented in this report have been
calculated using data from a variety of sources. These are summarised in Table 3
and descriptions of the data and methods are provided in the following sections.
Table 3 Summary of data sources and methods
LA CO2
category
Fuel type / sector details Data sources and method
Domestic Electricity DTI electricity consumption data; Surrogate
population data to model NI consumption distribution
Gas DTI gas consumption data; Further data for Northern Ireland from Phoenix Gas.
Solid and liquid fuels NAEI modelling of fuel use distributions using population distributions and household fuel use (Experian survey)
Commercial
and industrial
Electricity DTI electricity consumption data; Surrogate
employment data to model NI consumption distribution
Gas DTI gas consumption data; Further data for Northern Ireland from Phoenix Gas and individual point sources. Additional NAEI point source data to fill gaps.
Solid and liquid fuels NAEI modelling of fuel use based in employment distributions and fuel intensity by sector.
Industrial process emissions Industry autogeneration of
electricity Stationary combustion and
electricity use in the rail sector Waste incineration
Large emission points from NAEI point source database.
The remaining emissions in each sector distributed using NAEI modelling of employment
and fuel intensity.
Industrial and agricultural off-road
machinery
Industrial off-road is allocated using a
distribution of employment within heavy industries. Agricultural off-road is allocated according to land use weighted by estimates of machinery usage on different land use types.
Management of airports (support
vehicles, stationary heating and power)
Airport support activities are allocated to
airport locations weighted by numbers of
aircraft movements at each Agricultural soils
Deforestation
Application of limestone and dolomite to
agricultural soils distributed in proportion to arable land use Emissions from deforestation assumed to be in proportion to forest land cover.
Rail Diesel emissions estimated based on train
movements (only for GB)
Road Transport
Petrol, diesel and others road transport
Emissions from fuel combustion in the road transport sector based on detailed DfT traffic census data and NAEI emissions factors.
Land Use Change
CO2 emissions from soils Other land use change emissions (peat extraction)
Natural emissions from soil distributed in proportion to amounts of arable land use Emissions from land following peat extraction distributed in proportion to amounts of bogs (deep peat) land cover

LA and Regional CO2 2003 – Issue 1
AEA Technology 12
3.1 Electricity consumption
The DTI electricity consumption data used in this work is an experimental dataset
published for the first time (DTI, 2004a). It has been compiled using data from
the administrative systems of the electricity companies’ data aggregators. It has
been noted by DTI that the quality of this data is variable across the country and
that there is still significant further work to do to improve it. However it provides
a very useful first attempt to distribute electricity consumption across the UK.
The CO2 emission for electricity consumption from the NAEI in 2003 (174,467
kilotonnes) was distributed across the Local Authorities based on the consumption
data for both domestic and industrial and commercial users.
The domestic electricity consumption data was calculated by DTI from actual or
estimated meter readings of 25 million electricity meters across Great Britain.
The location of these meters were determined from the Gemserve database of
meters MPAS (Meter Point Administration System). DTI have identified some
errors in the data files used to allocate meter point postcodes to local authorities
and have published a list (Energy Trends, Sept 2005) of those authorities which
they think were most seriously affected. These have been flagged in the
spreadsheet accompanying this report.
Data for the industrial and commercial sector was also obtained from meters but
there were problems with the geographical referencing of a significant proportion
of the meters. Therefore 10% of the industry and commercial electricity
consumption has not been allocated to Local Authorities. The carbon emissions
associated with this electricity is therefore reported as unallocated in the results
presented in this report.
Reconciliation with data in DUKES by DTI found the result to be an over estimate
of nearly 5% of the GB total domestic electricity consumption (DTI, 2005a Table
1 p33). This is possibly because of the inclusion of some non-domestic users
within this dataset as a result of the requirement for an arbitrary cut-off of
100,000 KWh above which the user is assumed to be industrial or commercial .
DTI are still working to improve this. The statistical difference overall for all users
is +0.3% and is therefore a good match with DUKES totals.
The DTI data also includes 9210 GWh of electricity as direct sales to high voltage
lines that cannot be allocated to any region or Local Authority due to the lack of
information. Emissions associated with this electricity consumption are included
in table 8 as an unallocated item. This takes the overall percentage of industrial
and commercial electricity consumption unallocated to LAs, either because of geo-
referencing problems or because it is direct sales, to 15%.
The DTI dataset does not provide a distribution of electricity consumption in
Northern Ireland. The Energy Trends article published in March 2005 (DTI
2005a) does however provide total electricity consumption for the domestic
sector (2589 Gwh) and industrial and commercial sectors (4121 Gwh). The
distribution of domestic consumption across Northern Ireland has been modelled
using population counts by Local Authority, and for the commercial and industry
sectors using total employment by Local Authority.

LA and Regional CO2 2003 – Issue 1
AEA Technology 13
3.2 Gas consumption
The gas data published by DTI provides estimates of gas consumption by the
domestic sector and the industrial and commercial sector for each Local Authority
in Great Britain (DTI 2004a). The estimates have been compiled by DTI using
data provided by National Grid Transco (NGT) at postcode sector level. DTI have
allocated each postcode sector in the NGT dataset to one or more Local Authority
(LA) area. Issues exist for future gas data collection with the expected break up
of NGT. DTI are working to secure future data supply from future gas
distributors.
Data quality issues
There are a number of issues with the NGT data that reduce the overall quality of
the dataset and results in some misallocation of gas use between LAs but is at
present the best available information. The extent of this misallocation is not
quantified but this is considered to be one of the more significant sources of
uncertainty. DTI have listed (Energy Trends, March 2005) those authorities where
they think these problems seem to be most evident in terms of estimated
domestic customer numbers, and these have been flagged in the spreadsheet
accompanying this report.
Firstly for reasons of confidentiality some postcode sectors in the NGT data have
been aggregated so that one consumption total is given for a number of postcode
sectors.
Secondly in some cases there was not a simple match of postcode sector to LA
therefore simple assumptions were used to allocate the gas consumption across
LAs – an equal split based on land area. Where local information was received
from LAs to provide a better split then this was used.
Thirdly some postcode sectors specified in the NGT dataset do not appear in the
most recent postcode sector to LA lookup file provided by the Office of National
Statistics. This is a result of old postcode sector boundaries used by NGT to
locate gas meter points. DTI made simple assumptions to allocate these
postcode sectors to LAs which had postcode sectors with similar numbers.
For this project Netcen has not made any attempt to modify the DTI gas use
estimates in the light of the issues raised above. These issues apply equally to
the domestic and commercial and industry datasets. If NGT is able to provide
higher resolution data using up to date postcode sector boundaries in future then
these problems could be reduced.
There is one further very significant issue relating to the commercial and industry
consumption data. The largest gas users have been excluded from the LA totals
for reasons of confidentiality. This exclusion equates to 30% of all gas use and
comprises 31 power stations and 16 large industrial users. However the local
authority areas in which these 47 users are located are known as is the total gas
usage by the excluded users (by Government Office Region) and users in
Northern Ireland. Netcen has used site specific emissions data from the
Environment Agency’s Pollution Inventory to deduce the locations of these
exclusions and to provide estimates of CO2 associated with them. The method for
identifying site specific fuel usage is described in Annex 1 of this report.

LA and Regional CO2 2003 – Issue 1
AEA Technology 14
Gas consumption in Northern Ireland
Data for Northern Ireland has been added to the DTI dataset using information on
total Northern Ireland gas consumption from Phoenix Gas. For the domestic
sector the total consumption is 800 GWh and for Commercial and Industry the
total is 1910 GWh (Moynihan, 2004). This does not include gas use at
Ballylumford power station. (Emissions from this station are re-distributed
according to electricity consumption along with all other UK power station
emissions.)
CO2 emissions from domestic gas consumption
The gas consumption estimates for the domestic sector have been used to
distribute the UK total CO2 emission for the domestic gas sector. It is assumed
that emission factors for domestic gas use are constant throughout the country.
CO2 emissions from commercial and industry gas consumption
In the case of the commercial and industry sector the emissions estimates for the
excluded sites were calculated using the data from the Netcen point source
database which uses public domain emissions data to estimate energy use (see
annex 1). The gas consumption at the excluded sites were estimated as follows.
Netcen’s site specific fuel usage estimates for gas (derived using the method
described in Annex 1 of this report) were compared with the data on the location
of the 47 gas consumers excluded from the DTI data in order to deduce which
sites in Netcen’s point source database might correspond to the exclusions from
the DTI data. In the case of the power stations, this was a relatively easy task
due to the limited number of power stations in the UK. In most cases,
identification of the excluded power station was not in doubt but some
uncertainty remained regarding the following:
The DTI data excluded one power station in Fife but the Netcen data included
two power stations which use gas (in one case as a secondary fuel);
The DTI data excluded three power stations in North Lincolnshire while the
NETCEN data included four power stations in this area;
The DTI data excluded one power station each in Stockton-on-Tees, Kingston
upon Hull, and Huntingdonshire, but no power stations could be identified in
these areas in the Netcen data. Instead, it was assumed that they referred to
power stations in Redcar and Cleveland, East Riding of Yorkshire and Bedford
instead.
Some of the problems listed above might arise due to errors in the allocation of
sites to local authority areas in one or both sets of data. Local authority
boundaries have also changed from time to time and so differences could also be
due to the use of data from different periods in the two data sets.
The 16 large industrial users could not be identified with much certainty. In most
cases, the Netcen data contained more plant for a given area than were excluded
from the DTI data. It was also not clear whether ‘plant’ given in the Netcen data
were equivalent to ‘sites’ given in the DTI data, or whether multiple plant on a
single industrial site might constitute a single ‘site’ in the DTI data. For reasons
of simplicity it was decided that plant in the Netcen data would be assumed to be
equivalent to sites in the DTI data and that the largest user of gas in a given area
would be assumed to be that excluded by DTI. In the case of Middlesborough,

LA and Regional CO2 2003 – Issue 1
AEA Technology 15
the DTI data excluded one large user but no users were found in the Netcen data.
Instead, it was assumed that the DTI referred to a very large user in the
neighbouring Redcar and Cleveland area.
Overall agreement between the gas consumption for the excluded sites and gas
consumption as estimated by Netcen was very good, despite the problems with
identification. Northern Ireland is included with power stations in the table below
because this is how the numbers were reported by DTI (DTI 2004a Table 1 p20).
Table 4 Comparison of DTI excluded gas consumption and Netcen calculated gas
consumption at large point source and Northern Ireland
Gas consumption reported by
DTI (GWh)
Netcen (GWh)
Power stations +
Northern Ireland
278367 274878
Large industrial users 35835 38831
All excluded users 314202 313708
These site specific gas use estimates i.e. the Netcen figures in Table 4 were
converted into CO2 emissions estimates at each site using sector specific emission
factors from the NAEI. The total emission for the excluded sites excluding the
power stations (whose emissions are distributed by electricity consumption as
discussed above) was 7281 kilotonnes of CO2. The residual UK industry and
commercial emission was then calculated and distributed using the Dti LA level
gas consumption estimates for the Commercial and Industry sector. This residual
was calculated as shown in Table 5. It is assumed that emission factors for this
industrial and commercial gas use are constant throughout the country.
Table 5 Calculation of remaining CO2 emission from Commercial and Industry
sector after exclusions
Kt CO2
NAEI emission for Industry and commercial (not
including power stations)
80049
Agriculture + 277
Processes + 1164
Total Local CO2 Industry and Commercial gas use
emission
81491
Large users (not including power stations) excluded
from this dataset
- 7281
Total emission to distribute using the DTI gas data 74209*
*Please note that not all of this NAEI emission was able to allocate across the LAs
(see results in Table 8) as some of the DTI Industrial and commercial
consumption are included in the domestic gas.

LA and Regional CO2 2003 – Issue 1
AEA Technology 16
3.3 Other Domestic fuel use
The methodology used for mapping emissions from domestic combustion uses
detailed data on fuel use by postcode areas. The maps of domestic fuel use were
developed for the NAEI 2000 inventory with further work on the Northern Ireland
distribution undertaken for the 2002 inventory. These distributions will be
updated for 2004. They are not updated every year because of resource issues.
For England, Scotland and Wales, domestic emissions are based on Experian
consumer survey data (Business Geographics, 2001) that gives the number of
households within a postcode sector using a particular fuel for heating. These
households are distributed within each postcode sector on the basis of the 1km
population density map assuming constant fuel usage per household. These
calculations generated initial distribution maps for the following fuels: coal, wood,
solid smokeless fuel, coke, gas oil, burning oil and bottled gas.
However it is important to be consistent with the NAEI Devolved Administrations
Emission Inventory. Therefore the distributions were then re-normalised to be
consistent with domestic fuel consumption totals for the UK Devolved
Administrations. These are calculated using country specific statistics and factors
which indicate the typical domestic energy consumption per capita in each region.
The domestic coal and Smokeless Solid Fuels grids have also been further
enhanced to limit coal burning to outside Smoke Control Areas (SCAs) and to limit
SSF burning to within SCAs. However the maps available of SCAs were of limited
quality and rather old. This work therefore needs updating for the 2004 NAEI
mapped inventory.
The Experian data did not cover Northern Ireland, therefore a different
methodology was used. The fuel use grids have been generated from a wide
range of data sources including:
Northern Ireland Housing Executive household data (from NIHE property
database);
Gas household data (from Phoenix Gas);
Belfast household data (from fuel use survey undertaken by Belfast City
Council);
Other household data not covered by the above (from number of sources,
including Housing Condition Survey (HCS) data).
Based on a bottom up approach, household fuel use figures have been derived
from fuel use surveys and applied to data on household numbers and fuel use
type from the NIHE database. Full details of this method for Northern Ireland are
available in Pye and Vincent (2003).
Domestic House and Garden Machinery
The NAEI source called Domestic house and garden machinery is also included in
the domestic sector for the LA CO2 estimates. These emissions are distributed
across the UK Local Authorities according to the population distribution in the
2001 Census but excluding highly urban areas using land cover map definitions.

LA and Regional CO2 2003 – Issue 1
AEA Technology 17
3.4 Road transport
Road transport fuel use estimates at Local Authority level were compiled this year
by Netcen for DTI. The method used is described in detail in Goodwin et al
(2005) which assessed a number of different methods for allocating road
transport emissions. This project has adopted the approach taken by Goodwin et
al (2005) for the allocation of emissions to road transport.
In summary, emissions on major roads are estimated using detailed vehicle
specific traffic census data (annual average daily flows) for 2003 from the
Department for Transport and Department for Regional Development in Northern
Ireland. This census data is mapped on to Ordnance Survey and Ordnance
Survey Northern Ireland detailed road maps.
Fuel use is calculated for each vehicle type on a road link basis using fleet
weighted emission factors for each vehicle type and assumptions about speeds on
each road type and in various different parts of the country. Emissions on minor
roads are calculated in a similar way but the traffic flow data is more generalised,
with average flows applied to all roads of a particular type across each
Government Office Region.
The LA level fuel use data have been used in this study to estimate road transport
CO2 emissions. Total petrol and diesel use in each LA were combined with the
appropriate NAEI emission factors for CO2.
One important comment on this dataset is that it represents all fuel use on UK
roads by calculating fuel use from ‘bottom up’ estimates of vehicle kilometres
using detailed traffic flow data and assumptions about vehicle fuel efficiency.
There are therefore some differences between these estimates and the DTI fuel
sales based estimates reported in the NAEI to the UNFCCC and the UNECE. It is
thought that some of this difference is from fuel imported from Europe and
Ireland but other elements in the estimation method may also contribute. The
reported CO2 2003 emission from petrol and diesel used (based on DTI fuel sales
data) in road transport is 117865kt. The additional emission resulting from the
bottom up method based on vehicle kilometres and vehicle fuel consumption
assumptions is 9057kt an addition of about 7%.
There are two other small sources of emissions from road traffic included in the
inventory. These are combustion of waste lubricants and emissions from LPG
vehicles. Both of these sources are distributed across LAs using estimates of total
vehicle kilometres calculated from the NAEI maps of traffic flows.
3.5 Diesel rail transport
The UK total rail emissions are compiled from three journey types: freight,
intercity and regional. Emissions are calculated based on fuel use reported in
DUKES. Because it is not possible to separate rail use of electricity from
commercial and industrial from the DTI dataset both diesel and electric emissions
from the rail sector are allocated to commercial and industrial sector.
Rail emissions for locomotive diesel are distributed across Great Britain using
maps of rail links and details of the number of vehicle kilometres by the three
journey types on each rail link. Emissions are distributed across the rail network
by assigning an appropriate emission from journey type to each rail link. The
emissions along each rail link are assumed to be uniformly along the length of the
rail link, as no information on load variations is yet available.

LA and Regional CO2 2003 – Issue 1
AEA Technology 18
The rail network used for this mapping does not currently included Northern
Ireland. However this is not a significant omission as it only represents 1.3% of
fuel consumption in this sector (NAEI Devolved Administrations Emission
Inventory 2003). The total CO2 emission for diesel trains in the UK is 964kt.
Electricity used by railways is included in the Industrial and Commercial dataset
from DTI. DUKES 2004 Table 5.3 states that National Rail used 2700 GWh in
2003 (DTI 2004b). Electricity provides about 50% of the energy used by railways
(calculated by AEA Technology as part of work on behalf of the Strategic Rail
Authority). However in any particular Local Authority it is likely that this split will
not be 50% because of the uneven distribution and electric and diesel trains
across the UK - with more electrification in the south east of England than in the
rest of the UK. Also the DTI LA level dataset does not include all actual locations
of the electricity consumption because they are not known so some electricity use
by railways is unallocated (Janes pers comm.).
3.6 Other Industrial and Commercial fuel use
The industrial sectors in the NAEI are mapped using a combination of site specific
(point source) estimates of emissions and area source employment based
distributions. For some sectors the site specific emissions totals are equal to the
NAEI emissions estimate for that sector. In other cases there are other sources
that are not included within the site specific dataset. The remaining emission is
then treated as an ‘area source’ and distributed across the UK using detailed
employment and fuel use data. Small industrial combustion is an example of a
sector for which the area source distribution is particularly important. The
commercial and public service sectors of the NAEI inventory are entirely mapped
as area sources.
Site Specific Emissions
The site specific data have been compiled from a number of sources:
Environment Agency Pollution Inventory;
SEPA European Pollutant Emission Register;
Northern Ireland Inventory of Statutory Releases;
The UK’s National Allocation Plan for the EU carbon emission trading scheme;
And other information obtained from Netcen’s industry contacts.
Site specific fuel and CO2 emissions estimates have been made for the following
sectors:
Power stations;
Other plant regulated as combustion processes under Integrated Pollution
Control (IPC);
Refineries;
Integrated steelworks;
Coke ovens;
Cement clinker manufacture;
Lime manufacture;
Other plant regulated under IPC;
Combustion processes not subject to regulation as combustion processes
under IPC but included in the UK’s National Allocation Plan (NAP) for the
purposes of the EU carbon emission trading scheme (EU ETS).

LA and Regional CO2 2003 – Issue 1
AEA Technology 19
In all cases, however, the estimates are consistent with national emission
estimates compiled for the UK Greenhouse Gas Inventory (GHGI) which, in turn,
is consistent with energy statistics published in the Digest of UK Energy Statistics
(DUKES). Full details of the method used to derive the fuel use estimates are
provided in Annex 1 in this report.
For the purposes of reporting emissions by fuel type a simplified classification of
fuel types has been used. This is shown in Table 6.
Table 6 Fuel categories for reporting emissions
Fuel Name Fuel Category
Colliery methane Natural gas
Natural gas Natural gas
Burning oil Oils
DERV Oils
Fuel oil Oils
Gas oil Oils
LPG Oils
Naphtha Oils
OPG Oils
Orimulsion Oils
Petrol Oils
Lubricants Oils
Blast furnace gas Process gases
Coke oven gas Process gases
Sour gas Process gases
Anthracite Solid fuels
Coal Solid fuels
Coke Solid fuels
Petroleum coke Solid fuels
SSF Solid fuels
Landfill gas Wastes and biofuels
Sewage gas Wastes and biofuels
Wood Wastes and biofuels
MSW Wastes and biofuels
Scrap tyres Wastes and biofuels
Waste oils Wastes and biofuels
Clinical waste Wastes and biofuels
Waste solvent Wastes and biofuels
Benzole & tars Wastes and biofuels
Employment based distributions for area source
To develop emissions distribution maps for the small industrial combustion, public
services, commercial and agriculture (stationary combustion) sectors the
following data sets are used:
Office of National Statistics Inter-Departmental Business Register (IDBR) 2005
which provides data on employment at business unit level by Standard
Industrial Classification (SIC) code; and
DTI Energy Consumption in the UK data on industrial and commercial sector
fuel usage for 2002. (DTI, undated report, Tables 4.6, 5.2 and 5.5)
The SIC codes in the IDBR database were matched with the DTI energy datasets
in order to calculate total employment by DTI energy sector. From this a fuel

LA and Regional CO2 2003 – Issue 1
AEA Technology 20
intensity per employee was calculated. These intensities could then be applied to
employment distributions across the UK to make maps of fuel use.
In the case of the industrial sectors this energy intensity calculation was done at
the level of 4 figure SIC codes (over 250 separate industry types) to retain the
level of detail required for the mapping. Any aggregation of SIC codes would
have resulted in a reduction in the quality of the final distribution. The DTI fuel
data was reported for coal, manufactured fuel (SSF), LPG, gas oil, fuel oil and
natural gas. These were aggregated to calculate industry specific fuel intensities
for Coal, SSF, Oil and Gas.
In the case of the commercial and public service sectors the employment data
was aggregated to be equivalent to the energy data provided by DTI. These
sectors are shown in Table 7. There was not sufficient data to be able to
calculate a fuel specific fuel intensity factor for these sectors. Therefore a total
fossil fuel intensity factor was calculated.
Table 7 Service sector energy consumption sub-sectors and NAEI sectors
Service sector energy consumption
sub sectors
NAEI emissions sector
Commercial Offices Commercial
Communication and Transport Commercial
Hotel and Catering Commercial
Other Commercial
Retail Commercial
Sport and Leisure Commercial
Warehouses Commercial
Education Public admin and services
Government Public admin and services
Health Public admin and services
The IDBR employment data were aggregated to 4 figure SIC codes at 1km
resolution using grid references provided as part of the database. The
employment totals for each sector were then multiplied by the appropriate fuel
intensity values to make fuel use distributions across the UK. These were then
used to distribute CO2 emissions for the relevant sector from the NAEI for 2003.
It has been assumed that fuel intensity for each sector is even across the sector.
This is a simplification of reality but necessary because of lack of more detailed
estimates of fuel use.
As a result of the lack of detailed information about the fuel types used by the
commercial and service sectors, a simple assumption was used to decide where
the different fuels were used. Gas is assumed to be used in urban areas where
there is a gas supply (based on postcode sector level data from National Grid
Transco and a percentage continuous urban land cover at 1km resolution of
greater than 10%). For all other areas a mix of fuels is assumed according to the
national mix of fuel used in the relevant service sector using data from the NAEI
derived from DUKES.
For some sectors a simple map of employment has been used instead of fuel use.
These are mostly for sectors where process emissions are important but also for
estimating the distribution of industrial off-road emissions. These have been
mapped using a distribution of employment in heavy industries.
Other distribution grids used to map area source emissions

LA and Regional CO2 2003 – Issue 1
AEA Technology 21
Natural emissions are distributed using 1km resolution land cover maps derived
from the Land Cover Map 2000 data from the Centre for Ecology and Hydrology
(CEH).
Agriculture off-road emissions are distributed using a combination of arable,
pasture and forestry land use data. Each of these land cover classes was
weighted according to the off-road machinery activity on each land use. This
used data on the number of hours of use of tractors and other machinery on
these land use types, sourced by Netcen for improving the UK inventory in this
sector.
3.7 Aggregation of emissions to Local Authority level
The calculations of emissions from electricity use, gas use and road transport for
this report were done at the Local Authority level using data provided at this level
by DTI and required no further aggregation.
The calculations of emissions for all other sectors has been done by using the
NAEI 1km resolution maps. A map of Local Authorities boundaries has been used
to assign each 1km square of the NAEI maps to a Local Authority. The 1km
emission maps could then be aggregated up to Local Authority level.

LA and Regional CO2 2003 – Issue 1
AEA Technology 22
4 Results
The results of this work are presented at a variety of levels of detail. Table 8 on
the following page shows regional totals for the detailed sectors and fuels. Local
Authority level detailed data are available in the spreadsheet that accompanies
this report. The spreadsheet contains a detailed breakdown of emissions by
sector and fuel together with population counts and per capita emissions.
Use of the data:
This data is compiled using national spatial data and attempts to locate emissions
where they occur. The data do not estimate emissions resulting from the
production or transportation of materials or consumables unless the production or
transportation occurs with in the defined area boundary. Emissions for transport
are for traffic activities within the Region or Local Authority and do not include
residents activities outside the boundary. Only very limited local knowledge or
data has been used due to the resource limitations of this project. Therefore,
there are a number of sectors that have a high level of uncertainty in the data.
These sectors include the combustion of coal and liquid fuels in small
industry/commercial/public service and domestic. This is because there is very
limited knowledge of the distributions of coal and liquid fuel use. This work does
not take into account localised renewable consumption or energy efficiency
through the use of CHP and does not attempt to correct or fill gaps in the DTI
electricity use or gas use datasets. If used as indicators (e.g. by dividing the
total or sub totals by the population or GDP) some misleading results can occur
due to the over simplification of the emissions allocations and the lack of local
knowledge. Useful comparisons can be made for the road transport data and the
electricity and gas consumption data. However, the user should be aware that
even these datasets have limitations and excluded components that may result in
only partial representation of a Local Authority or Region.
In most cases emissions will include elements that are outside of a Region or
Local Authorities control (e.g. traffic from outside the region). However, a Region
or Local Authority can be influential in improving many sources that are not
within their direct control (e.g. encouragement of energy efficiency and renewable
measures in planning developments, parking/travel incentives for cleaner vehicles
using the area).
These estimates can be used as indicative estimates to raise awareness about
emissions and emission reduction potential, or as a starting point for a more
detailed and rigorous Local Inventory. However, these estimates should not be
used for detailed benchmarking or target setting with out checking against local
data for the main source categories.

LA and Regional CO2 2003 – Issue 1
AEA Technology 23
Figure 4 below shows total CO2 emissions per capita by Local Authority (excluding
natural emissions). This highlights those LAs that have significant industrial
emissions particularly where population numbers are low. Further maps are
provided in on the pages following Table 8.

LA and Regional CO2 2003 – Issue 1
AEA Technology 24
Figure 4 CO2 emissions by Local Authority per capita in 2003 (in Kt CO2)

LA and Regional CO2 2003 – Issue 1
AEA Technology 25
Table 8 Detailed results for Government Office Regions (kt CO2)
NUTS4 Area and Government Office Region WALES SCOTLAND
NORTH EAST
NORTH WEST
YORKSHIRE AND THE HUMBER
EAST MIDLANDS
WEST MIDLANDS
EAST OF ENGLAND
GREATER LONDON
SOUTH EAST
SOUTH WEST
NORTHERN IRELAND
Unallocated consumption
Large elec users (high
voltage lines) unknown location
UK TOTAL
Industrial and Commercial Electricity 5361 8830 4135 11161 7256 7565 5953 7996 13804 12322 7095 2218 10515 4956 109166
Industrial and Commercial Gas 4244 5848 2860 8583 7416 4619 5987 4897 6946 7053 3722 386 62559
Industrial Gas (Exclusions) 469 1150 1629 2263 387 257 89 6245
Industry Commercial Oil 4591 4041 2437 4485 6216 1673 1673 3580 463 4885 2238 1210 37494
Industry Commercial Solid Fuel 1777 908 4534 902 2244 882 370 793 17 1535 377 320 14658
Industry Commercial Wastes And Biomass 75 148 162 318 198 182 394 88 334 254 105 33 2291
Industry Process Gases 3947 21 5431 32 6280 110 140 17 6 14 30 3 16030
Industry Non Fuel 1018 493 844 1063 1029 1363 402 282 7 1400 353 177 8431
Industry Off-Road Machinery 151 207 124 334 266 270 339 232 115 275 221 78 1 2613
Agriculture Oil 61 92 17 43 36 40 42 40 1 51 85 55 5 566
Agriculture Solid 1 2 0 1 1 1 1 1 0 1 2 1 12
Agriculture And Deforestation 31 170 40 34 98 138 73 202 2 118 129 18 5 1058
Railways 56 84 36 64 89 107 94 65 41 141 181 5 963
Total Industry and Commercial 21782 21993 22250 29283 31516 16949 15467 18193 21737 28049 14793 4588 10530 4956 262087
Domestic Electricity 2796 6855 2442 6867 5081 4581 5709 6478 7419 9266 6142 1393 271 65301
Domestic Gas 4096 6908 4183 10964 7753 6302 7782 7339 11327 11748 5617 162 84181
Domestic Oil 494 568 168 522 487 618 696 1645 86 1235 1402 1756 9676
Domestic Solid Fuel 641 453 182 248 522 485 294 230 73 206 260 733 4327
Domestic Home And Garden 12 22 11 29 21 18 23 23 31 34 21 7 252
Total Domestic 8040 14806 6985 18630 13864 12005 14504 15715 18935 22489 13442 4051 271 163737
Road Transport Petrol 3331 5453 2556 7442 5454 5183 6132 6857 5811 10751 6076 2624 67670
Road Transport Diesel 2703 4997 2080 6822 5572 5520 5968 6341 4207 8294 5033 1717 59253
Road Transport Other 83 135 63 182 137 132 158 175 130 272 152 62 2 1683
Total Road Transport 6116 10586 4699 14446 11164 10834 12258 13373 10147 19317 11262 4403 2 128606
Land Use Change 225 2979 540 467 1278 1700 833 2455 22 1288 1475 350 64 13676
Total 36163 50363 34473 62826 57822 41488 43061 49735 50842 71144 40972 13392 10867 4956 568105
Power Station Emissions: 13753 17978 4030 10333 47920 28340 6293 11854 3316 22928 2704 5020 174467
Electricity consumption emissions 8157 15684 6577 18028 12337 12146 11662 14474 21223 21589 13237 3611 10786 4956 174467
Regional Totals without electricity consumption allocation 41759 52657 31926 55131 93405 57682 37692 47115 32935 72483 30439 14801 81 568105

LA and Regional CO2 2003 – Issue 1
AEA Technology 26
The maps on the following pages display emissions that are normalised by area in
order to make comparisons between local authorities more meaningful – showing
emission intensity rather than a total emission.
Figure 5 Domestic CO2 emissions by Local Authority for 2003

LA and Regional CO2 2003 – Issue 1
AEA Technology 27
Figure 6 Industry CO2 emissions by Local Authority for 2003

LA and Regional CO2 2003 – Issue 1
AEA Technology 28
Figure 7 Transport CO2 emissions by Local Authority for 2003

LA and Regional CO2 2003 – Issue 1
AEA Technology 29
Figure 8 Natural CO2 emissions by Local Authority for 2003

LA and Regional CO2 2003 – Issue 1
AEA Technology 30
4.1 Reconciliation with NAEI totals and DA inventory
Table 9 provides a comparison between the total emissions provided in this report
and the UK CO2 inventory in National Communication Format. The key points to
note from this comparison are as follows:
i. Energy supply emissions have been redistributed across domestic and
industrial and commercial users of electricity. There is also an unallocated
portion of this emission that is Offshore Oil and Gas.
ii. Domestic gas emissions are slightly higher in the Local CO2 estimates (84
kt CO2) which may due to different allocation method used by DTI.
iii. Land Use Change emissions in the Industry and Commercial sector are
application of limestone and dolomite to agricultural soils and
deforestation.
iv. The road transport emissions in this table show separately the 9057 kt
CO2 the difference between emissions calculated from DTI fuel sales data
and those estimated from vehicle kilometre data (it is thought that some
of this difference is from imported fuels in vehicle tanks).
v. The unallocated transport emissions are aviation and shipping emissions.
vi. The transport emissions that are shown in the Industry and Commercial
column relate to airport support vehicles and the rail sector.
vii. The industry totals include a slight point sources over estimate (528 kt
CO2) show separately under “Excluded” which are not included in the
reported NAEI totals.
viii. Emissions sinks have not been included in the Local CO2 estimates.
ix. Lastly, there are some slight differences in the numbers in this table and
those in Table 10 because of rounding.
Table 9 Summary of UK CO2 inventory for 2003 (kt CO2) quoted on an IPCC
basis.
Emissions in kt CO2
National Communication Format
Category Domestic
Industry and
Commercial
Road
Transport
Land Use
Change
LA CO2
Total
Unallocated
(1) UK Total
Agriculture 855 855 855
Business 98480 98480 98480
Energy Supply 65301 147748 213048 5226 218274
Industrial Process 12845 12845 12845
Land Use Change: Emission 1058 13676 14734 14734
Land Use Change: Removal -16270 -16270
Public 11095 11095 11095
Residential 85750 85750 85750
Road Transport 119548 119548 119548
Other Transport 1069 1069 8535 9604
Waste Management 1013 1013 1013-
Re-allocation (2) 12008 -12008 - -
Excluded (3) 84 528 9057 9669 - -
Total 163142 262683 128604 13676 568105 -2509 555928
(1) Emissions not allocated to LA CO2 See points (ii), (iv) and (vii) above
(2) Re-allocation due to DTI miss allocation of electricity data between domestic and commercial and industry
(3) Excluded from the UK total because of different calculation methodology
Local CO2 Category National Communications

LA and Regional CO2 2003 – Issue 1
AEA Technology 31
Comparisons at Devolved Administration level
The totals for the Devolved Administrations presented in this report have also
been compared with those presented in the NAEI Devolved Administration
Inventory for 2003. The results are very similar once the redistribution of power
station emissions have been taken into account.
There are also slight differences in the emissions from fuel use in the domestic
and industry sectors, especially for oil. These are the result of updated methods
used to derive these local estimates that will be applied to future devolved
Administration inventories.
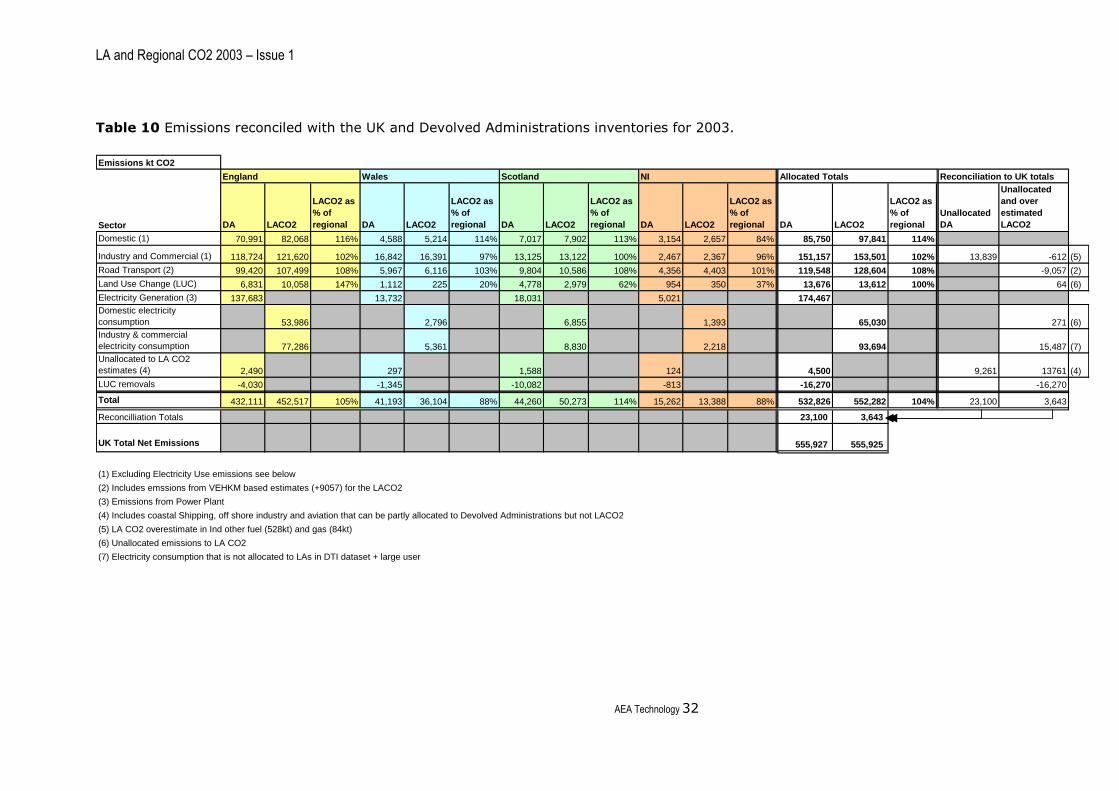
Table 10 shows a comparison between Devolved Administrations (DA) estimates
and those done for this project (LA CO2). Due to rounding errors the final totals
are slightly different. Overall there is a 4% difference between the DA and LA
CO2 totals resulting from slight differences in the methodology for LA CO2
emissions allocations and in the allocations of shipping and Land Use Change
emissions. Electricity consumption emissions have not been calculated for the DA
inventory and therefore the DA emissions are from Electricity production only.
LA and Regional CO2 2003 – Issue 1
AEA Technology 32
Table 10 Emissions reconciled with the UK and Devolved Administrations inventories for 2003.
Emissions kt CO2
DA LACO2
LACO2 as
% of
regional DA LACO2
LACO2 as
% of
regional DA LACO2
LACO2 as
% of
regional DA LACO2
LACO2 as
% of
regional DA LACO2
LACO2 as
% of
regional
Unallocated
DA
Unallocated
and over
estimated
LACO2
Domestic (1) 70,991 82,068 116% 4,588 5,214 114% 7,017 7,902 113% 3,154 2,657 84% 85,750 97,841 114%
Industry and Commercial (1) 118,724 121,620 102% 16,842 16,391 97% 13,125 13,122 100% 2,467 2,367 96% 151,157 153,501 102% 13,839 -612 (5)
Road Transport (2) 99,420 107,499 108% 5,967 6,116 103% 9,804 10,586 108% 4,356 4,403 101% 119,548 128,604 108% -9,057 (2)
Land Use Change (LUC) 6,831 10,058 147% 1,112 225 20% 4,778 2,979 62% 954 350 37% 13,676 13,612 100% 64 (6)
Electricity Generation (3) 137,683 13,732 18,031 5,021 174,467
Domestic electricity
consumption 53,986 2,796 6,855 1,393 65,030 271 (6)
Industry & commercial
electricity consumption 77,286 5,361 8,830 2,218 93,694 15,487 (7)
Unallocated to LA CO2
estimates (4) 2,490 297 1,588 124 4,500 9,261 13761 (4)
LUC removals -4,030 -1,345 -10,082 -813 -16,270 -16,270
Total 432,111 452,517 105% 41,193 36,104 88% 44,260 50,273 114% 15,262 13,388 88% 532,826 552,282 104% 23,100 3,643
Reconcilliation Totals 23,100 3,643
UK Total Net Emissions 555,927 555,925
(1) Excluding Electricity Use emissions see below
(2) Includes emssions from VEHKM based estimates (+9057) for the LACO2
(3) Emissions from Power Plant
(4) Includes coastal Shipping, off shore industry and aviation that can be partly allocated to Devolved Administrations but not LACO2
(5) LA CO2 overestimate in Ind other fuel (528kt) and gas (84kt)
(6) Unallocated emissions to LA CO2
(7) Electricity consumption that is not allocated to LAs in DTI dataset + large user
Sector
England Wales Scotland NI Allocated Totals Reconciliation to UK totals

LA and Regional CO2 2003 – Issue 1
AEA Technology 33
5 Limitations of the existing data and recommendations for improvements
There are a number of improvements that could be made to the emission
estimates presented in this report. Many of these depend on acquiring more
detailed datasets.
The following recommendations offer ideas for future improvements to the data.
These ideas are grouped into one of two categories. Those that would bring
“significant improvement” and usability to the data and those that will have a
minor impact on the data quality classed as “Other Improvements”.
5.1 Significant Improvements
Annual updates and Development of Historic (1990 or 2000) base year
estimates for progress monitoring.
As there is likely to be continued interest on progress emissions reductions there
will be a continued demand for local and regional emissions estimated that are
comparable. It is therefore recommended that an annual update programme be
established to derive updates on an annual basis. If estimates are updated
annually it will be important to make sure that previous years estimates remain
consistent so that a meaningful time series can be presented. This will require
“back” revisions to early years data to accommodate improved methodologies
and ensure that time trend fluctuations reflect “real” changes rather than changes
in methodology.
Climate Change Levy Agreement data
Access to this data would provide additional fuel consumption information for
smaller industrial plant not reporting under the EUETS and enable a more
accurate picture of the consumption of different fuels for a number of small to
medium sized installations. This data is currently compiled by a number of
agencies representing industrial trading groups and trade associations and
provided to Defra on an annual basis. It is currently help as commercially
sensitive data and therefore not available to the UK inventory. Use of this data
would greatly improve the distribution of all fuel based emissions from industry,
commercial and agricultural sources. Significant effort may be required to collate
and reconcile the data with the UK inventory and geo-reference the site specific
datasets. Issues of confidentiality may require some aggregation of the data for
some Local Authorities. If available this data would also enhance other UK
inventory outputs for air quality modelling and policy support.
Gas Consumption Data
Higher spatial resolution data on gas consumption from National Grid Transco
would significantly improve the domestic and industrial and commercial gas
distribution and allocations to Local and Regional areas. It could also be used to
improve assumptions made about where other fuels (e.g. Coal, Oil and LPG) are
used.
Further details on the excluded large gas users, such as the names of the
operators, would also be useful to improve the Netcen assumptions about which
LA and Regional CO2 2003 – Issue 1
AEA Technology 34
sites these represent. Improvements to this dataset rely on DTI and the gas
distribution companies willingness to collect and provide good quality data. The
mechanisms for data collection are there (billing information) but the collation
and checking responsibilities still need to be arranged. Incorporation of more
detailed gas consumption into the inventory will be relatively simple and as the
data will be re-aggregated to Local Authority levels again there will be no
confidentiality issues.
Electricity Consumption Data
DTI are still working to improve their electricity consumption data, to reduce the
amount that is currently unallocated to LAs. A revised dataset could be included
in an update of this work.
Estimates of Electricity use in by LA in NI would improve the estimates there,
instead of using population and employment distributions. In addition a revised
2003 as well as a new 2004 dataset would help the time series consistency of any
future datasets. Any improved datasets could easily be incorporated into the
existing methodology.
EU-ETS emissions trading scheme.
Currently Defra and the Environment Agency compile a detailed dataset of
industry fuel consumption as part of the EU-ETS (emissions trading scheme).
Unfortunately, we are unable to obtain access to this dataset, which would greatly
enhance the accuracy and reliability of our regional fuel consumption data.
Having access to this dataset would allow us to far more accurately predict what
fuel types are being burnt at precise locations together with the volume of fuel
being consumed. Currently this data is not held in a centralised dataset although
it is reported by companies in their monitoring and reporting submissions to the
Environment Agency. Collation and incorporation in the NAEI would require
significant resources initially to set up a suitable data flow and DUKES
reconciliation system. However, the national greenhouse inventory would benefit
from this inclusion in future inventories.
Pollution Inventory Reporting of fuel use and activities
The reporting of fuel use by fuel type by installation to the Environment Agencies
Pollution Inventory would improve our understanding of fuels burned in large
installations. This data would overlap with some of the EUETS data but would
provide a valuable cross check and fill gaps for installations not included in the
EUETS. It is not clear if the Environment Agency have the authority to demand
this data under IPPC or EPER. However, it is acknowledged that there is a need
for this data within the EA for benchmarking and assessing reporting compliance.
It is unlikely that reported activity data would be in the public domain so its use
would need to be monitored carefully. As with the EU-ETS data a significant
resource effort would initially be required to incorporate this data in the UK
inventory. However the benefits for Air Quality modelling and UK total emission
estimates would be significant as it would enable improved calculation of large
and small process emissions.
Domestic mapping improvements (Non Gas Fuels)
The mapping of domestic fuel use in Great Britain needs to be updated for the
2004 inventory. This should include an update of the Experian data and/or
investigation into improved data sources such as the EST Home Energy Efficiency
Database, new gas consumption data from DTI and improvements to the

LA and Regional CO2 2003 – Issue 1
AEA Technology 35
locations of Smoke Control Areas. The important and difficult areas include liquid
and solid fuel use as there is very little data on where these fuels are consumed.
Further surveys similar to those done in Northern Ireland, reporting by
distributors or additions of questions in future Census activities (on the type and
quantity of fuels burned) would provide useful insight into the locations of solid
and liquid fuel consumption in the UK. Targeted surveys or research into likely
fuel types and quantities burned where gas supply is limited might provide
improved spatial estimates. Improved spatial detail of gas supply data itself
would also help to identify specific locations burning solid and liquid fuels where
gas supply is absent. Improvements in this area are likely to be relatively costly
requiring surveys or the development of additional reporting requirements for
suppliers of solid and liquid fuels. DTI will have a leading role in future
developments of Local Authority solid and liquid consumption data. Rural and
semi areas are most likely to see improvements in data quality from this work.
Small industrial commercial and public service improvements (Non Gas
Fuels)
As with domestic fuel use mapping the areas of highest uncertainty are solid and
liquid fuel use. It is unlikely that this data will be captured by either the CCA or
the EUETS and is currently derived from employment data and inverse gas use
modelling. Improved gas use spatial detail would enable the identification of
areas where gas is not burned and other fuel consumption should be allocated.
Further research into fuel preferences for different commercial and industrial
sectors where gas is unavailable should be undertaken through DTI DUKES data
collection channels. It is likely that these choices will often depend on the age of
the installation and the most viable fuel at the time of construction. While this
dataset would offer significant improvements to rural and urban area estimates,
It is difficult to see exactly how the data could be collected and reconciled with
the Larger reporting installations. User fuel use reporting for non gas users or
improved distributor reporting would help to pinpoint areas of solid and liquid fuel
use and improve the allocations to NUTS 4 areas. Collation and interpretation of
data will be difficult and time consuming.
5.2 Other Improvements
Calculation of a historic base year.
It may be worth considering calculation of a historic base year (either 1990 or
2000) to enable emission reduction achievements to be assessed. Although 1990
is the base year for the UK and an obvious choice for Regional and Local Authority
estimates there is limited spatial data available for a consistent comparison with
later years. It may therefore be more sensible to consider 2000 as a base year
for Local and Regional estimates. Even for 2000 the availability of core datasets
such as electricity and gas consumption is limited and will need to be derived.
This will require resources and time to deliver and may not provide a comparable
base year.
Extending the Scope of the Estimates:
It may be attractive to extend the scope of this work in the future to include the
additional GHG pollutants so that the basket of 6 GHG’s can be calculated. This is
possible using the same methodology as for CO2. However, the estimates will be
more uncertain as many important sectors for the non CO2 gases do not have as
robust spatial distributions or emission factors (e.g. the use of refrigerants,
agricultural fertilizer use and emission factors for N2O from vehicles). Extending

LA and Regional CO2 2003 – Issue 1
AEA Technology 36
the scope of pollutants will require additional resources in order to distribute the
emission sources for agriculture and land use for CH4 and N2O. Additional effort
will also be required to allocate F-gas emissions from refrigeration and air
conditioning units.
Extensions to include other end user allocations or the “footprint” approach (e.g.
from the emissions from refineries and cement plant to the consumers of their
products to the total carbon cost of consumables use in different Local Authorities
and Regions) should be explored as this can give a more complete picture of
global emission reduction impacts of Locally taken actions. This work could start
with a scoping study to investigate current footprint methodologies and how they
could incorporate better emissions data.
Incorporation of renewable use and efficiency actions
Future work to include data on existing efficiency improvements and domestic
level renewable use (e.g. CHP, solar, wind and geothermal) would improve the
usefulness of the data to Local and Regional Governments. Some improvements
to the distribution of emissions could be made through incorporation of any
spatial Clear Skies, the Home Energy Efficiency Database and HECA data. In
addition the incorporation of the effects of the UK’s CHP programme should be
investigated and incorporated. As scoping study to look at the available data
sources would provide a starting point to assess the technicalities of incorporating
and disseminating Local Energy efficiency data.
Road Transport improvements
A number of improvements could be made to the road transport estimates
including:
Improve assumptions on mileage of petrol and diesel vehicles using
available DfT data. This would be a relatively minor activity for netcen and
DfT to assess the available data and agree new assumptions.
Improved availability of minor road traffic counts from the DfT census.
This could be achieved through the incorporation of more local traffic
survey data collected from county councils traffic departments and
incorporated in the DfT AADF dataset.
Estimation of emissions relevant to residents travel allocated to Regions
and Local Authorities. This could be done using National Travel Survey
data. This would require some research into data sources and methods
and consultation with stakeholders. A small scoping study could assess
available data and views and propose a method to be followed.
Rail mapping improvements
The inclusion of the diesel rail network for Northern Ireland would provide a
complete estimate for this sector. In addition the kilometres travelled on the
railway network in Great Britain are in need of updating as is a means of
providing a split between electric and diesel vehicle km. This information is likely
to be available from Network Rail. The development of a national rail map
including vehicle km, passenger km and diesel/electric splits would be extremely

LA and Regional CO2 2003 – Issue 1
AEA Technology 37
useful for energy use assessments, emissions assessments and modal transport
studies. Some data is available from rail maintenance databases held by rail
industry contractors. Rail timetables could also provide data on rail traffic
density. London have been investigating several data sources and improved
methods recently. This approach could be built on relatively easily for the UK as
a whole assuming that the data is available at a reasonable price.
Further improvements could be achieved through analysis of Sustainable Travel
Development Towns programme pilots data.
Finally, the inclusion of diesel rail network for NI would provide a complete
estimate for this sector.
Off road spatial distributions of fuel use
Further work is required to improve the fuel consumption allocation for the off
road sector. This sector includes house and garden machinery, Agricultural and
forestry machinery, air support vehicles, road maintenance vehicles and
construction vehicles. All are assumed to consume non road fuels (i.e. red diesel
for agriculture). Supply/Distribution information for these data are not available
and current methods use assumptions linked to employment data. This leads to
some significant miss allocations as many of these activities take place well away
from registered employment locations (e.g. construction). Improved
distribution/supply information from suppliers or consumers would help to provide
a more spatially accurate estimate.
Land use Change and Forestry
The NAEI has recently received (since the drafting of this report) spatially
disaggregated emissions data from CEH on emissions from Agricultural soils,
Deforestation, Natural CO2 emissions from soils and other land use change
emissions. This data is currently only on a 20x20km grid and therefore is difficult
to assign to Local Authorities. This will be included in the 2004 inventory maps.

LA and Regional CO2 2003 – Issue 1
AEA Technology 38
References
Business Geographics (2001) LIFE Sectors database at postcode sector level
based on Experian Consumer Surveys.
DTI (2004a) Energy Trends December 2004
www.dti.gov.uk/energy/inform/energy_trends/dec_04.pdf
DTI (2004b) Digest of UK Energy Statistics
DTI (not dated) Energy Consumption in the UK,
www.dti.gov.uk/energy/inform/energy_consumption/ecuk.pdf
DTI, 2005a Energy Trends March 2005
www.dti.gov.uk/energy/inform/energy_trends/mar_04.pdf
DTI 2005b Energy Trends June 2005
www.dti.gov.uk/energy/inform/energy_trends/jun_04.pdf
Goodwin, J., Hobson, M., King, K, Murrells, T. And Sturman, J. (2005)
Development of regional estimates of fuel consumption by the road
transport sector – Stage 2. Netcen report number AEAT / ENV / R / 1880.
Janes pers comm. Email communication regarding allocation of railway electricity
use within the DTI Local Authority Electricity Consumption dataset, July
2005.
Moynihan, S. (2004) Personal Communication to Glen Thistlethwaite in Netcen:
Sean Moynihan, Phoenix Gas, September 2004.
NAEI Devolved Administrations Emission Inventory 2003, Compiled by Netcen,
2005.
NAEI UK Emissions Inventory 2003, Compiled by Netcen, 2005.
Pye, S. and Vincent, K. (2003) Determining the impact of domestic solid fuel
burning on concentrations of PAHs and sulphur dioxide in Northern Ireland,
A report produced for the Department for Environment, Food and Rural
Affairs; the Scottish Executive; the National Assembly for Wales and the
Department of the Environment in Northern Ireland, AEAT/ENV/R/1498.

LA and Regional CO2 2003 – Issue 1
AEA Technology 39
Annex 1 Site Specific Fuel Use Estimates
Site specific fuel consumption estimates have been made many of the large
energy users in the UK. The approach used varies according to sector.
Power stations
Fuel usage estimates have previously been made for the GHGI and the UK’s
National Atmospheric Emissions Inventory (NAEI). These estimates are based on
public fuel consumption data provided by process operators in their
environmental reports, although some gaps in the data must be filled by
extrapolation from other data sets (such as earlier fuel use, electricity generating
capacity data or emissions data). The overall fuel consumption for each fuel type
is consistent with data given by DUKES for major power producers with the
exception of consumption of fuel oil. In the case of this fuel, data available from
process operators suggests that the consumption figure given in DUKES for major
power producers is too low. The GHGI/NAEI and the fuel usage estimates are
based on the higher fuel consumption available from process operators.
Consistency with overall fuel oil consumption given by DUKES is maintained by
assuming that DUKES’ data for industrial fuel oil consumption is overestimated by
an amount equal to the underestimation of fuel oil use by major power producers.
Other combustion processes regulated under IPC
Plant burning fuels in boilers, furnaces or gas turbines with an aggregate net
rated thermal input of 50 MW or more are regulated under IPC. Some of these
plant are power stations and a description of the method used to estimate fuel
usage has already been given. The remaining plant are either industrial plant
(including autogenerators) or commercial/public sector boiler plant. Fuel usage
at these plant have been estimated based on CO2 emissions data reported to
regulators (e.g. in the Pollution Inventory in the case of plant in England or
Wales). The CO2 emissions have been converted into fuel usage estimates using
CO2 emission factors for fuel combustion taken from the GHGI, i.e.
Fuel consumption = CO2 emission / carbon emission per unit of fuel burnt
In order to perform this calculation, it is necessary to make assumptions about
the fuel or fuels burnt at each site. This has been done based on Netcen
knowledge of fuels burnt by specific processes or, where this is not available, on
information on fuel types for specific sites given in IPC authorisation documents
(which date mainly from the early 1990s).
In a small number of cases, authorisation documents are not available and, in
some other cases, the fuel types given in authorisation documents are not
consistent with recent emissions data reported in the Pollution Inventory. For
example, some authorisation documents state that coal or fuel oil is burnt by a
combustion plant, yet the Pollution Inventory does not report for that plant any
recent emissions of pollutants such as sulphur dioxide or metals which would be
characteristic of these fuels. In all of these cases, Netcen has made an estimate
of the fuel types burnt at these plant based on factors such as the presence or
absence of emissions of characteristic pollutants, or the nature of the process
being carried out. For example, no authorisation document is available for one
site operated by Transco, but it is assumed that the fuel will be natural gas. In
some cases, such as the example just given, the fuel types can be deduced with

LA and Regional CO2 2003 – Issue 1
AEA Technology 40
some confidence, while in other cases the allocation of fuels is much more
uncertain.
Refineries
Refinery fuel usage is based on fuel consumption data given in DUKES, with fuel
allocated to each refinery on the basis of capacity data. This is consistent with
current NAEI/GHGI practice, although it should be noted that this may not be
very accurate. Capacity gives a broad indication of the scale of operations at
each refinery, whereas fuel consumption will depend upon factors such as the
feedstock, products made, the types of unit operation carried out, and the design
of those units.
Integrated steelworks
Using a consistent methodology to that in the NAEI fuel usage estimates for
sintering and blast furnaces are based on fuel consumption data given in DUKES,
with fuel allocated to each site on the basis of total CO2 emissions reported for
that site by Corus UK Ltd (operator of all three sites).
Coke ovens
Fuel usage estimates for coke ovens are based on fuel consumption data given in
DUKES, with fuel allocated to each site on the basis of total CO2 emissions
reported for that site in the Pollution Inventory.
Cement clinker production
Fuel usage estimates for cement kilns are based on GHGI/NAEI estimates of
sector fuel usage and are allocated to each site on the basis of clinker capacity.
This is consistent with current NAEI/GHGI practice, although a number of issues
should be highlighted:
Recent DUKES coal consumption data for the ‘mineral products’ industry
sector (which includes clinker production) are much lower than expected
by Netcen. Therefore, the NAEI/GHGI estimates include some combustion
of natural gas in order to maintain consistency with both Netcen estimates
of energy required by the cement industry and overall fuel usage data
from DUKES. In reality, cement kilns do not burn natural gas.
Ratios of fuel consumption to clinker production will vary from site to site
largely depending upon whether the process is ‘dry’ (generally least
energy-intensive), ‘semi-dry’, ‘semi-wet’, or ‘wet’ (generally most energy-
intensive). So fuel consumption will tend to be overestimated for sites
using the dry process and underestimated for sites using the wet process.
Lime production
Fuel usage estimates for lime kilns are based on GHGI/NAEI estimates of sector
fuel usage. Coal, coke, and natural gas are burnt, with each lime kiln using only
one of these fuels. The fuels are therefore allocated to each site burning the
appropriate fuel based on site capacity.
Other plant regulated under IPC
A number of processes are regulated under IPC as either metal industry
processes or chemical industry processes but which involve in part the use of
fossil fuels. Estimates of fuel consumption are made in a manner similar to that
used for combustion processes regulated under IPC (see above).

LA and Regional CO2 2003 – Issue 1
AEA Technology 41
As with combustion processes, the allocation of fuels to some sites is subject to
more uncertainty than in other cases.
Combustion processes included in the UK NAP
The UK NAP includes details of combustion processes which are participating in
the EU ETS, including annual allocations of CO2. Some of these processes are
also covered by one of the other categories dealt with above, and these processes
have been ignored. The CO2 allocations for the remaining processes have been
used as the basis of fuel use estimates. The procedure was as follows:
1. The total quantity of fuel usage estimated for IPC combustion processes,
cement kilns, lime kilns, and other IPC processes was calculated.
2. The difference between total fuel usage for the
industrial/commercial/public sectors given by DUKES and that calculated
as 1) above was calculated.
3. The fuel calculated as 2) above was then allocated to individual industrial
sectors and to the commercial/public sector proportionately to that
sectors’ share of the total consumption of fuel. This yielded a fuel usage
profile for each sector i.e. the proportion of energy for the sector supplied
by each of coal, fuel oil, gas oil and natural gas.
4. The CO2 allocations for each NAP site were converted into fuel usage
estimates using the fuel usage profile for the appropriate sectors and CO2
emission factors taken from the GHGI.
This approach was slightly modified for glass furnaces, where the sector fuel
usage profile was considered likely to give less accurate results than if a 50/50
split of gas oil to natural gas use was assumed instead.